all transients in sector92 (53 total)
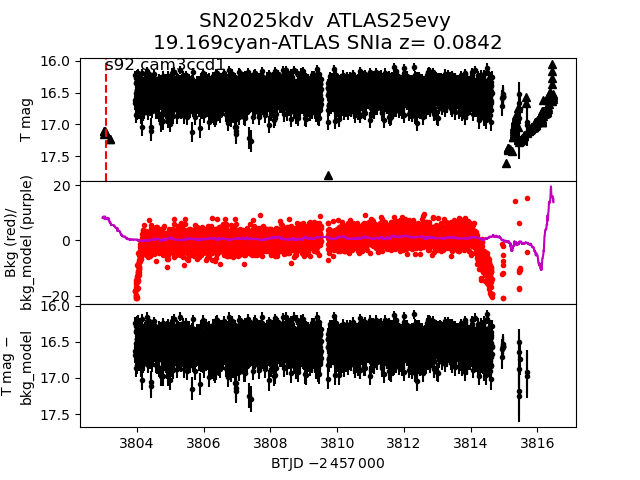
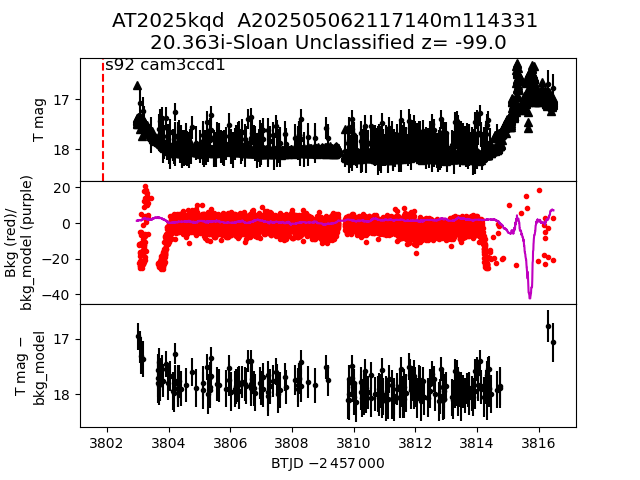
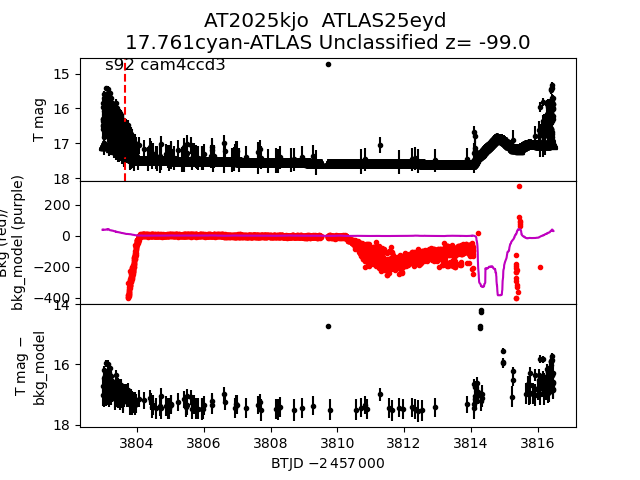
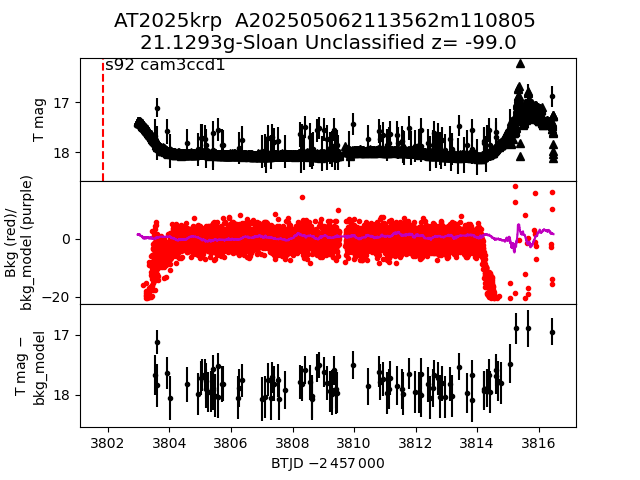
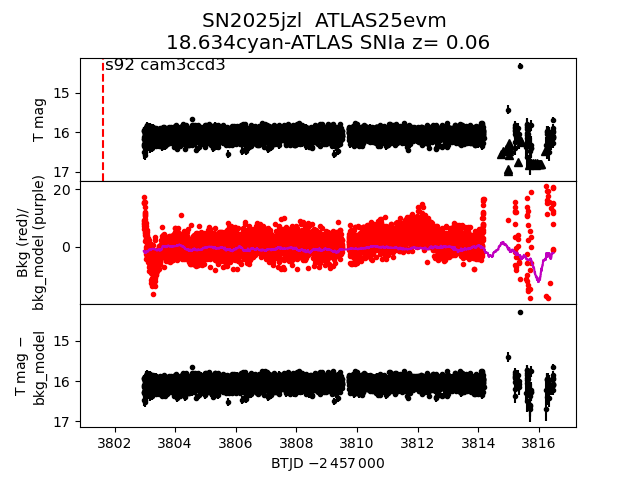
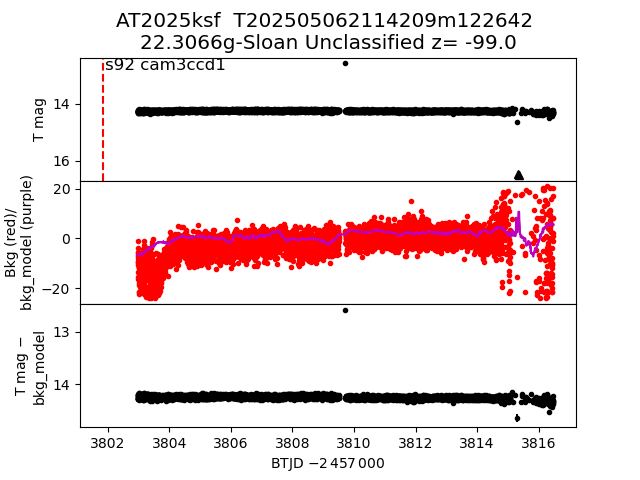
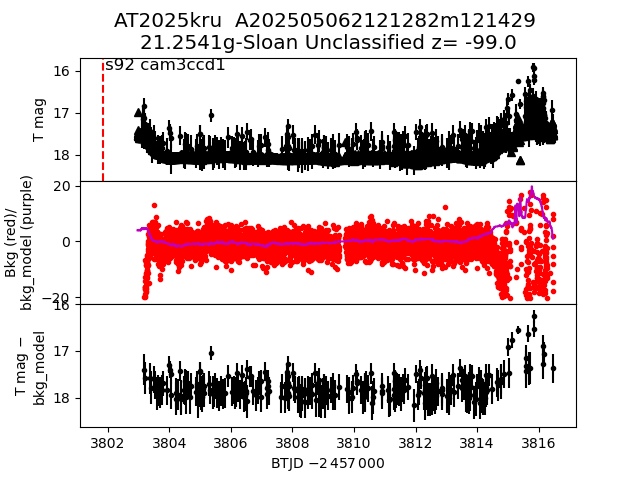
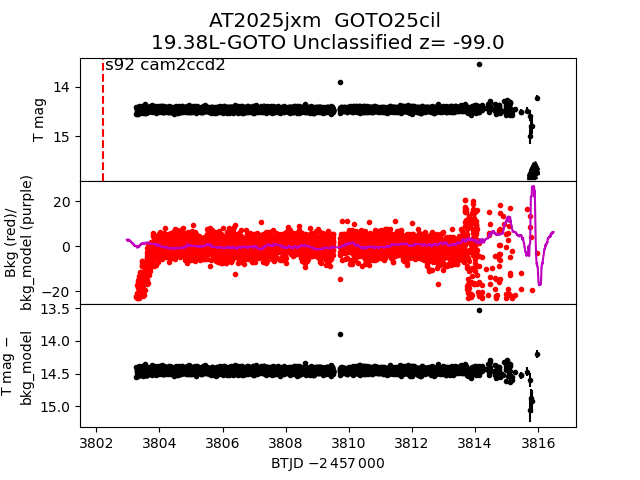
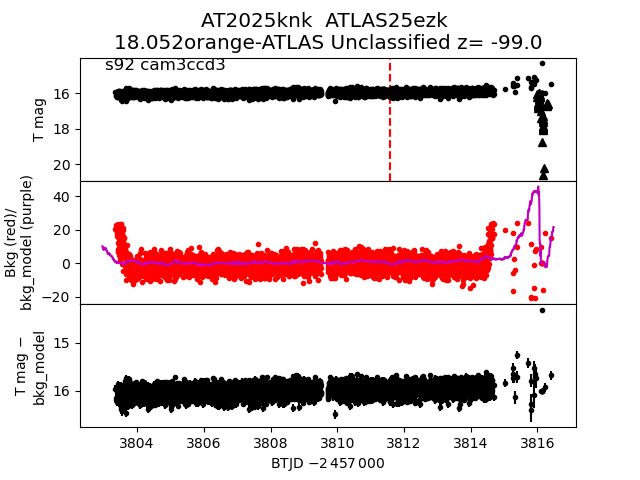
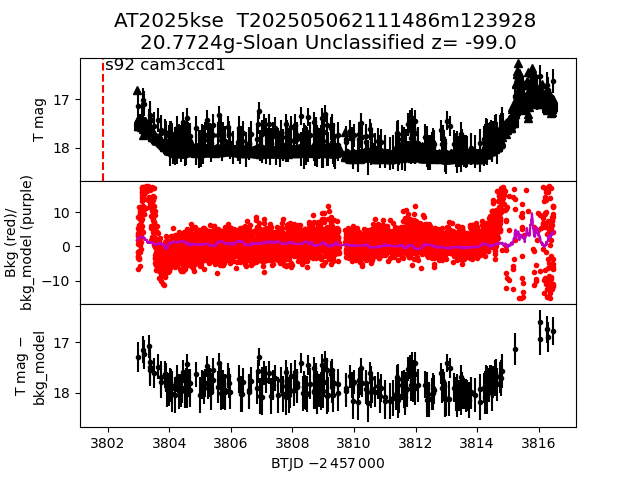
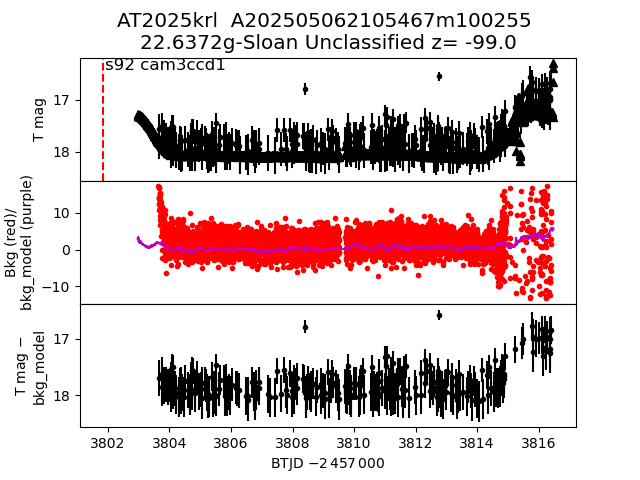
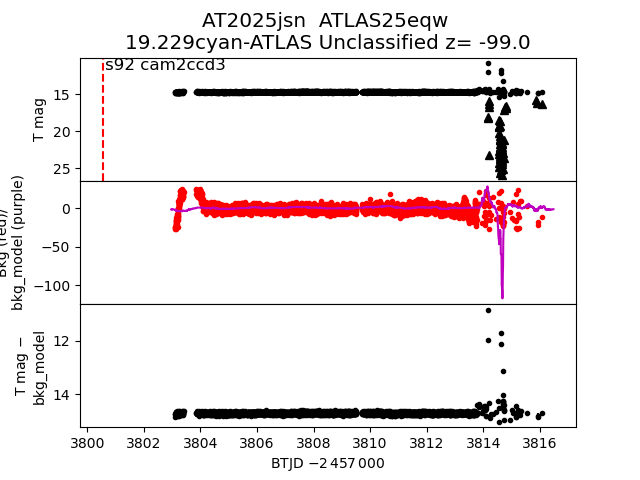
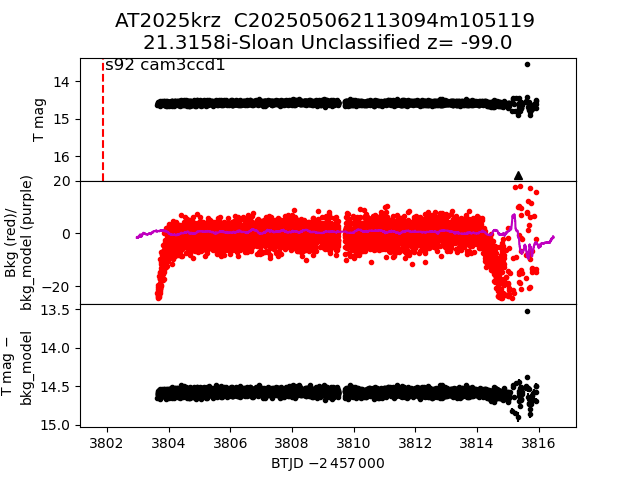
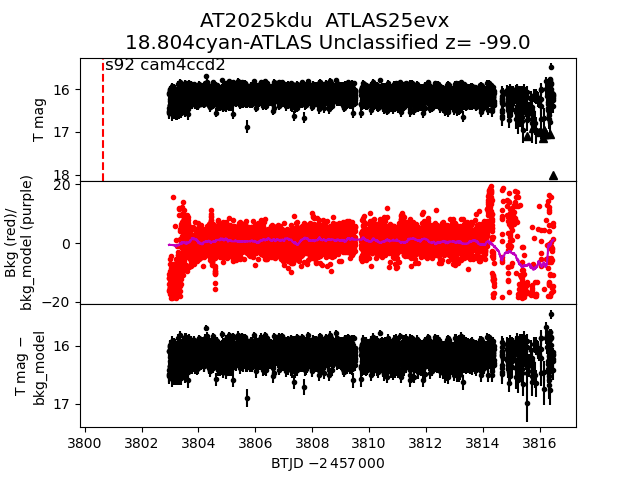
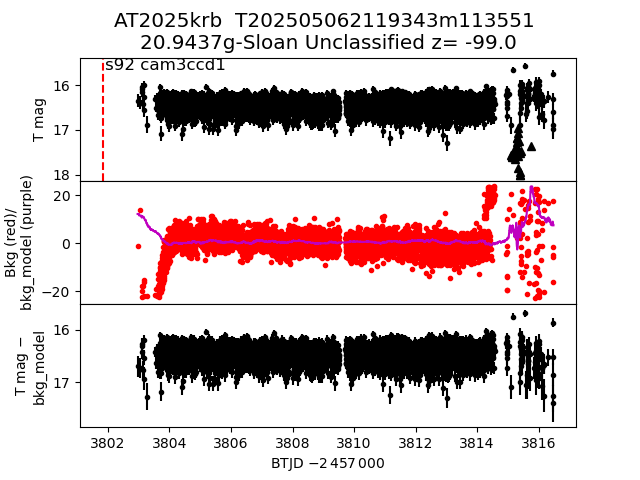
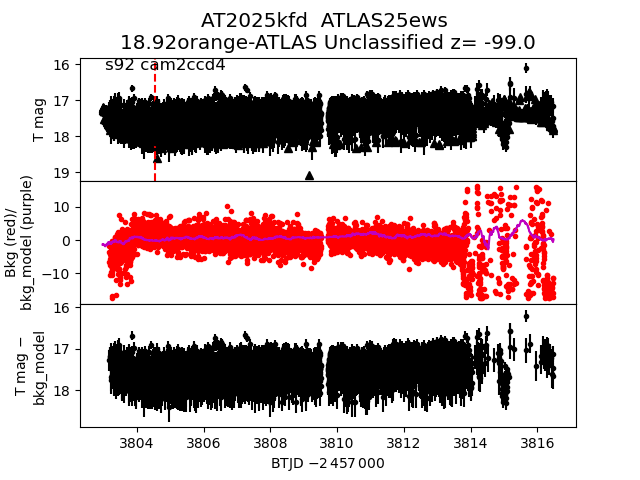
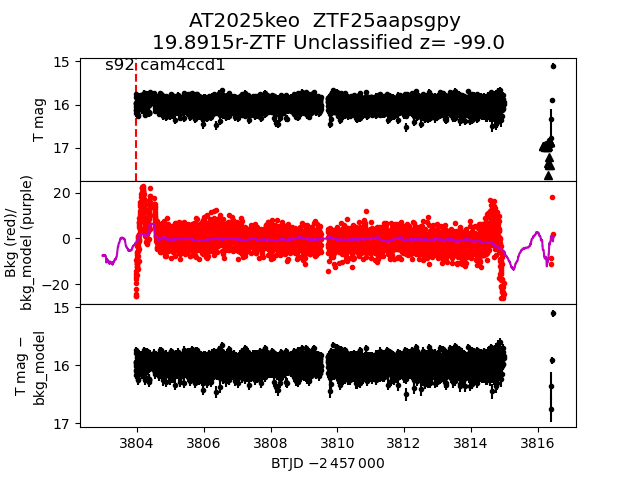
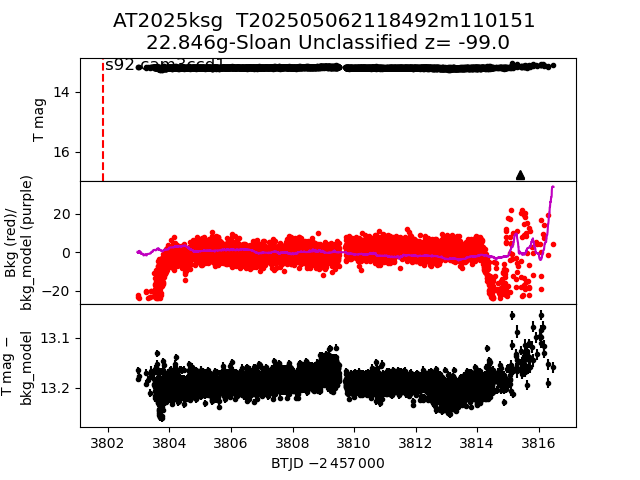
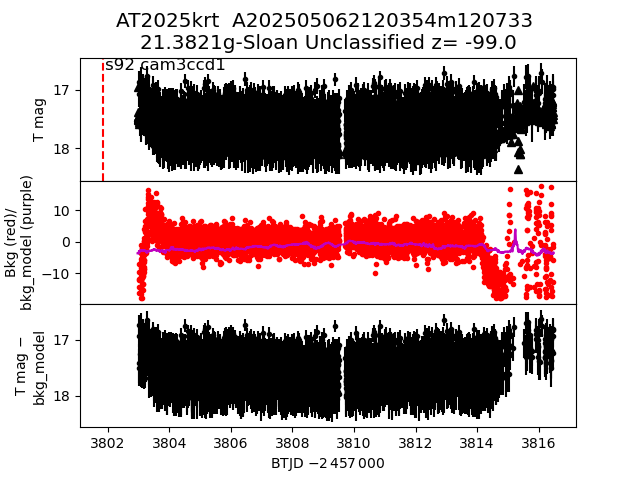
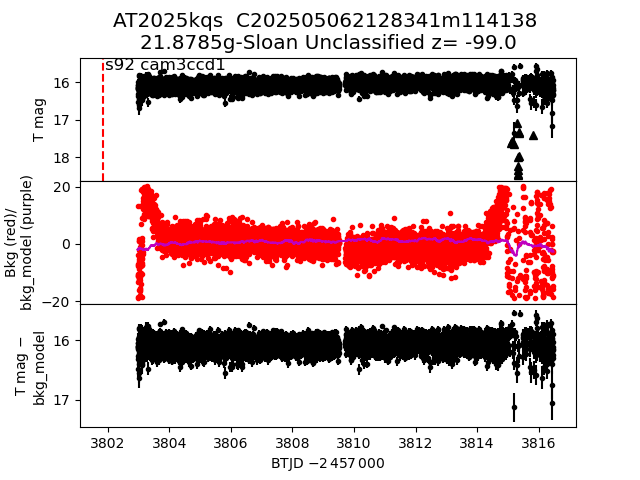
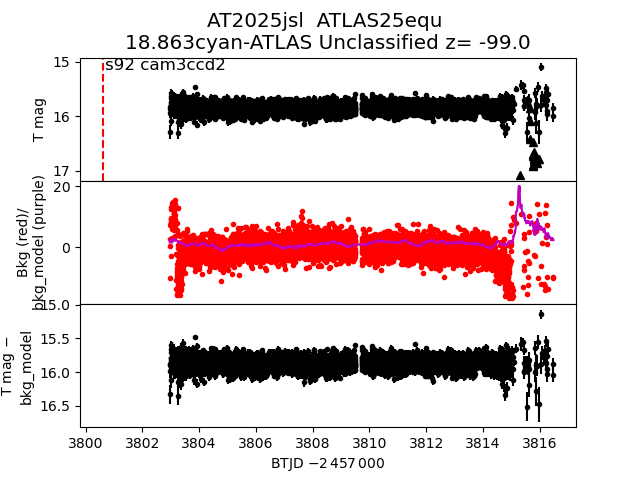
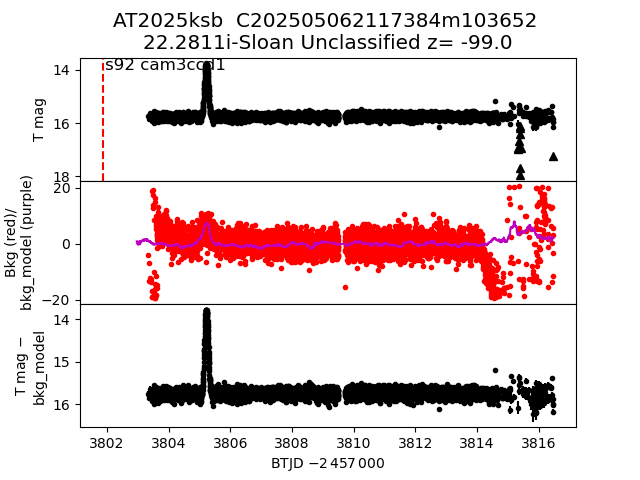
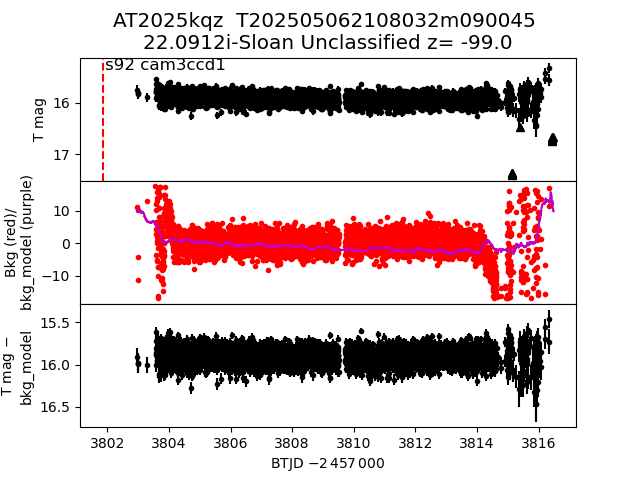
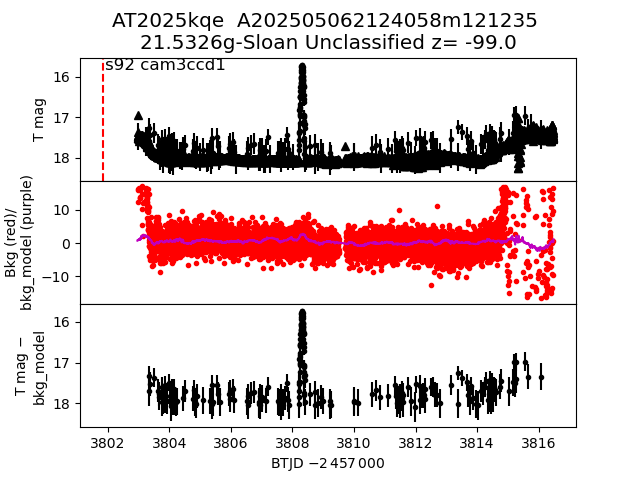
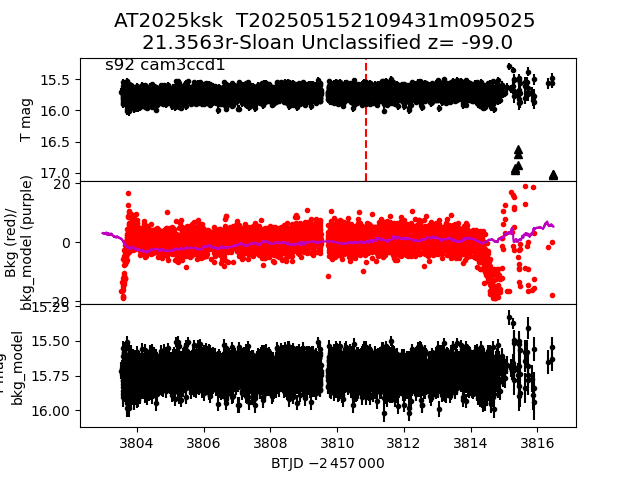
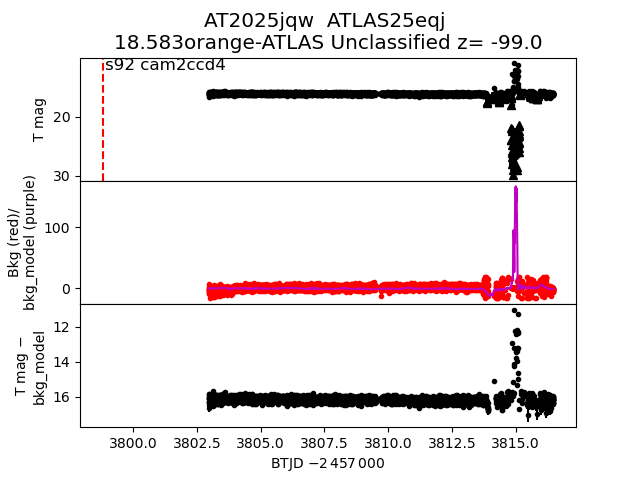
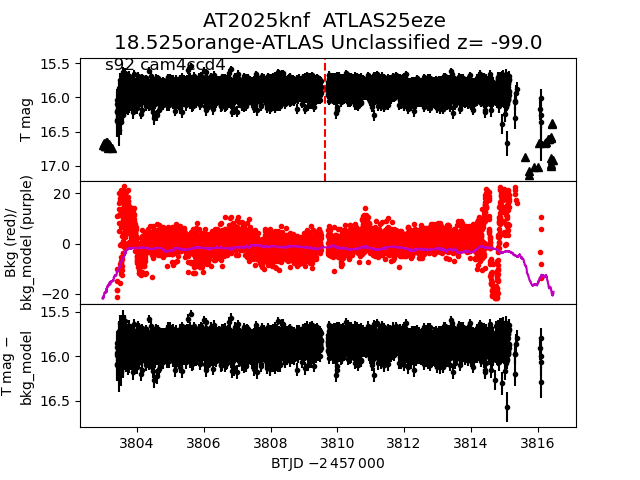
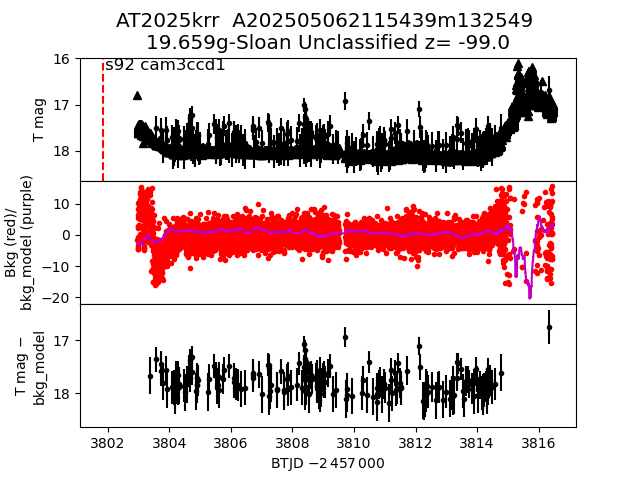
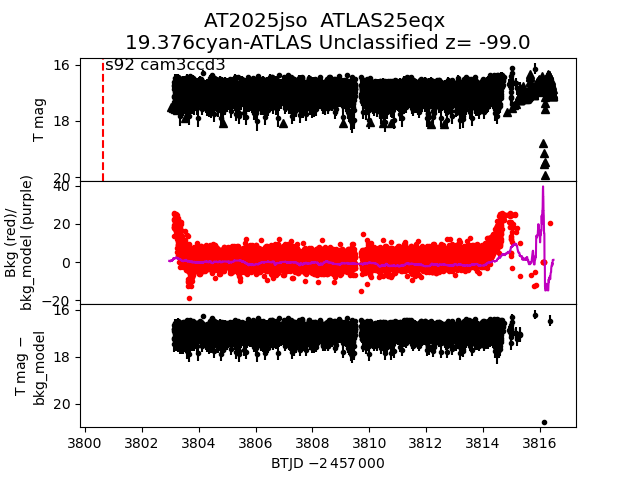
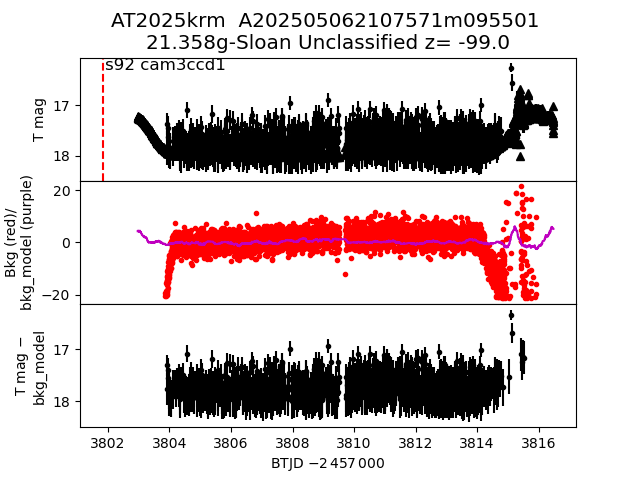
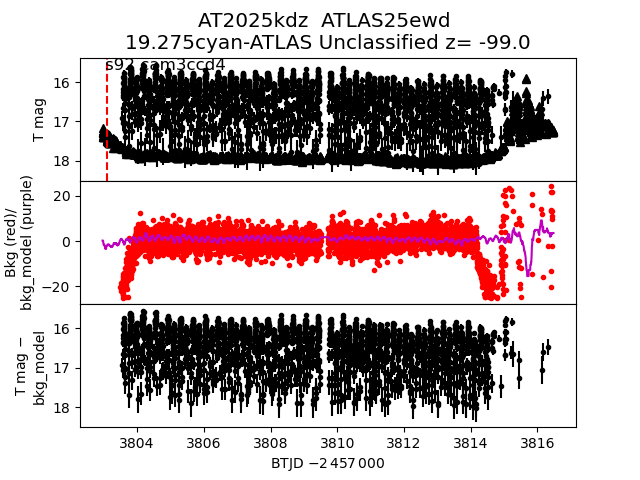
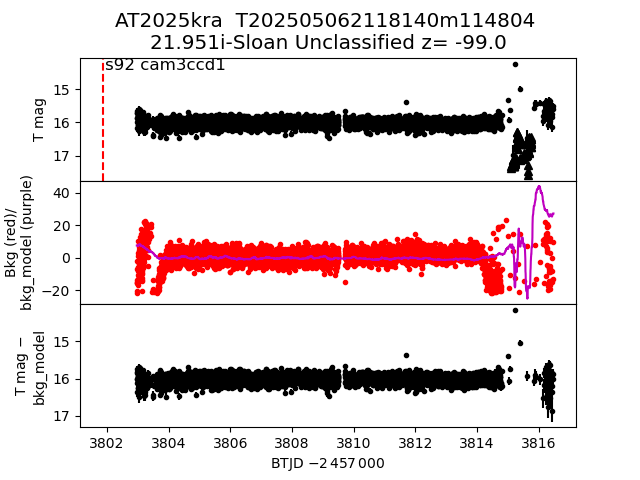
Each figure has three panels. The top panel shows the transient light curve, the middle panel shows the local background (estimated in an annulus), and the bottom panel shows a "background-model corrected" light curve. Details about the background model are in the README.
The vertical red line marks the time of discovery reported to TNS. Other useful metadata from TNS is in the figure title.
Note that the top and bottom panel are in magnitudes, while the middle panel is in differential flux units. The magnitudes are calibrated to the flux in the reference image used for image subtraction. Thus, flux from the host galaxy is included in these magnitudes.
3-sigma upper limits are plotted as triangles with no errorbars. A typical limiting magnitude is 19.6 in 30 minutes or 18.4 in 200 seconds (for low backgrounds).
The links allow you to download the light curve data as a text file.
More details in the README.
2025kqd
 2025kjo
 2025krp
 2025jzl
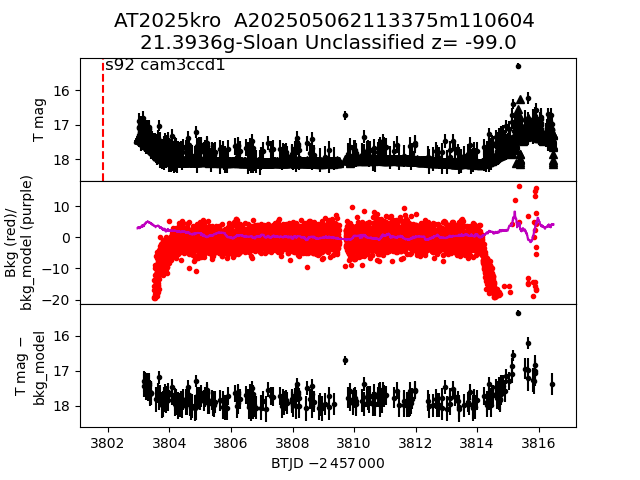
 2025kro
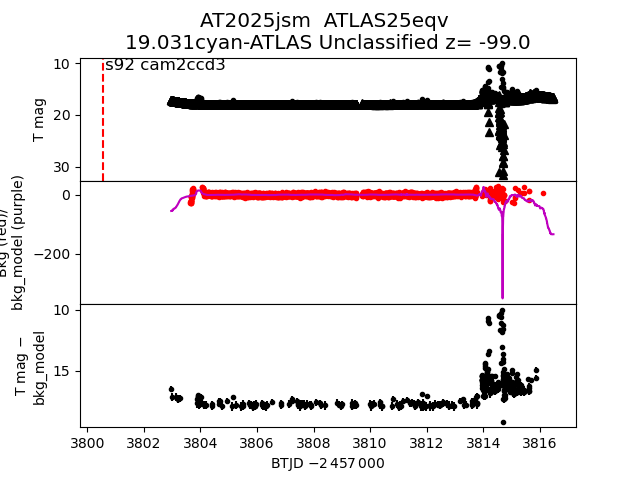
 2025jsm
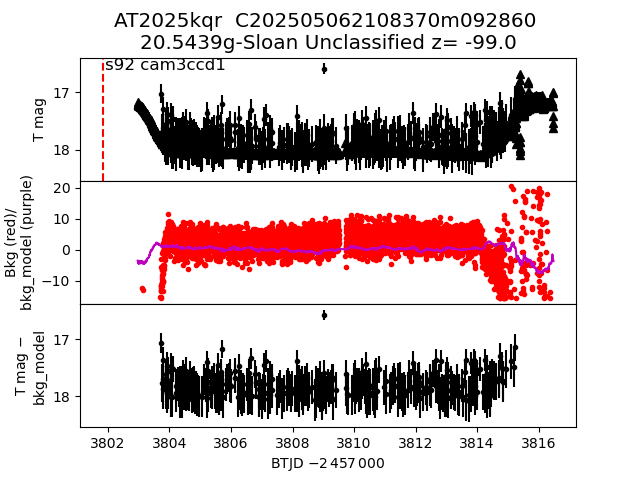
 2025kqr
 2025ksf
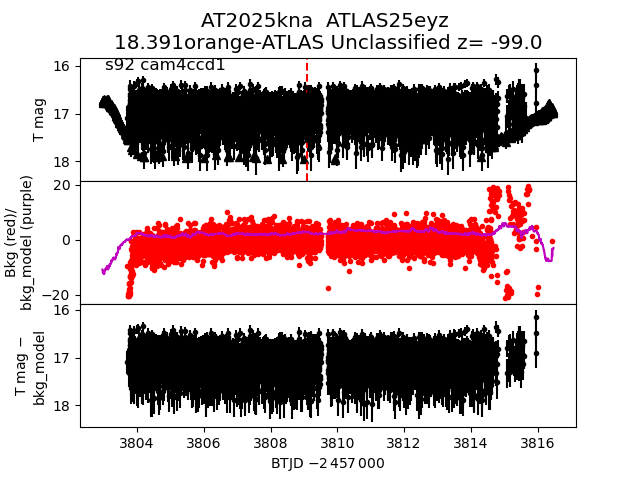
 2025kna
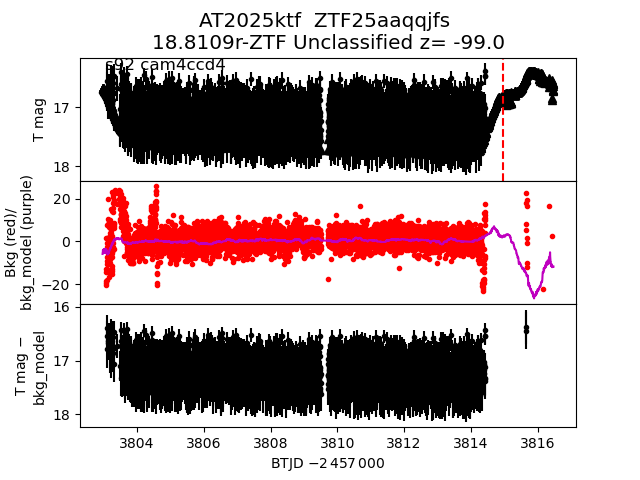
 2025ktf
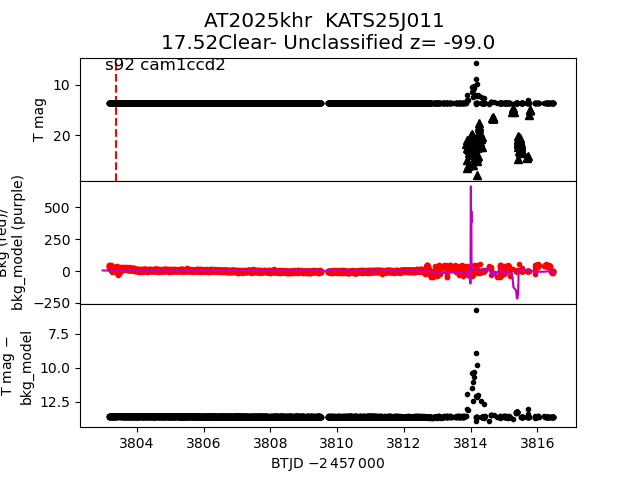
 2025khr
 2025kru
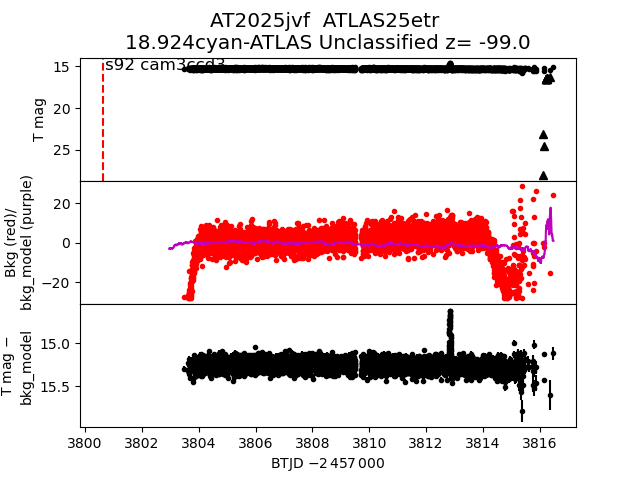
 2025jvf
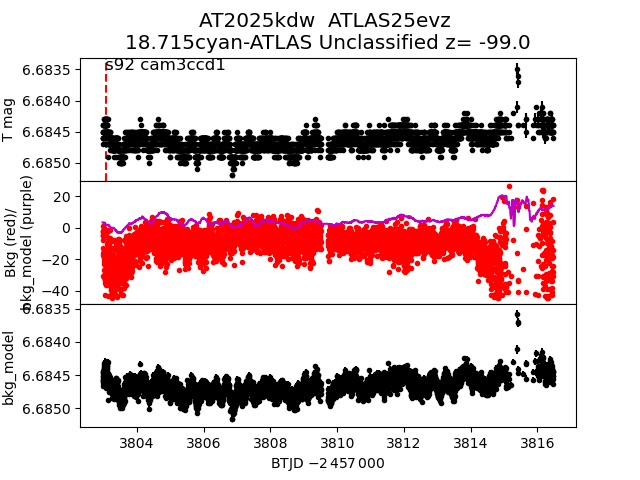
 2025kdw
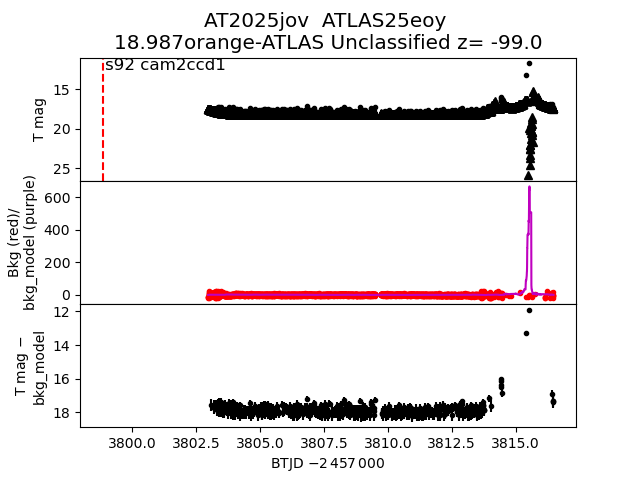
 2025jov
 2025jxm
 2025knk
 2025kse
 2025krl
 2025jsn
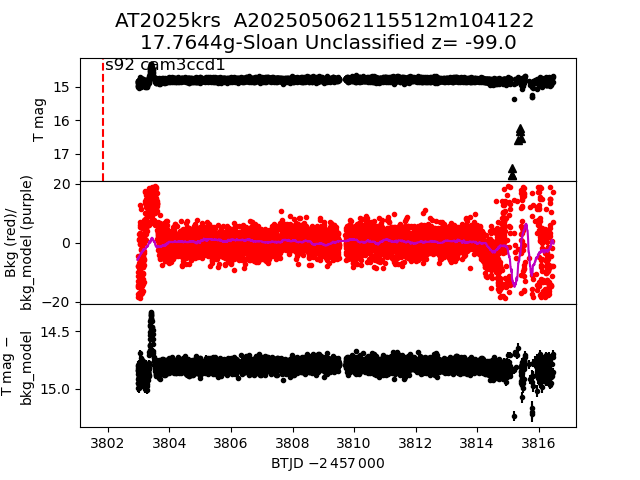
 2025krs
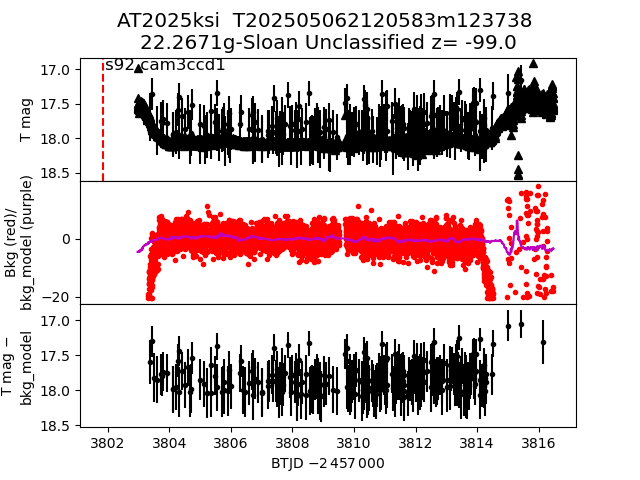
 2025ksi
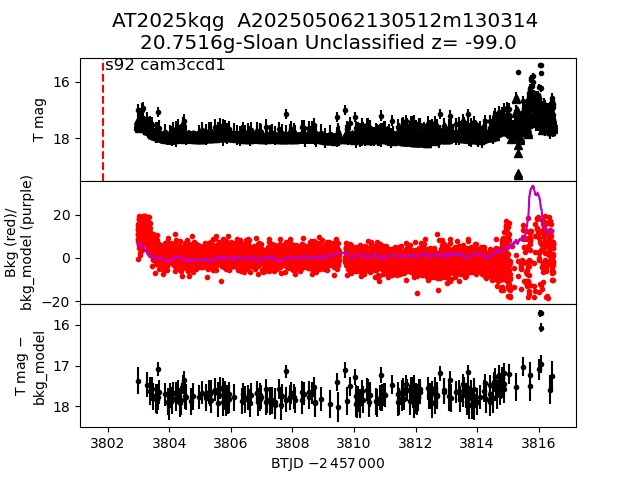
 2025kqg
 2025krz
 2025kdu
 2025krb
 2025kfd
 2025keo
 2025ksg
 2025krt
 2025kqs
 2025jsl
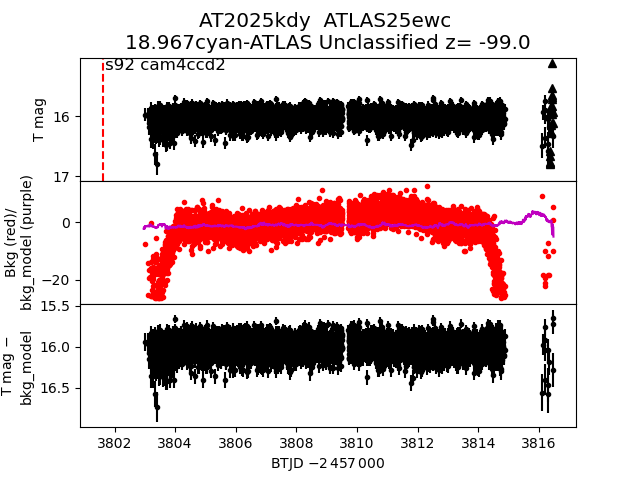
 2025kdy
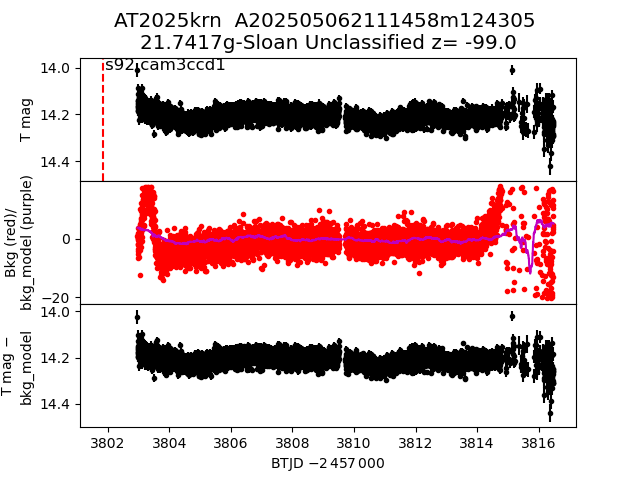
 2025krn
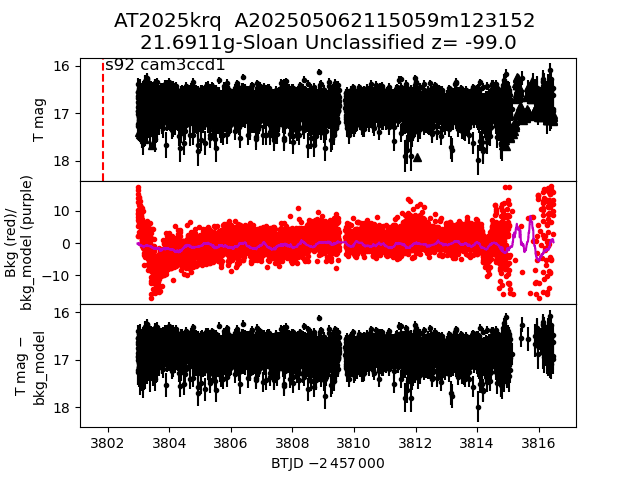
 2025krq
 2025ksb
 2025kqz
 2025kqe
 2025ksk
 2025jqw
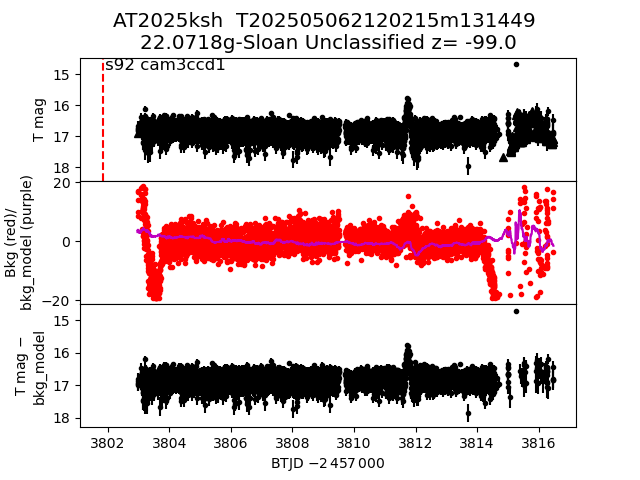
 2025ksh
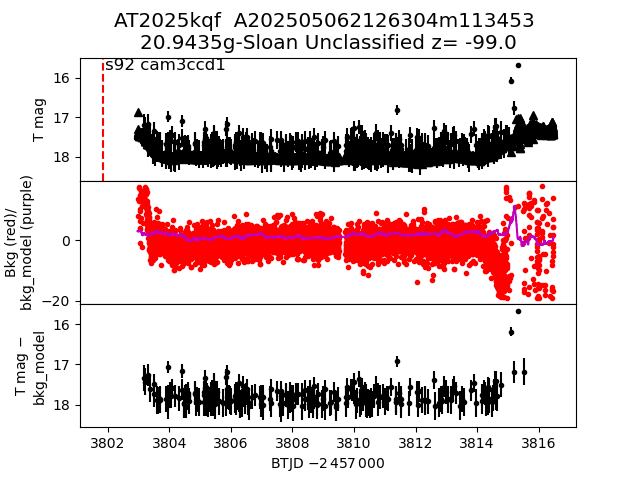
 2025kqf
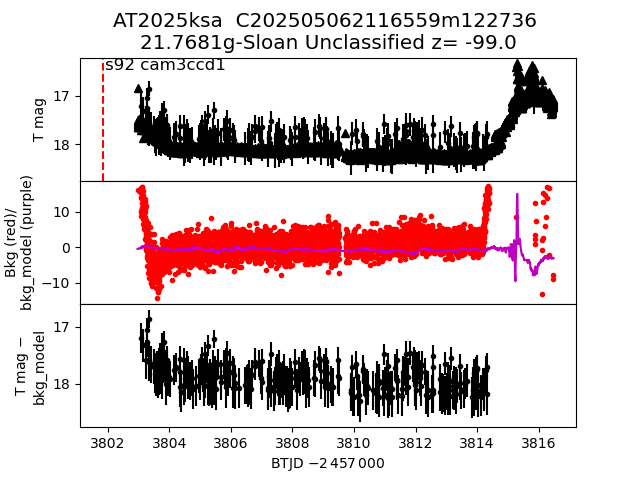
 2025ksa
 2025knf
 2025krr
 2025jso
 2025krm
 2025kdz
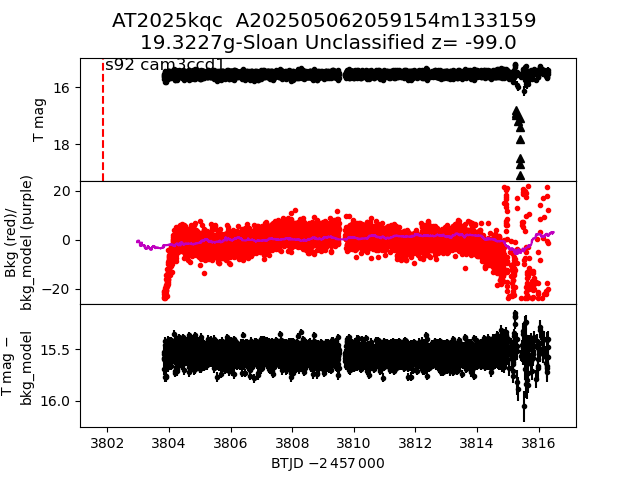
 2025kqc
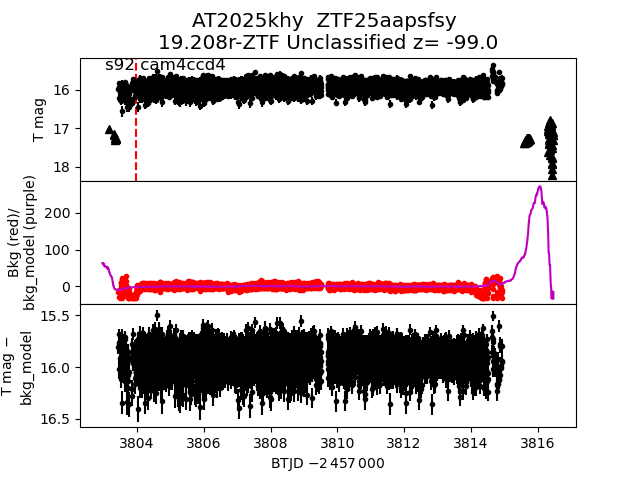
 2025khy
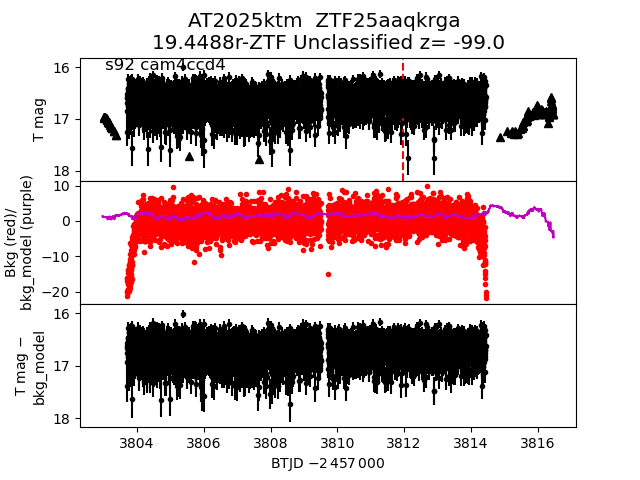
 2025ktm
 2025kra
 2025kdv