all transients in sector90 (93 total)
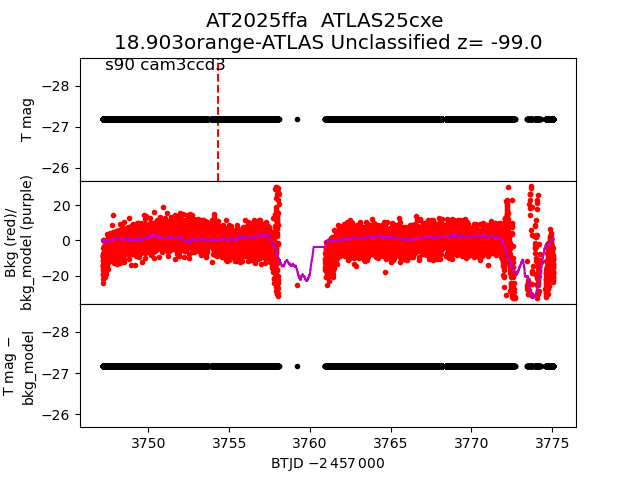
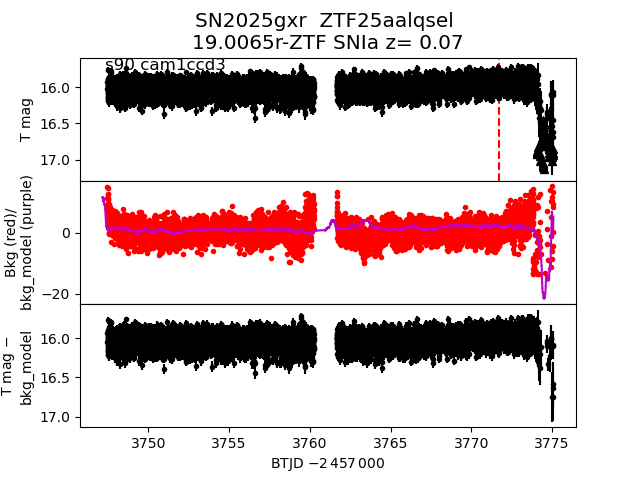
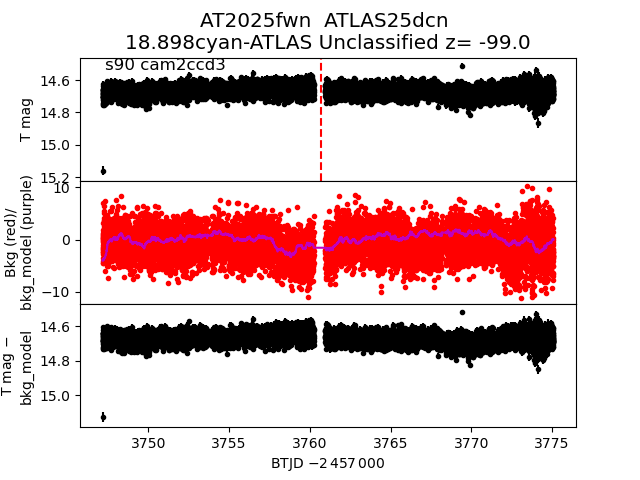
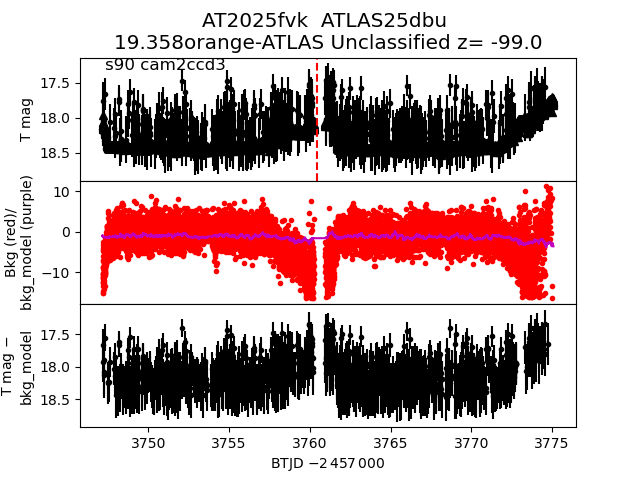
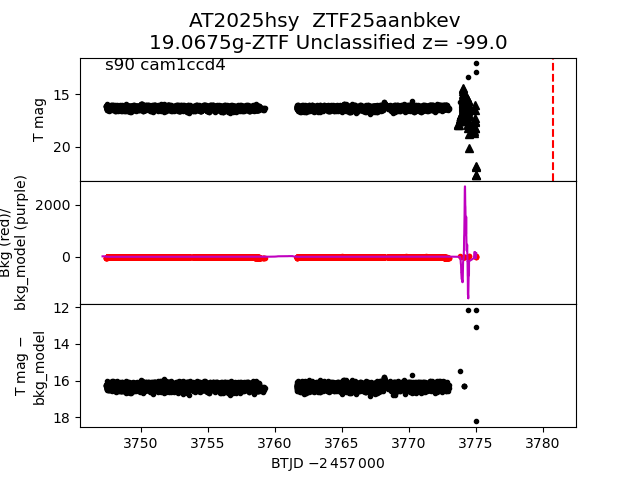
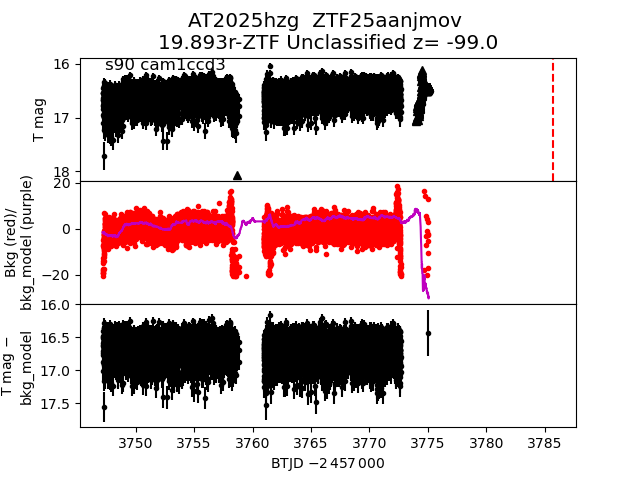
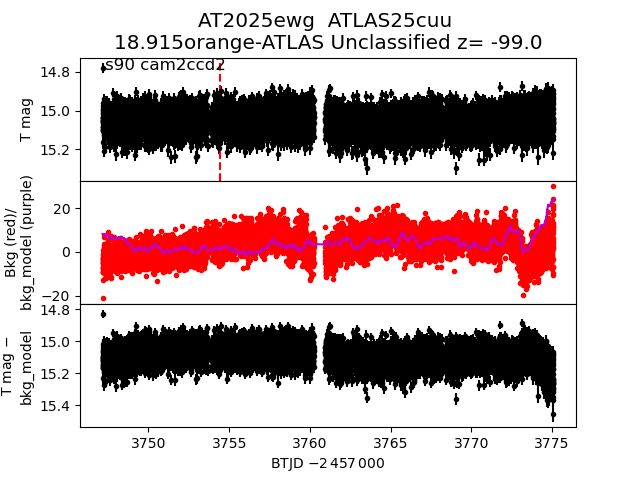
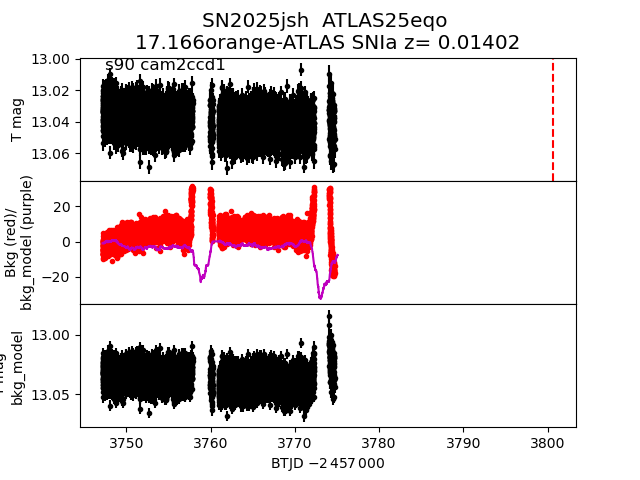
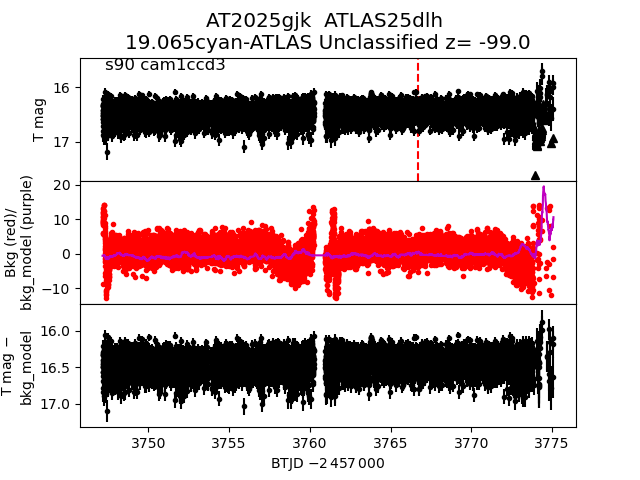
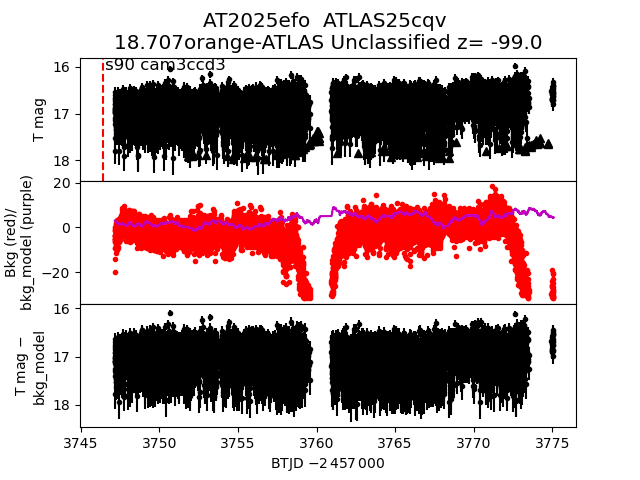
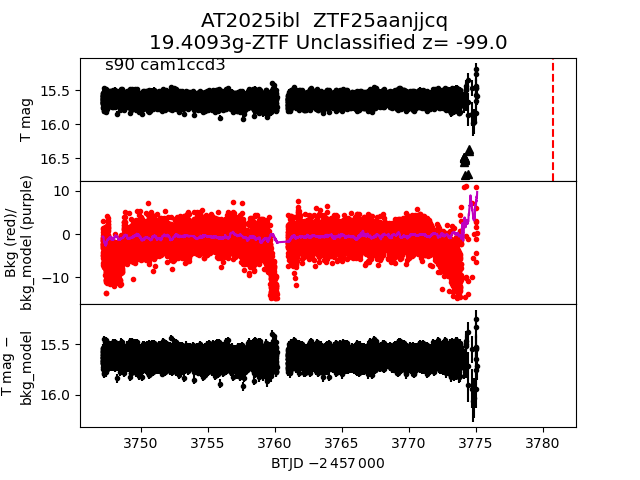
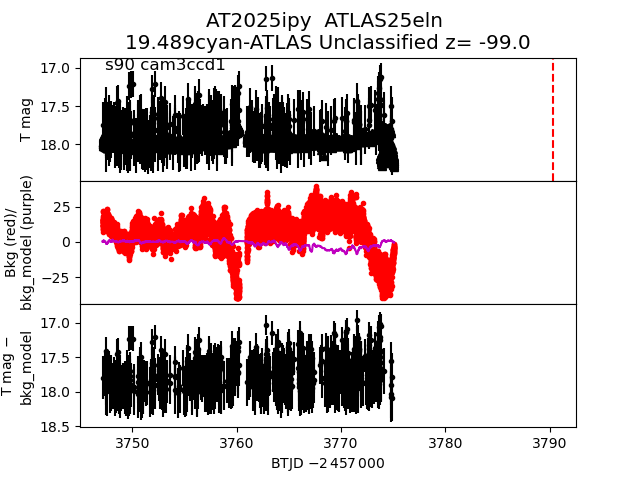
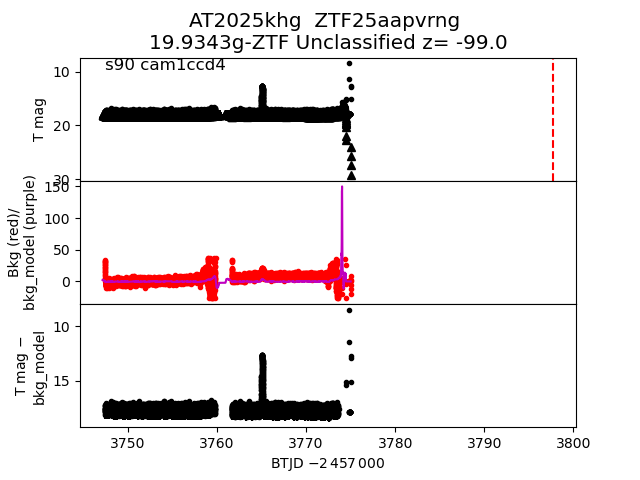
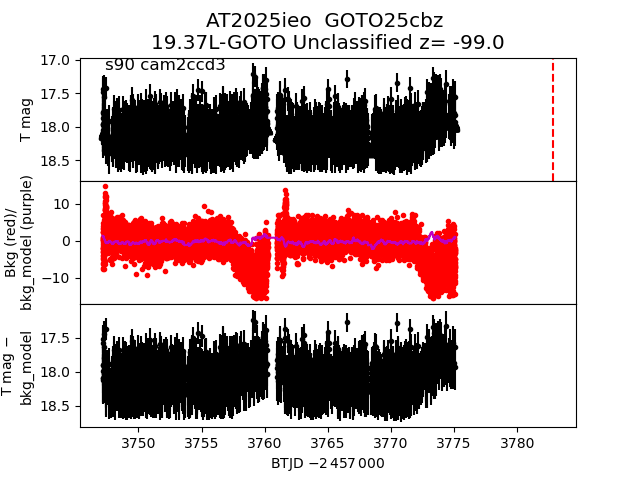
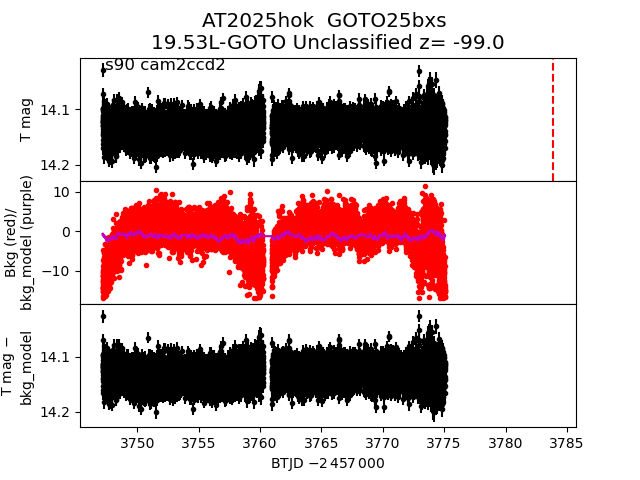
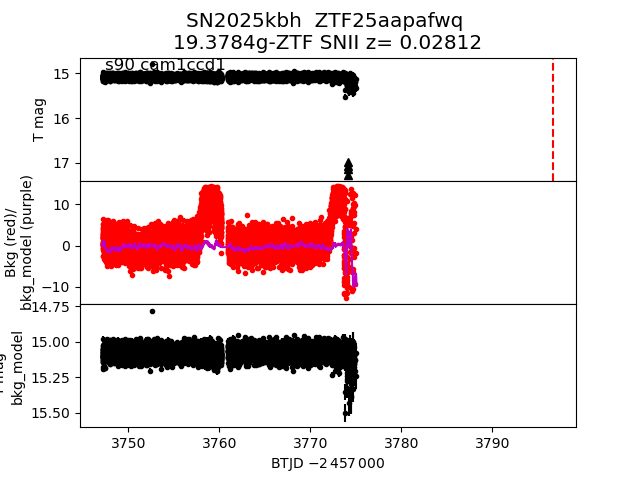
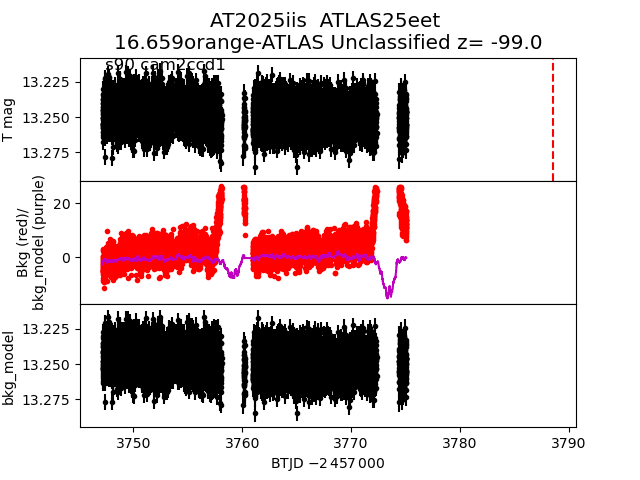
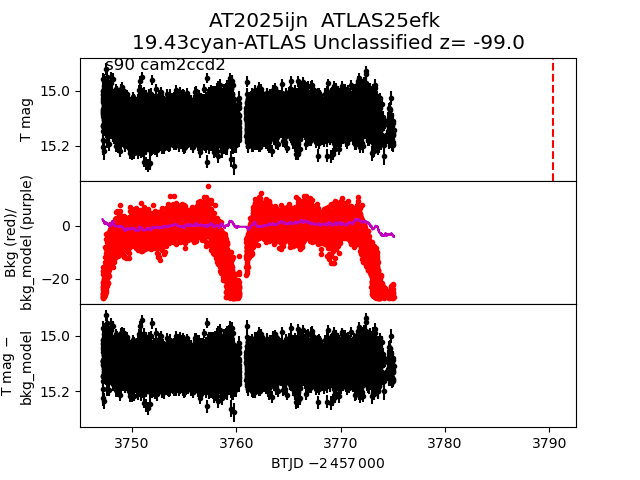
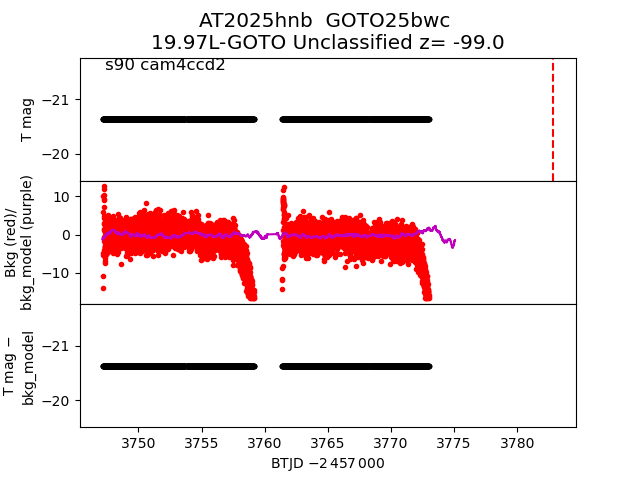
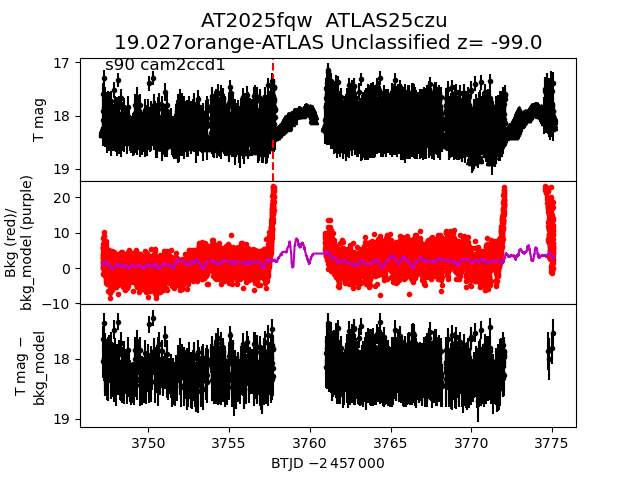
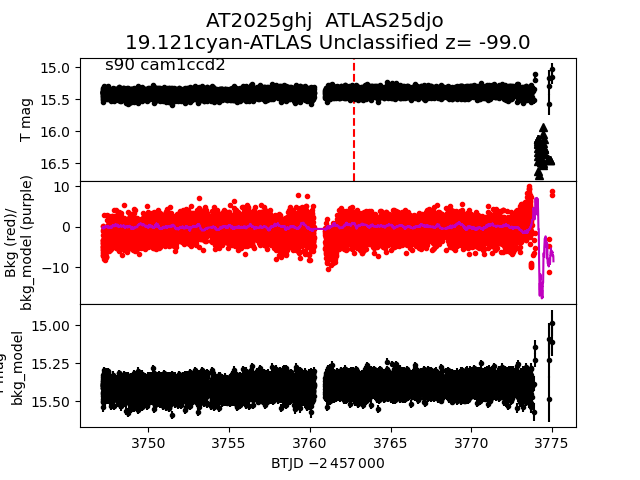
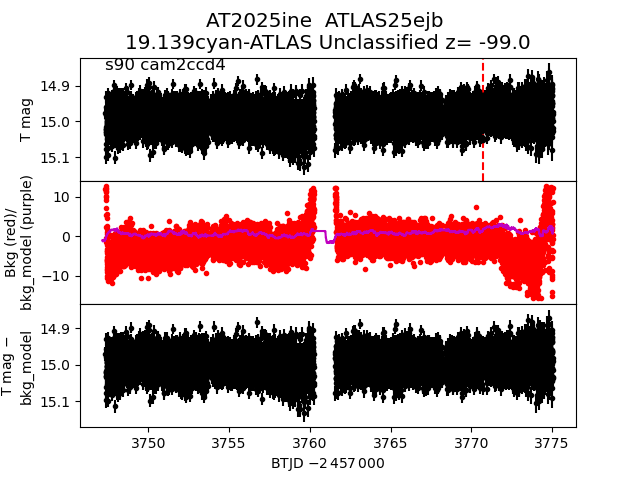
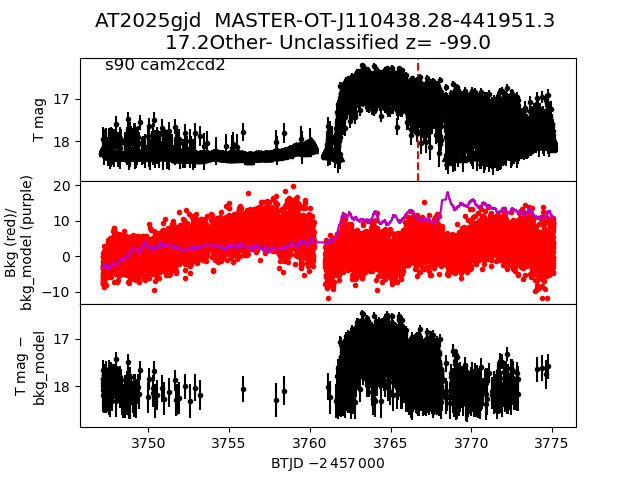
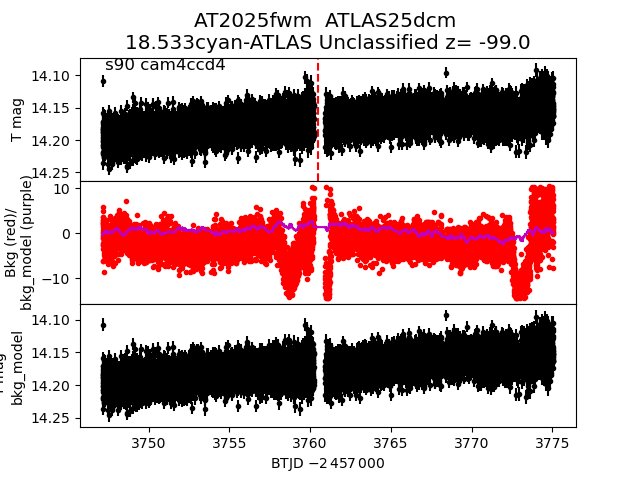
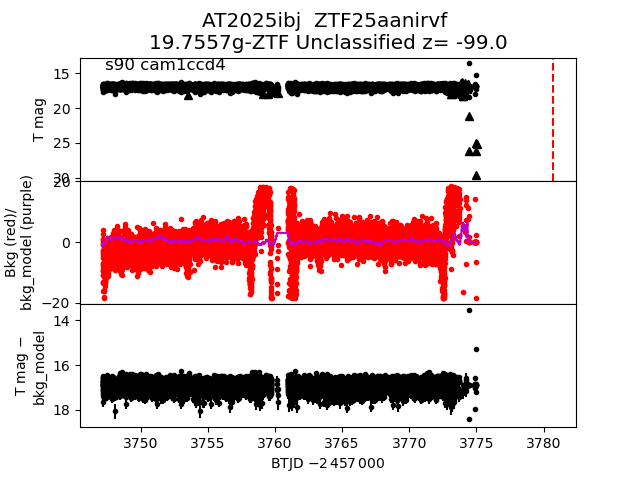
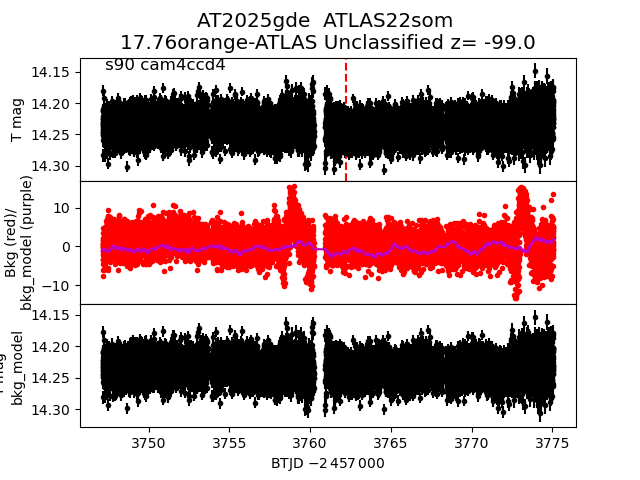
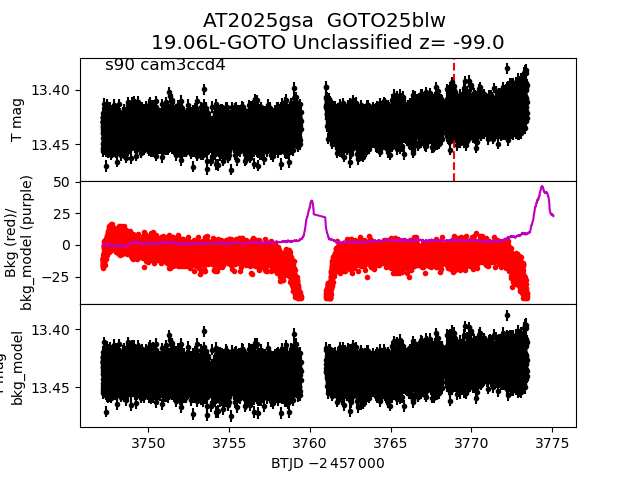
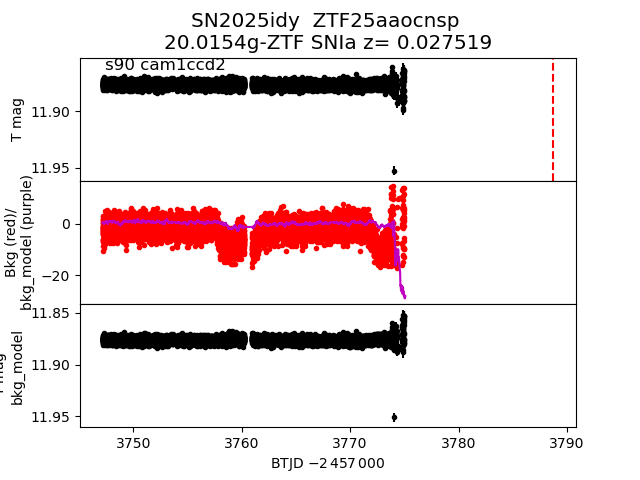
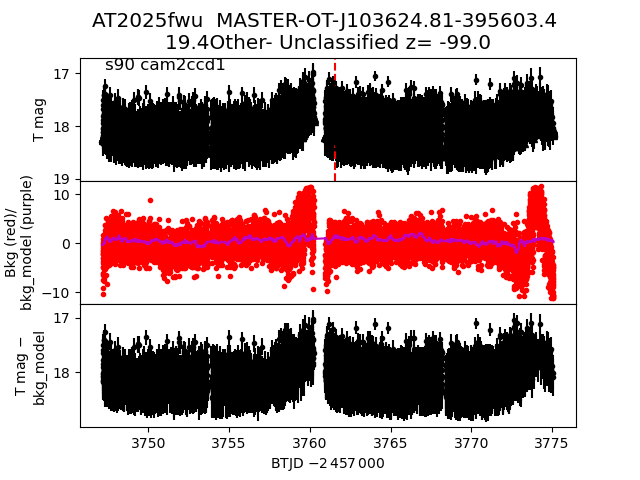
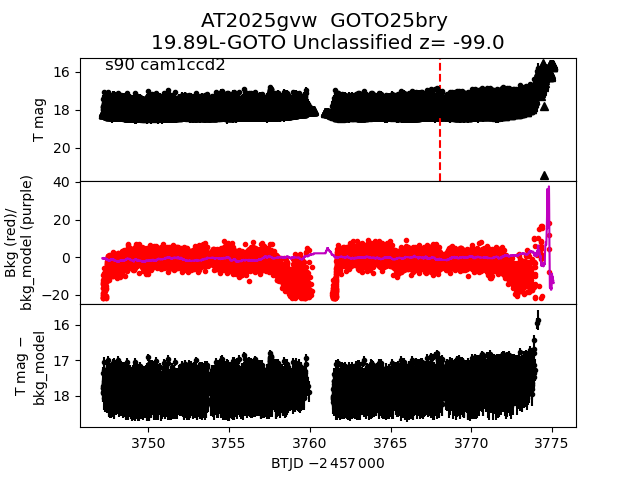
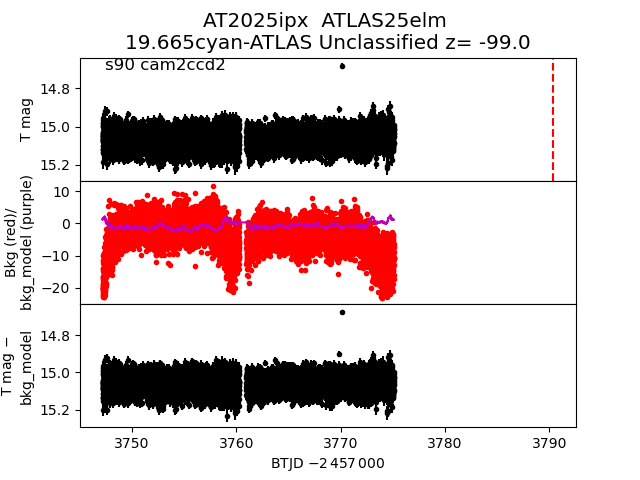
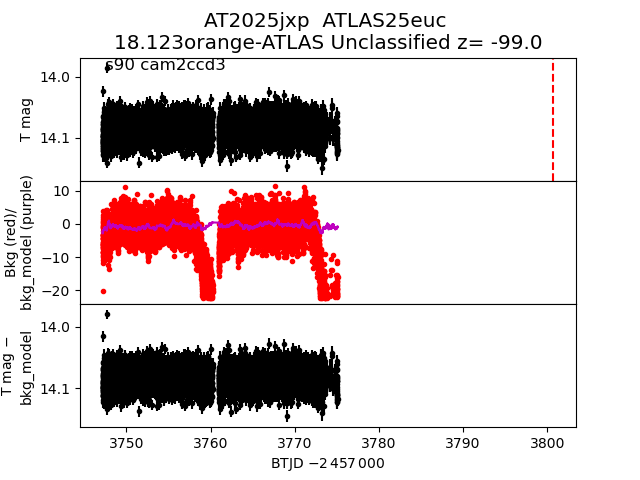
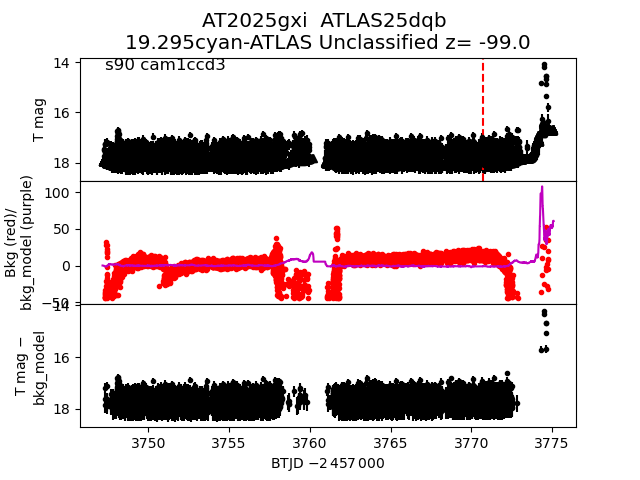
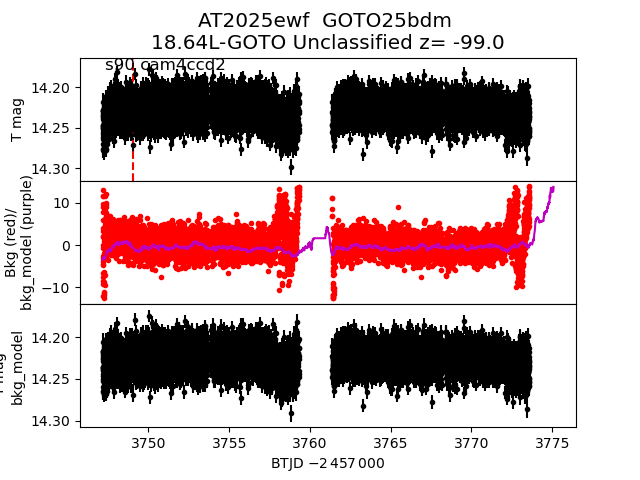
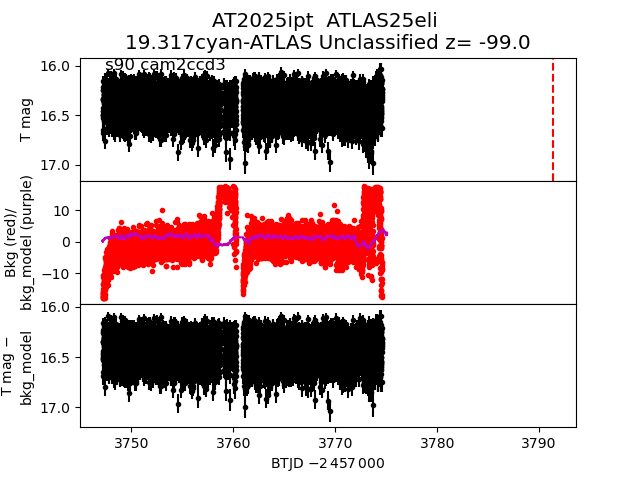
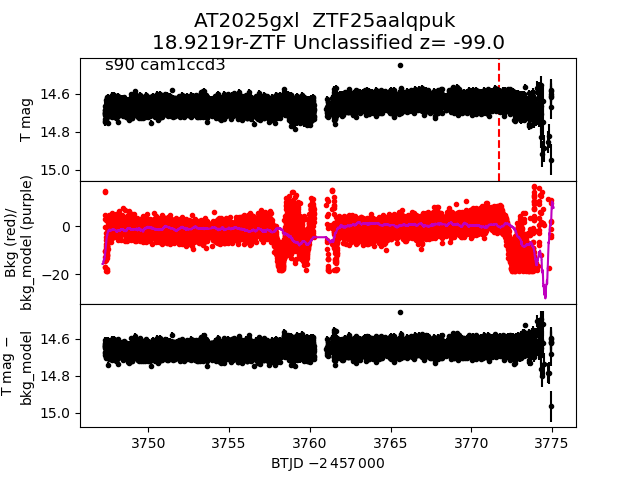
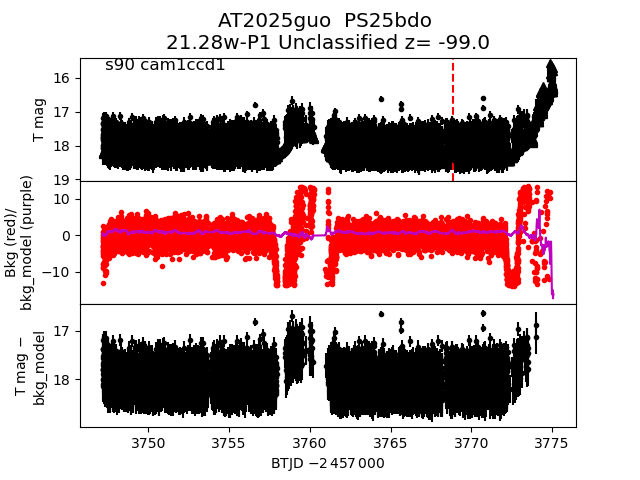
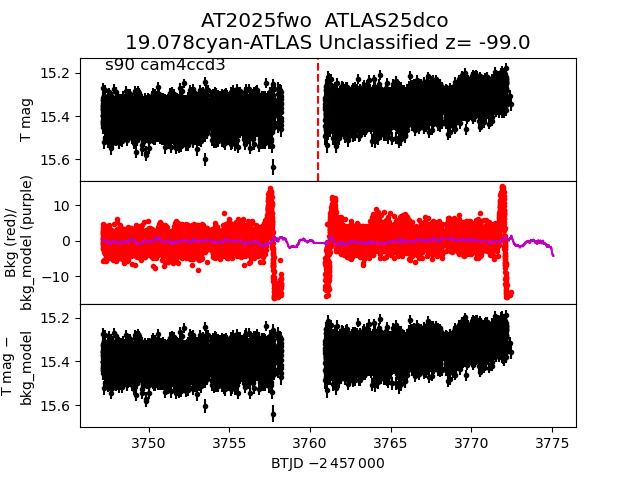
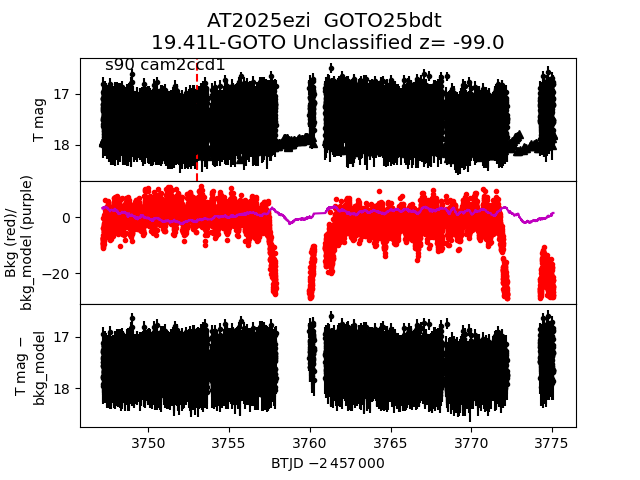
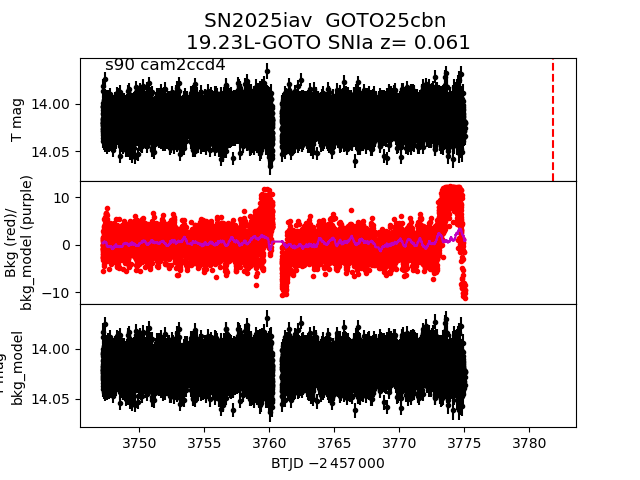
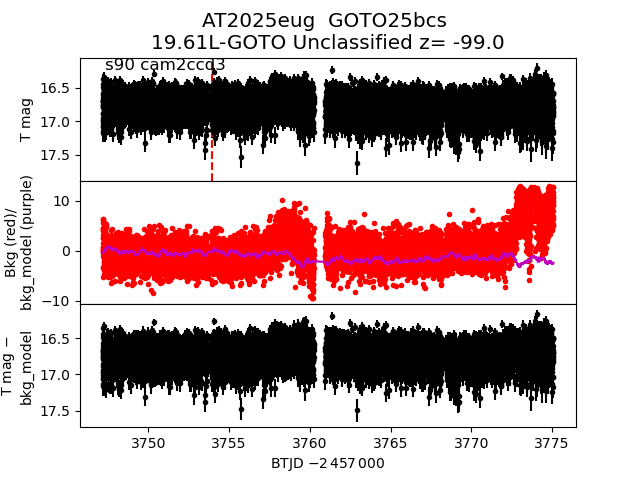
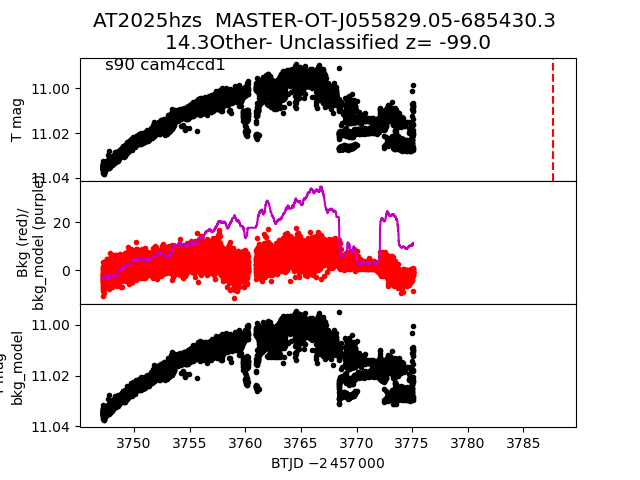
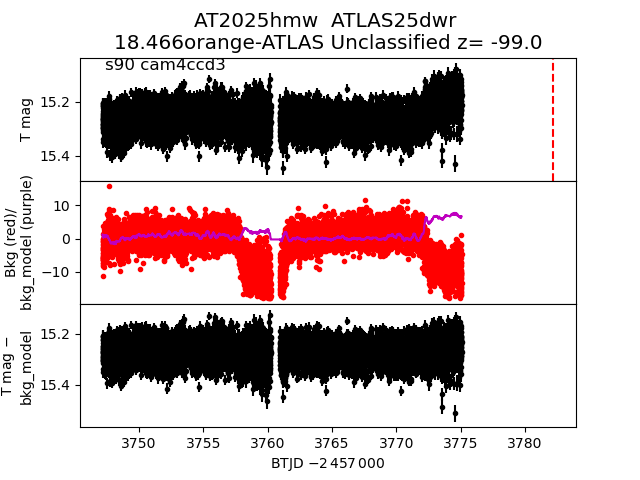
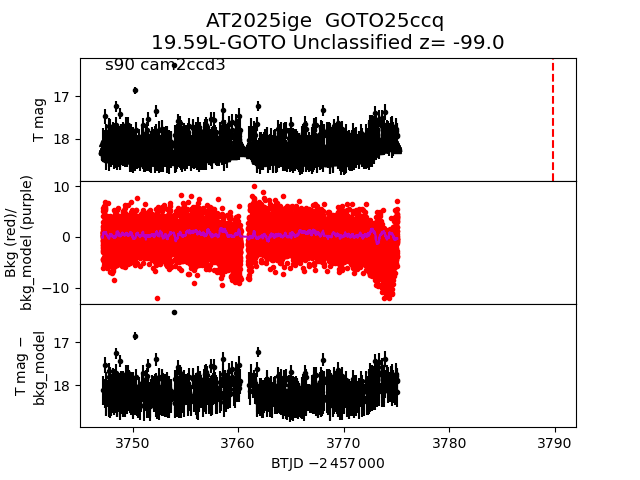
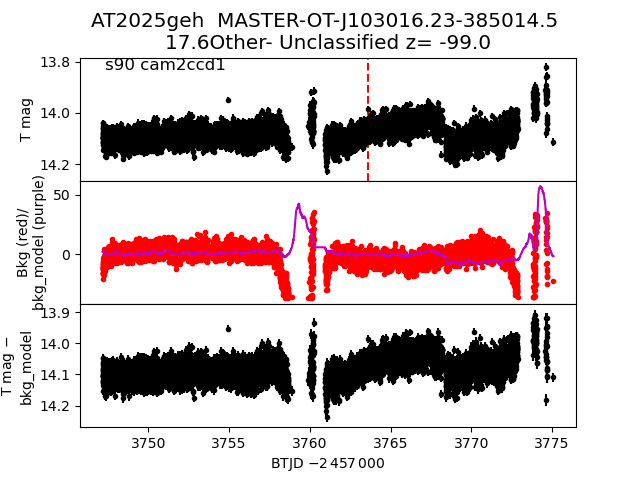
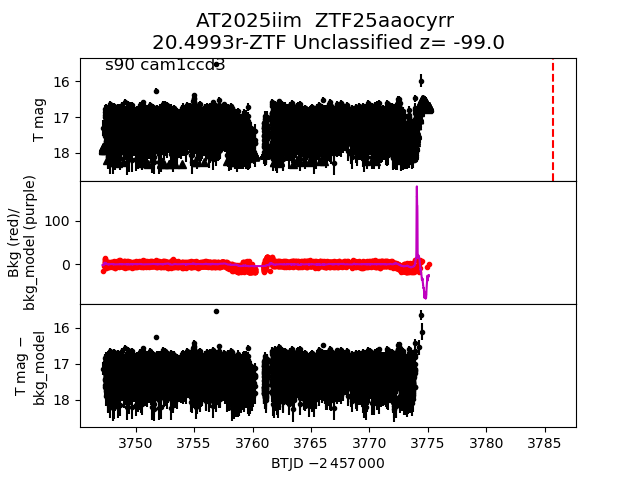
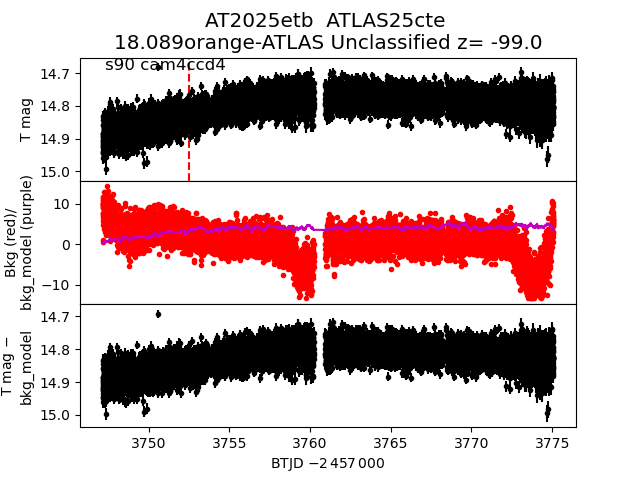
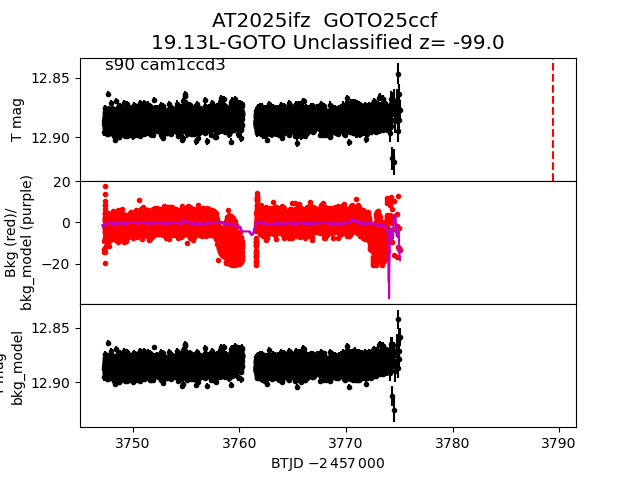
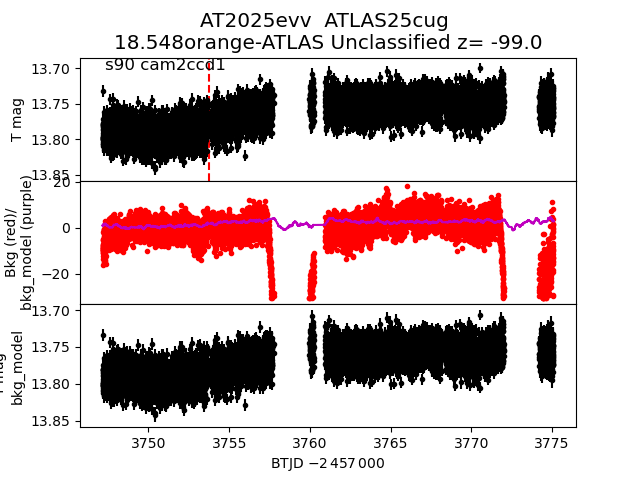
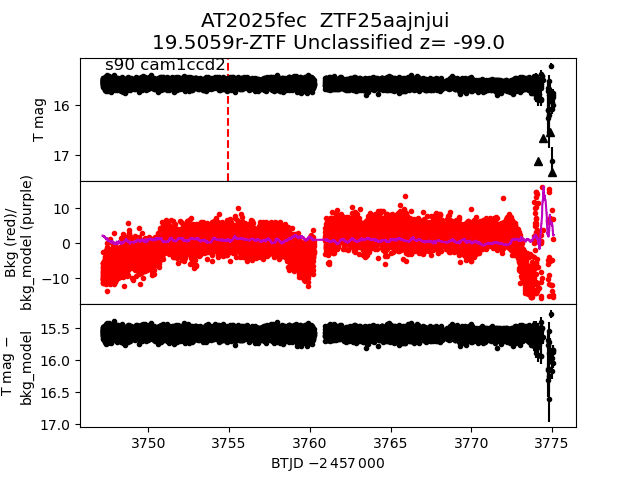
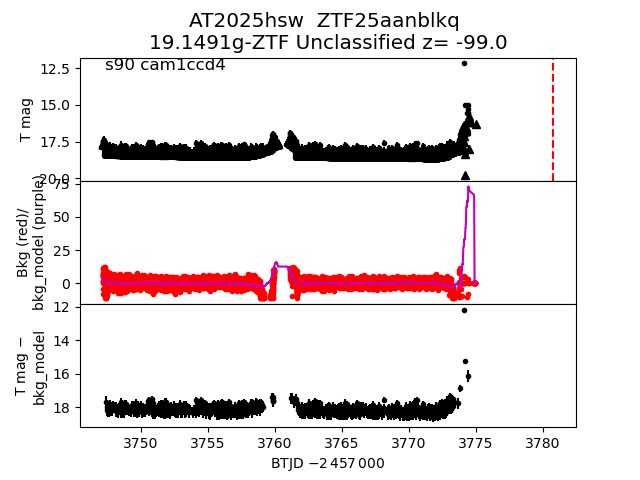
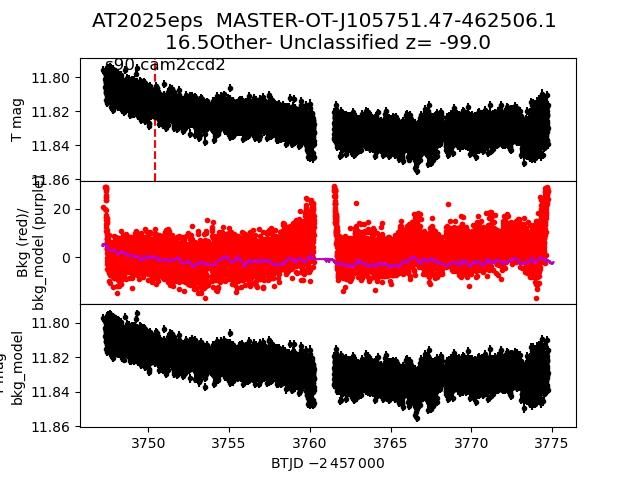
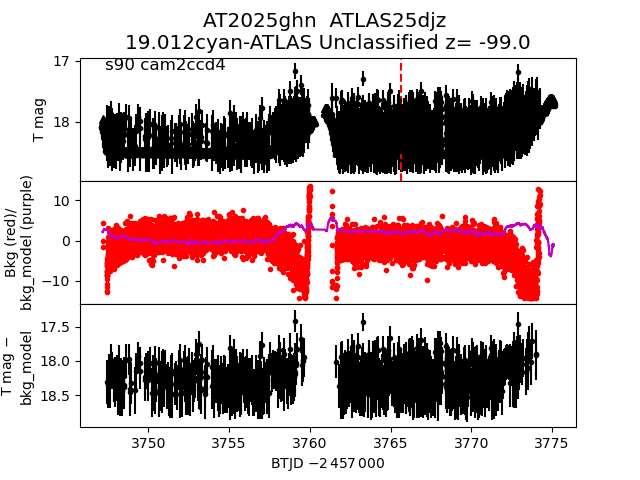
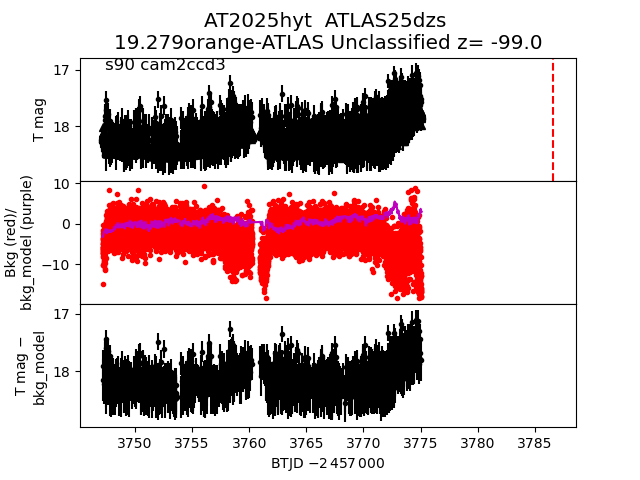
Each figure has three panels. The top panel shows the transient light curve, the middle panel shows the local background (estimated in an annulus), and the bottom panel shows a "background-model corrected" light curve. Details about the background model are in the README.
The vertical red line marks the time of discovery reported to TNS. Other useful metadata from TNS is in the figure title.
Note that the top and bottom panel are in magnitudes, while the middle panel is in differential flux units. The magnitudes are calibrated to the flux in the reference image used for image subtraction. Thus, flux from the host galaxy is included in these magnitudes.
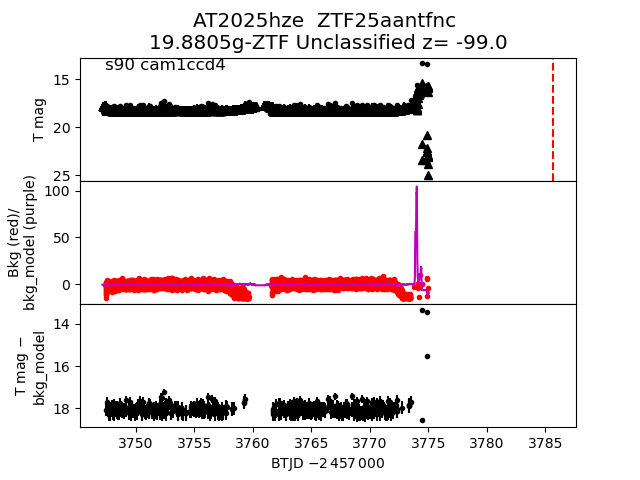
3-sigma upper limits are plotted as triangles with no errorbars. A typical limiting magnitude is 19.6 in 30 minutes or 18.4 in 200 seconds (for low backgrounds).
The links allow you to download the light curve data as a text file.
More details in the README.
2025gxr
 2025fwn
 2025fvk
 2025hsy
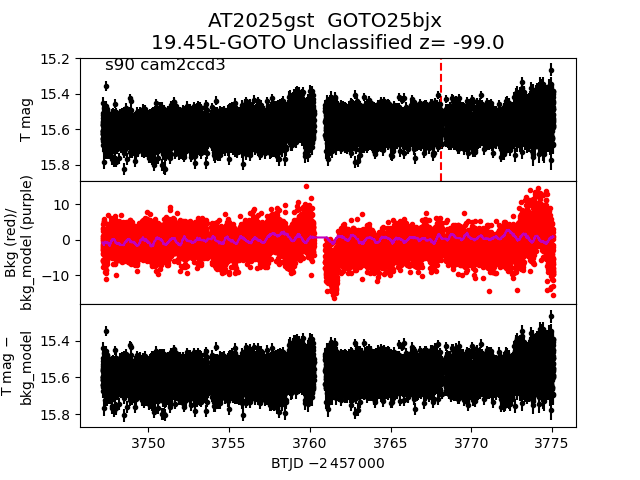
 2025gst
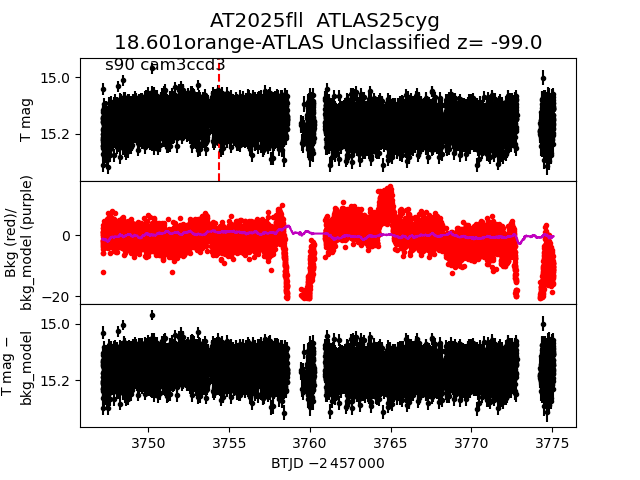
 2025fll
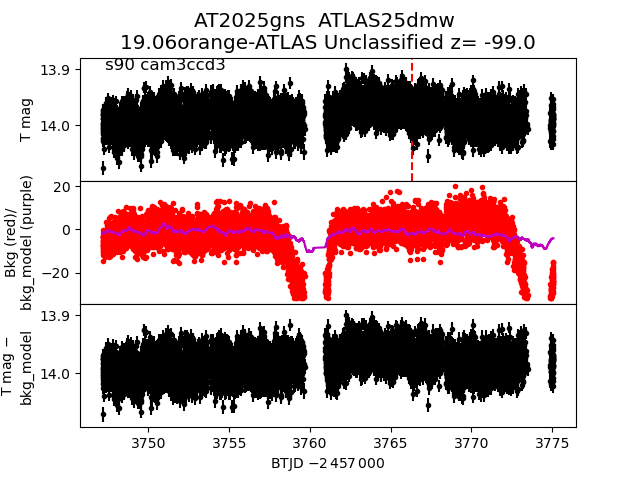
 2025gns
 2025hzg
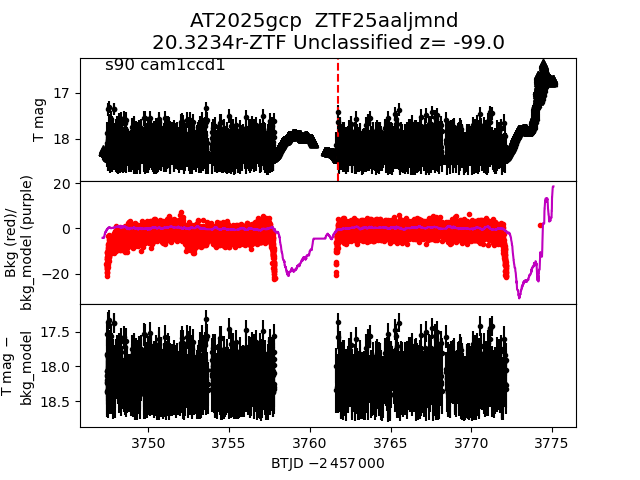
 2025gcp
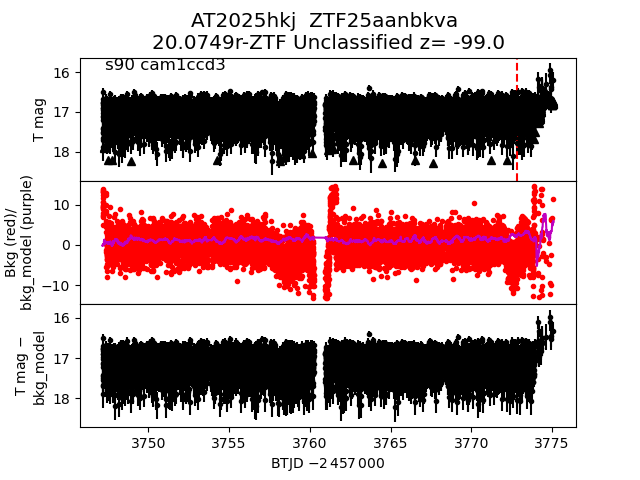
 2025hkj
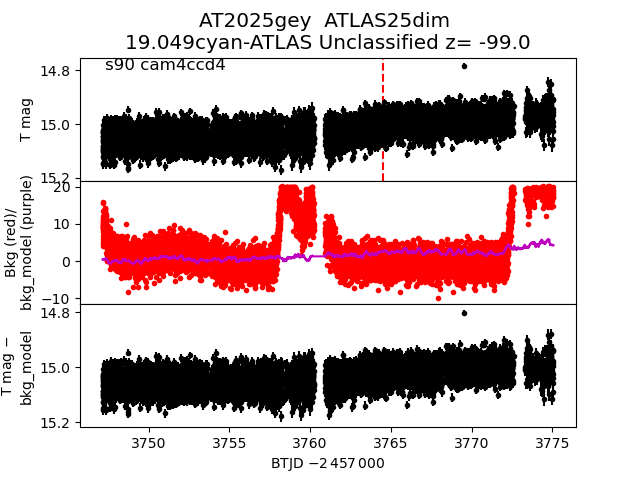
 2025gey
 2025ewg
 2025jsh
 2025gjk
 2025efo
 2025ibl
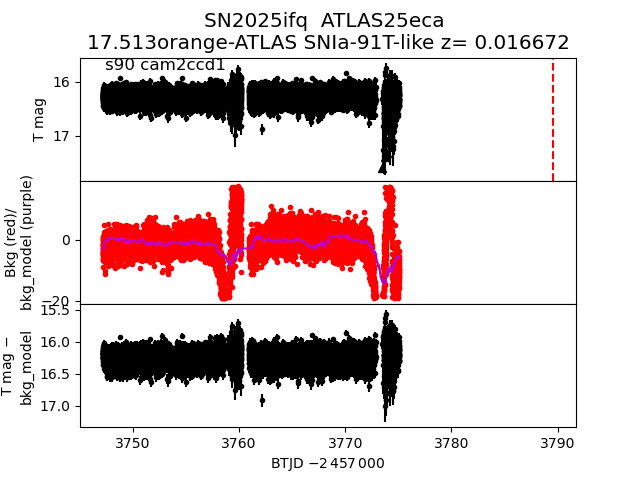
 2025ifq
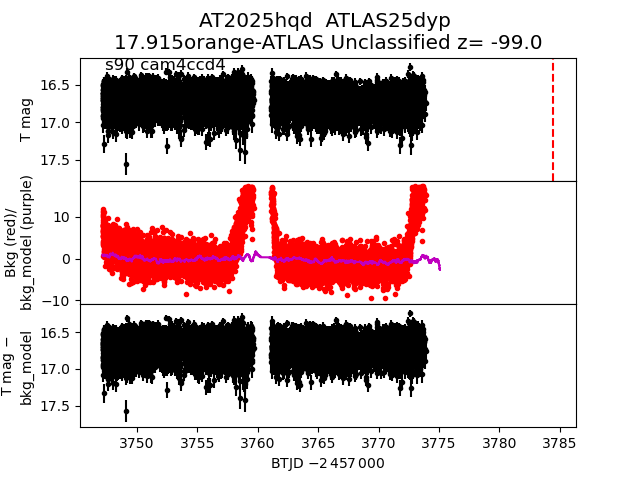
 2025hqd
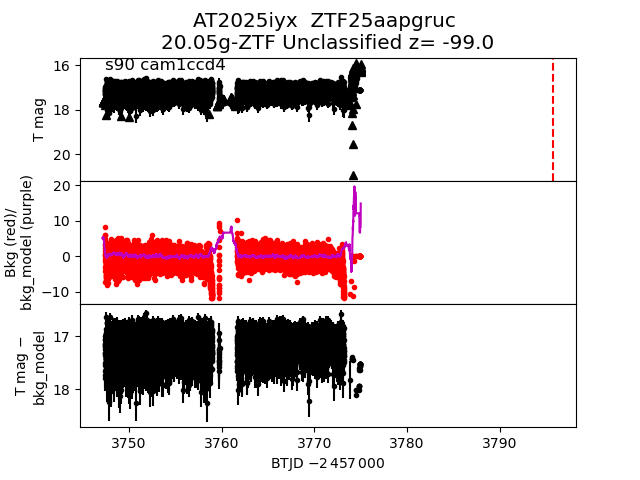
 2025iyx
 2025ipy
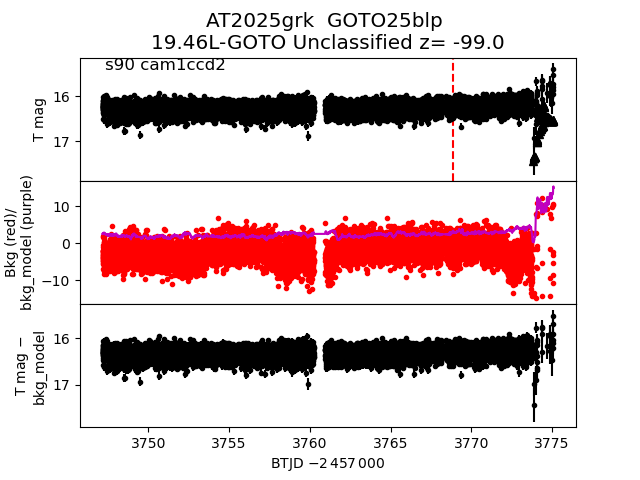
 2025grk
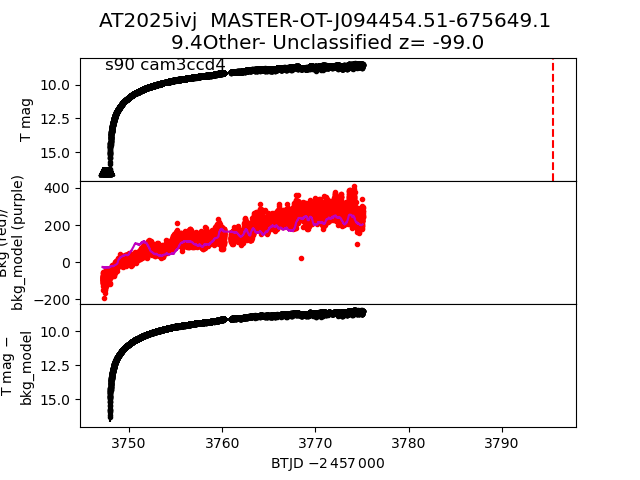
 2025ivj
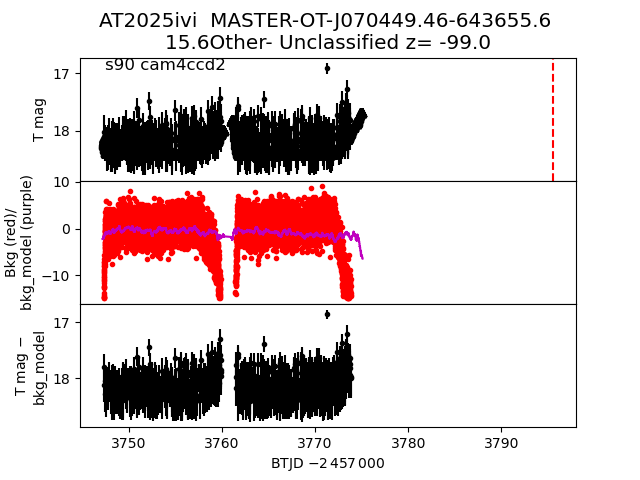
 2025ivi
 2025khg
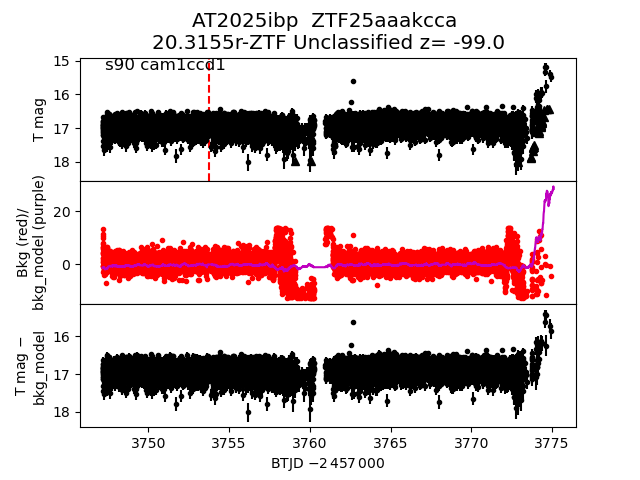
 2025ibp
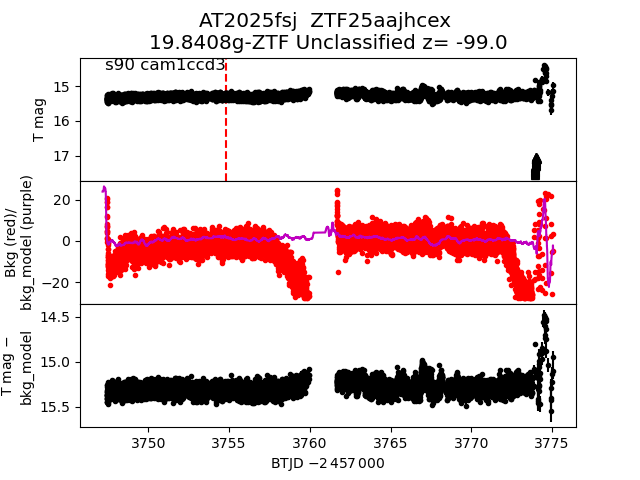
 2025fsj
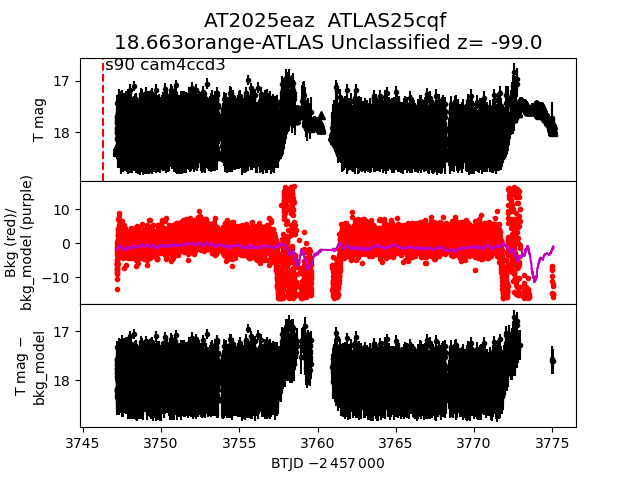
 2025eaz
 2025ieo
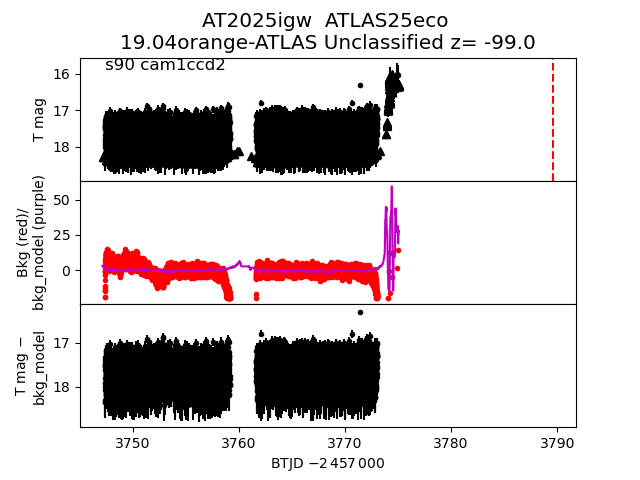
 2025igw
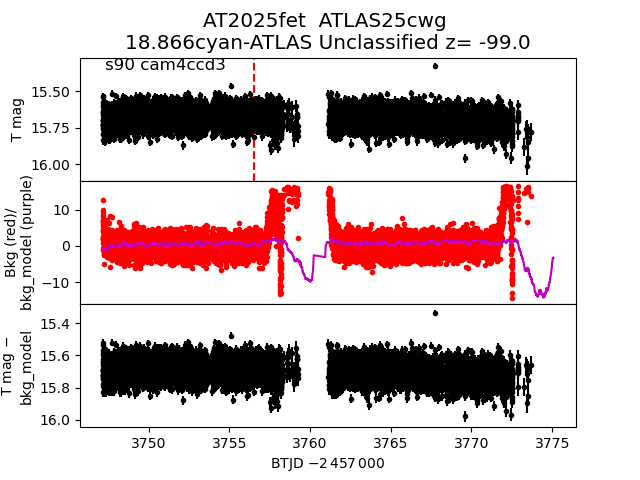
 2025fet
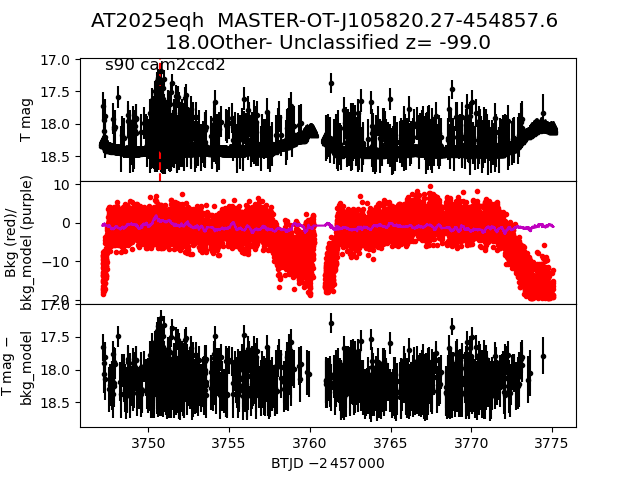
 2025eqh
 2025hok
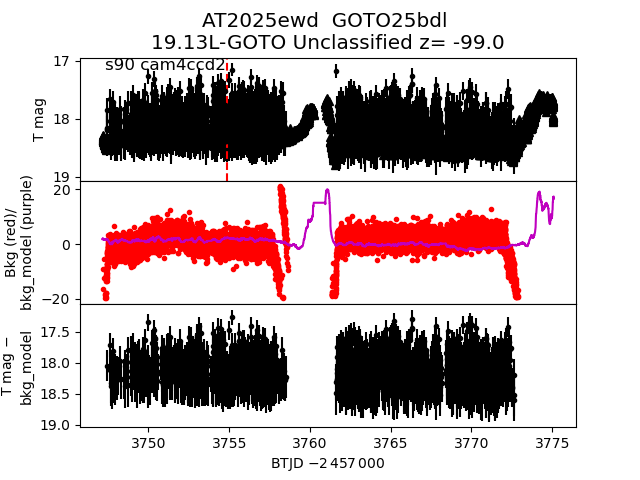
 2025ewd
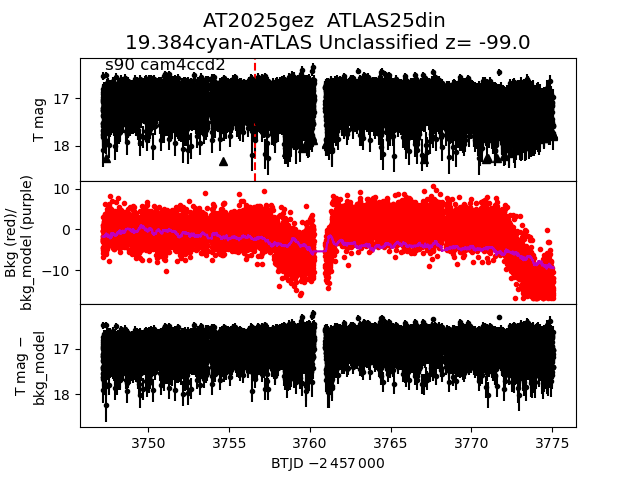
 2025gez
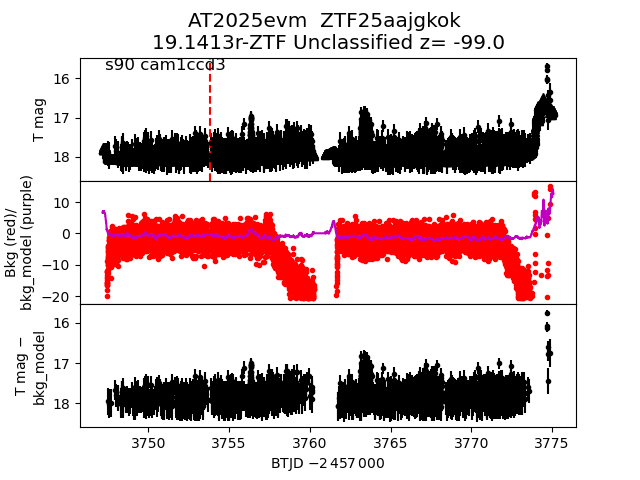
 2025evm
 2025kbh
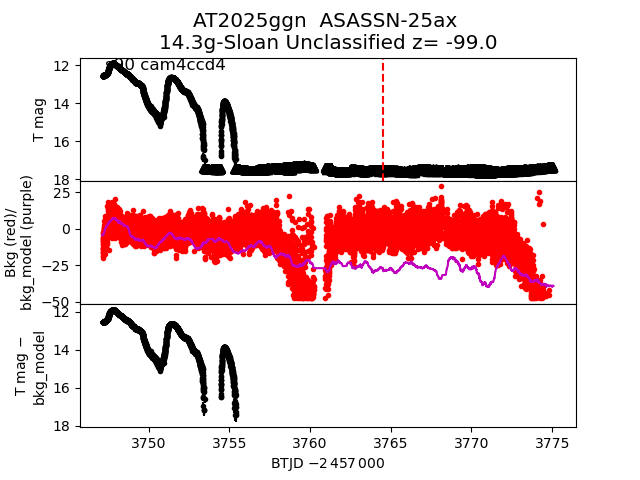
 2025ggn
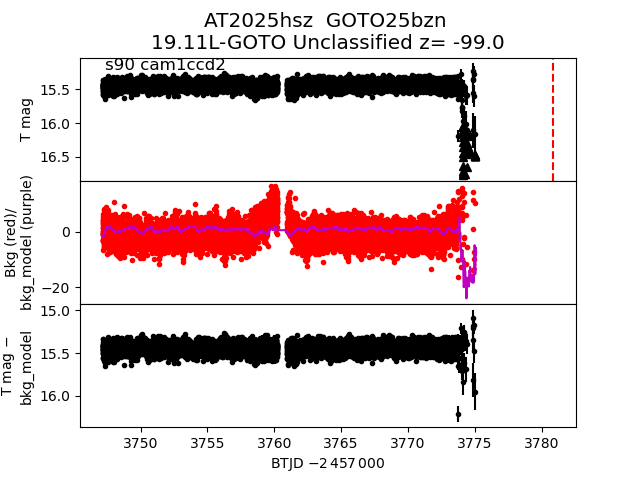
 2025hsz
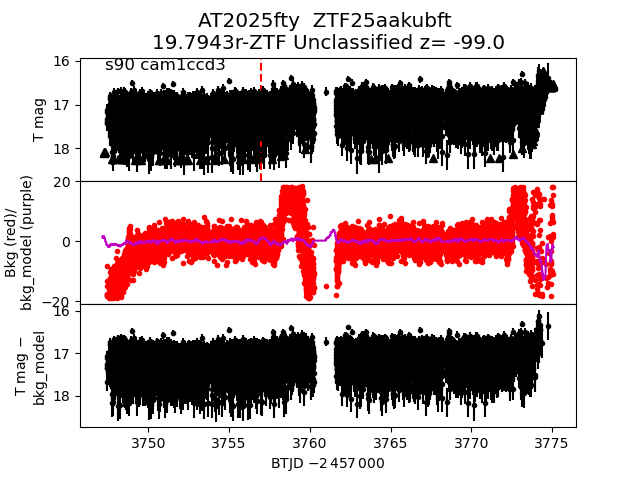
 2025fty
 2025iis
 2025ijn
 2025hnb
 2025fqw
 2025ghj
 2025ine
 2025gjd
 2025fwm
 2025ibj
 2025gde
 2025gsa
 2025idy
 2025fwu
 2025gvw
 2025ipx
 2025jxp
 2025gxi
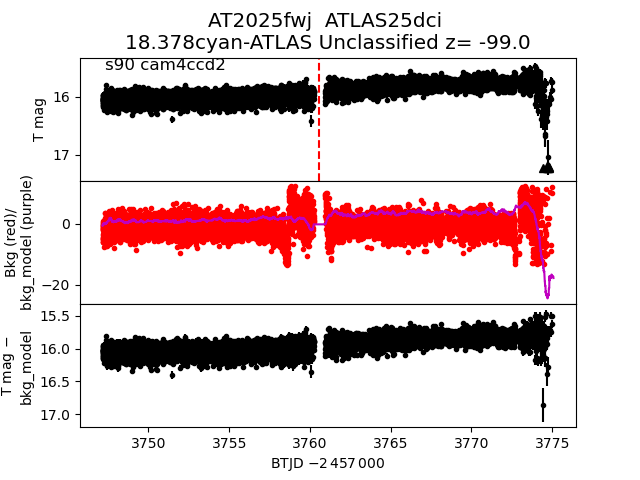
 2025fwj
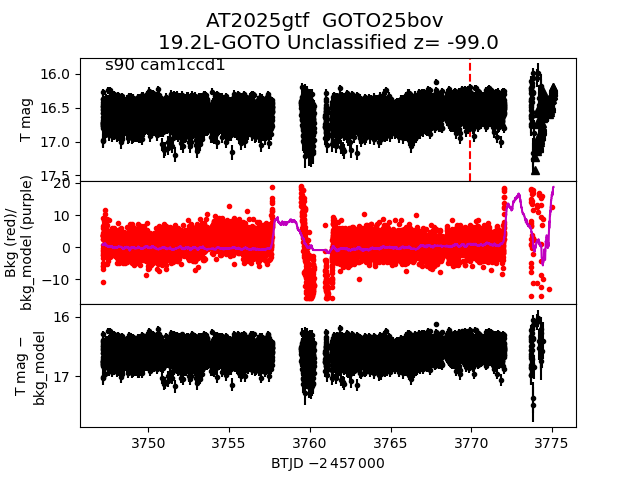
 2025gtf
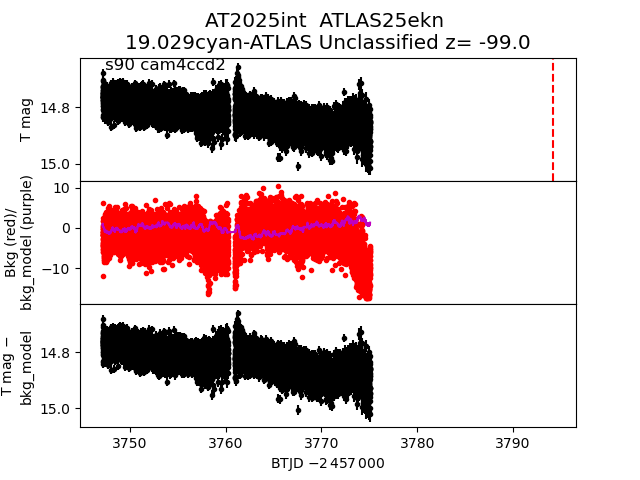
 2025int
 2025ewf
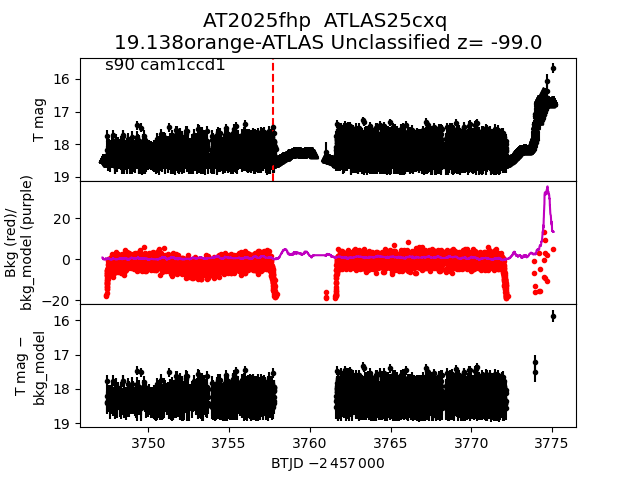
 2025fhp
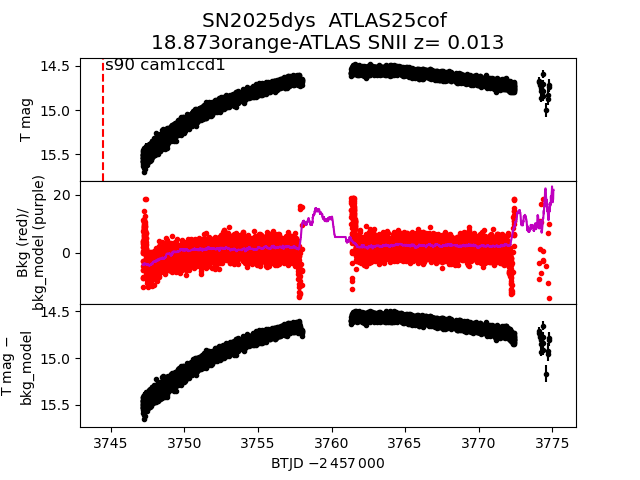
 2025dys
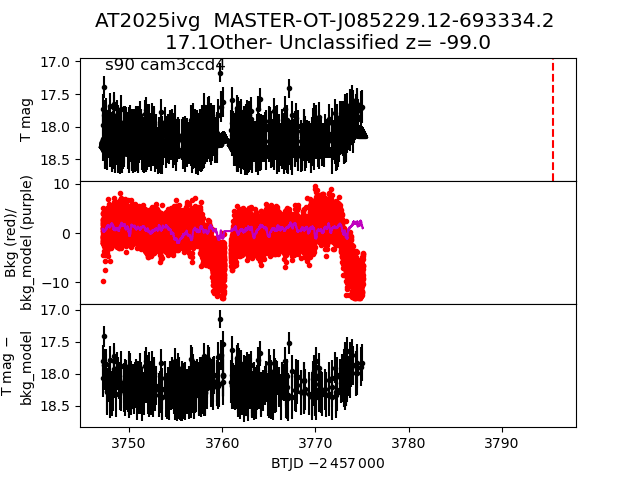
 2025ivg
 2025ipt
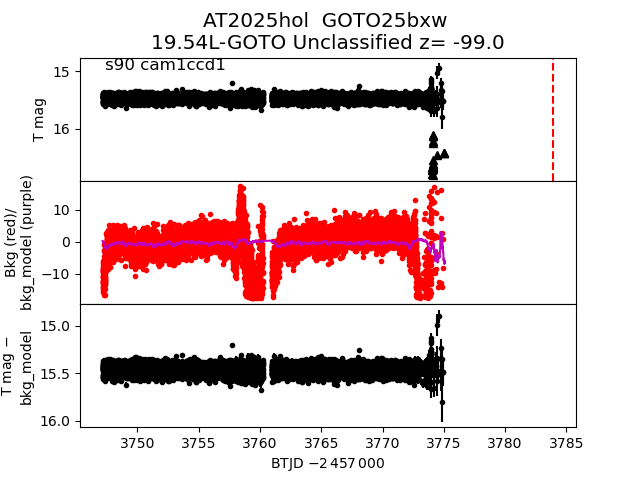
 2025hol
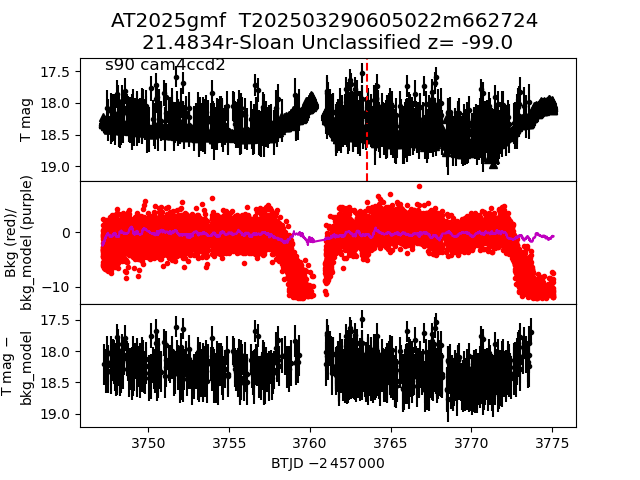
 2025gmf
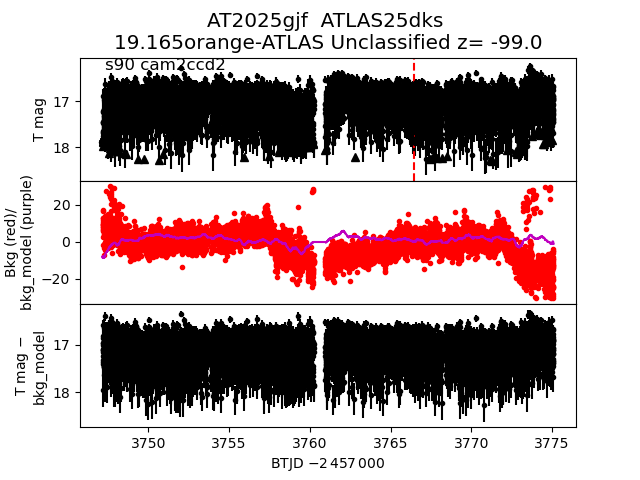
 2025gjf
 2025gxl
 2025guo
 2025fwo
 2025ezi
 2025iav
 2025eug
 2025hzs
 2025hmw
 2025ige
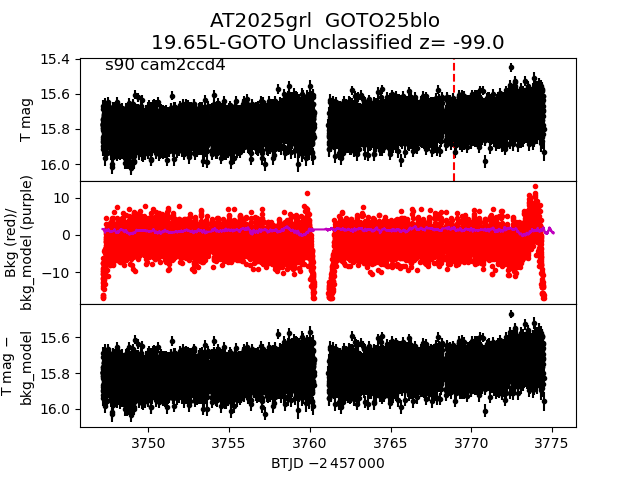
 2025grl
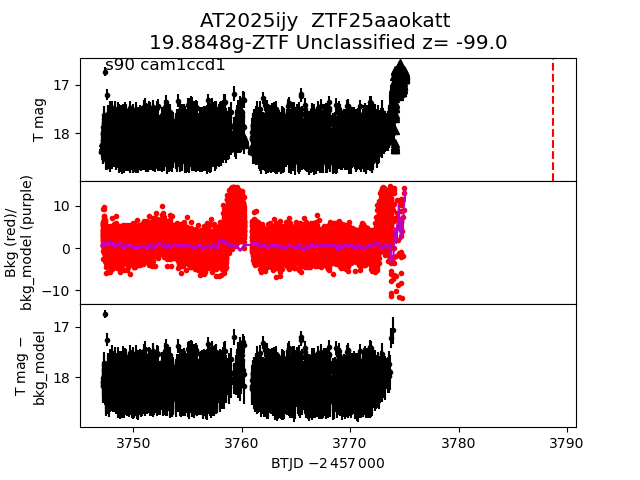
 2025ijy
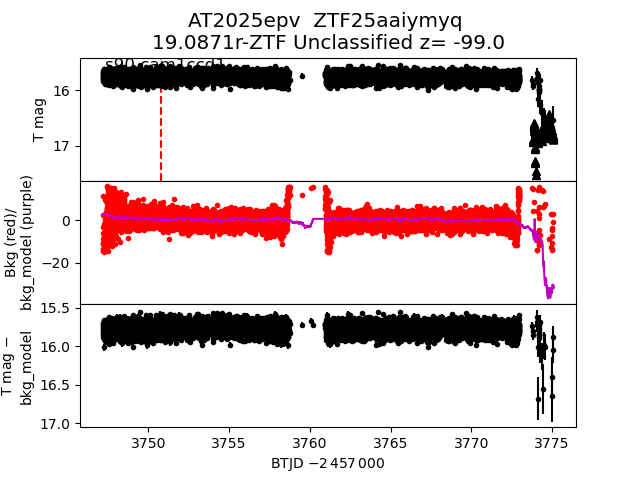
 2025epv
 2025geh
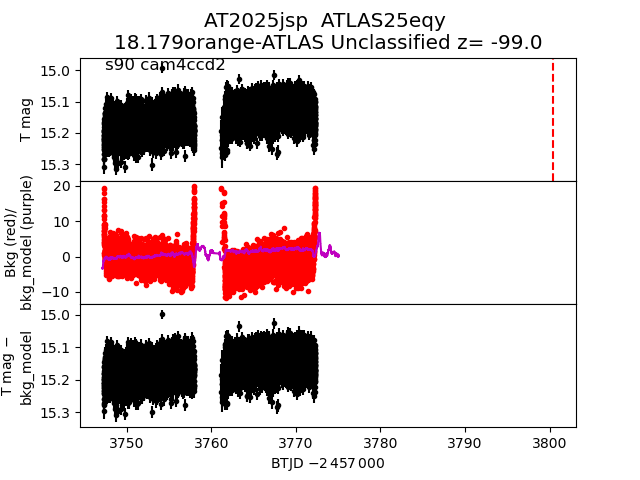
 2025jsp
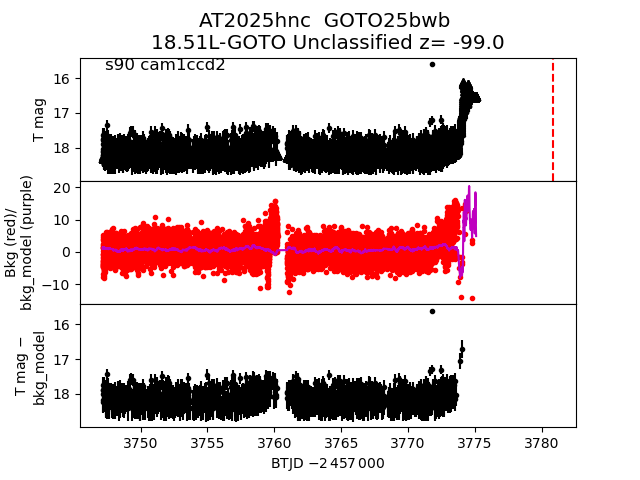
 2025hnc
 2025hze
 2025iim
 2025etb
 2025ifz
 2025evv
 2025fec
 2025hsw
 2025eps
 2025ghn
 2025hyt
 2025ffa