sector88 supernovae (19 total)
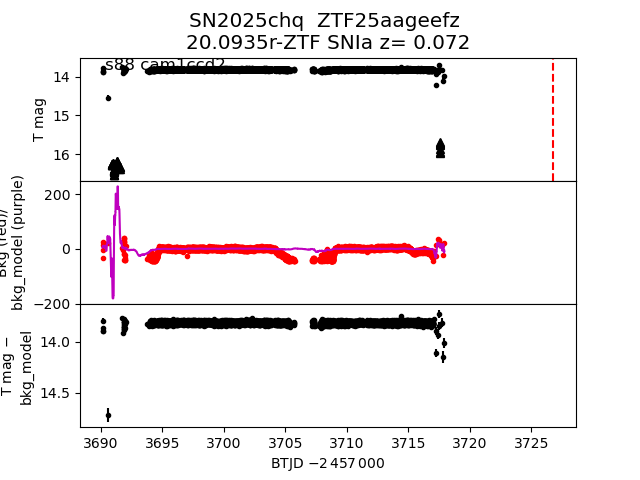
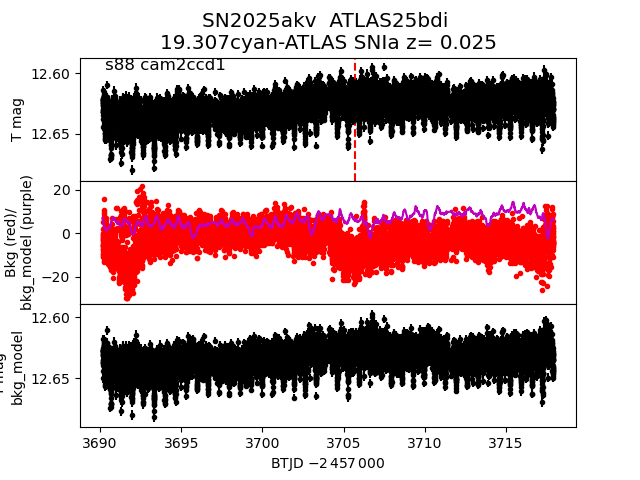
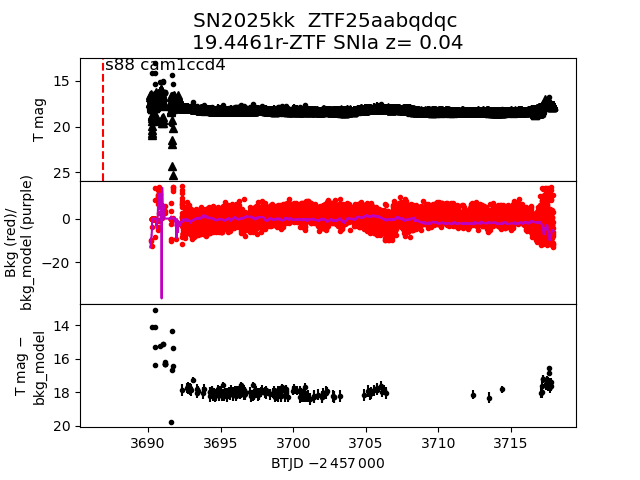
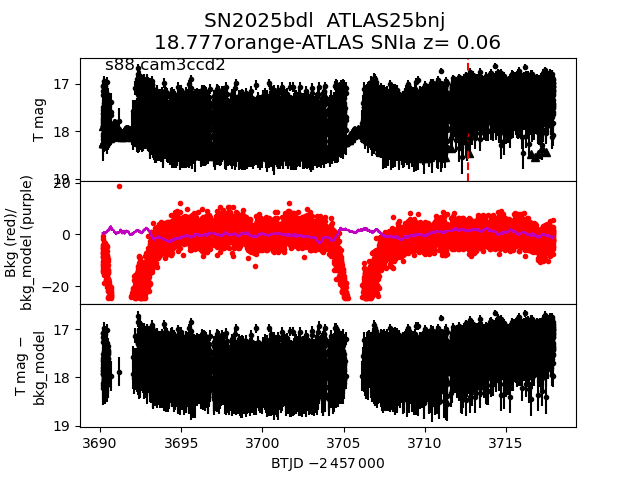
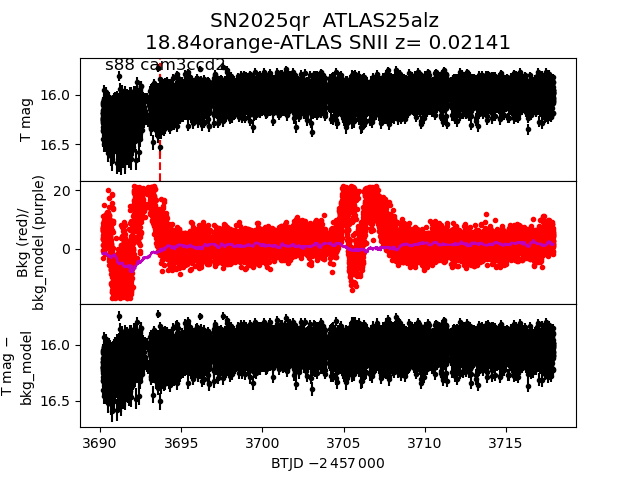
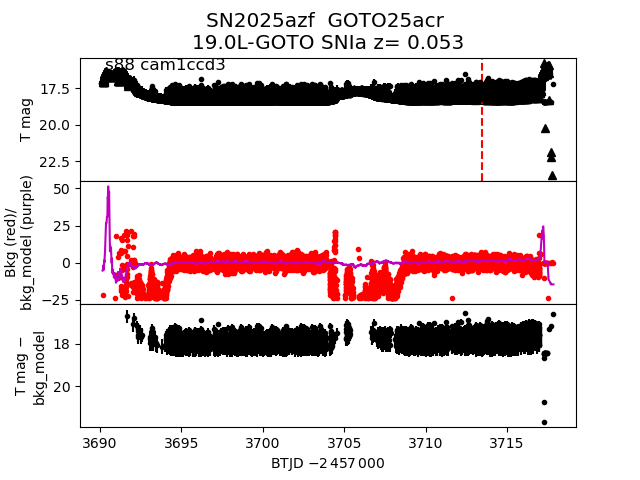
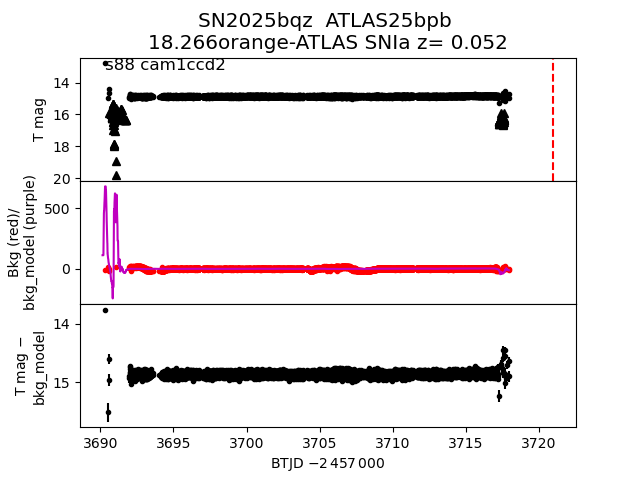
Each figure has three panels. The top panel shows the transient light curve, the middle panel shows the local background (estimated in an annulus), and the bottom panel shows a "background-model corrected" light curve. Details about the background model are in the README.
The vertical red line marks the time of discovery reported to TNS. Other useful metadata from TNS is in the figure title.
Note that the top and bottom panel are in magnitudes, while the middle panel is in differential flux units. The magnitudes are calibrated to the flux in the reference image used for image subtraction. Thus, flux from the host galaxy is included in these magnitudes.
3-sigma upper limits are plotted as triangles with no errorbars. A typical limiting magnitude is 19.6 in 30 minutes or 18.4 in 200 seconds (for low backgrounds).
The links allow you to download the light curve data as a text file.
More details in the README.
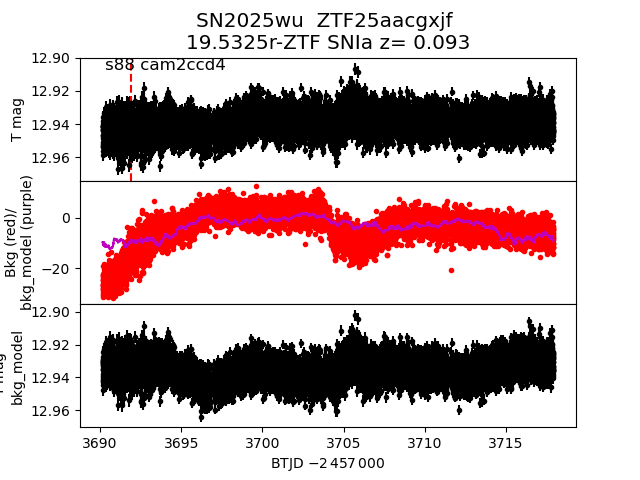
2025wu
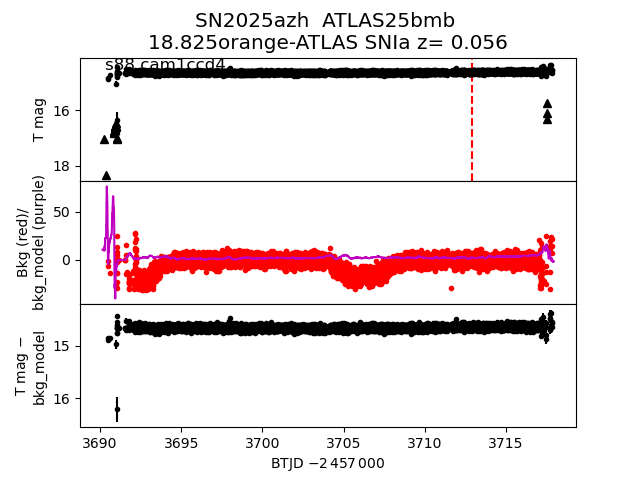
 2025azh
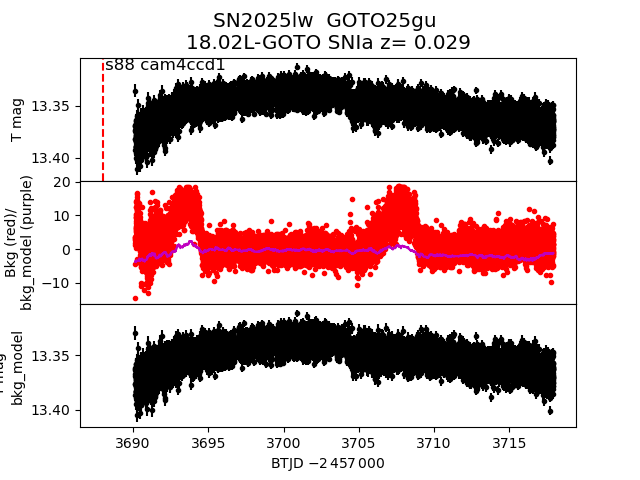
 2025lw
 2025akv
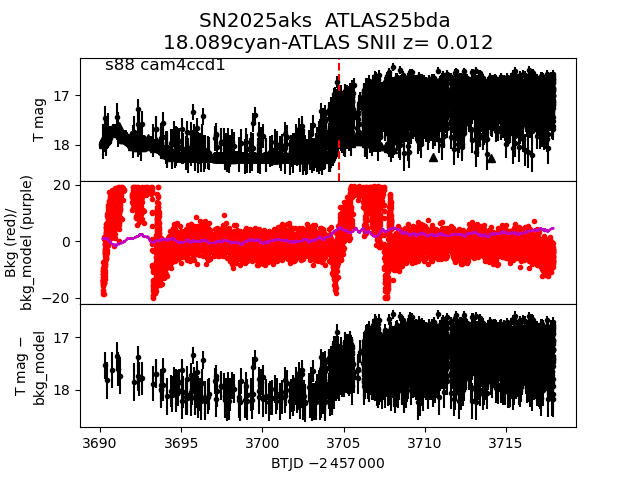
 2025aks
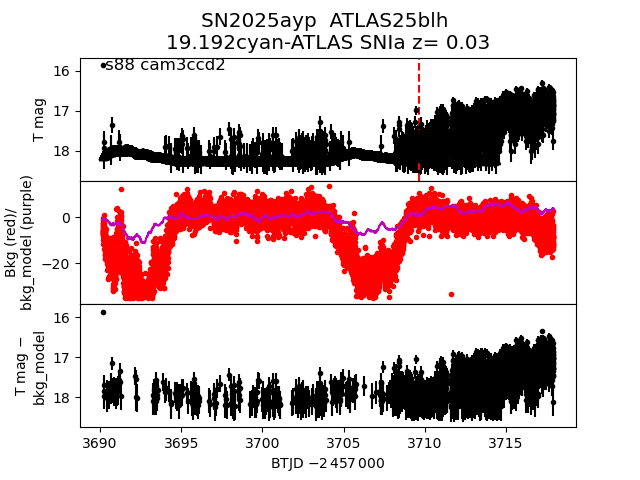
 2025ayp
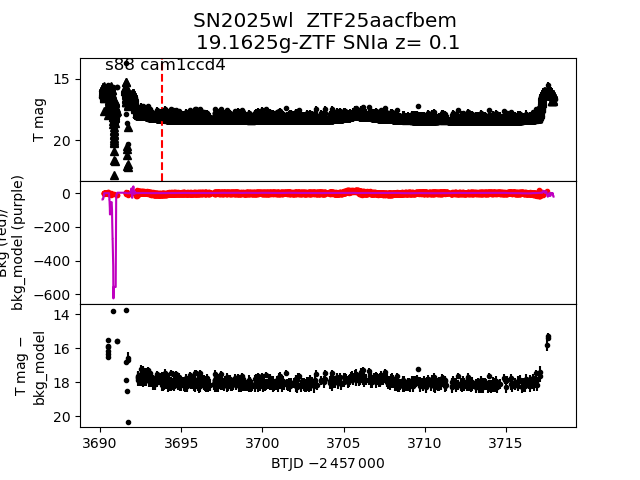
 2025wl
 2025kk
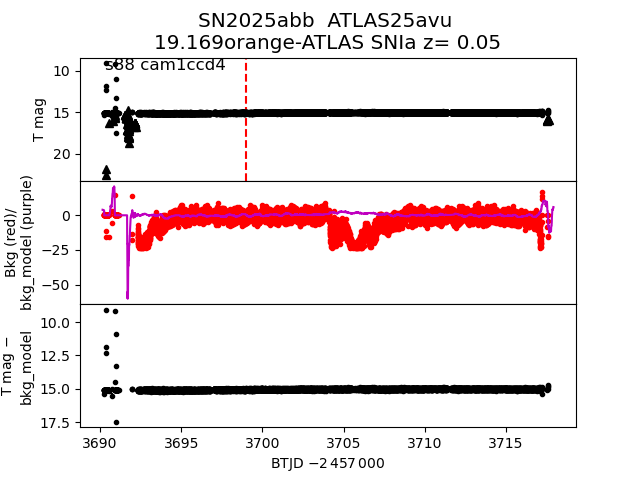
 2025abb
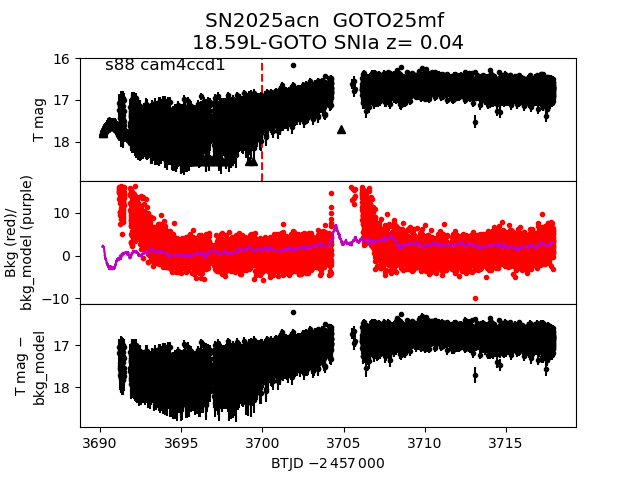
 2025acn
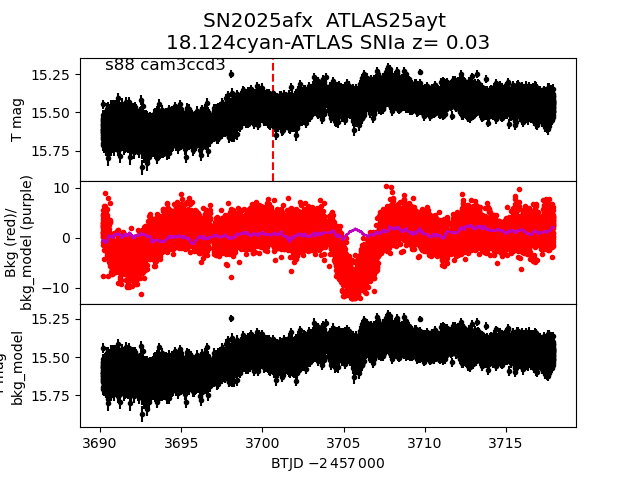
 2025afx
 2025bdl
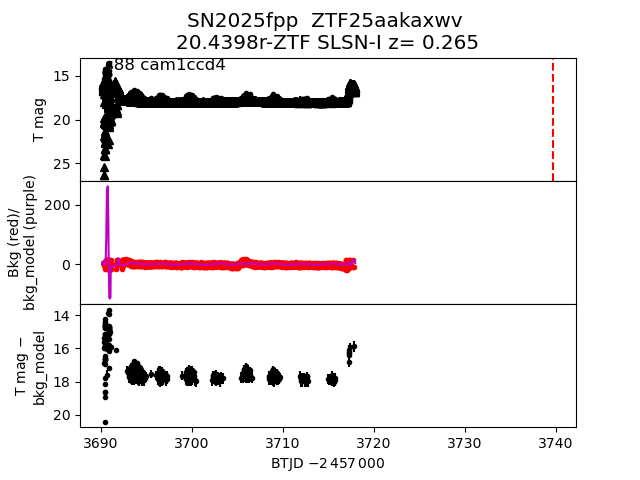
 2025fpp
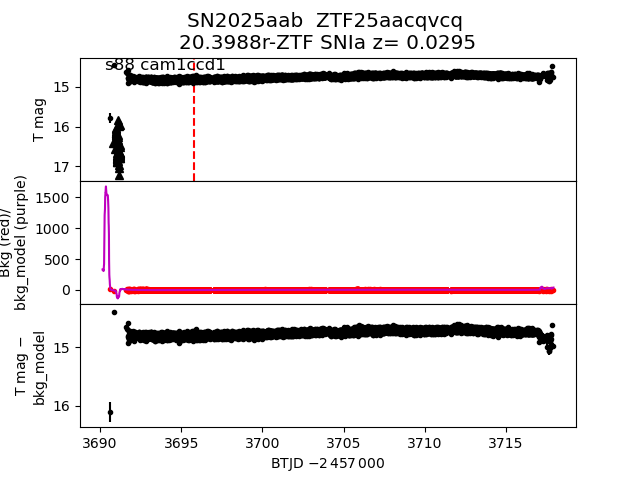
 2025aab
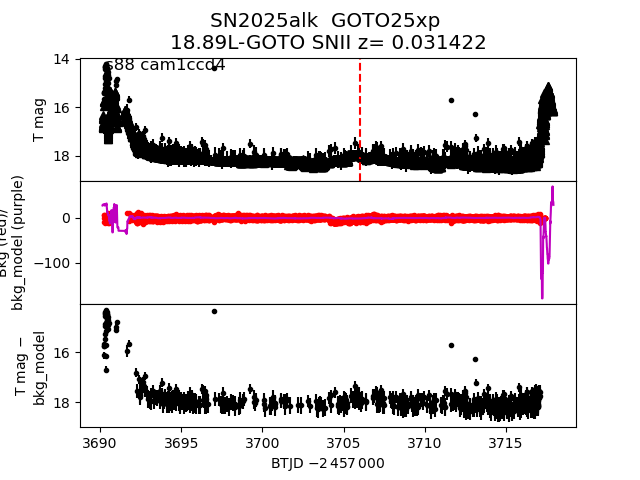
 2025alk
 2025qr
 2025azf
 2025bqz
 2025chq