all transients in sector87 (74 total)
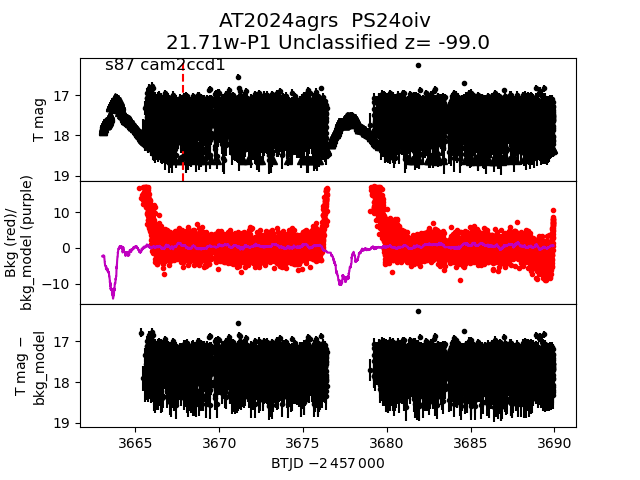
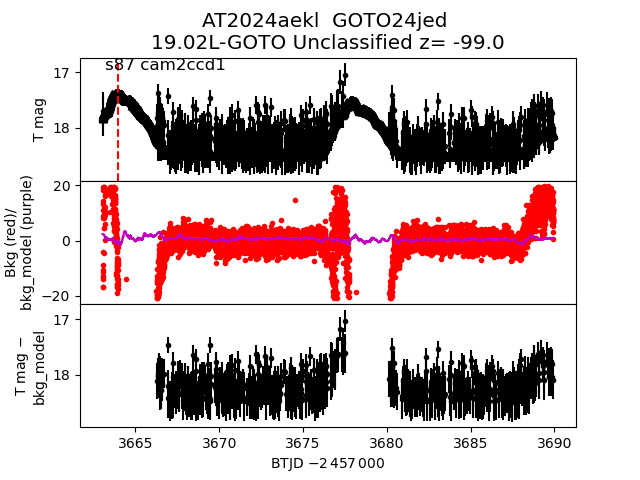
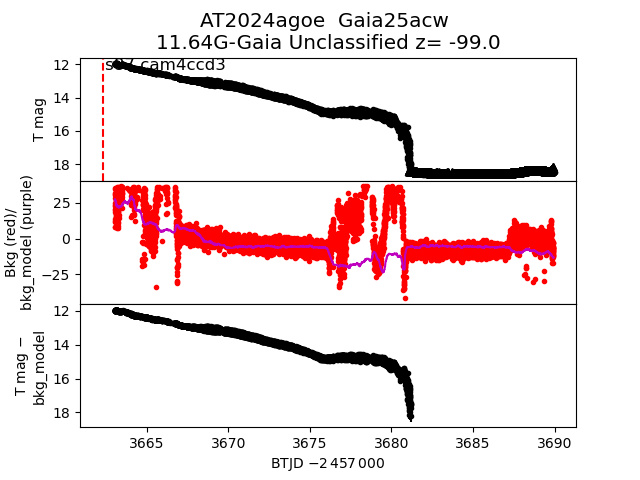
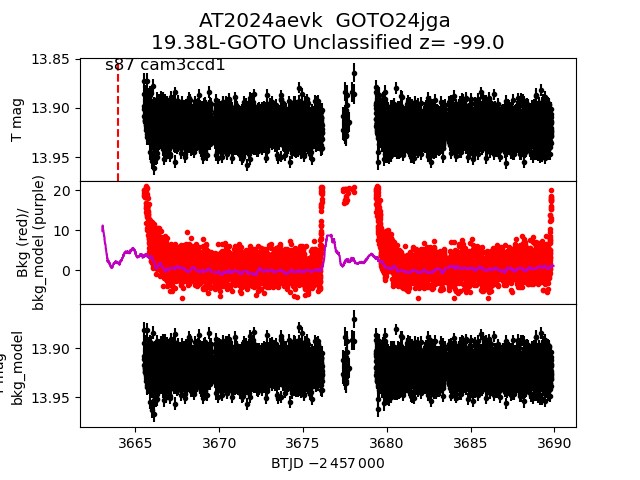
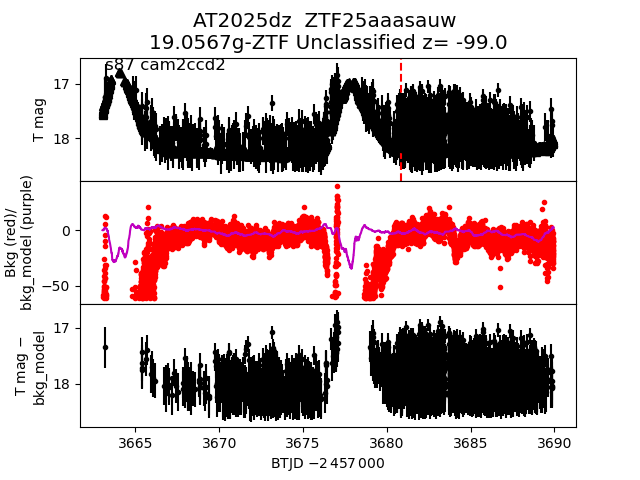
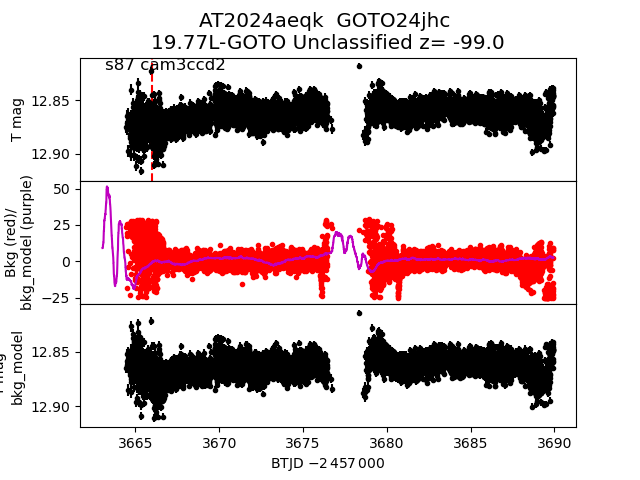
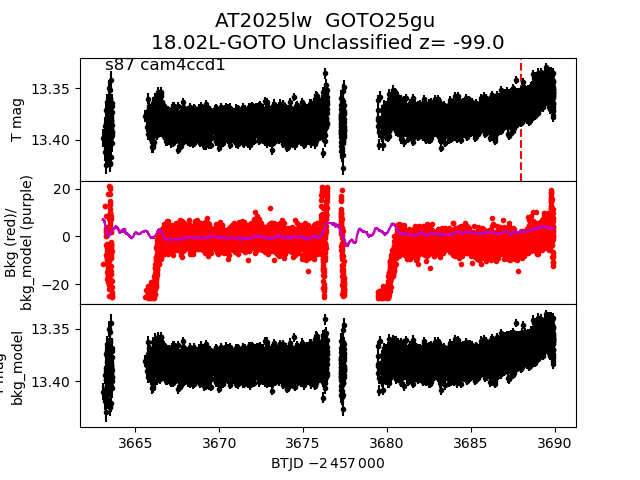
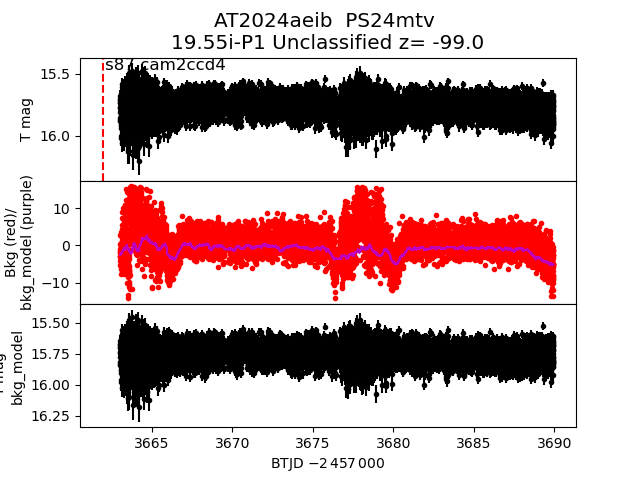
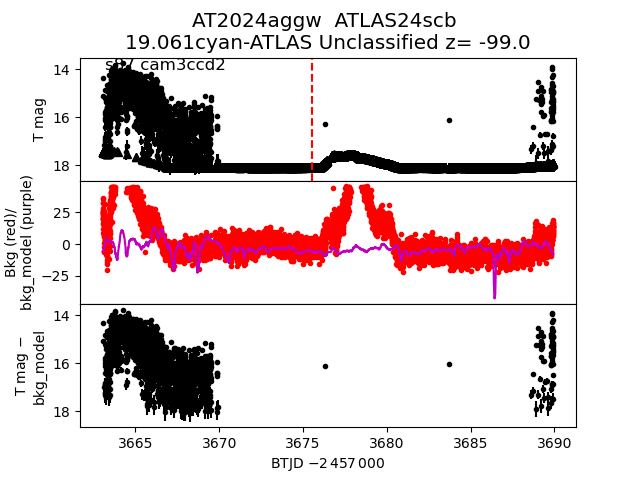
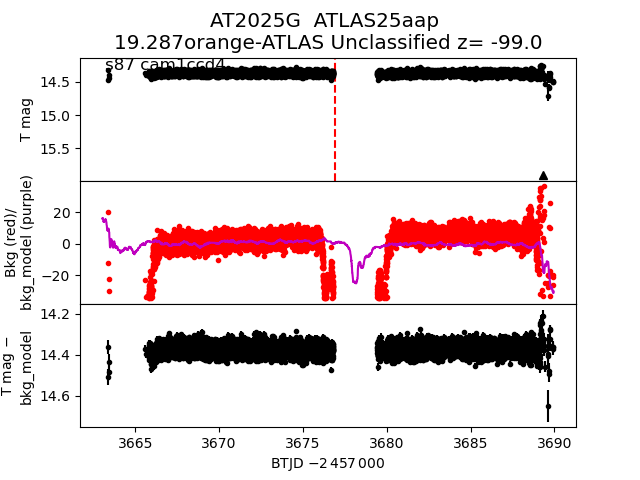
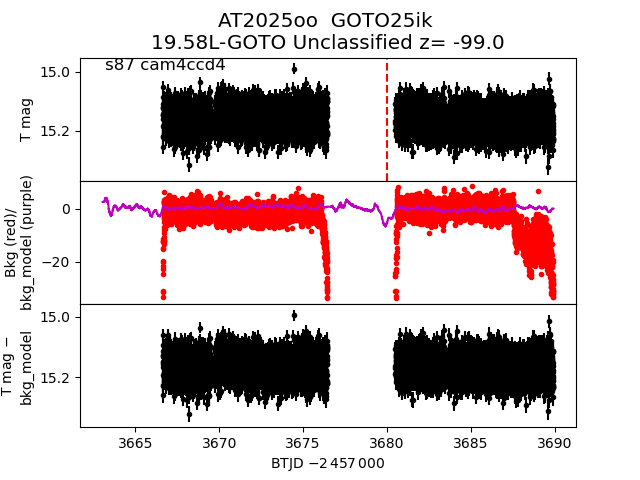
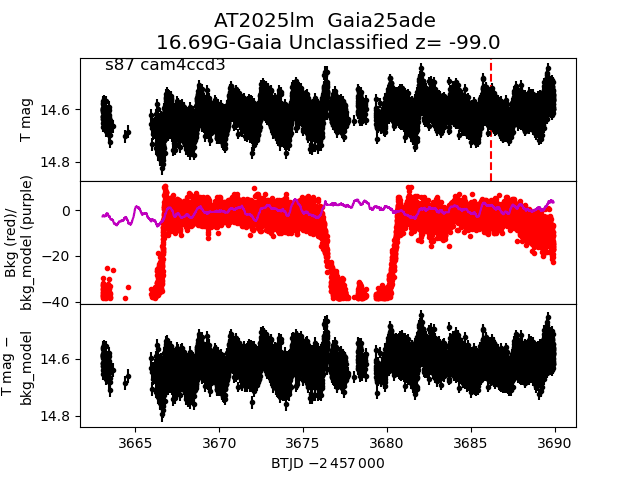
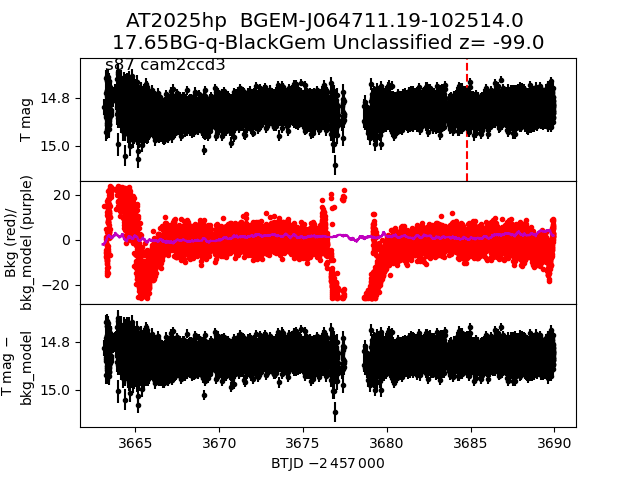
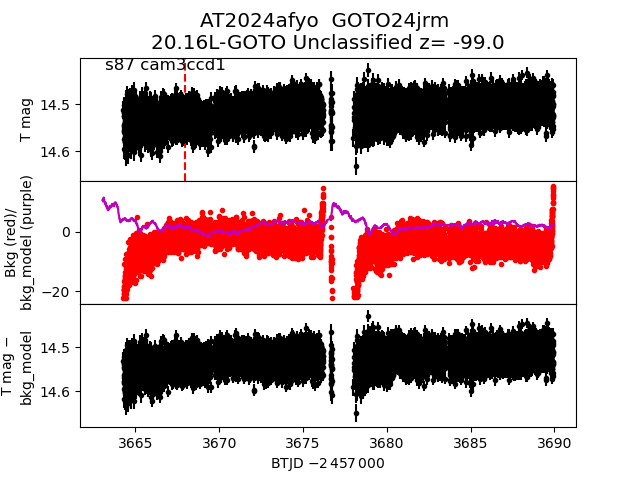
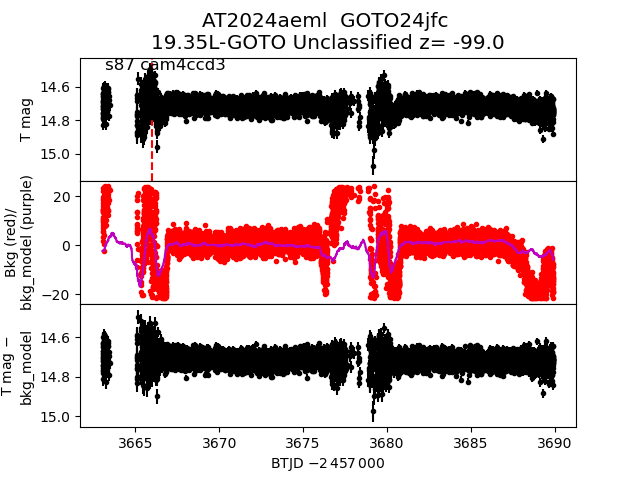
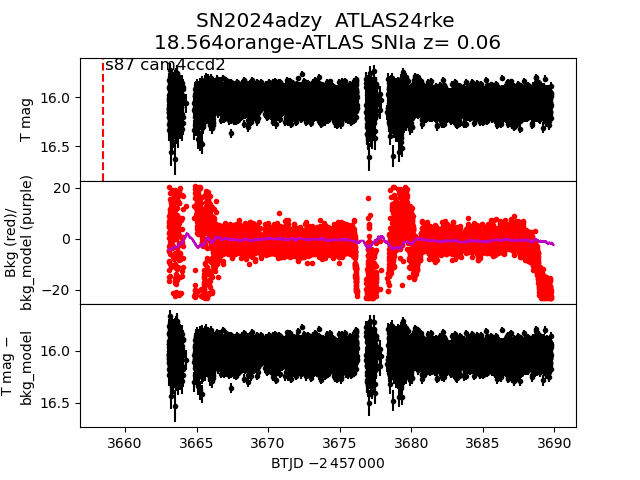
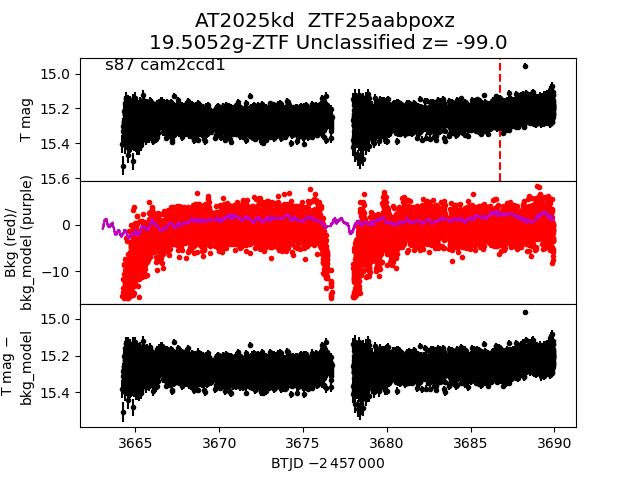
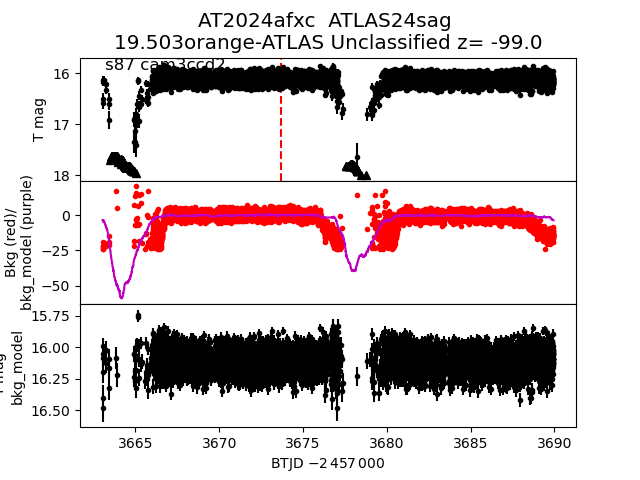
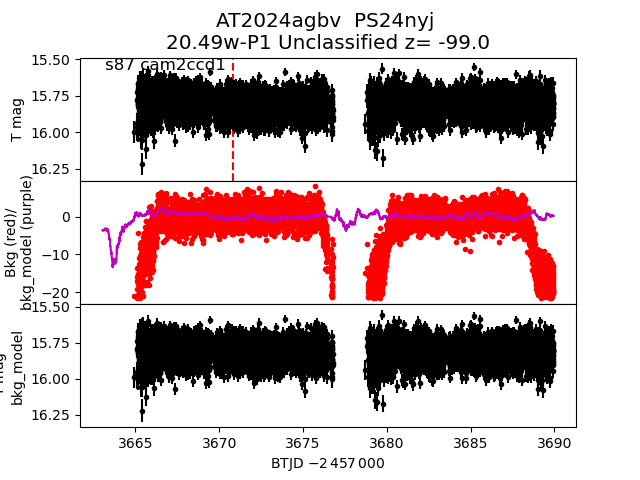
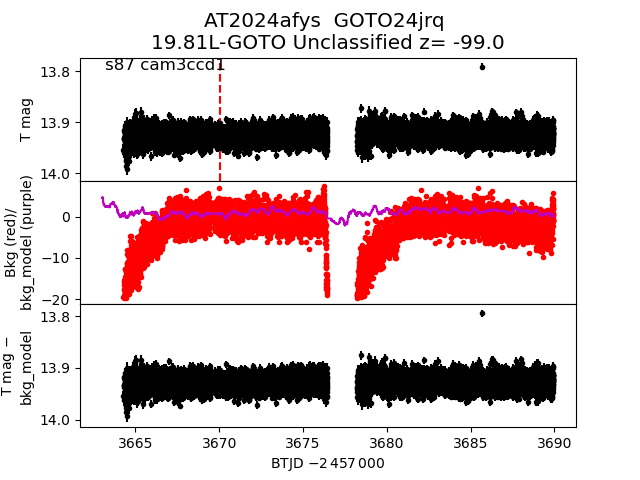
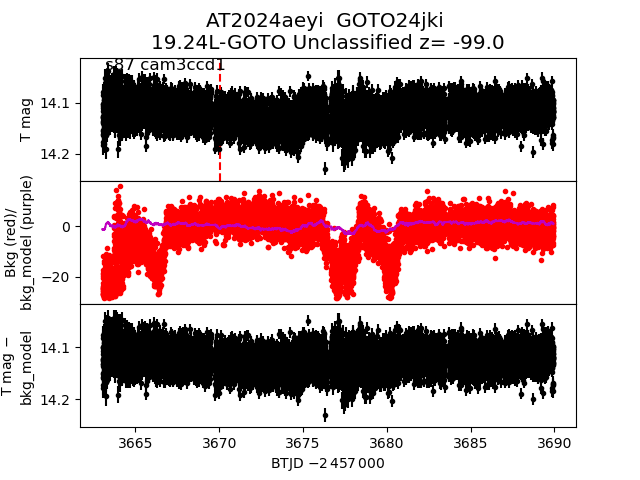
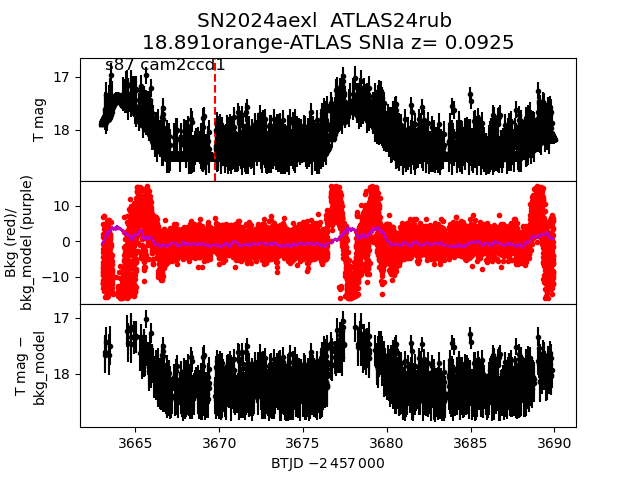
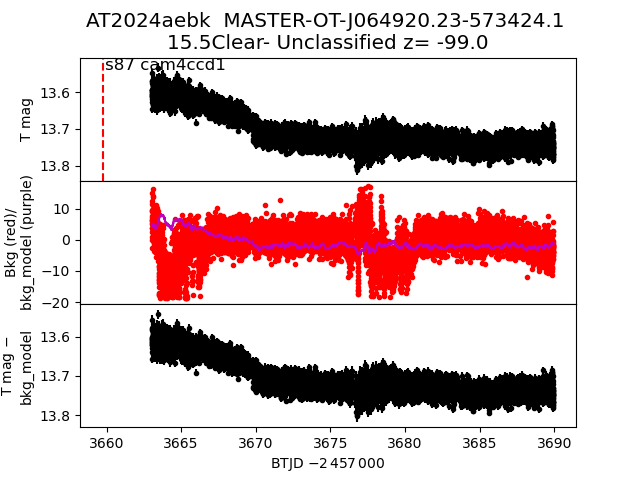
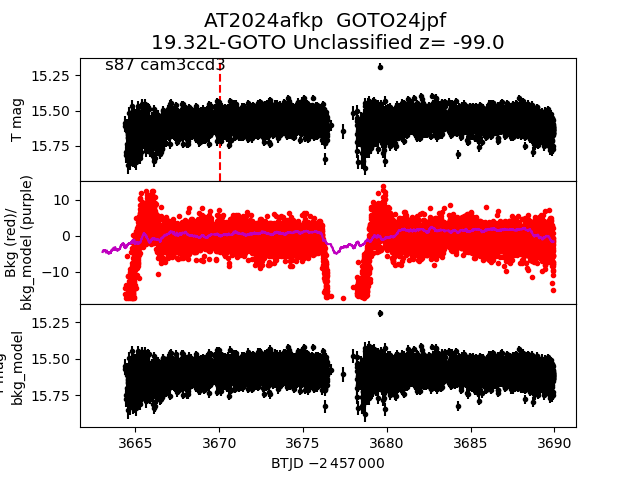
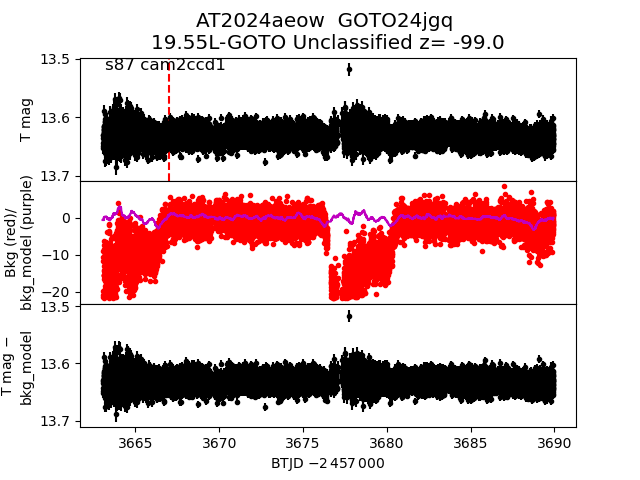
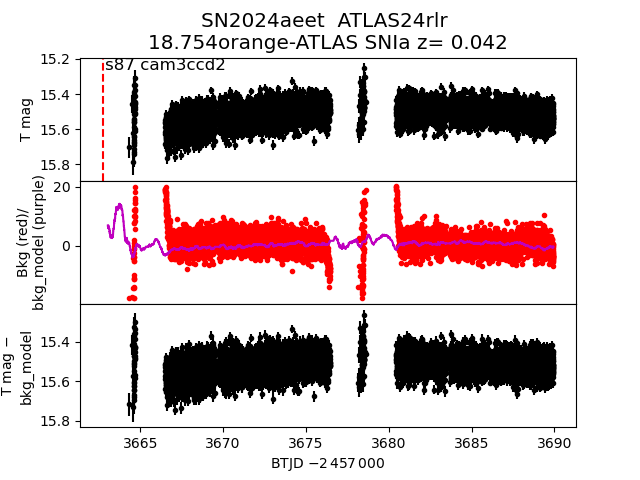
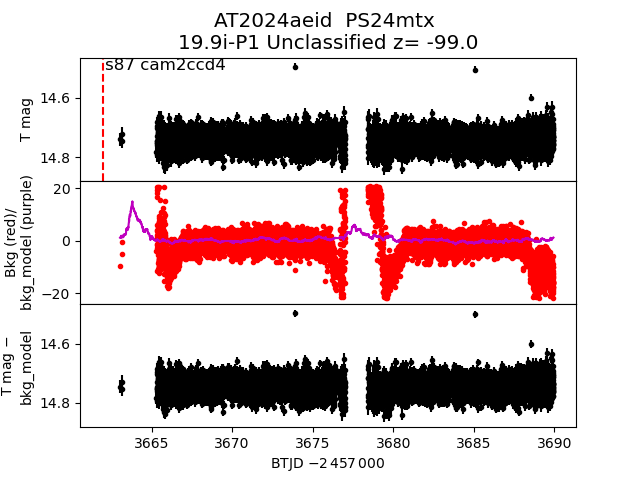
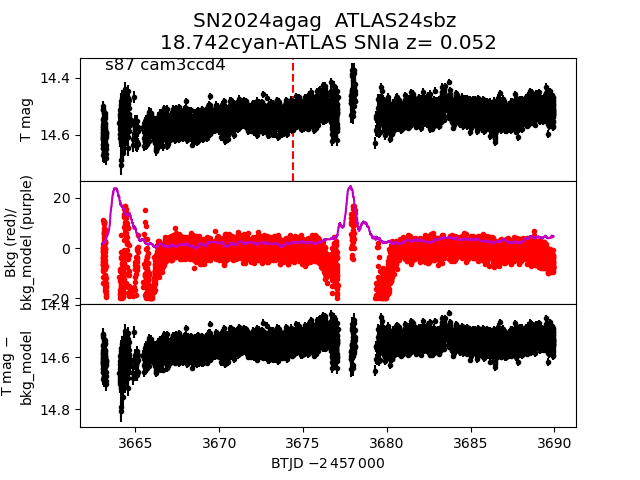
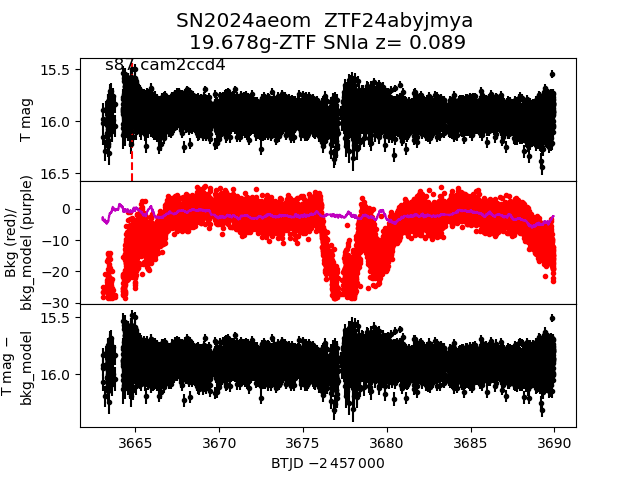
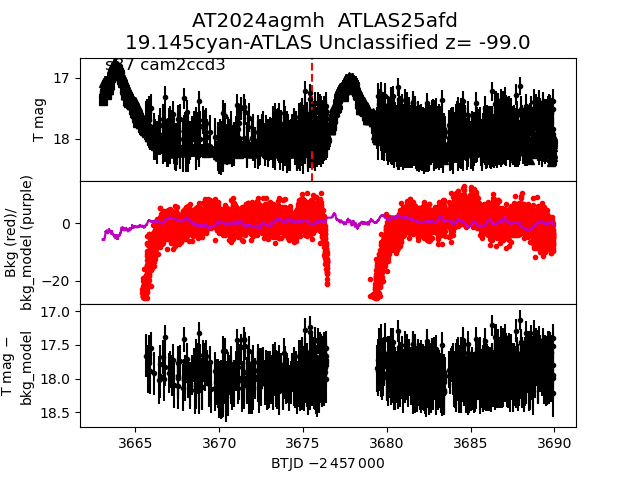
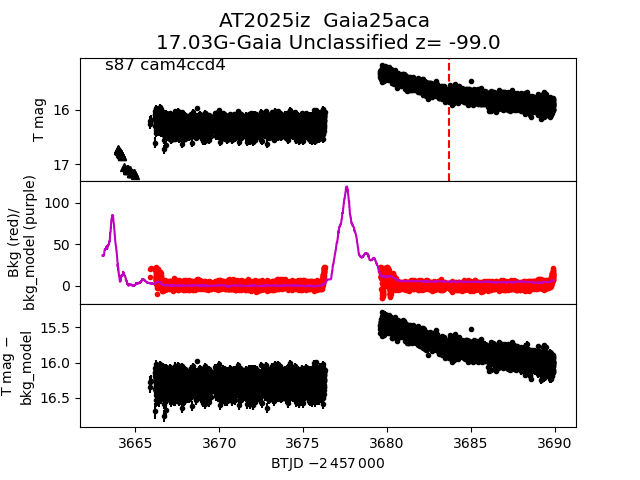
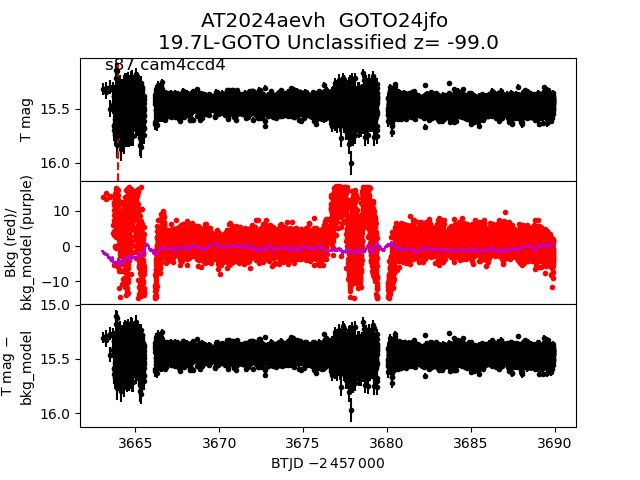
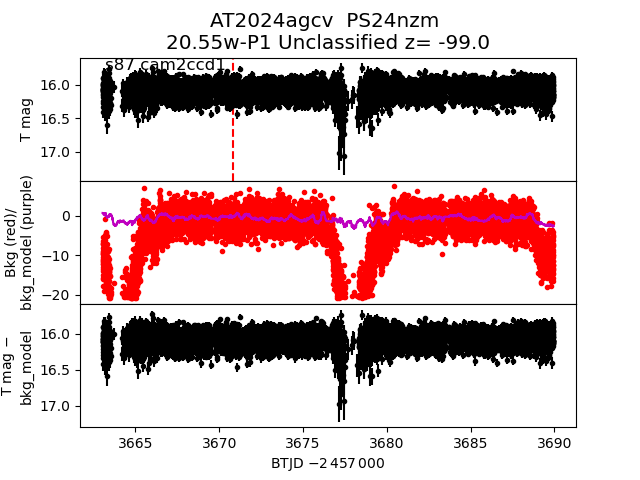
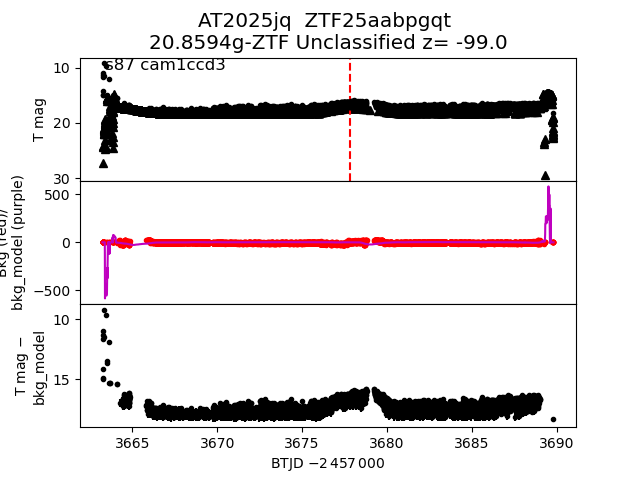
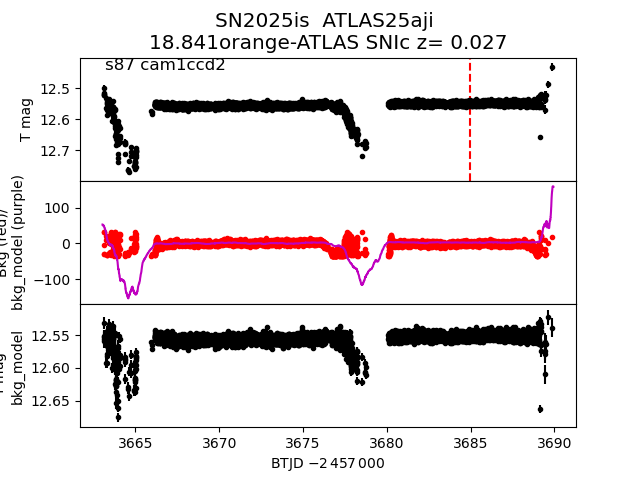
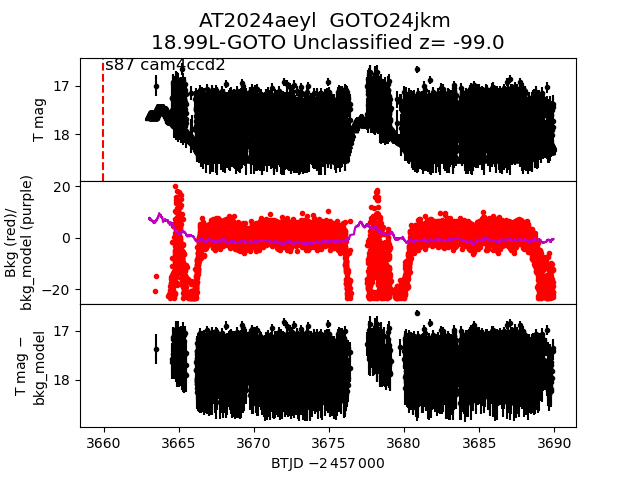
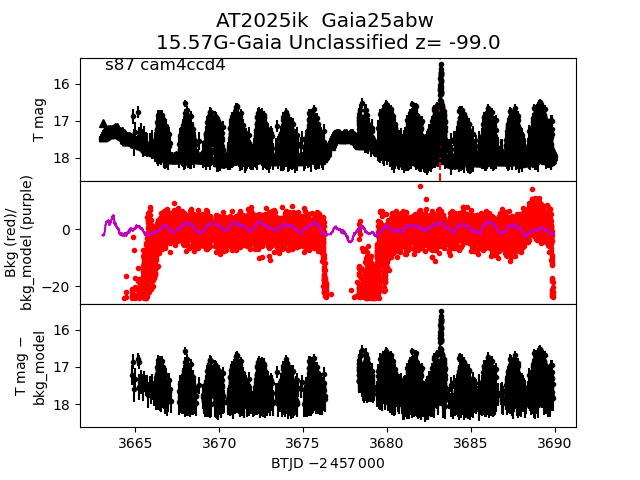
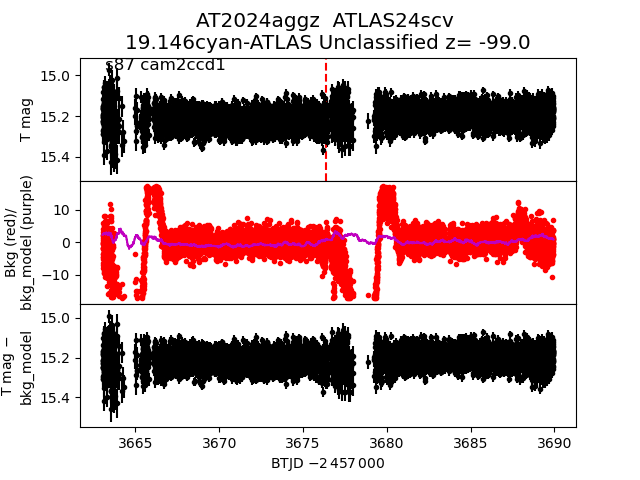
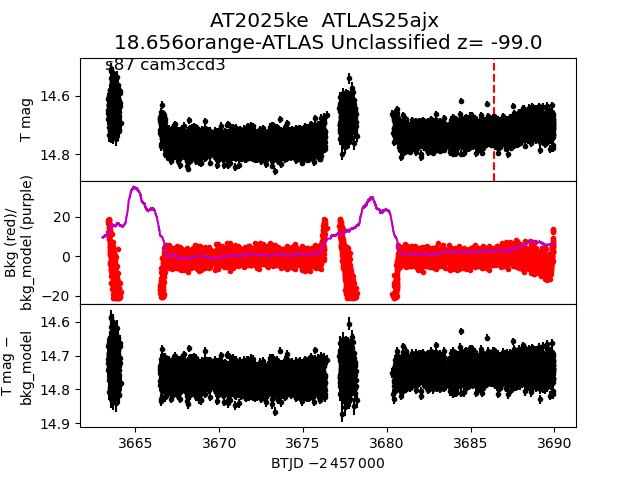
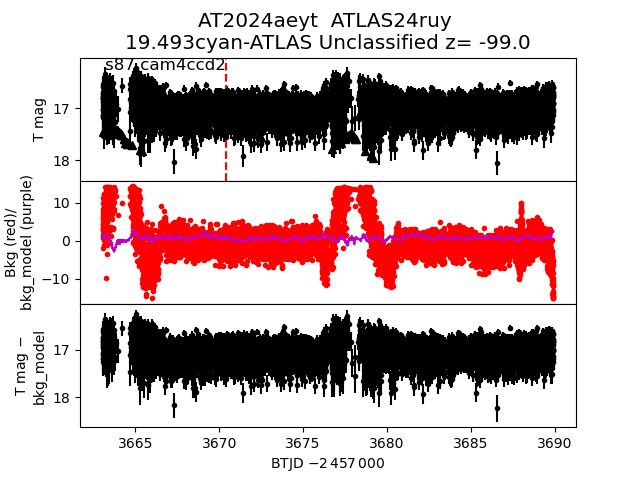
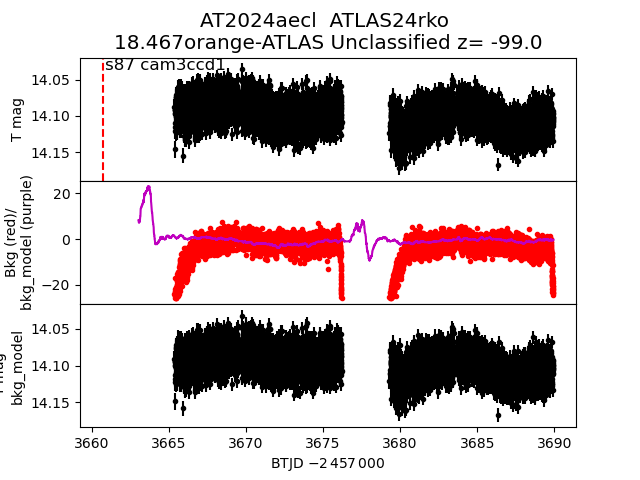
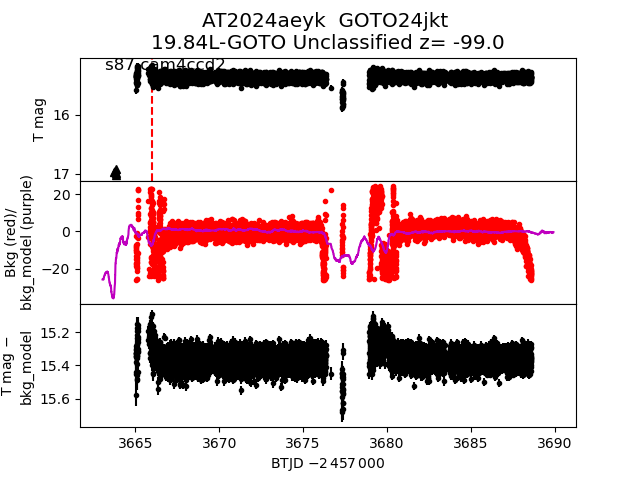
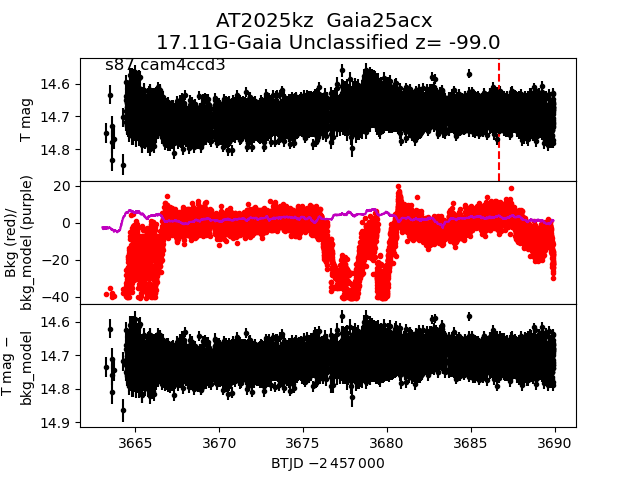
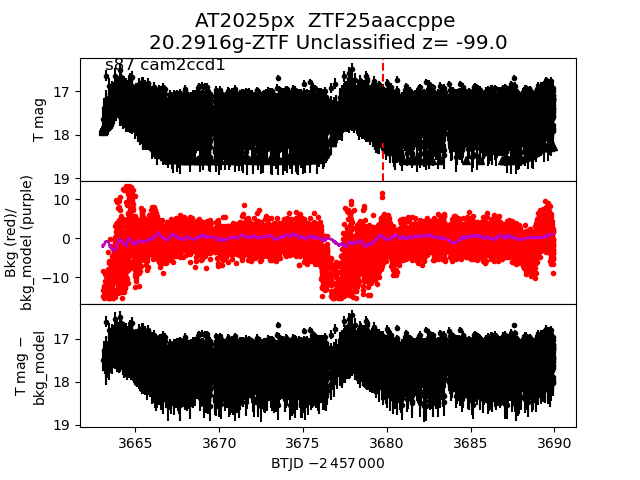
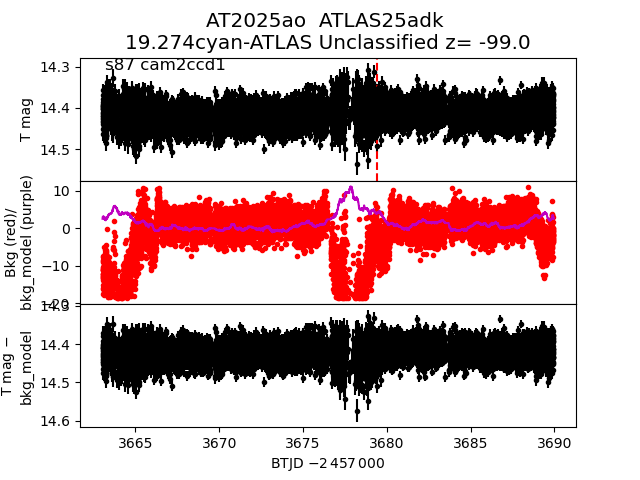
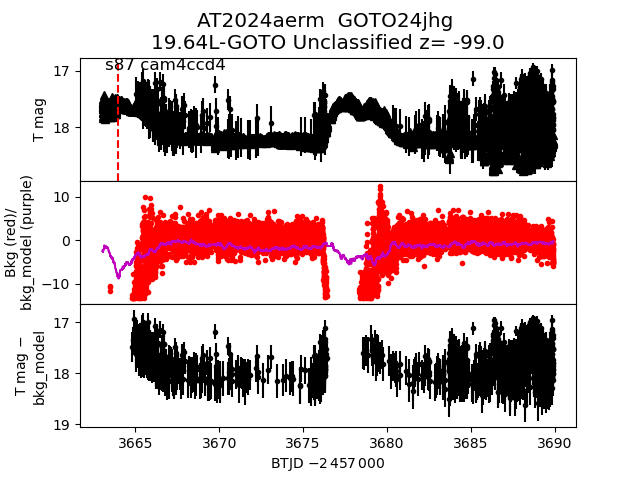
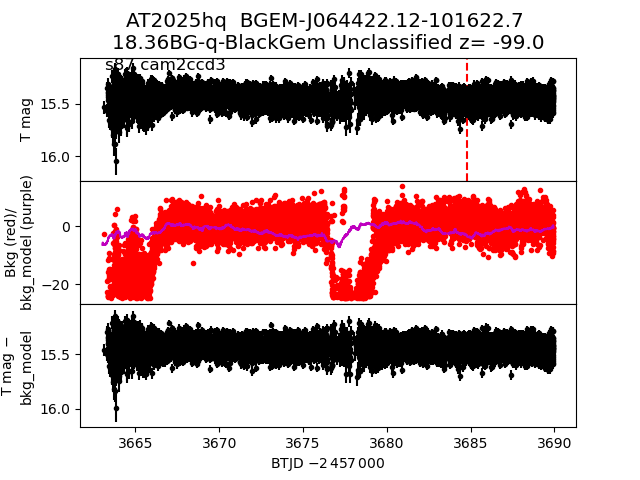
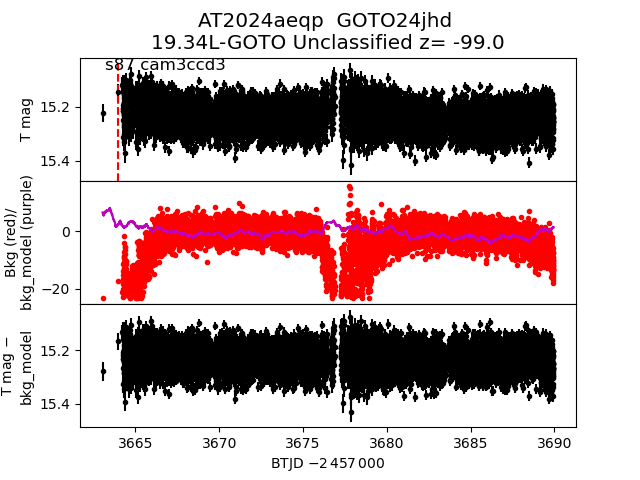
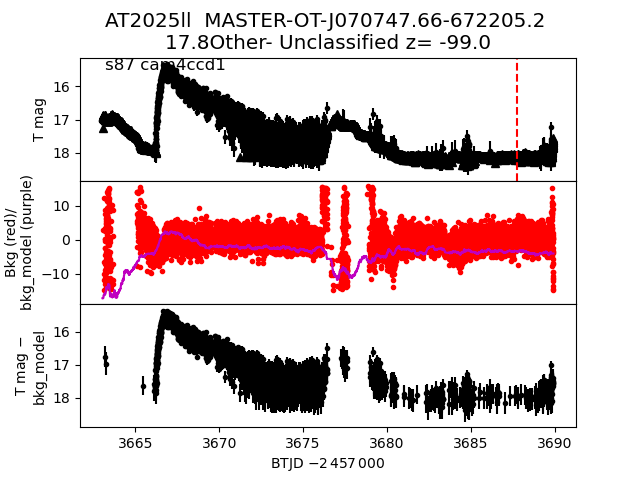
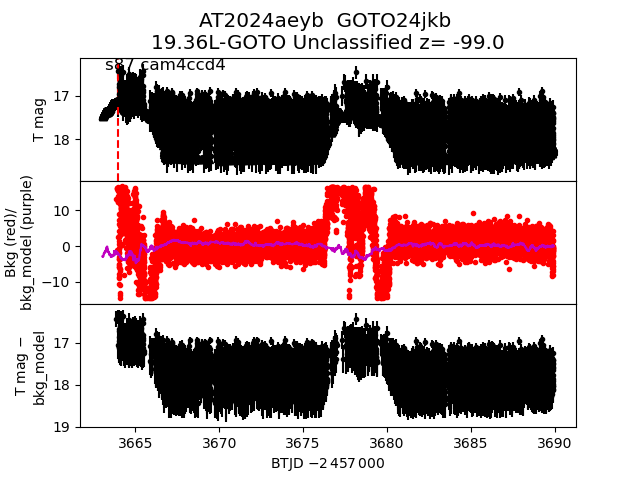
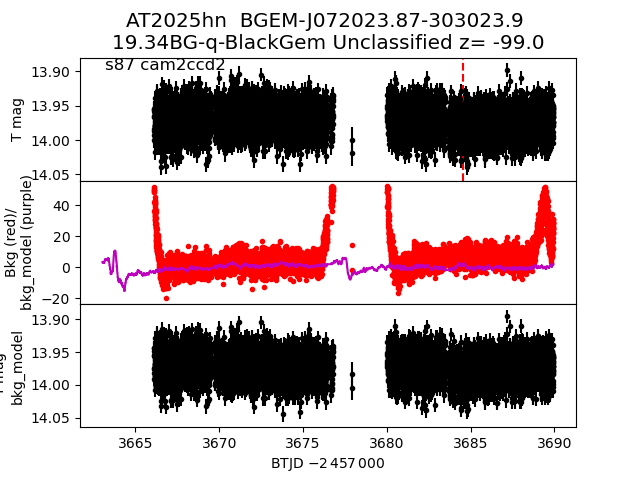
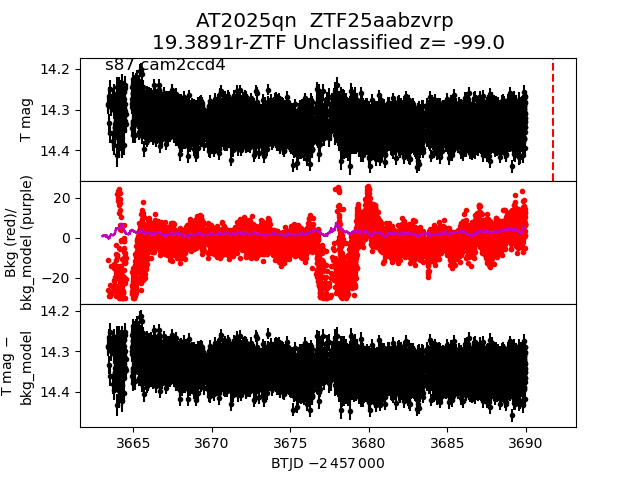
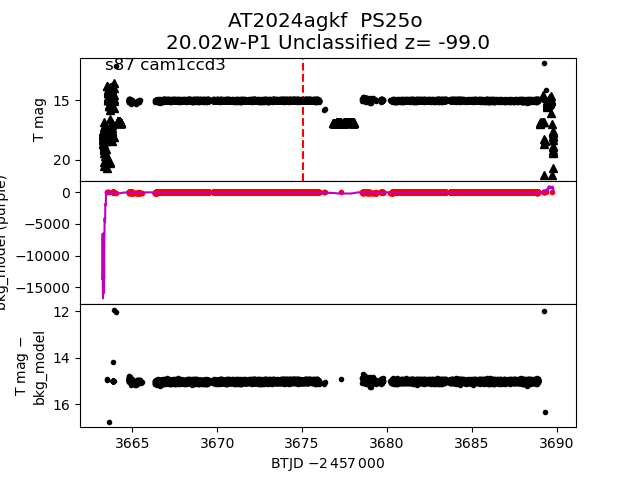
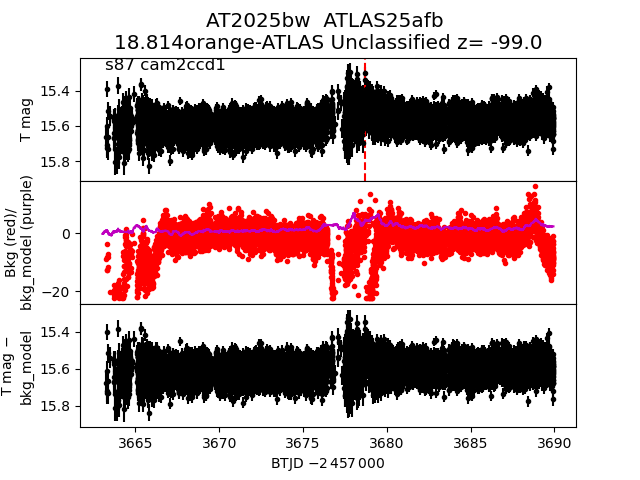
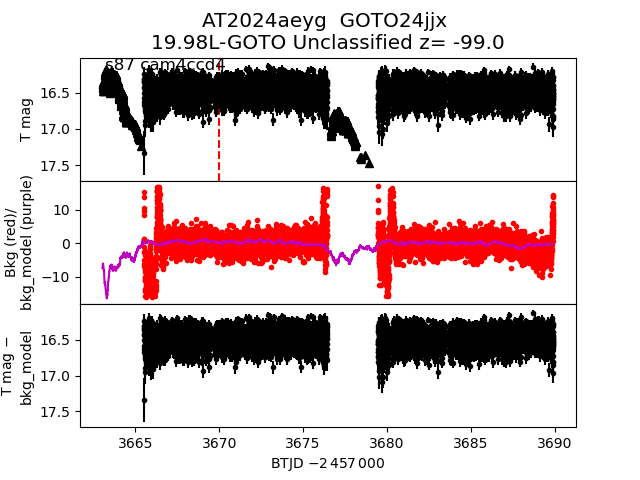
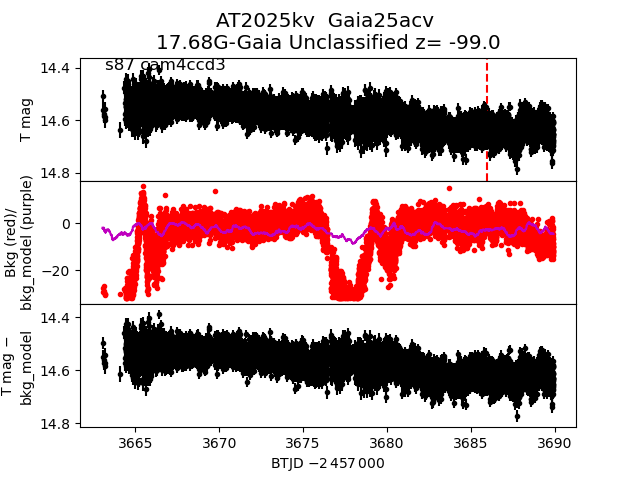
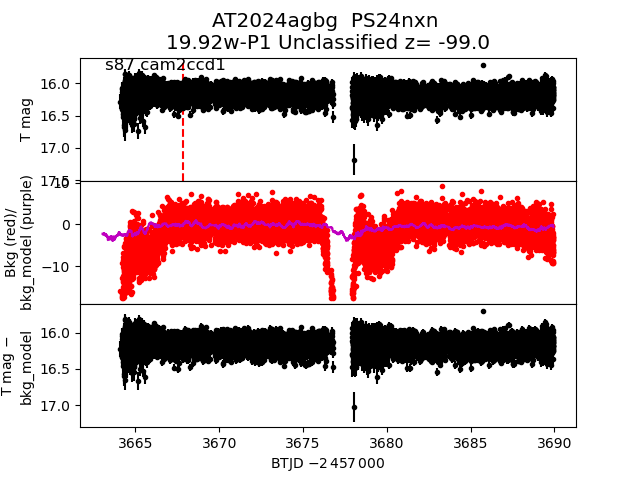
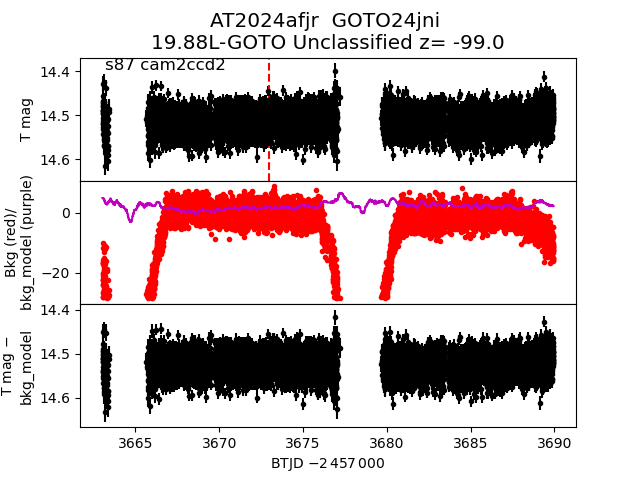
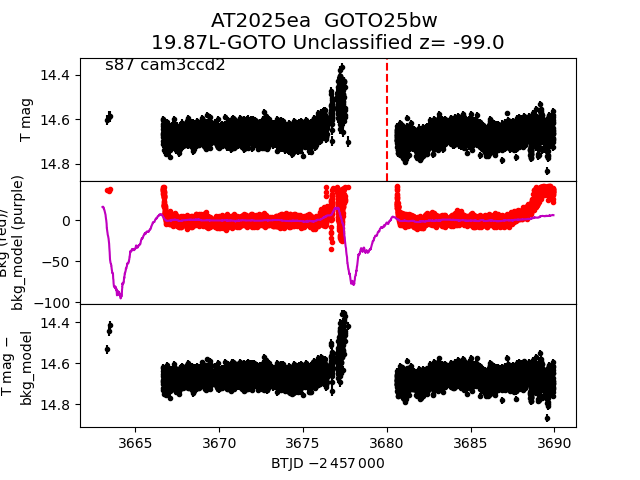
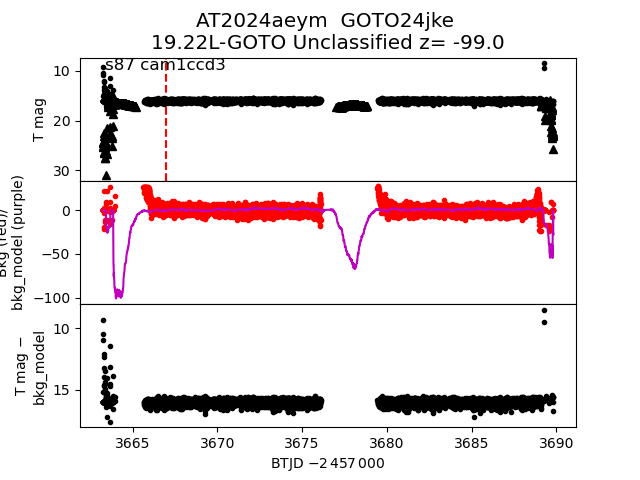
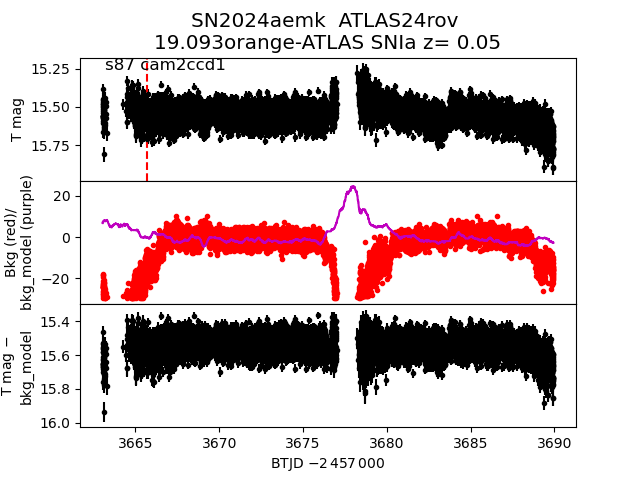
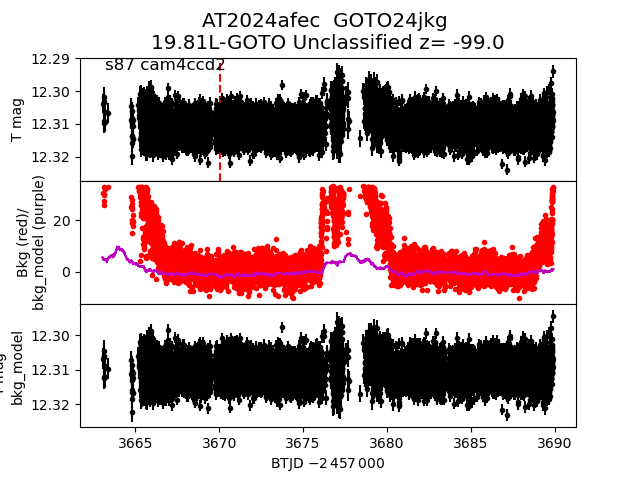
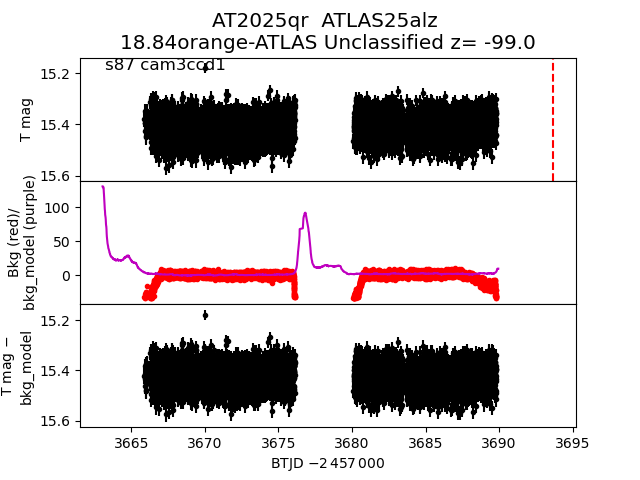
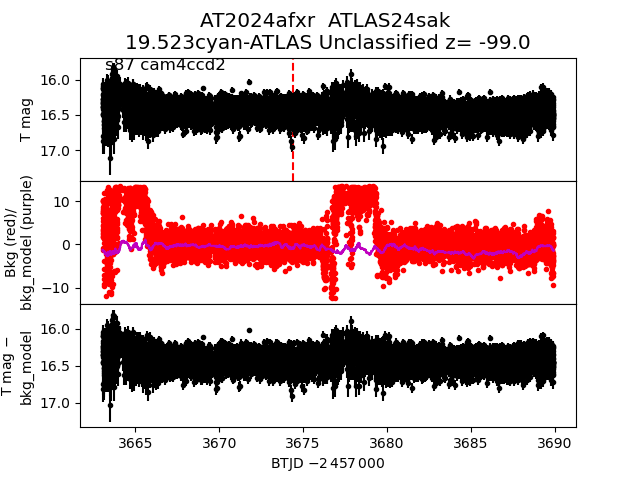
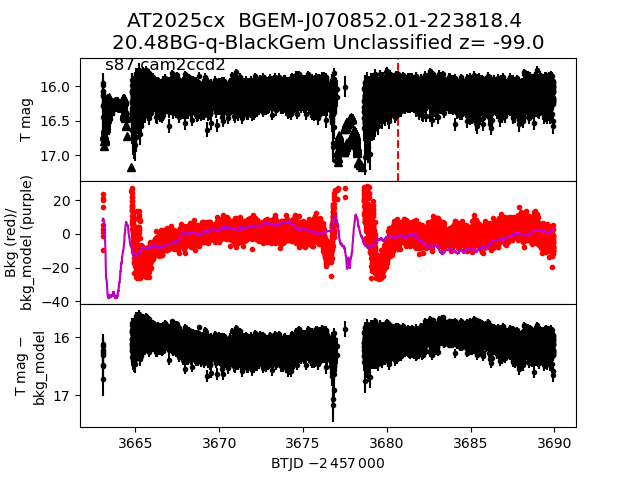
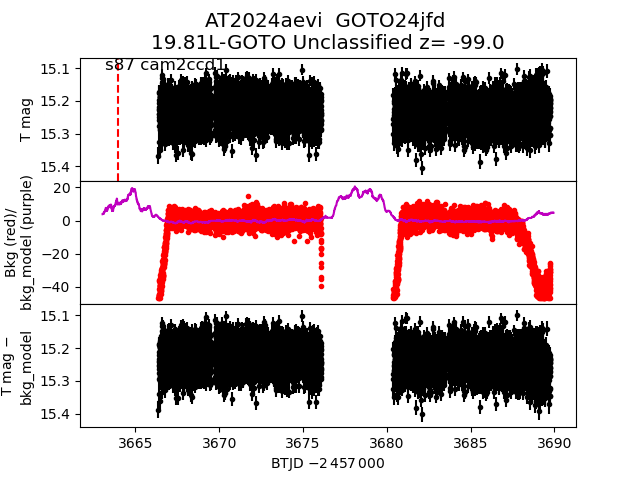
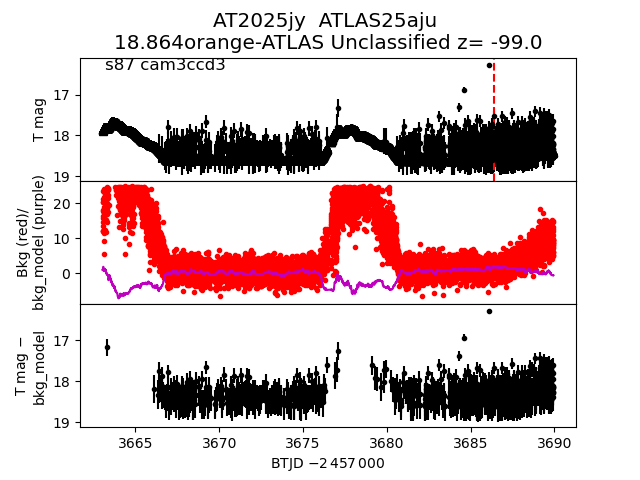
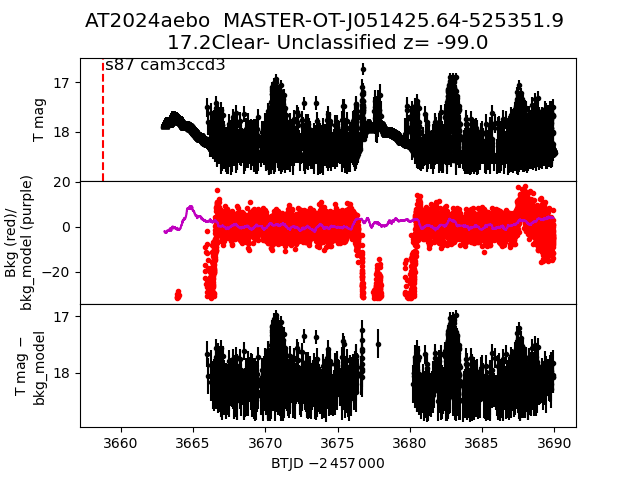
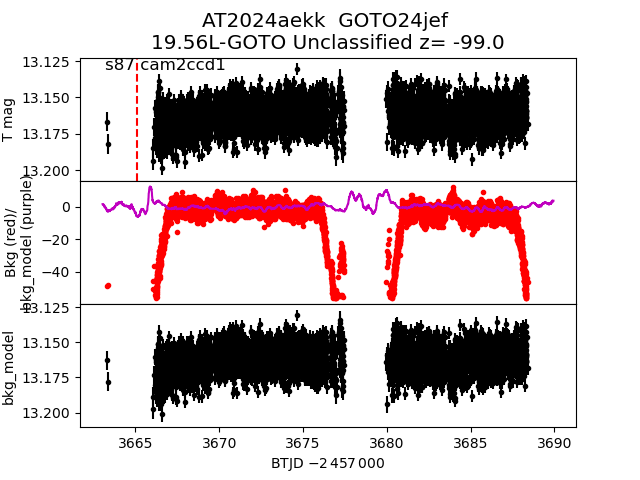
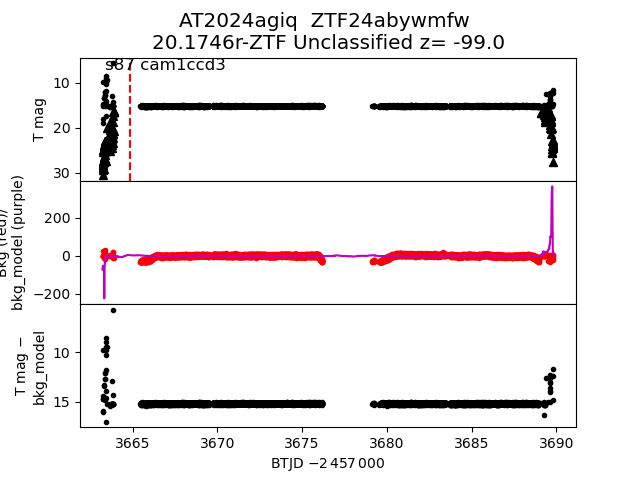
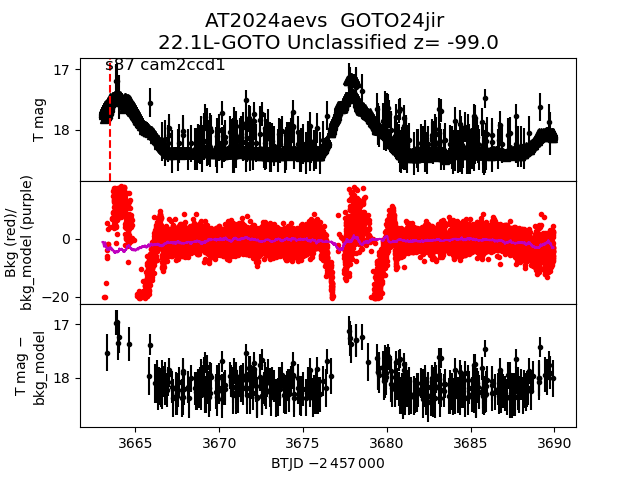
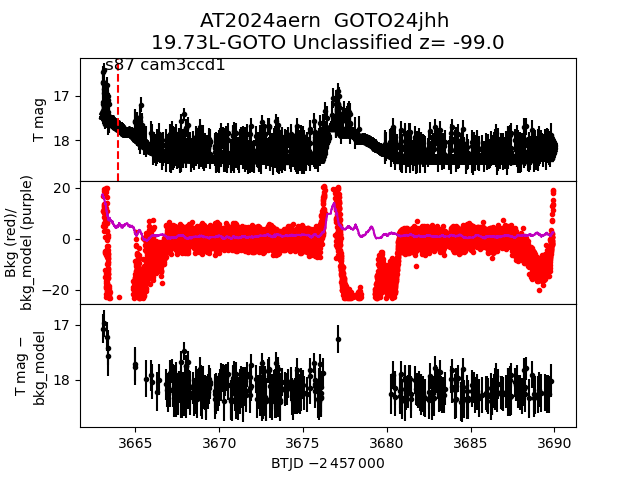
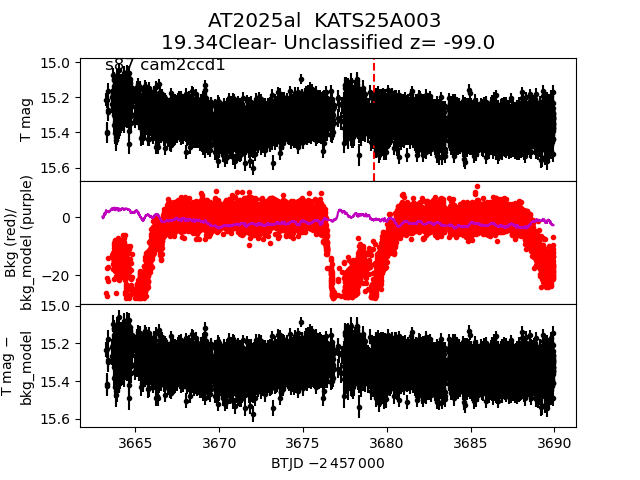
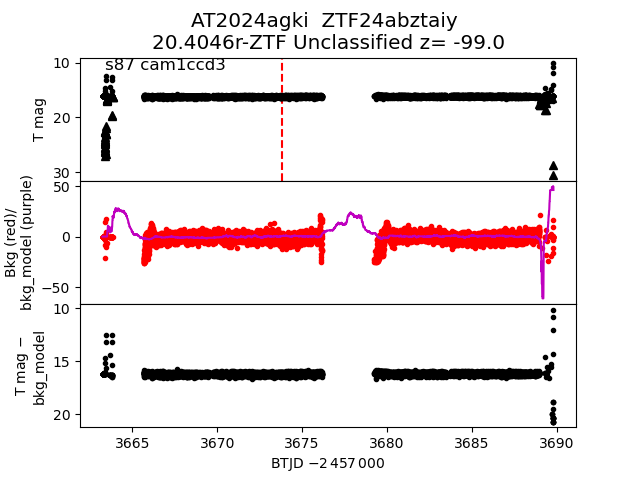
Each figure has three panels. The top panel shows the transient light curve, the middle panel shows the local background (estimated in an annulus), and the bottom panel shows a "background-model corrected" light curve. Details about the background model are in the README.
The vertical red line marks the time of discovery reported to TNS. Other useful metadata from TNS is in the figure title.
Note that the top and bottom panel are in magnitudes, while the middle panel is in differential flux units. The magnitudes are calibrated to the flux in the reference image used for image subtraction. Thus, flux from the host galaxy is included in these magnitudes.
3-sigma upper limits are plotted as triangles with no errorbars. A typical limiting magnitude is 19.6 in 30 minutes or 18.4 in 200 seconds (for low backgrounds).
The links allow you to download the light curve data as a text file.
More details in the README.
2024aekl
 2024agoe
 2024aevk
 2025dz
 2024aeqk
 2025lw
 2024aeib
 2024aggw
 2025G
2025G
 2025oo
 2025lm
 2025hp
 2024afyo
 2024aeml
 2024adzy
 2025kd
 2024afxc
 2024agbv
 2024afys
 2024aeyi
 2024aexl
 2024aebk
 2024afkp
 2024aeow
 2024aeet
 2024aeid
 2024agag
 2024aeom
 2024agmh
 2025iz
 2024aevh
 2024agcv
 2025jq
 2025is
 2024aeyl
 2025ik
 2024aggz
 2025ke
 2024aeyt
 2024aecl
 2024aeyk
 2025kz
 2025px
 2025ao
 2024aerm
 2025hq
 2024aeqp
 2025ll
 2024aeyb
 2025hn
 2025qn
 2024agkf
 2025bw
 2024aeyg
 2025kv
 2024agbg
 2024afjr
 2025ea
 2024aeym
 2024aemk
 2024afec
 2025qr
 2024afxr
 2025cx
 2024aevi
 2025jy
 2024aebo
 2024aekk
 2024agiq
 2024aevs
 2024aern
 2025al
 2024agki
 2024agrs