all transients in sector86 (81 total)
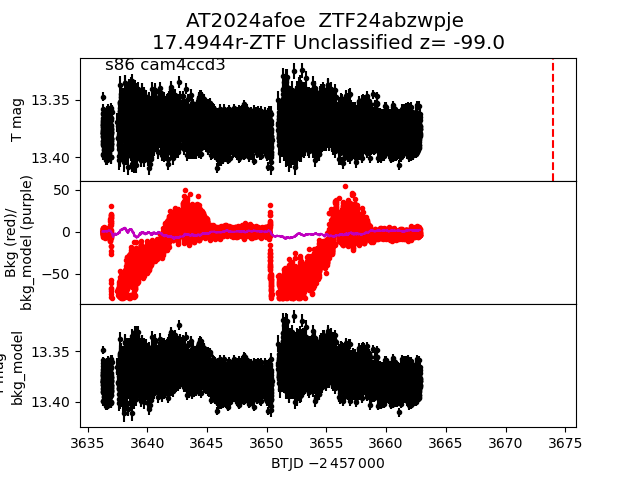
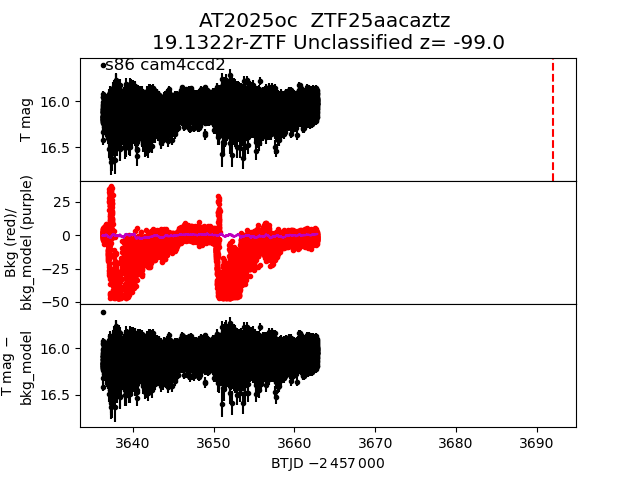
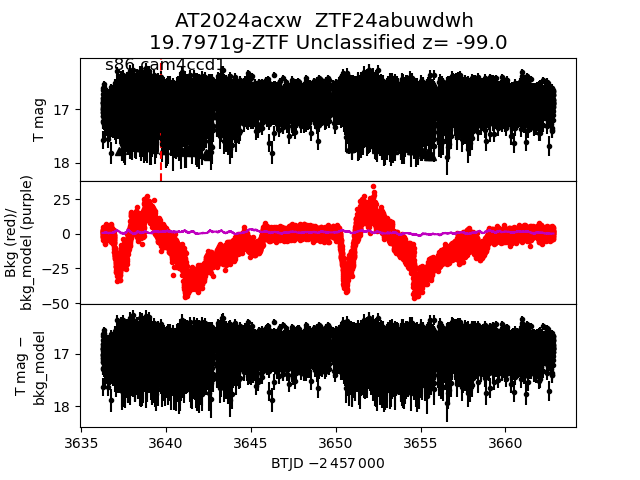
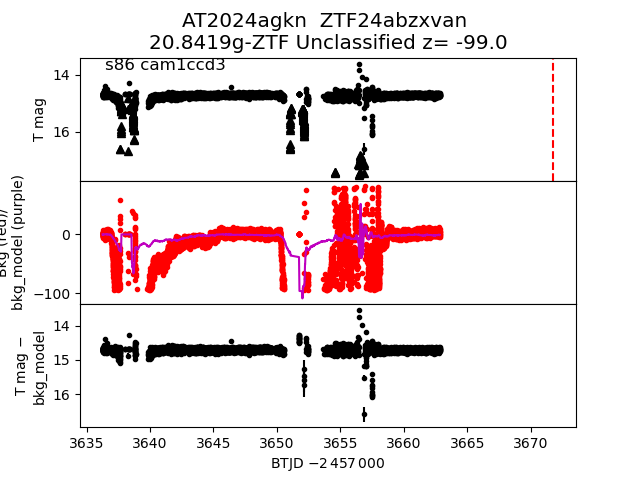
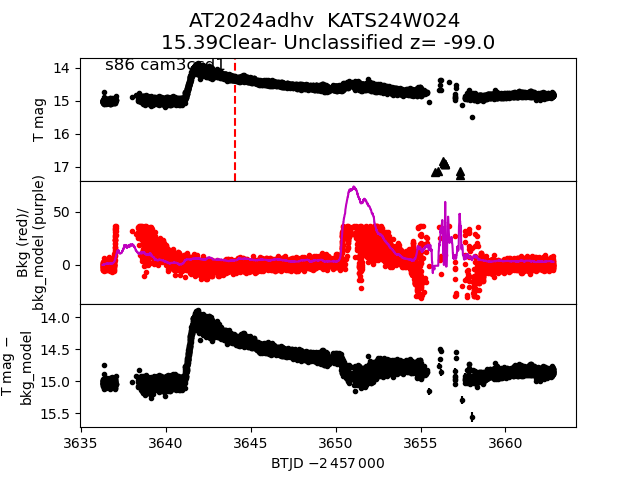
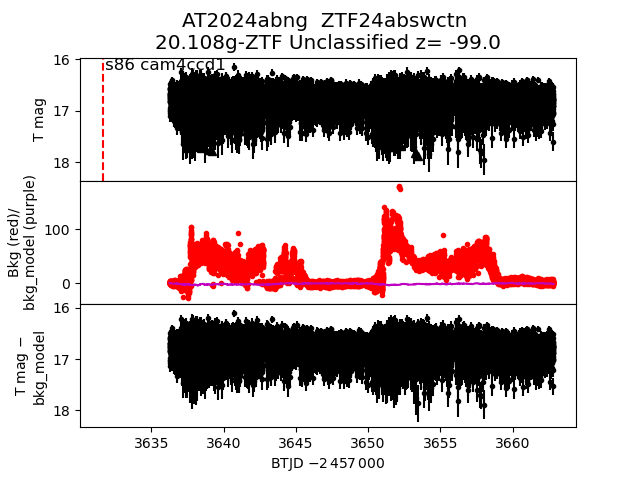
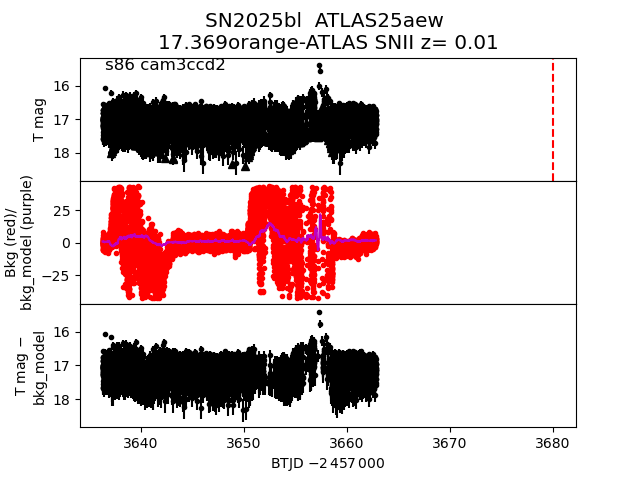
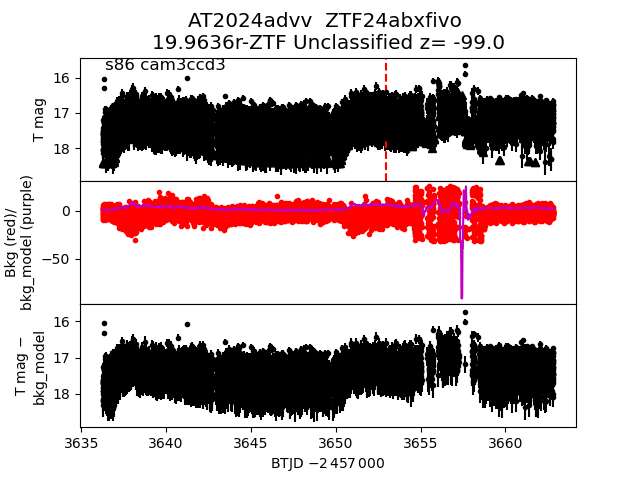
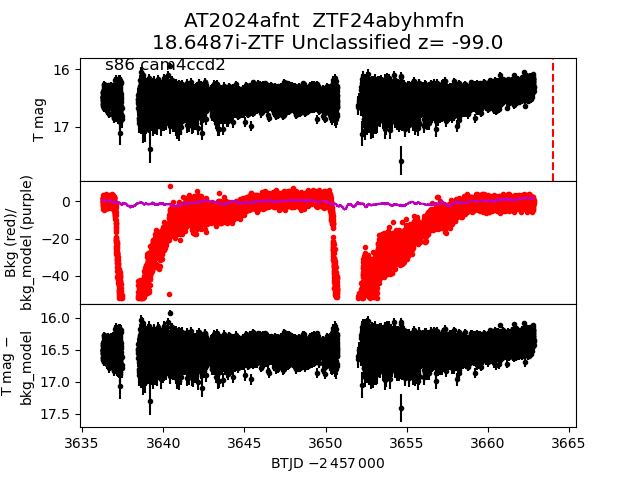
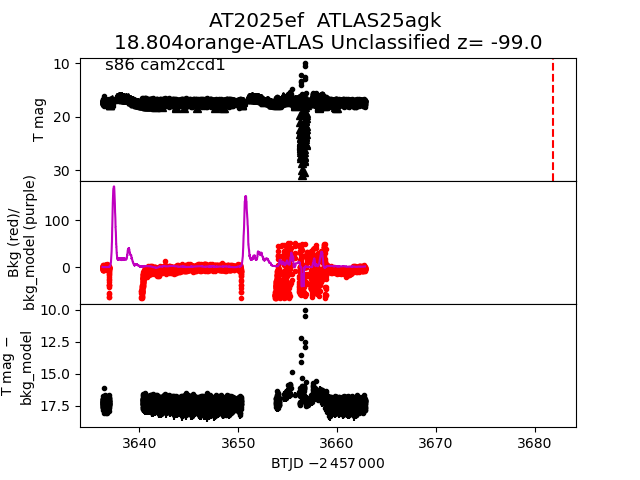
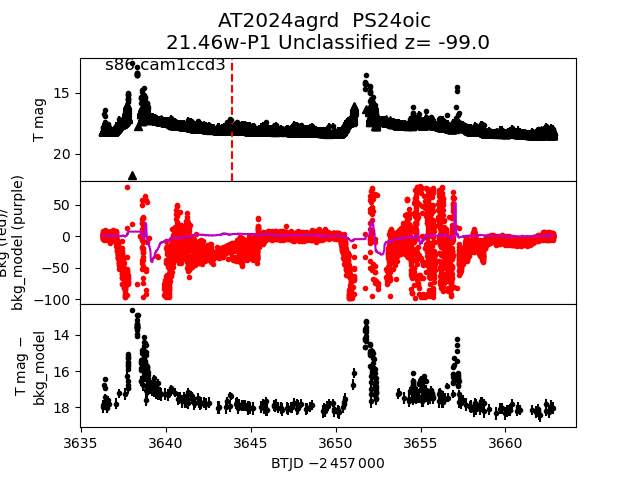
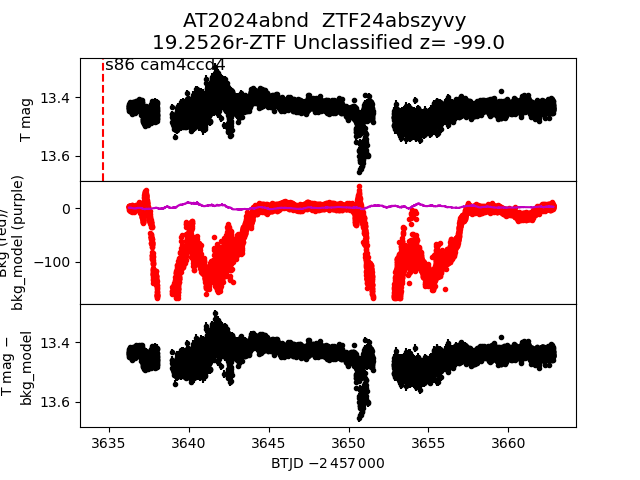
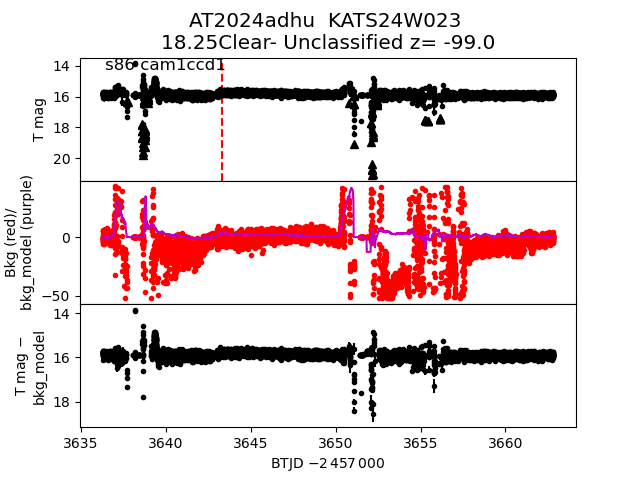
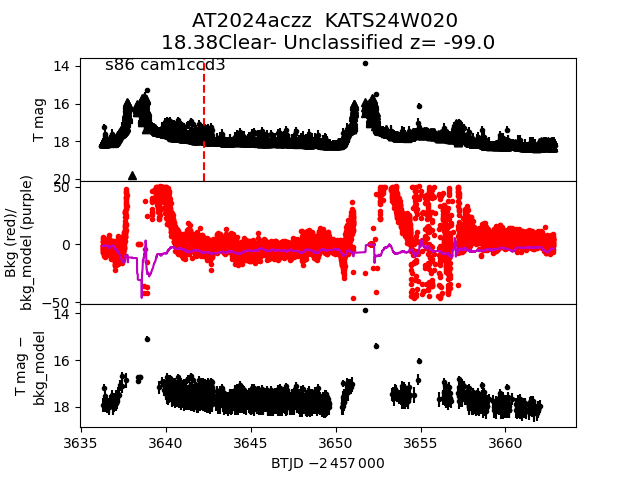
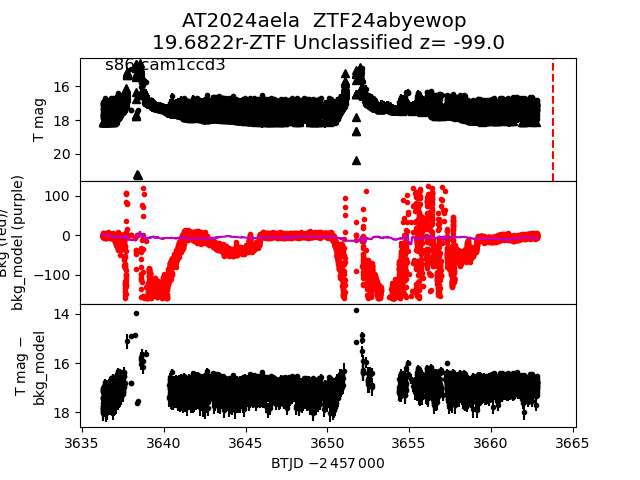
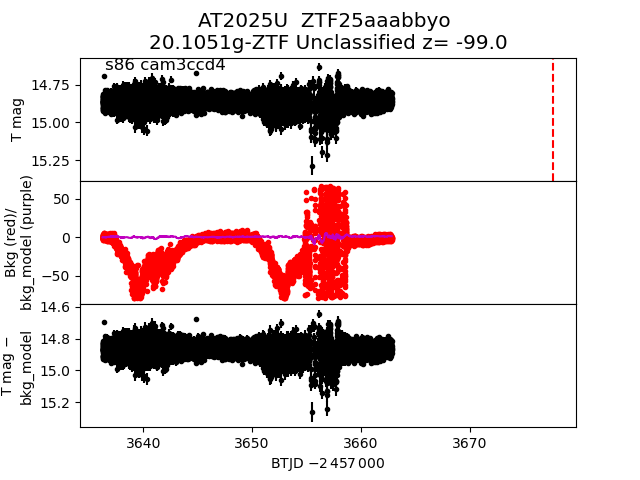
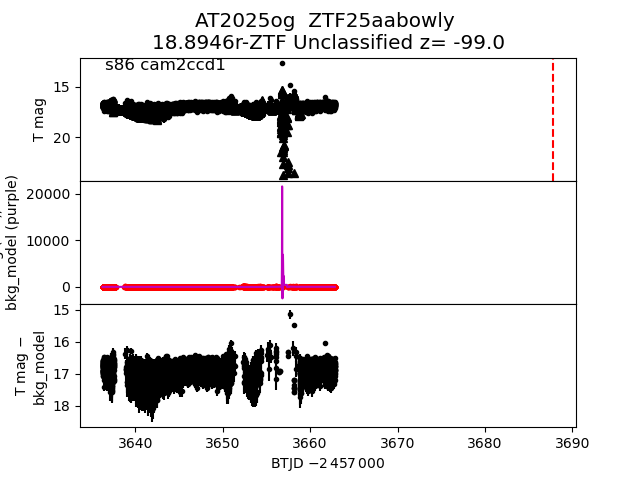
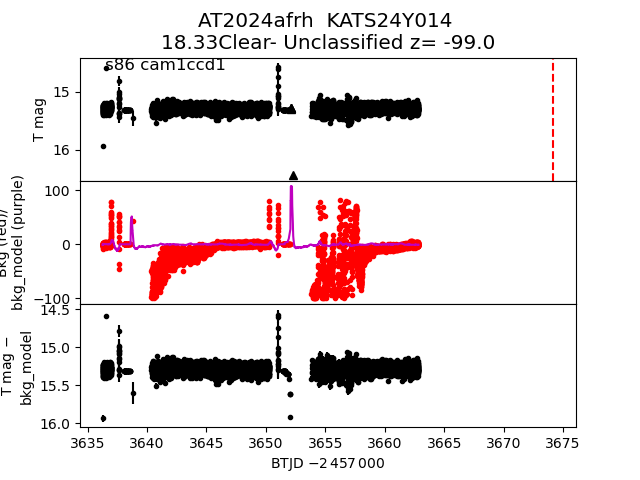
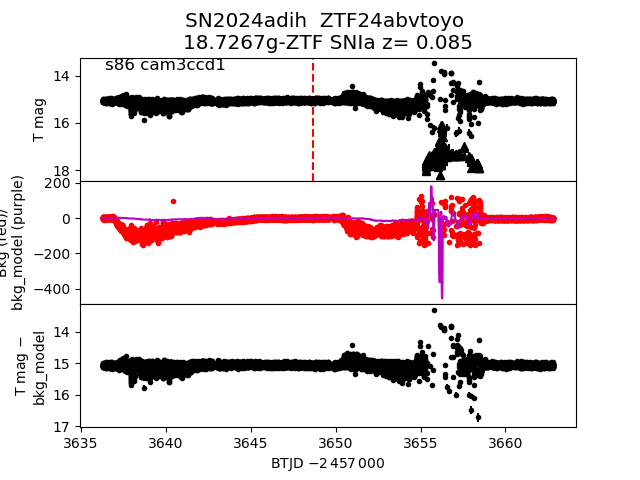
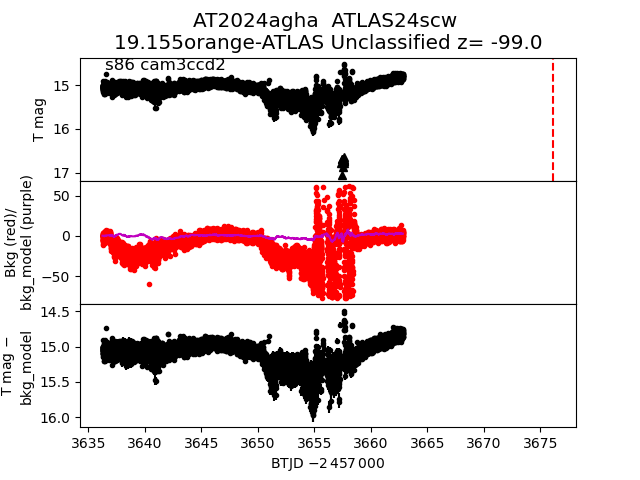
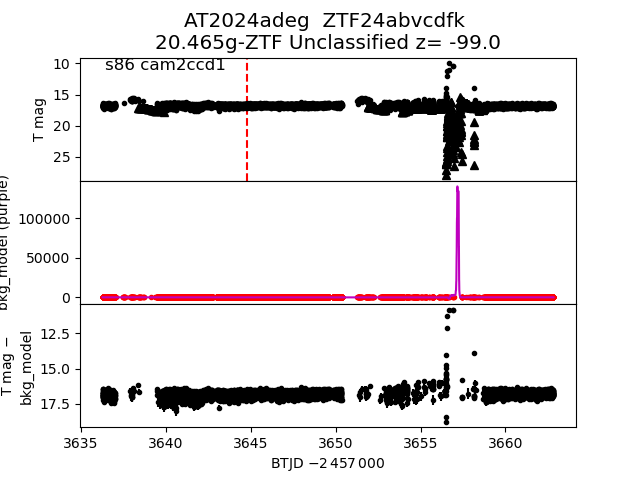
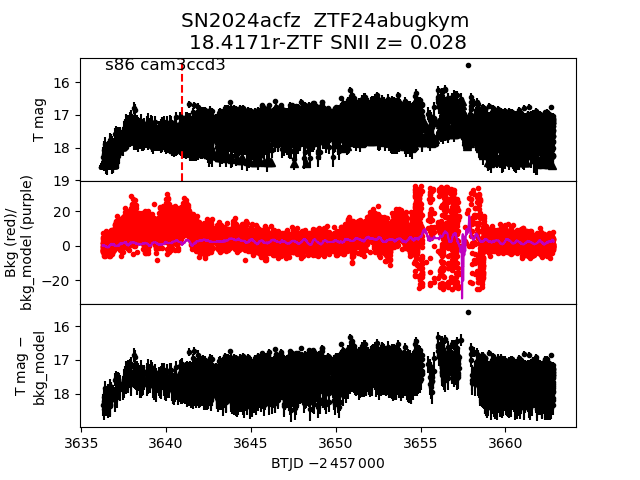
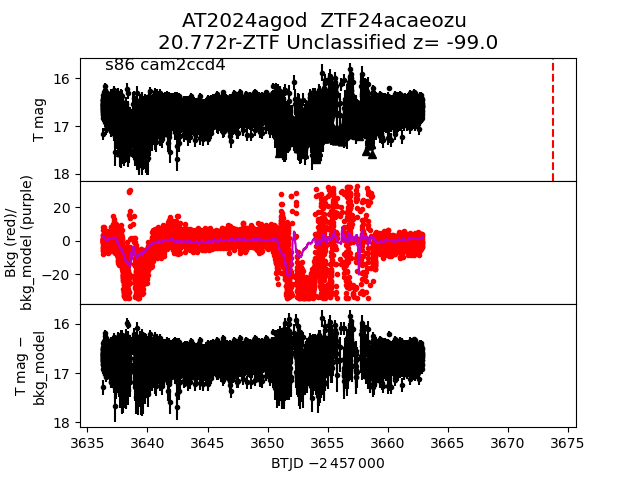
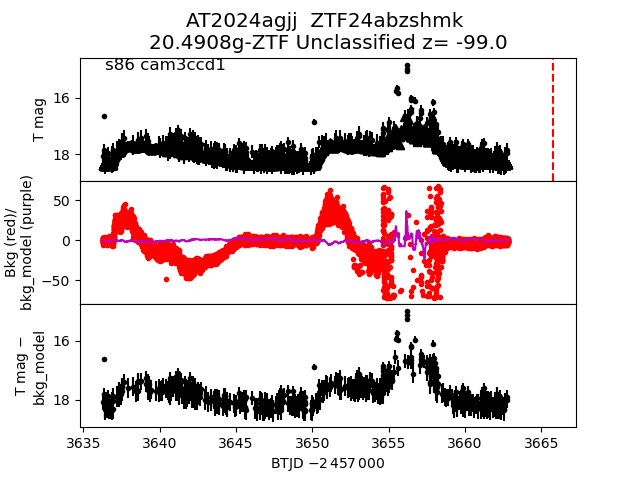
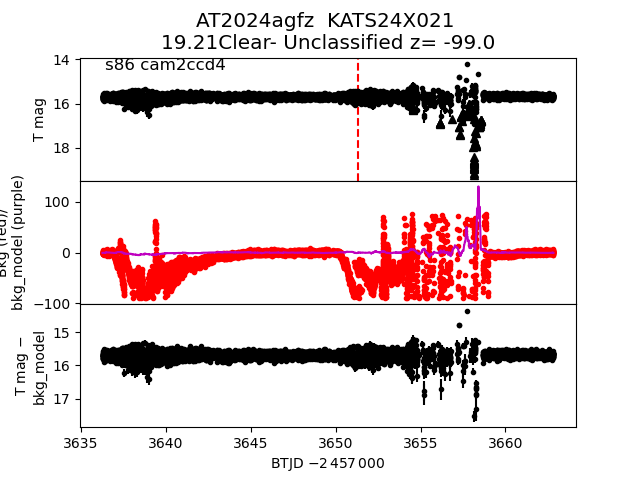
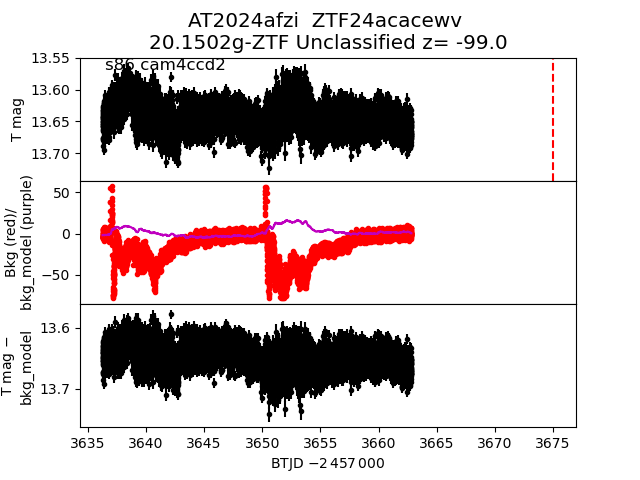
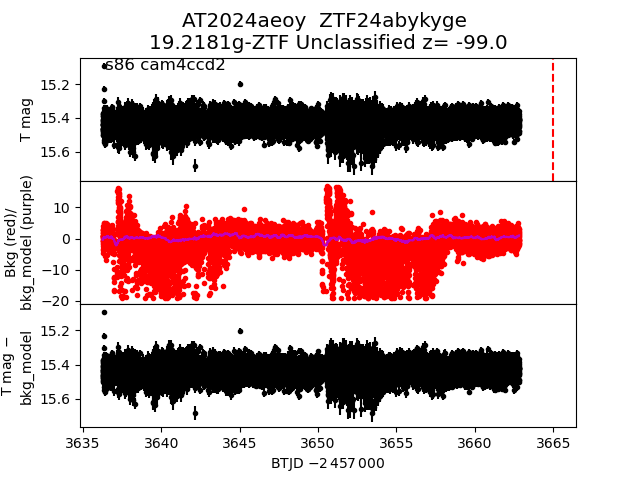
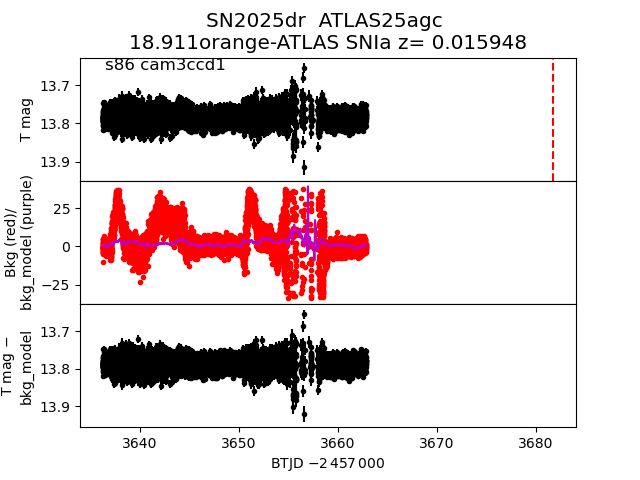
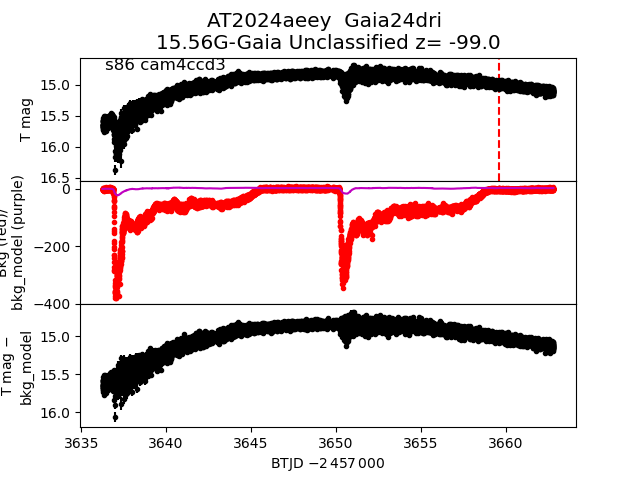
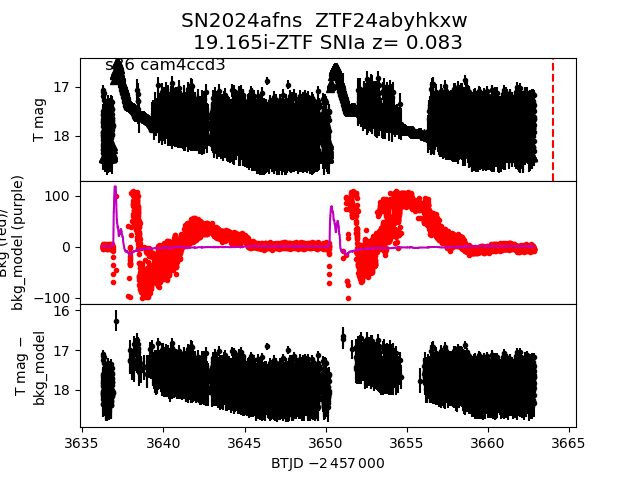
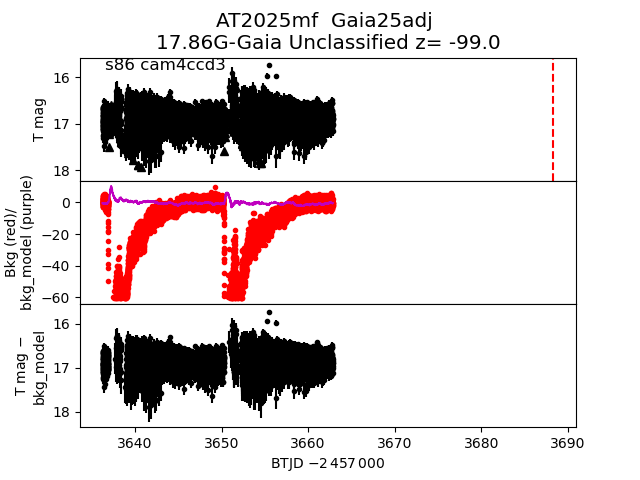
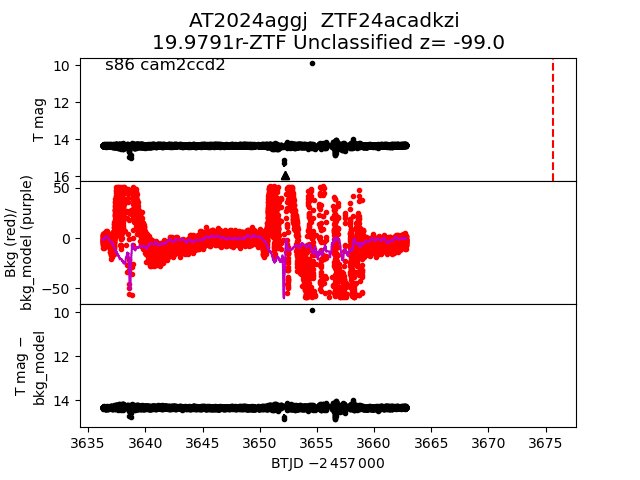
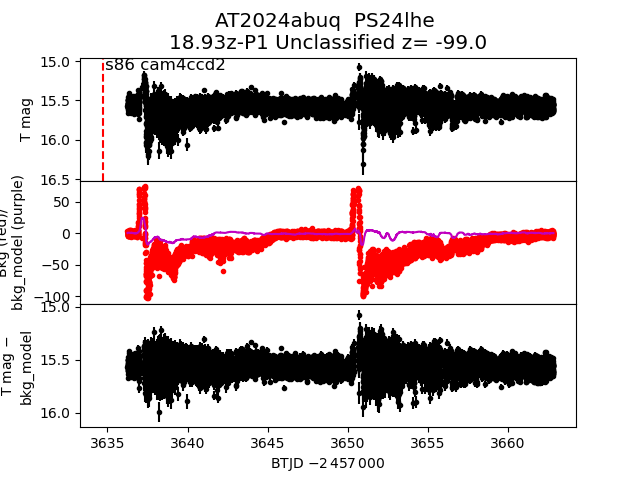
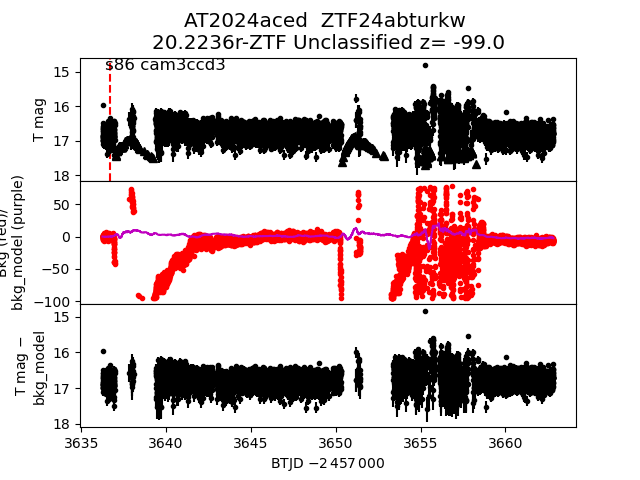
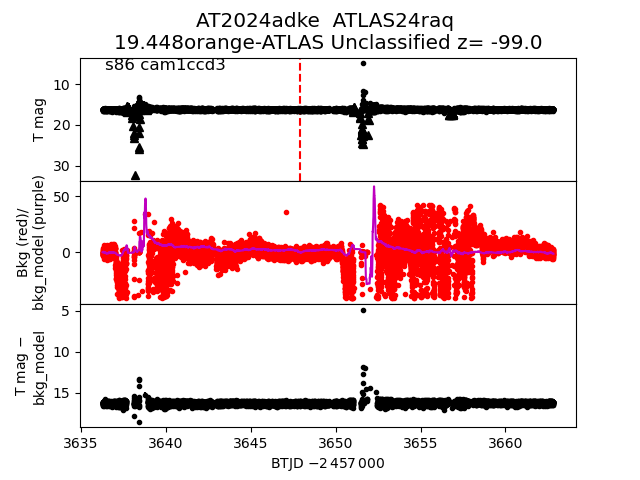
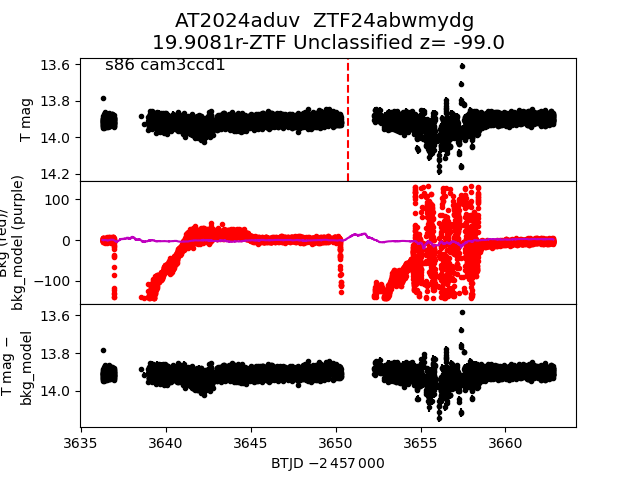
Each figure has three panels. The top panel shows the transient light curve, the middle panel shows the local background (estimated in an annulus), and the bottom panel shows a "background-model corrected" light curve. Details about the background model are in the README.
The vertical red line marks the time of discovery reported to TNS. Other useful metadata from TNS is in the figure title.
Note that the top and bottom panel are in magnitudes, while the middle panel is in differential flux units. The magnitudes are calibrated to the flux in the reference image used for image subtraction. Thus, flux from the host galaxy is included in these magnitudes.
3-sigma upper limits are plotted as triangles with no errorbars. A typical limiting magnitude is 19.6 in 30 minutes or 18.4 in 200 seconds (for low backgrounds).
The links allow you to download the light curve data as a text file.
More details in the README.
2025oc
 2024acxw
 2024agkn
 2024adhv
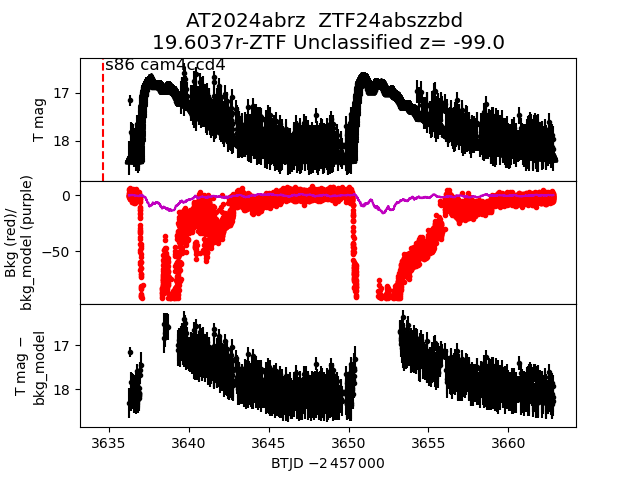
 2024abrz
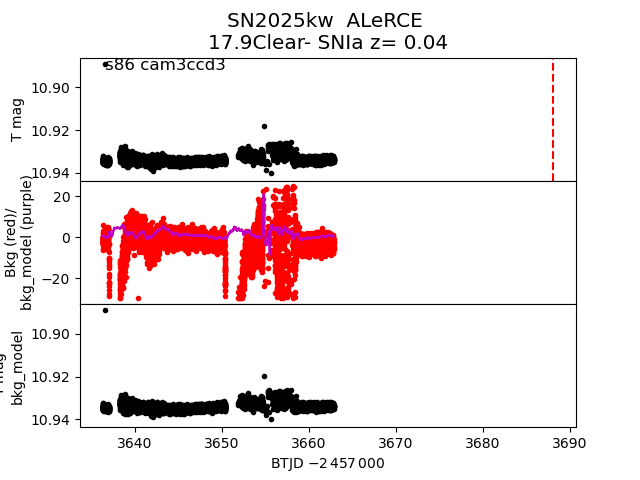
 2025kw
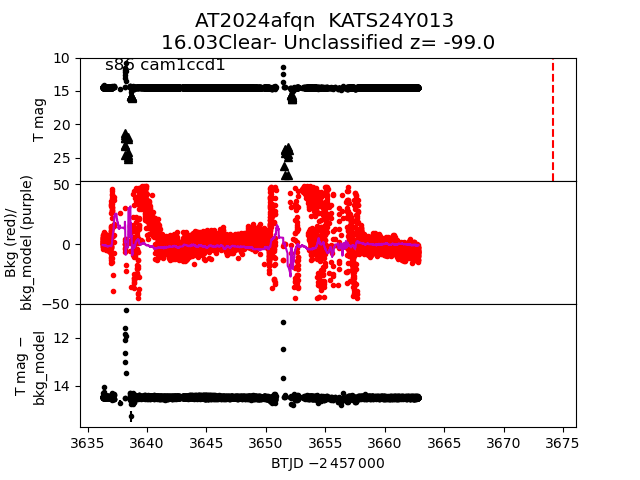
 2024afqn
 2024abng
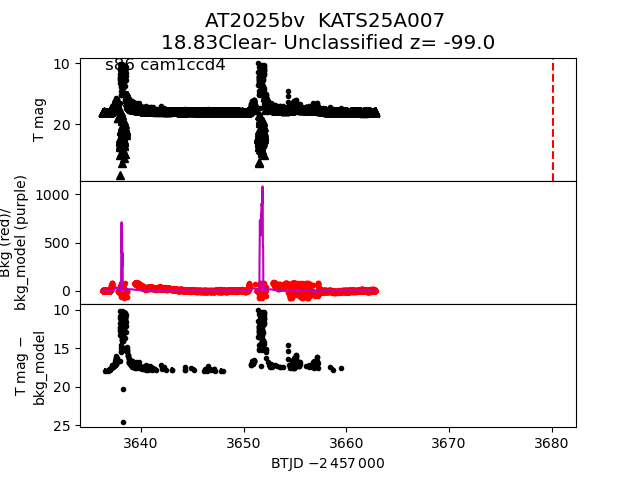
 2025bv
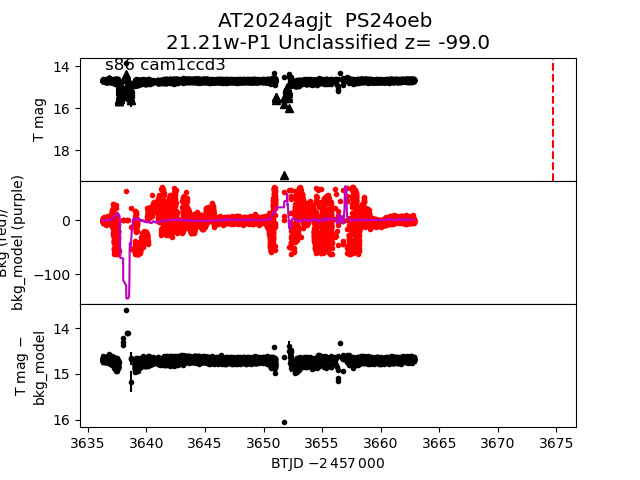
 2024agjt
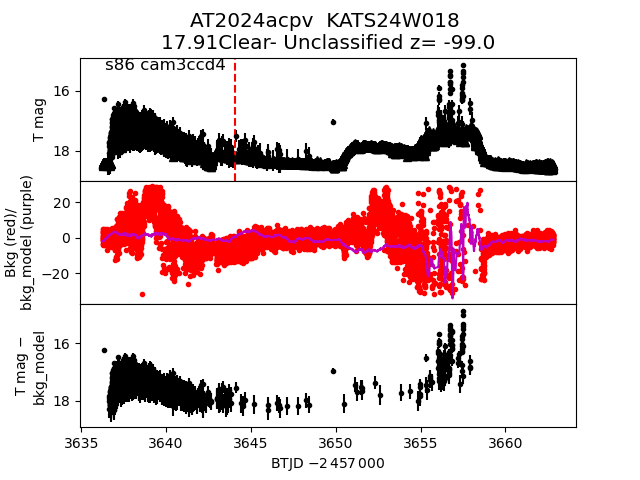
 2024acpv
 2025bl
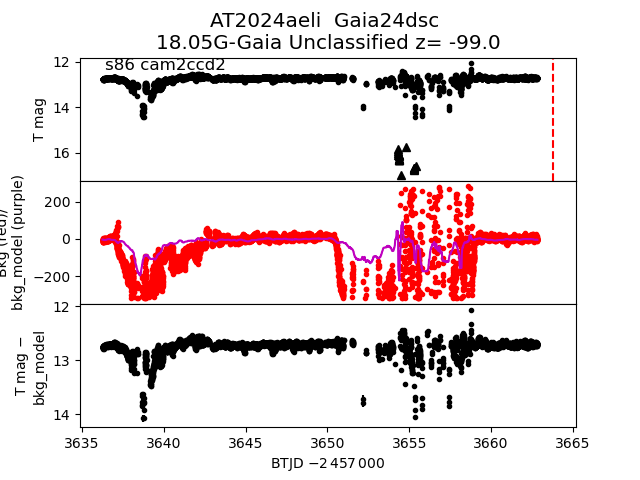
 2024aeli
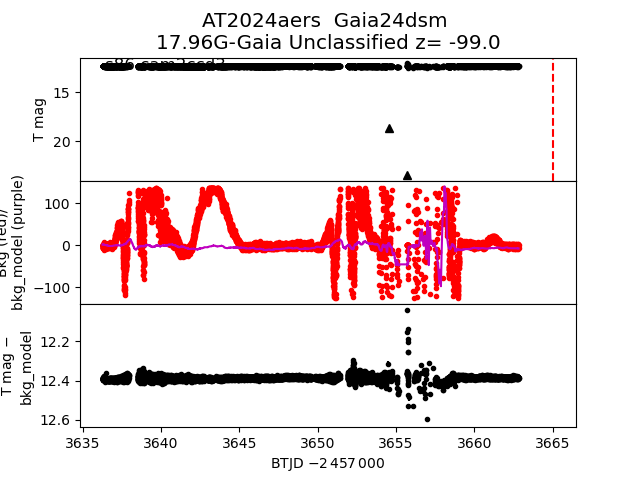
 2024aers
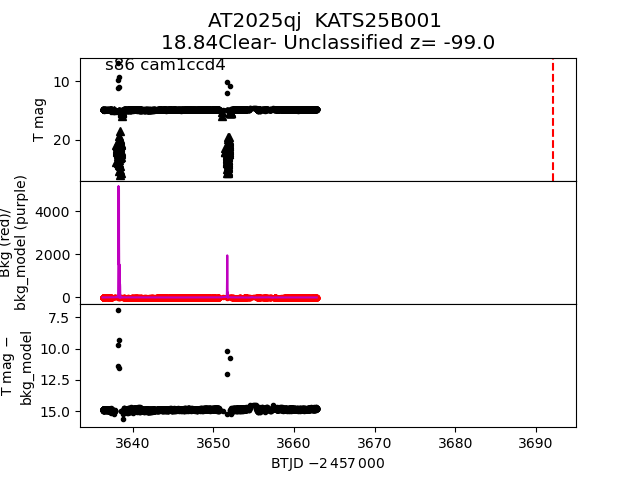
 2025qj
 2024advv
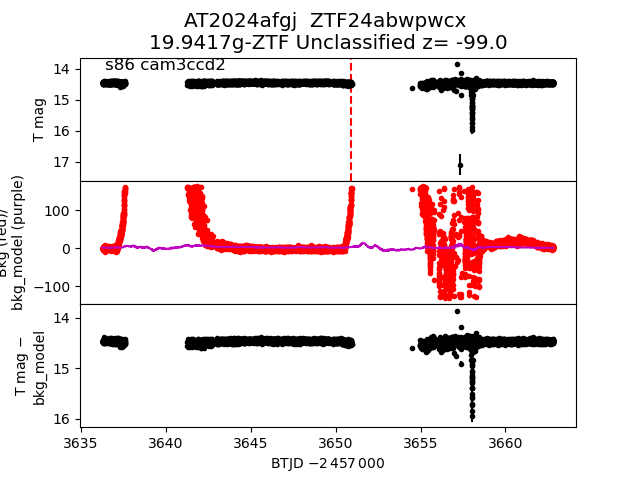
 2024afgj
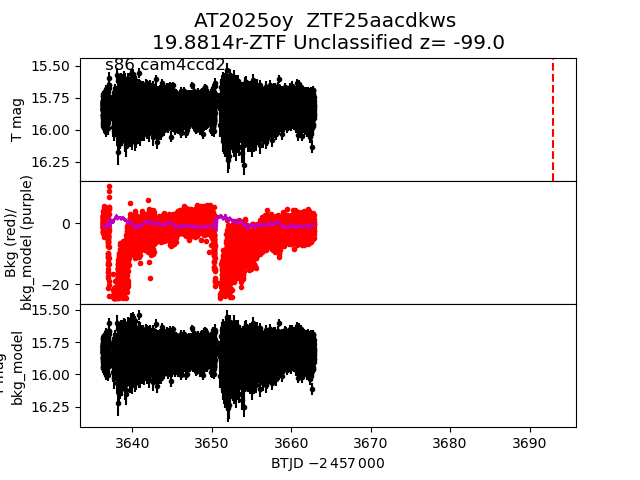
 2025oy
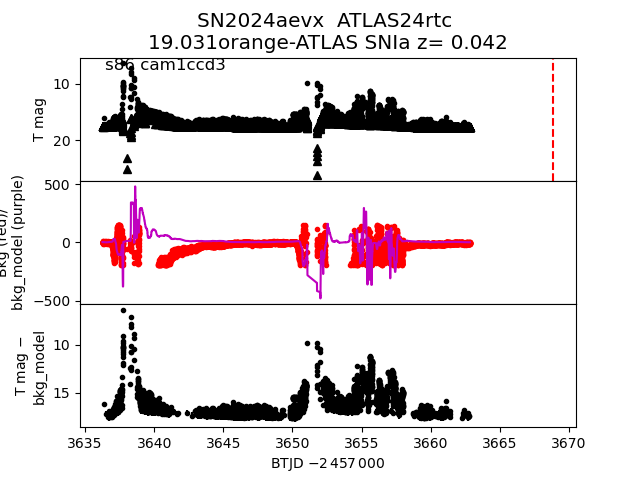
 2024aevx
 2024afnt
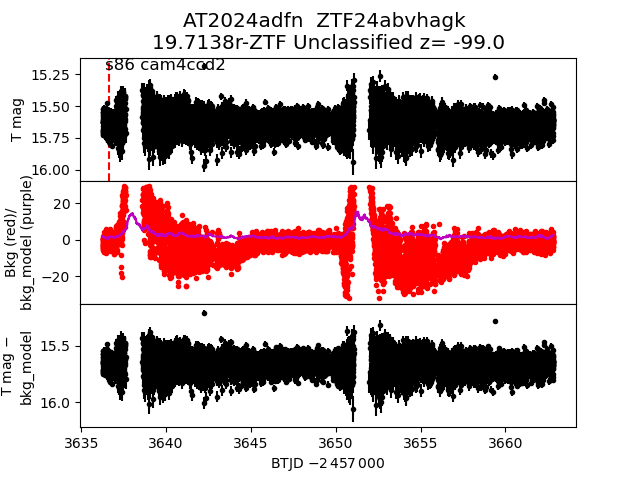
 2024adfn
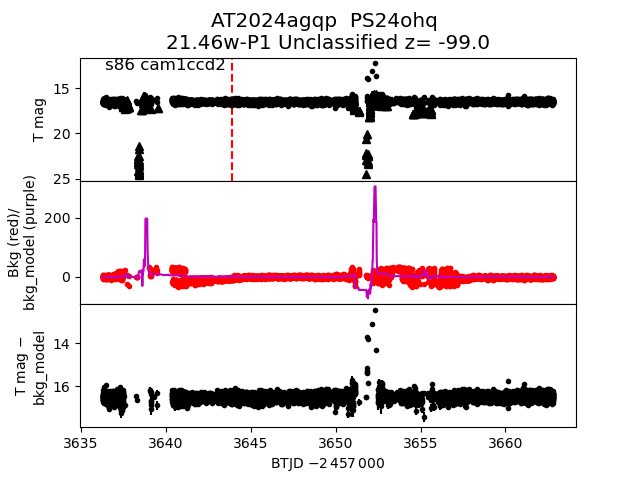
 2024agqp
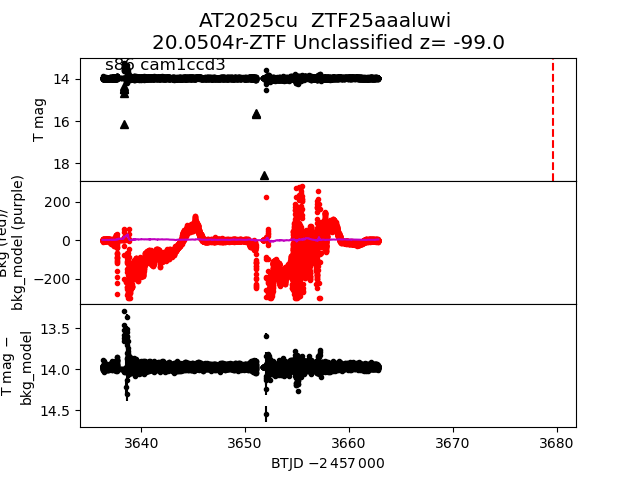
 2025cu
 2025ef
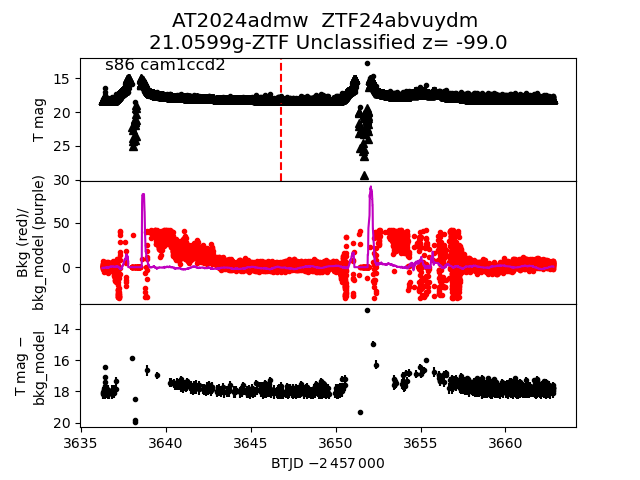
 2024admw
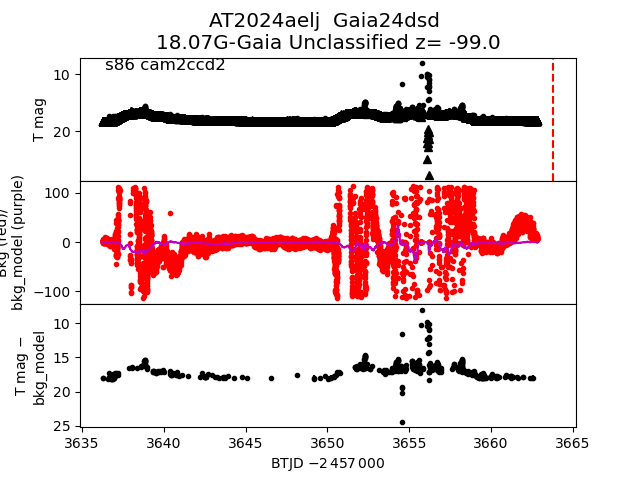
 2024aelj
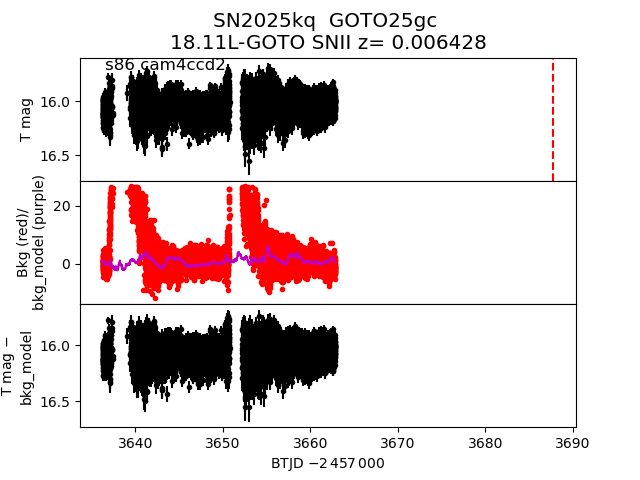
 2025kq
 2024agrd
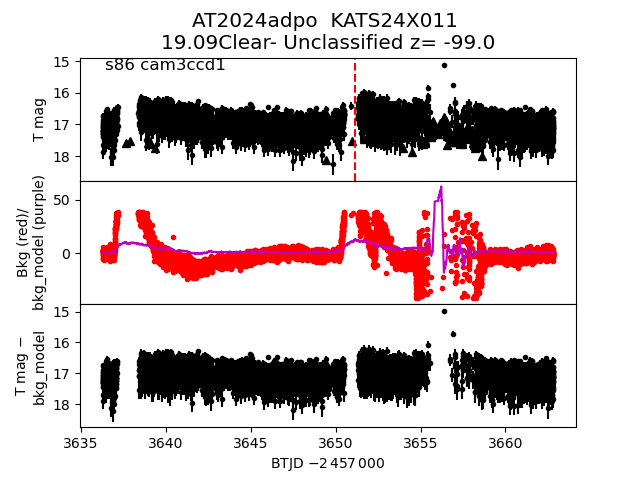
 2024adpo
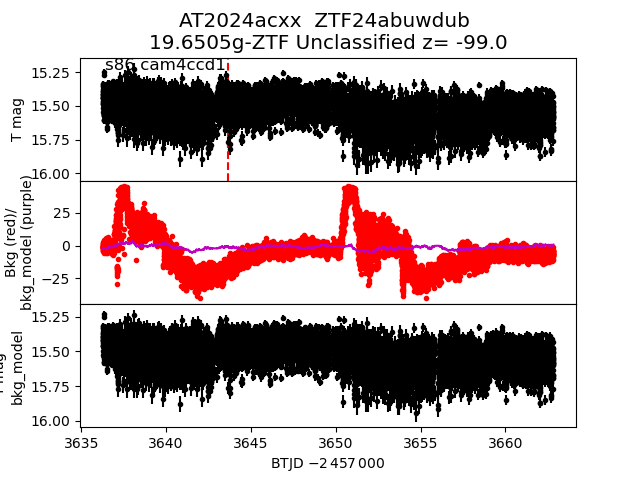
 2024acxx
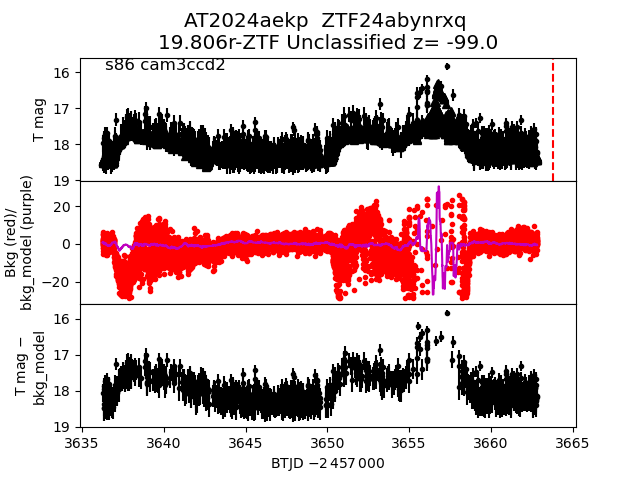
 2024aekp
 2024abnd
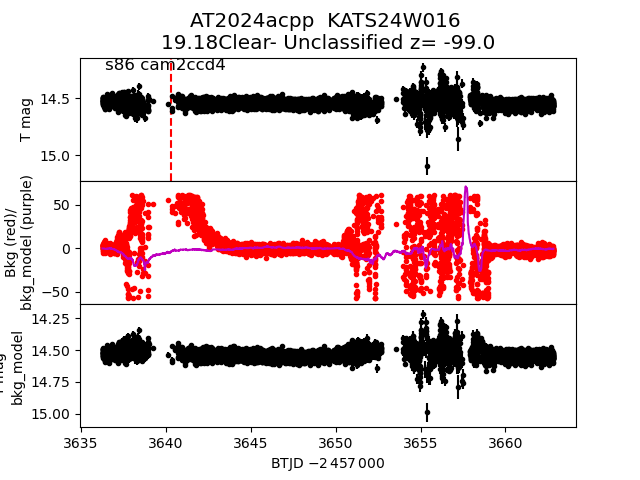
 2024acpp
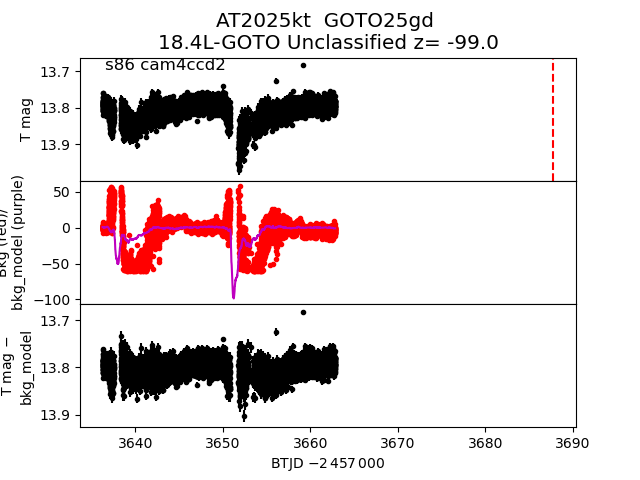
 2025kt
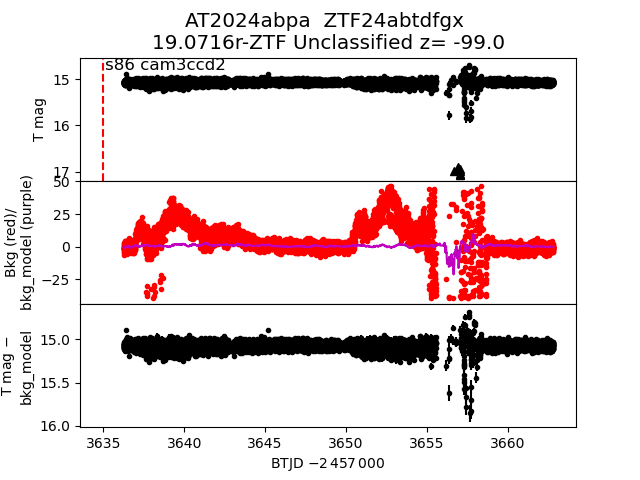
 2024abpa
 2024adhu
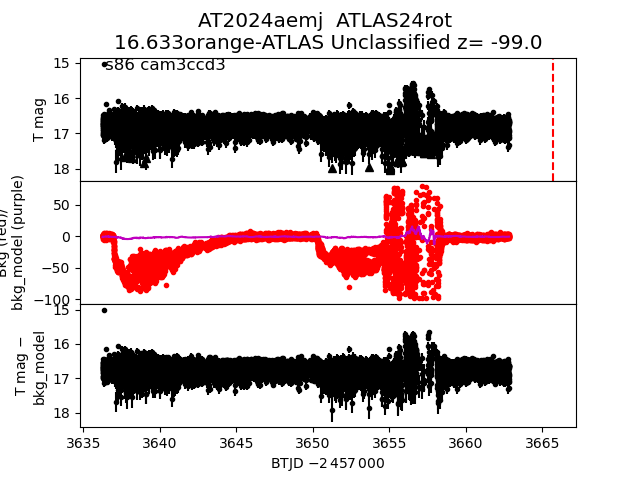
 2024aemj
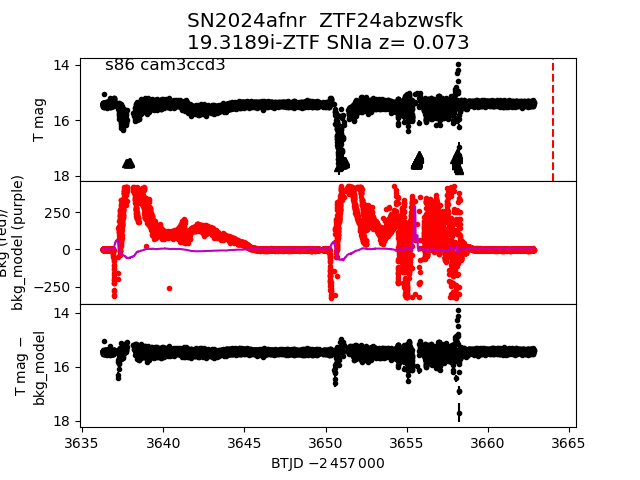
 2024afnr
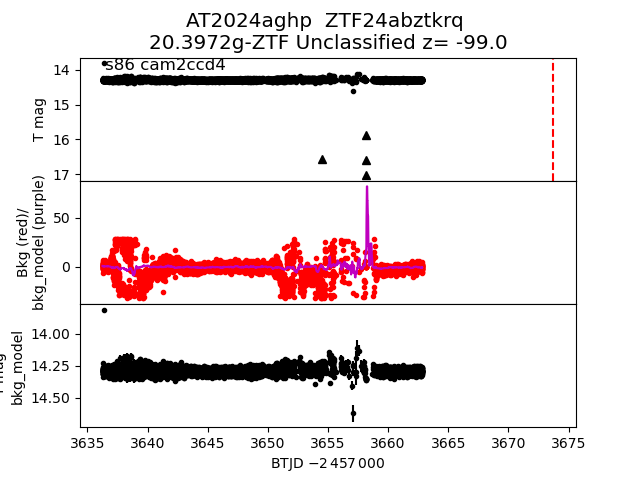
 2024aghp
 2024aczz
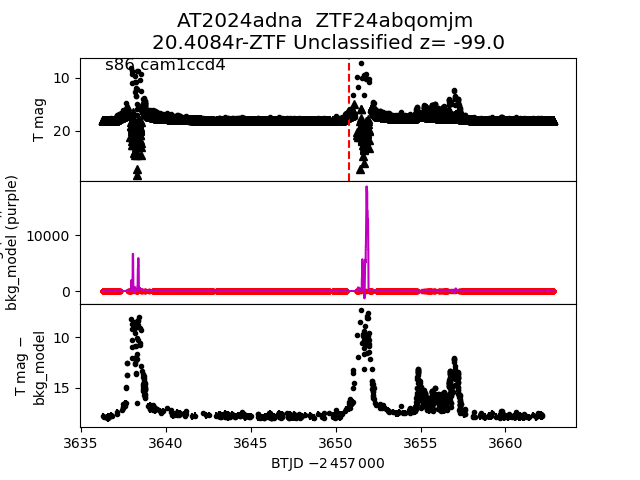
 2024adna
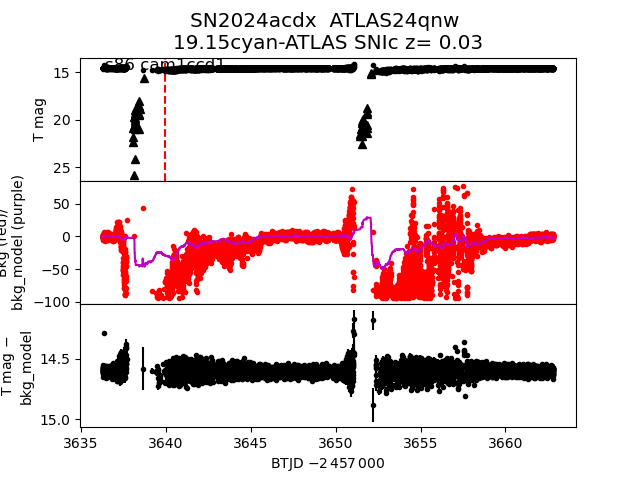
 2024acdx
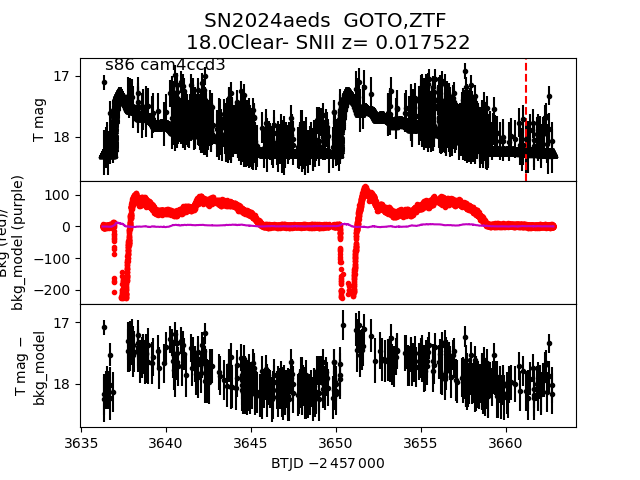
 2024aeds
 2024aela
 2025U
2025U
 2025og
 2024afrh
 2024adih
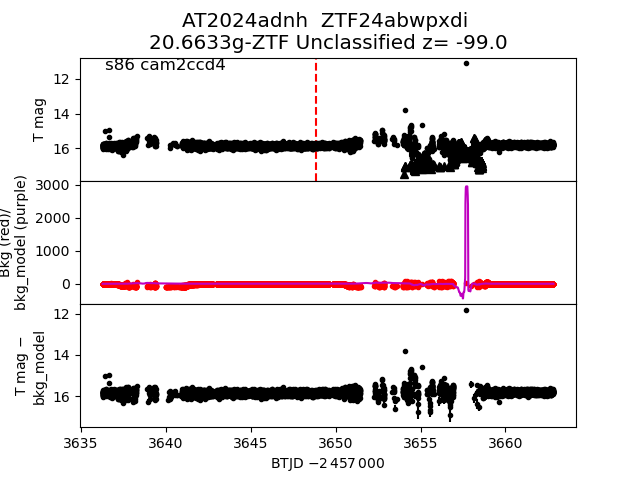
 2024adnh
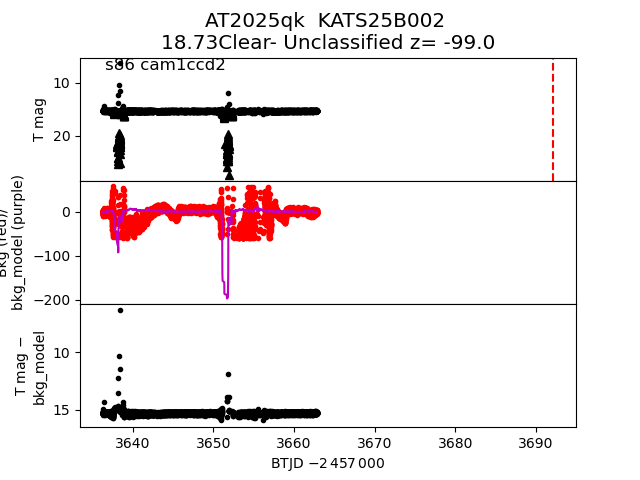
 2025qk
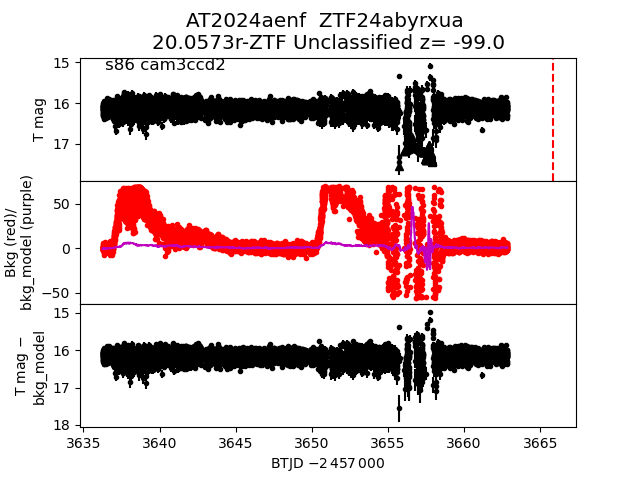
 2024aenf
 2024agha
 2024adeg
 2024acfz
 2024agod
 2024agjj
 2024agfz
 2024afzi
 2024aeoy
 2025dr
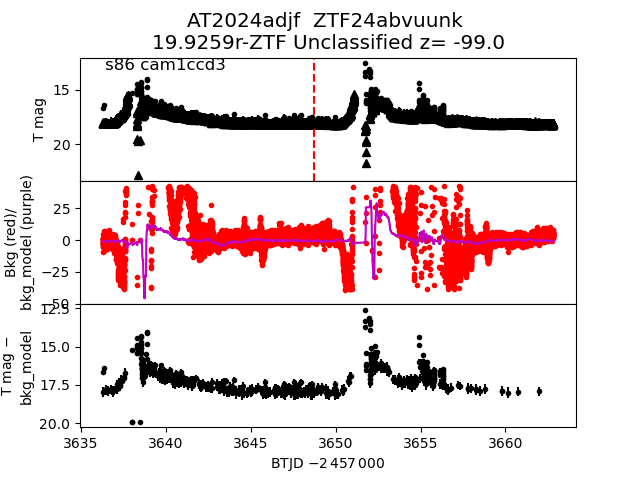
 2024adjf
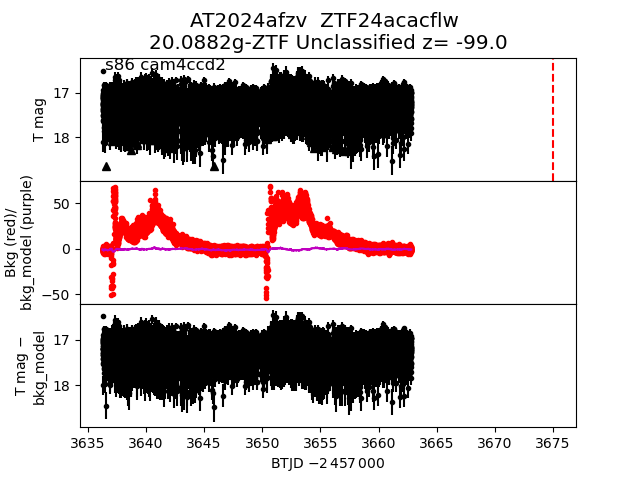
 2024afzv
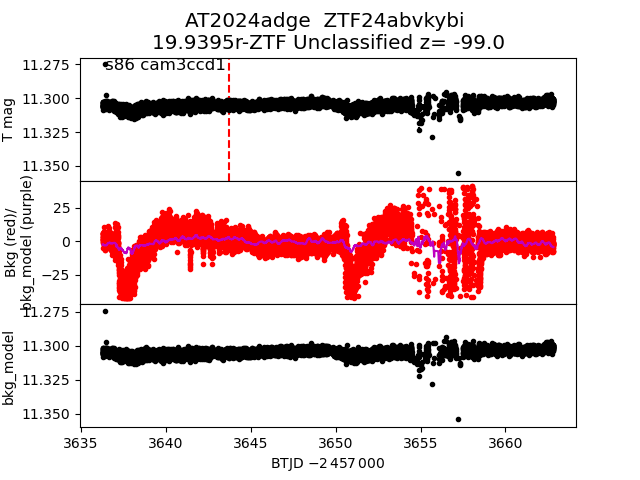
 2024adge
 2024aeey
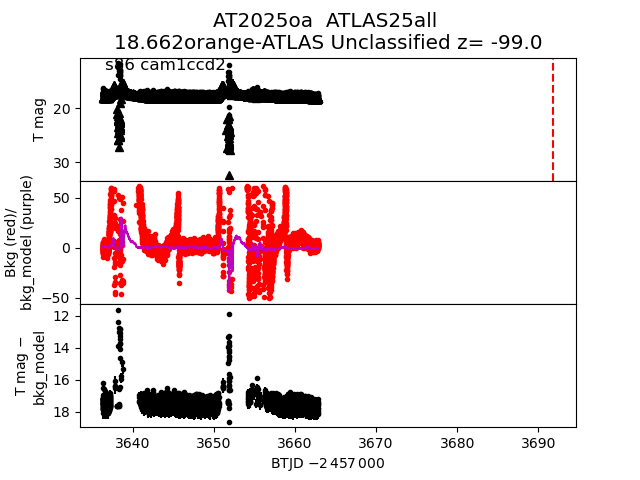
 2025oa
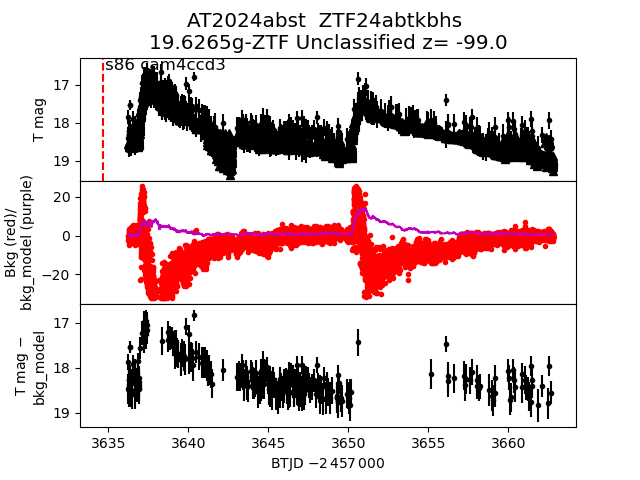
 2024abst
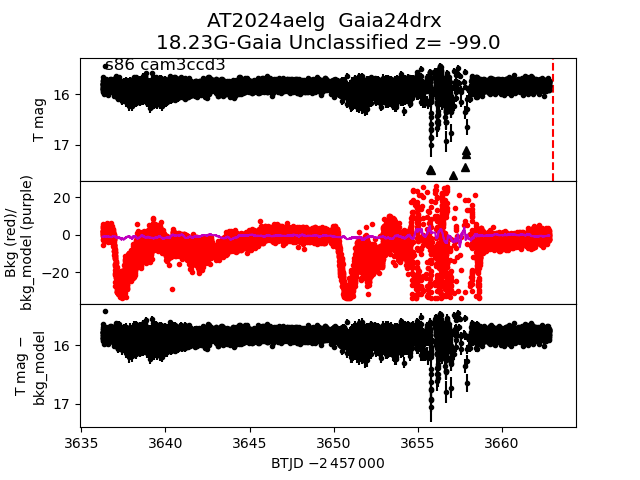
 2024aelg
 2024afns
 2025mf
 2024aggj
 2024abuq
 2024aced
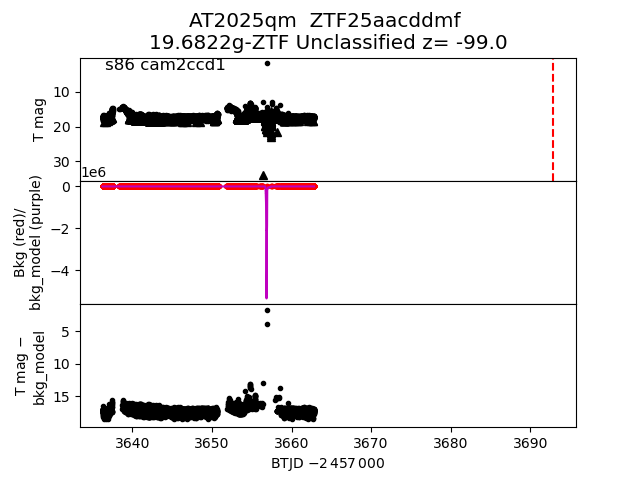
 2025qm
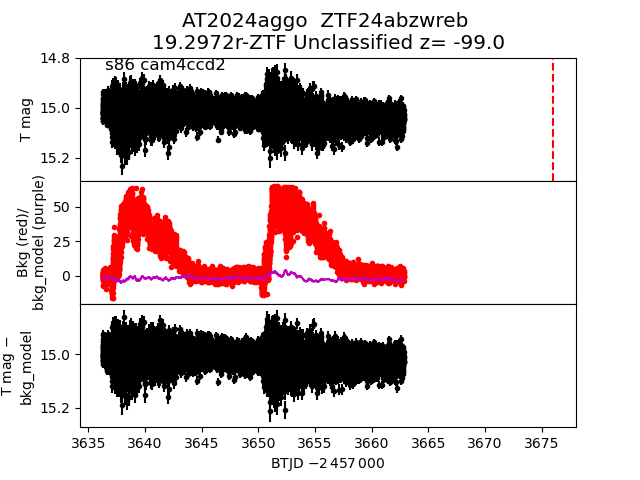
 2024aggo
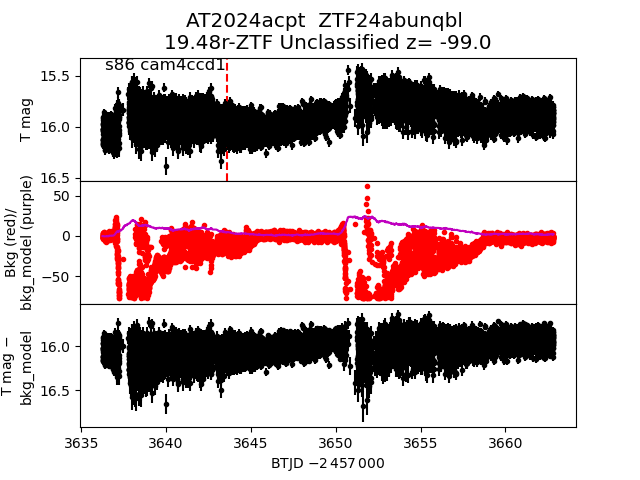
 2024acpt
 2024adke
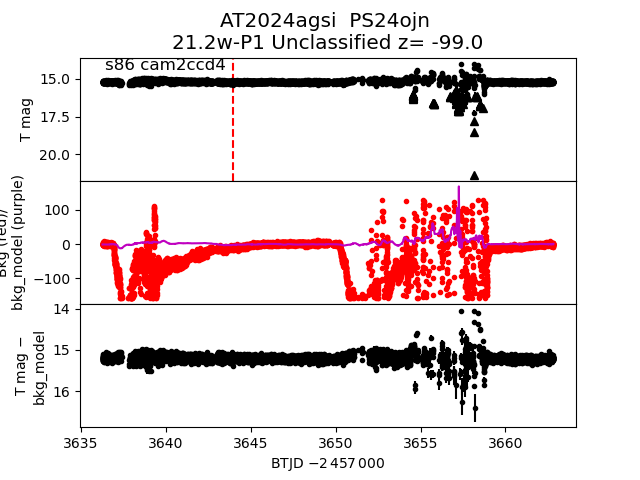
 2024agsi
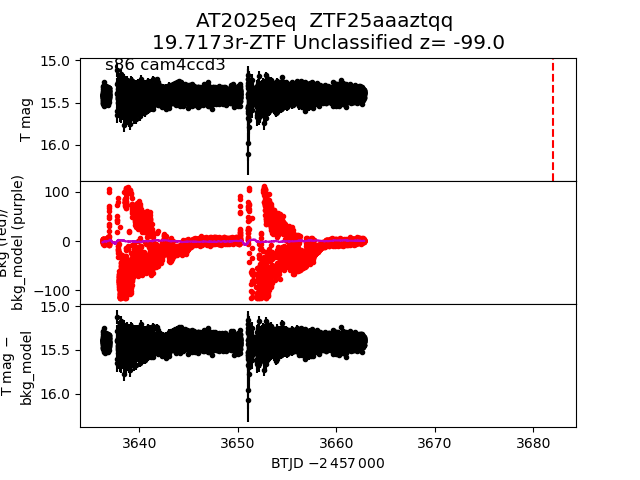
 2025eq
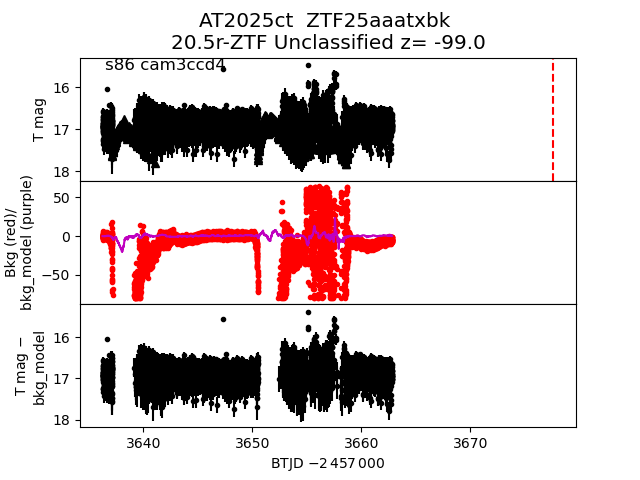
 2025ct
 2024aduv
 2024afoe