all transients in sector85 (104 total)
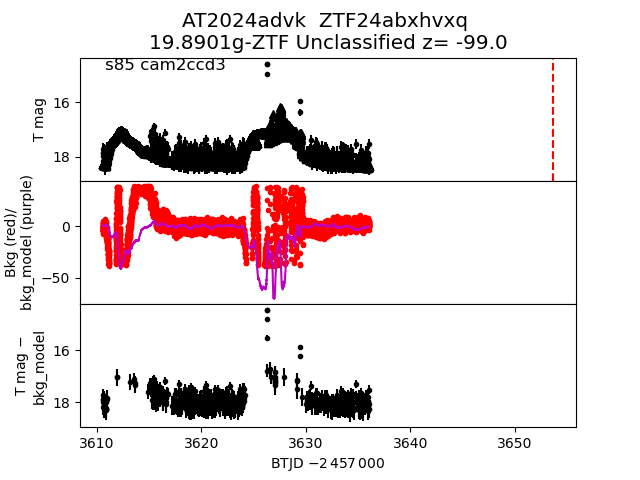
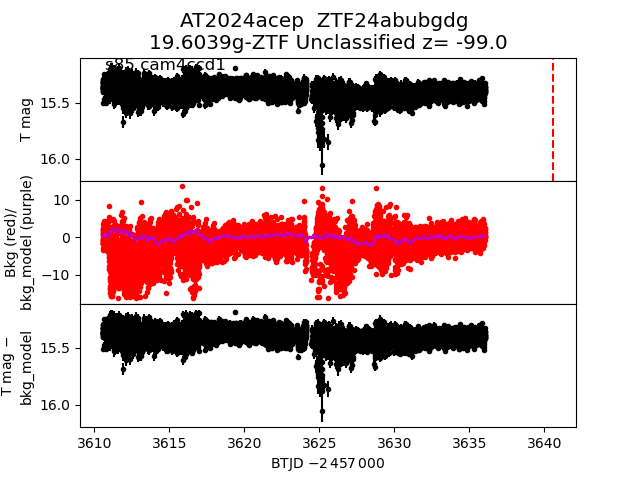
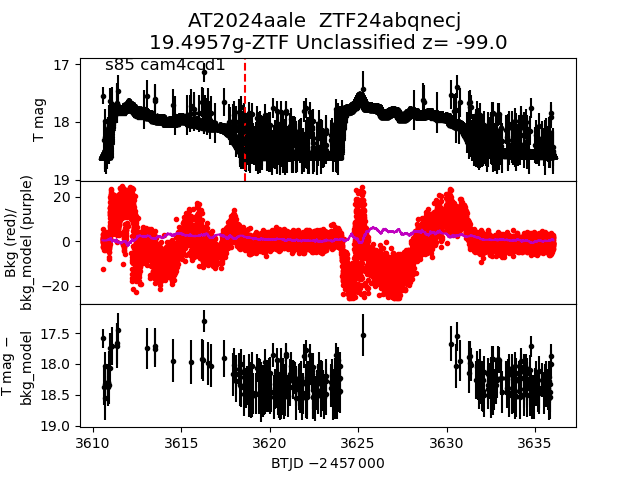
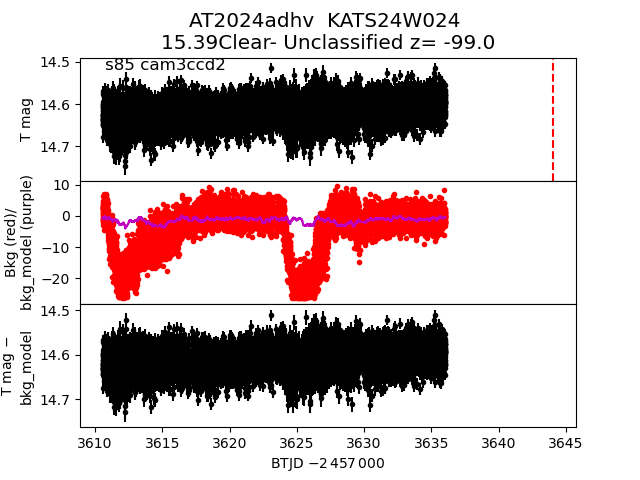
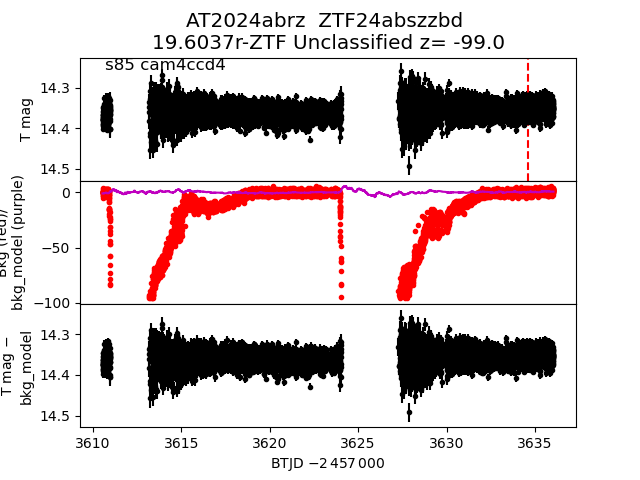
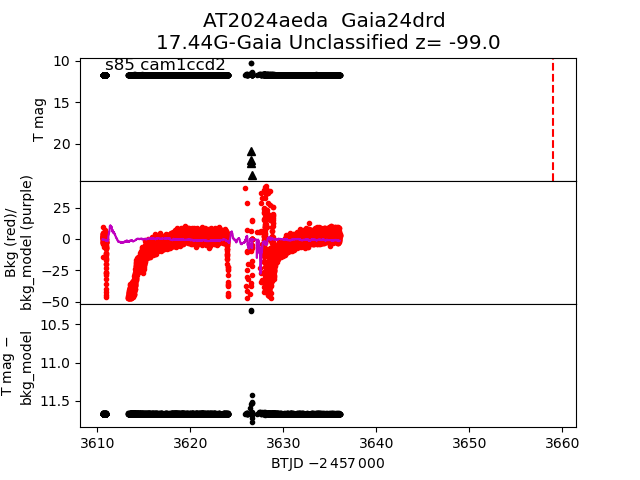
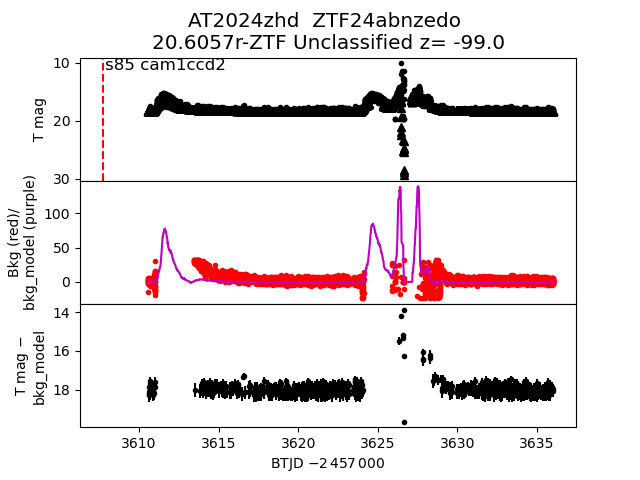
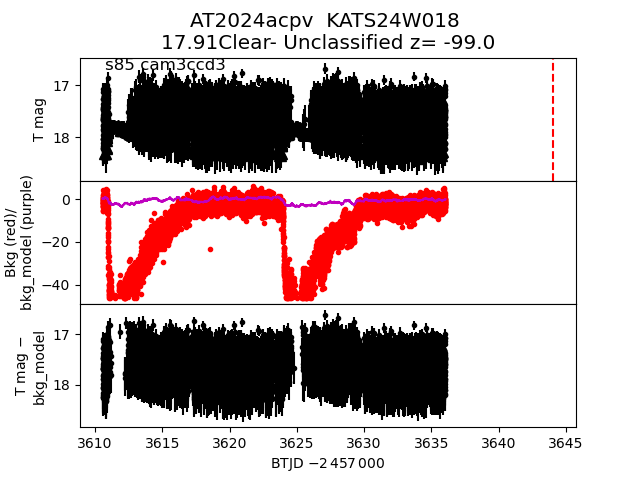
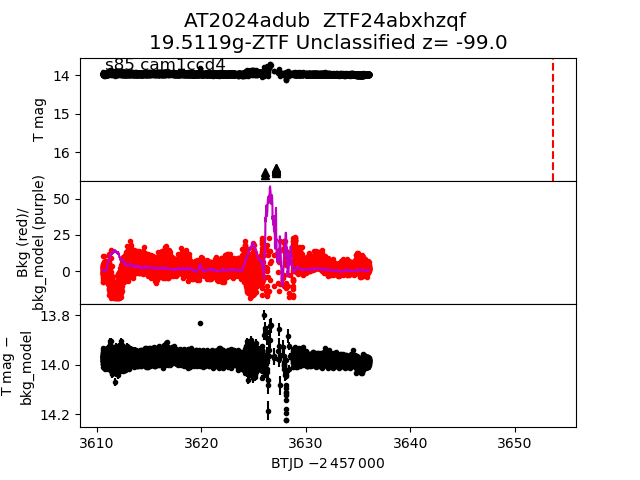
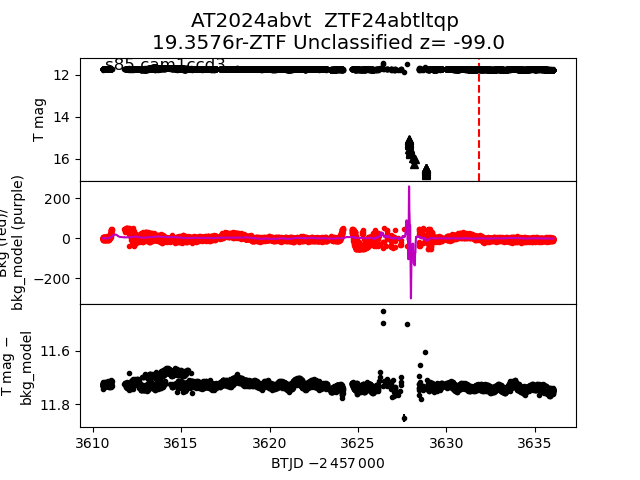
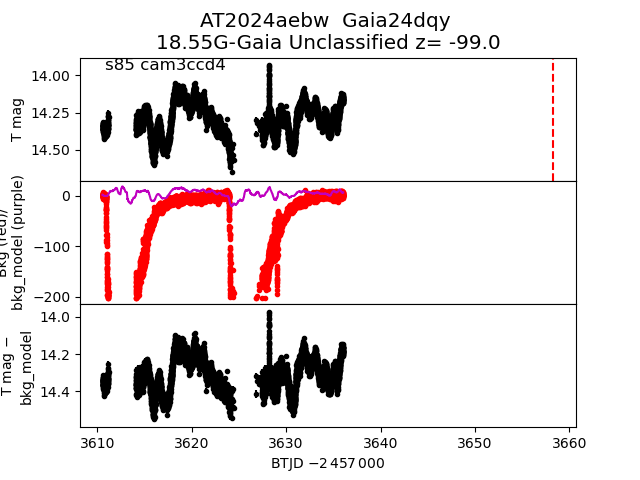
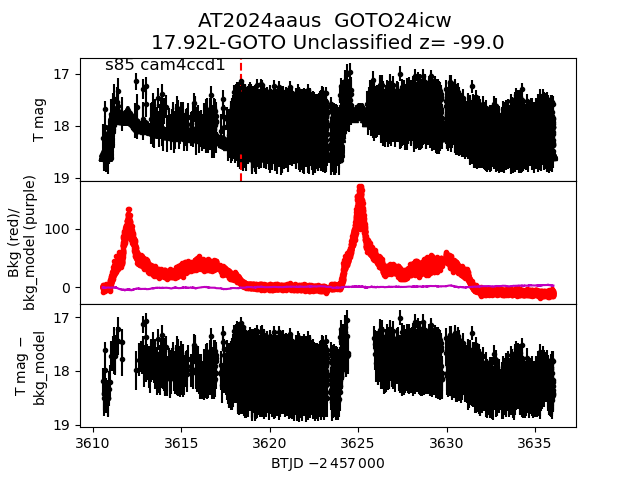
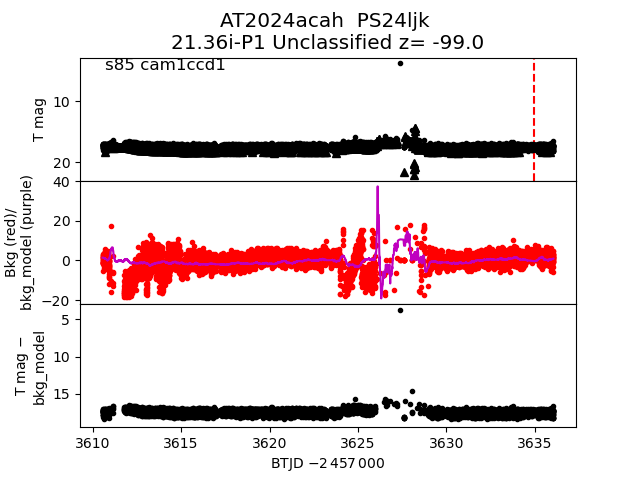
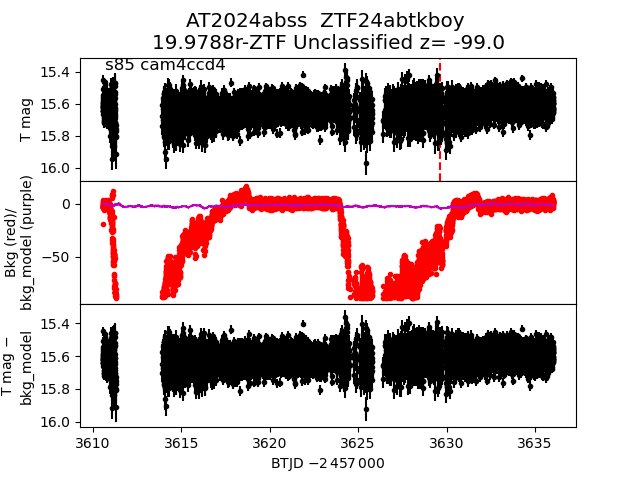
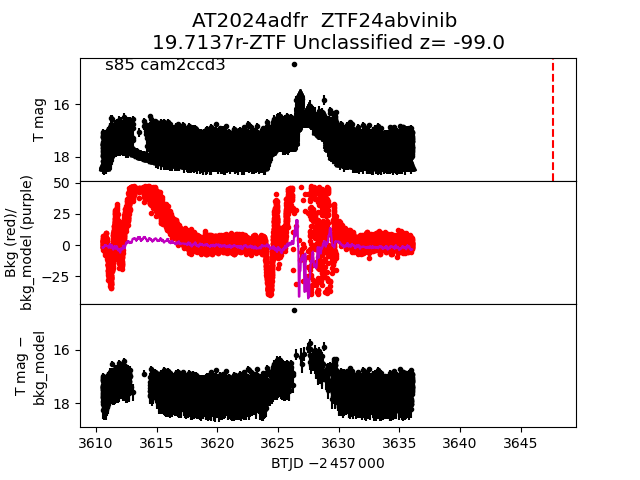
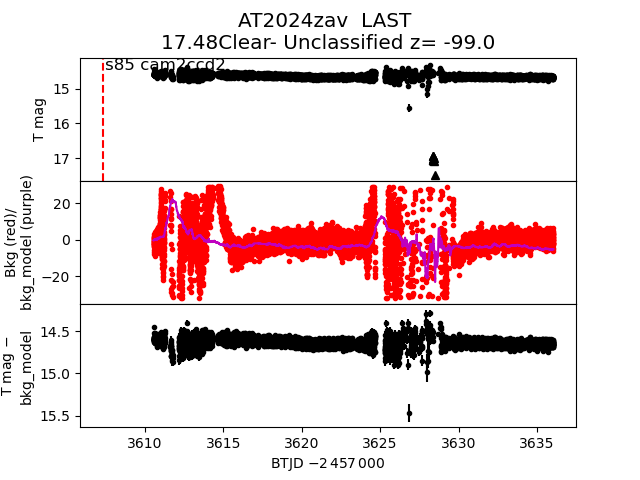
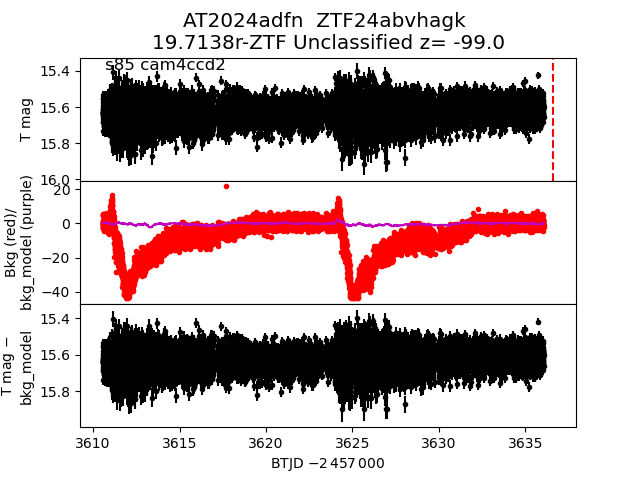
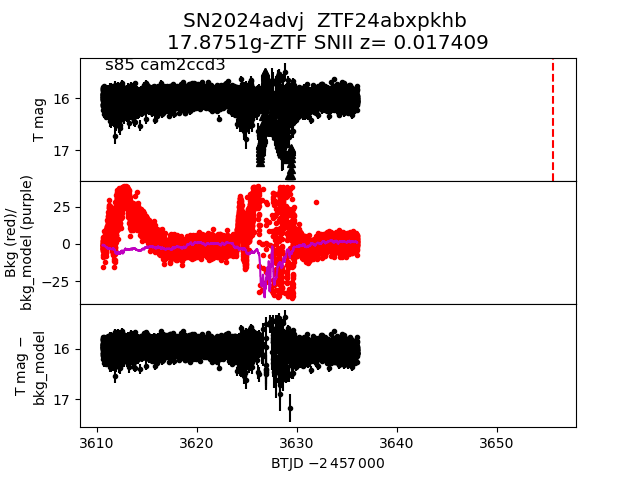
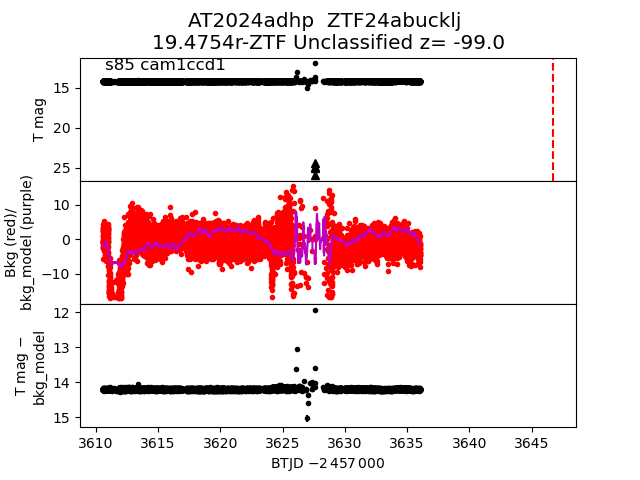
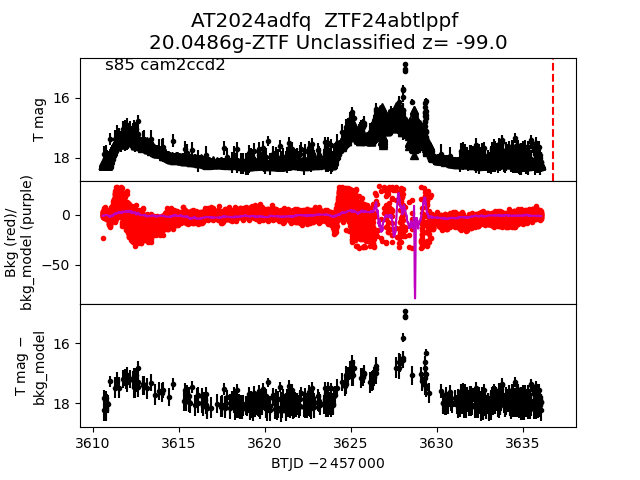
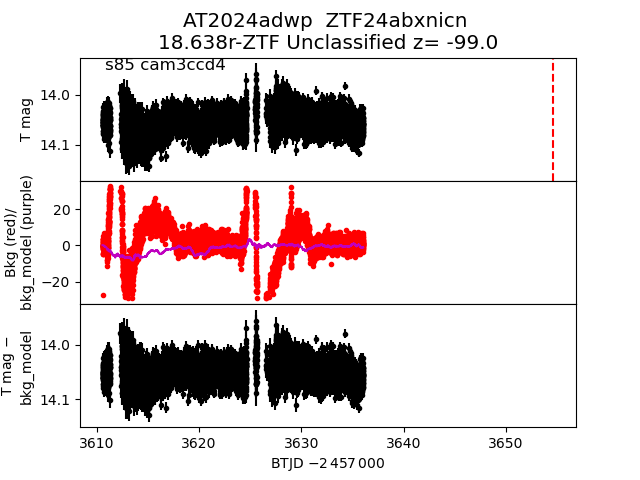
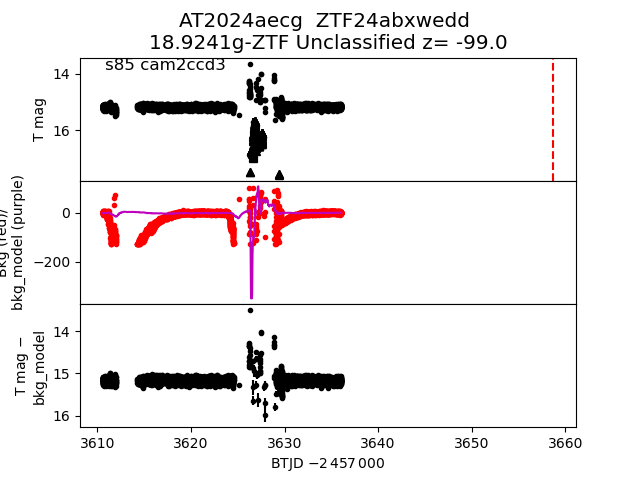
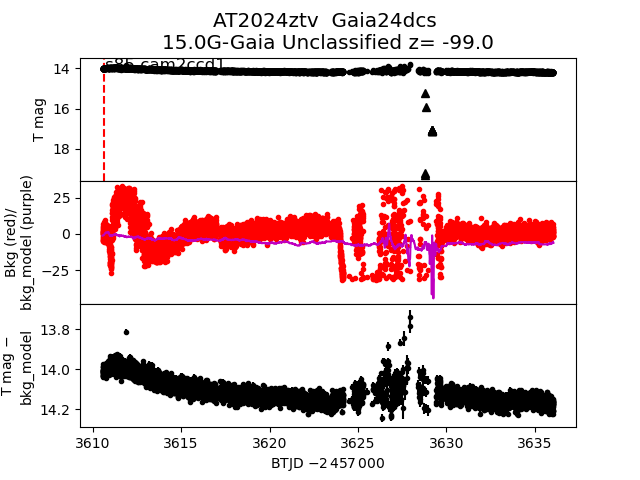
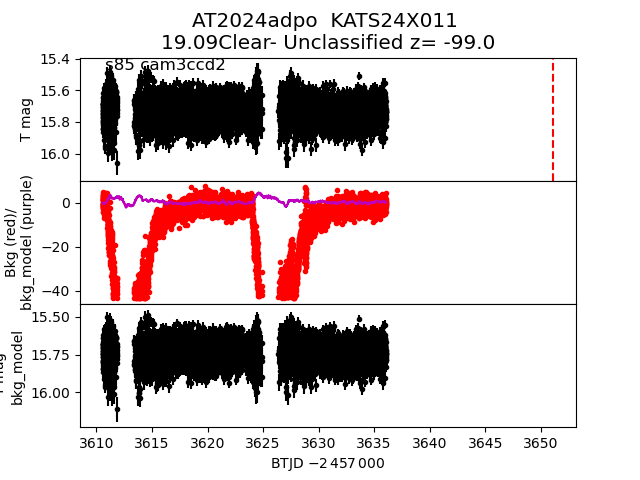
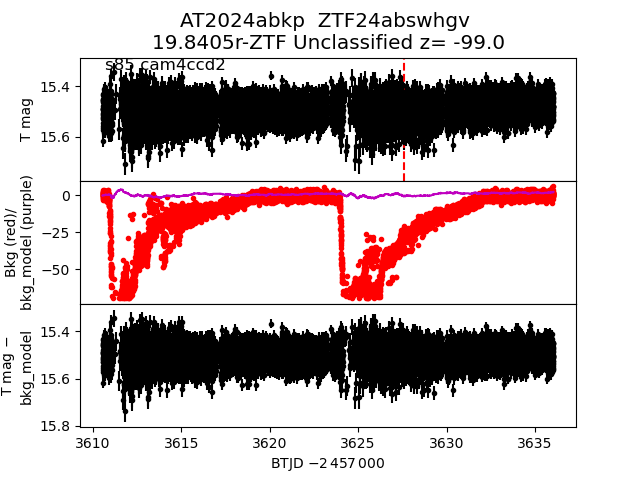
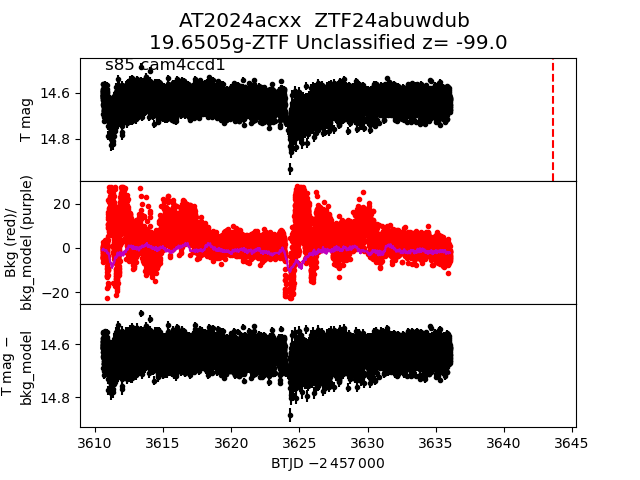
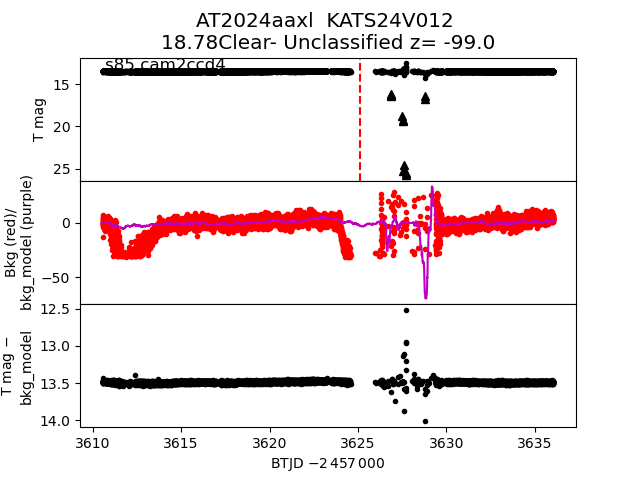
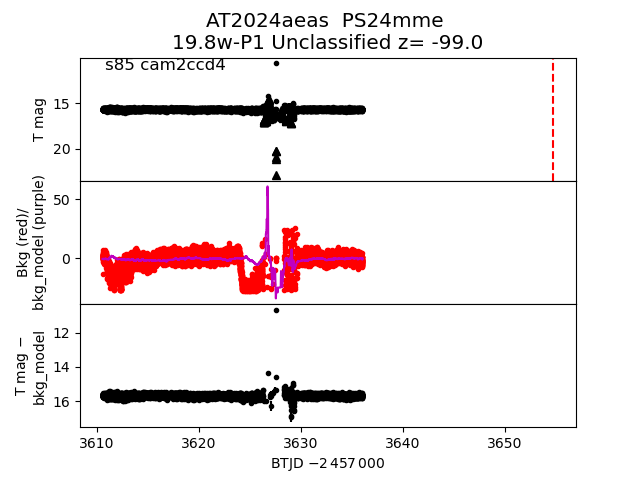
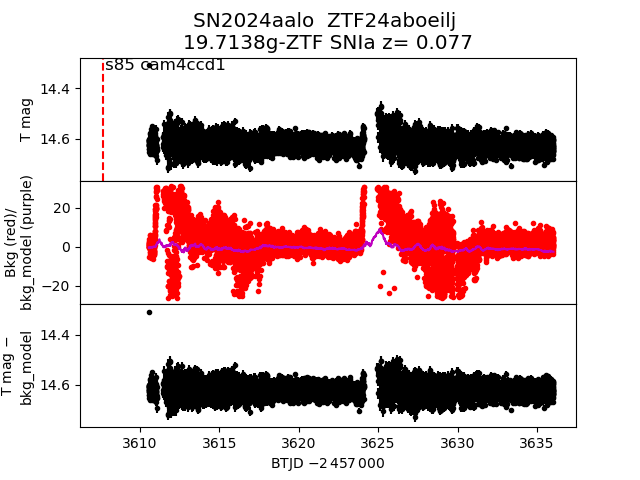
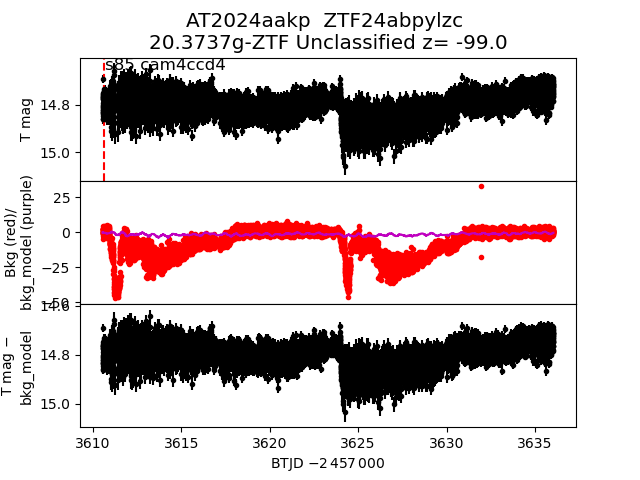
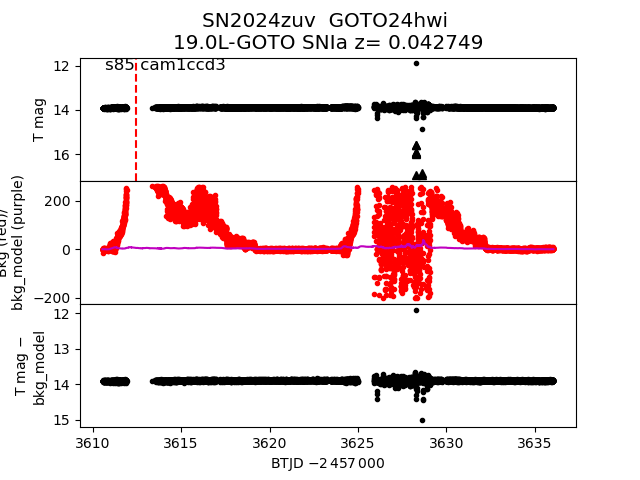
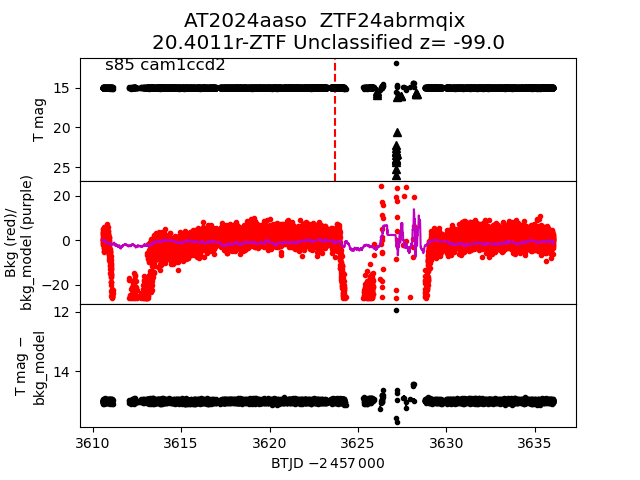
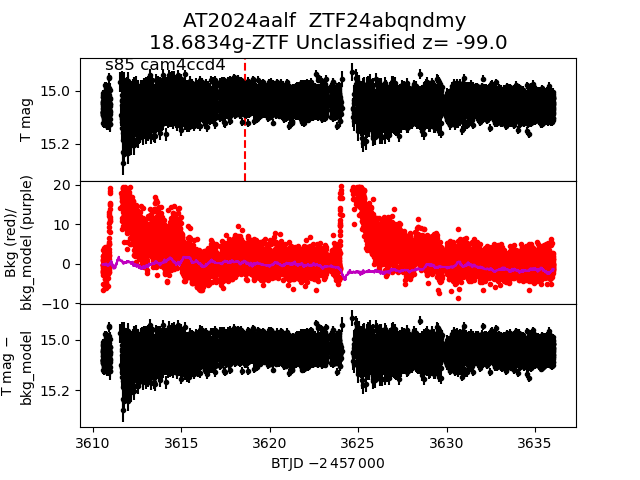
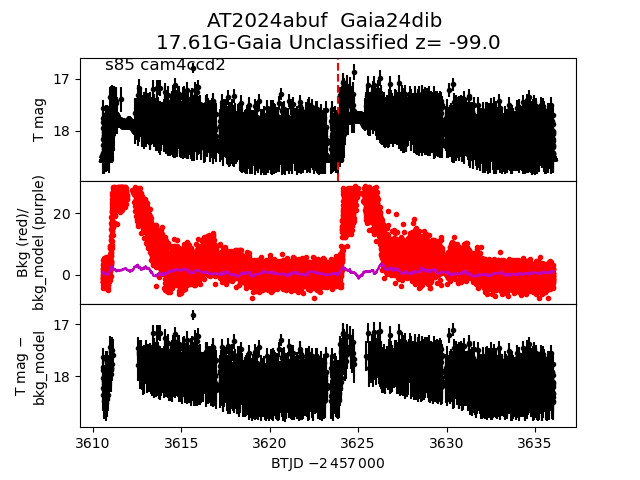
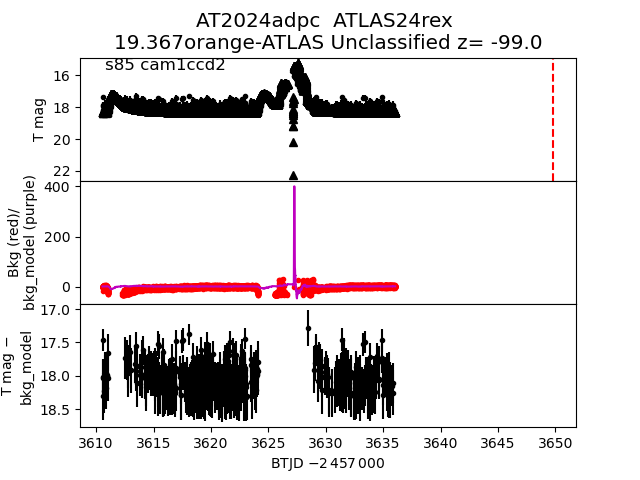
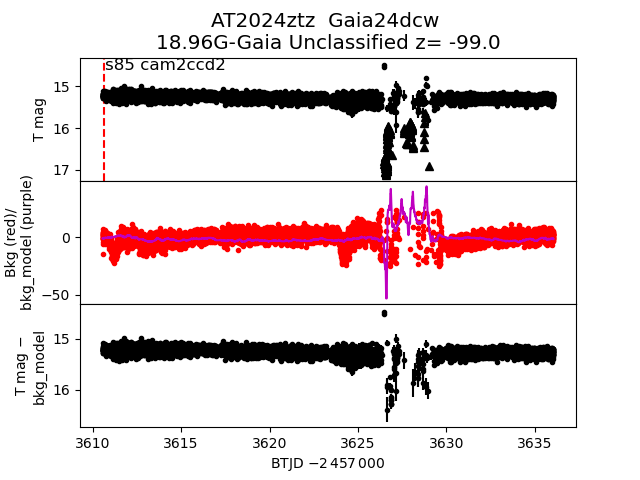
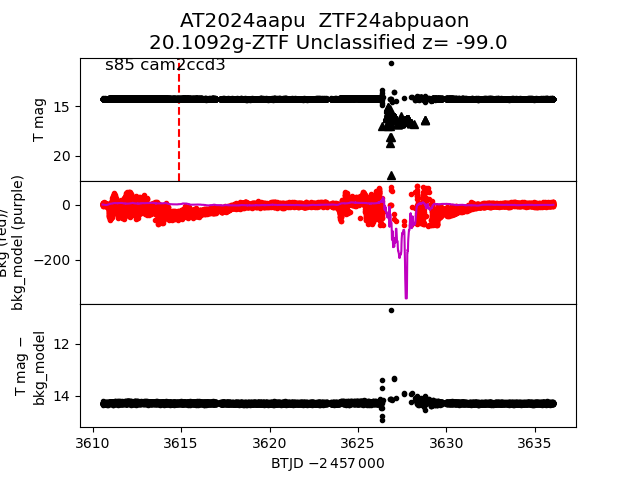
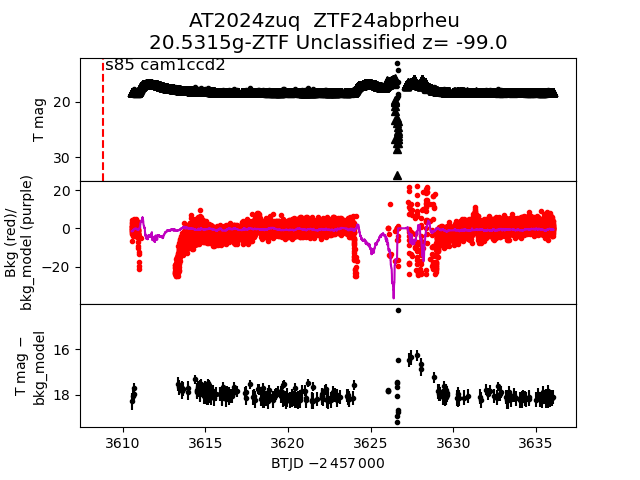
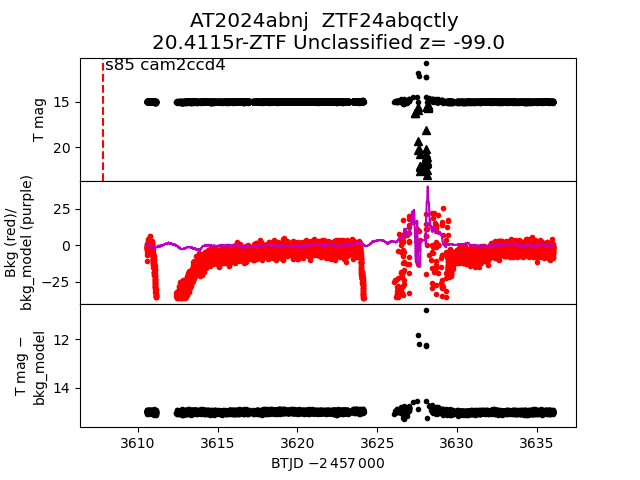
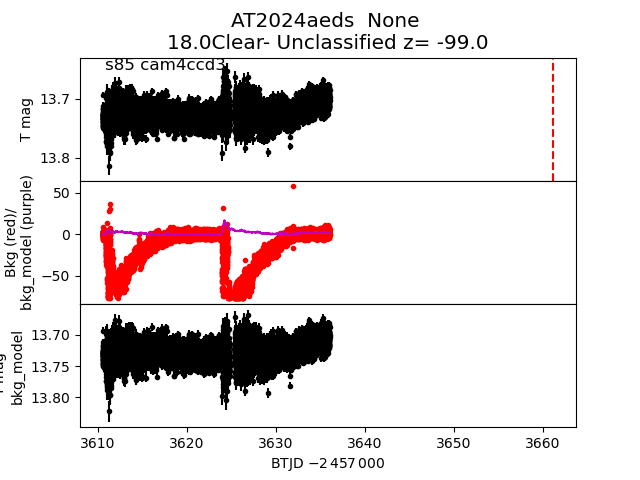
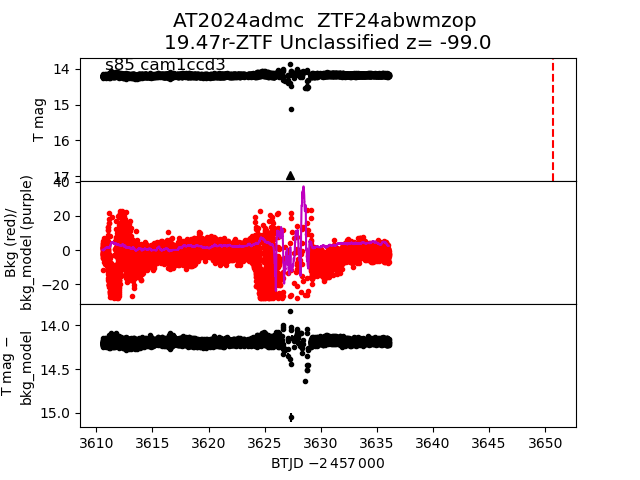
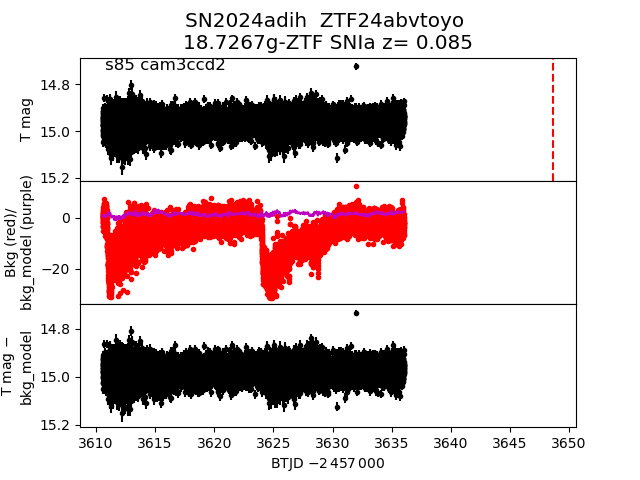
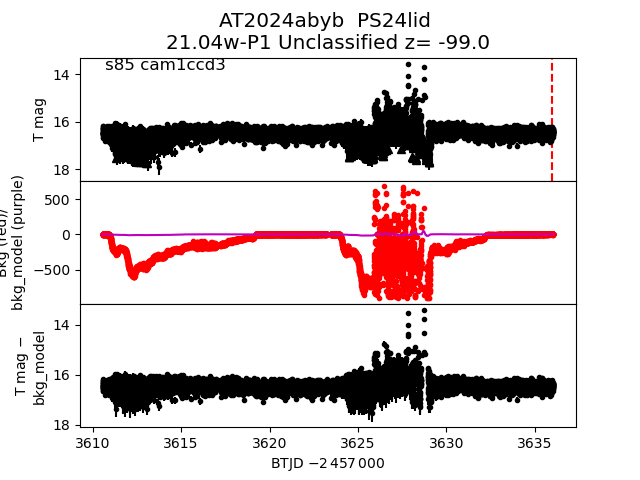
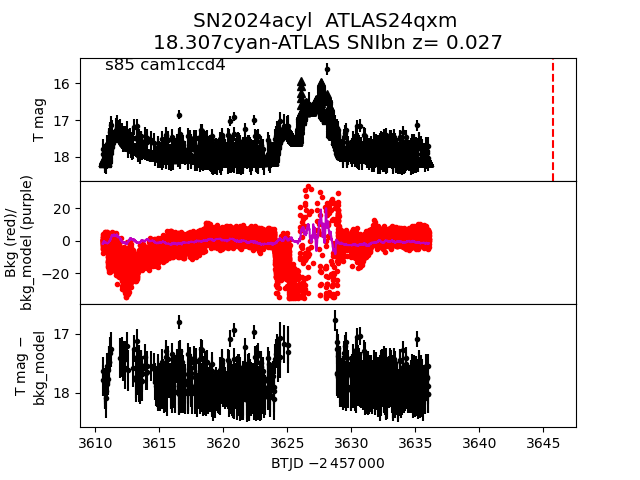
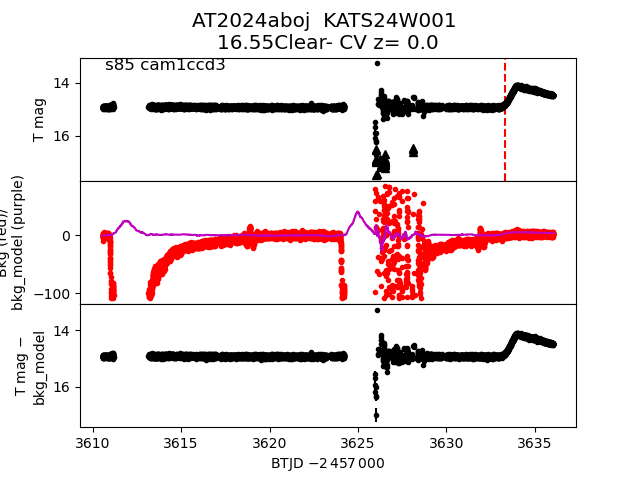
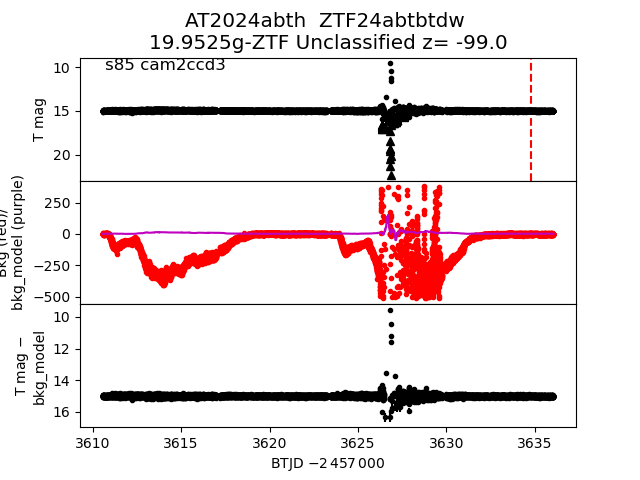
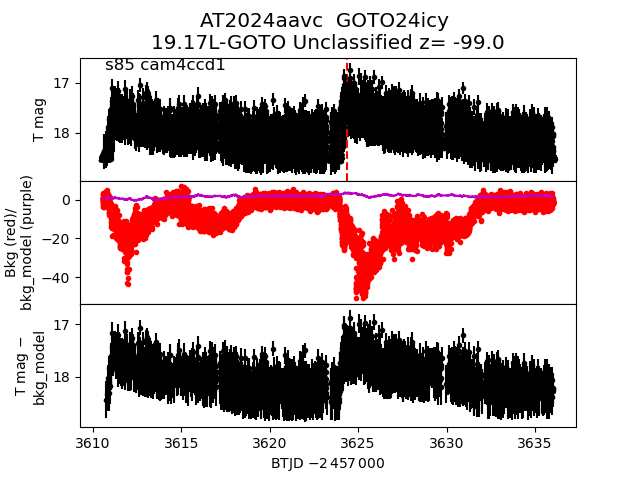
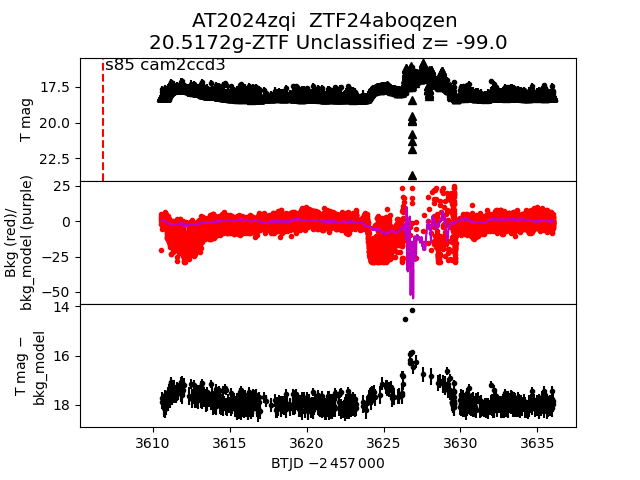
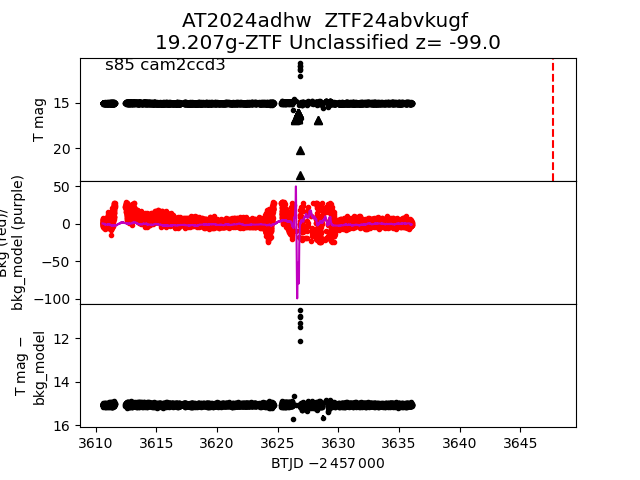
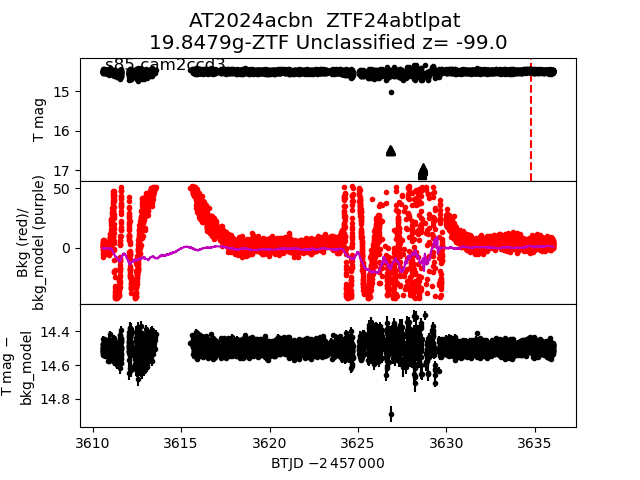
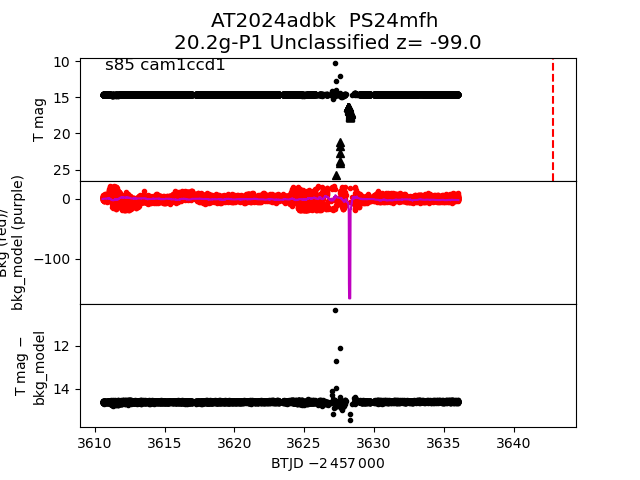
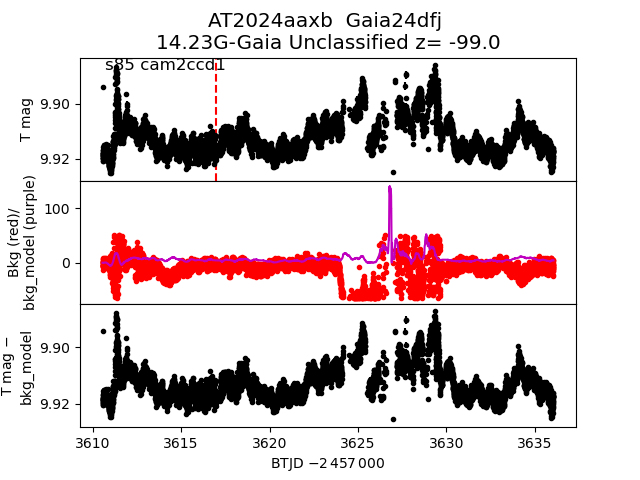
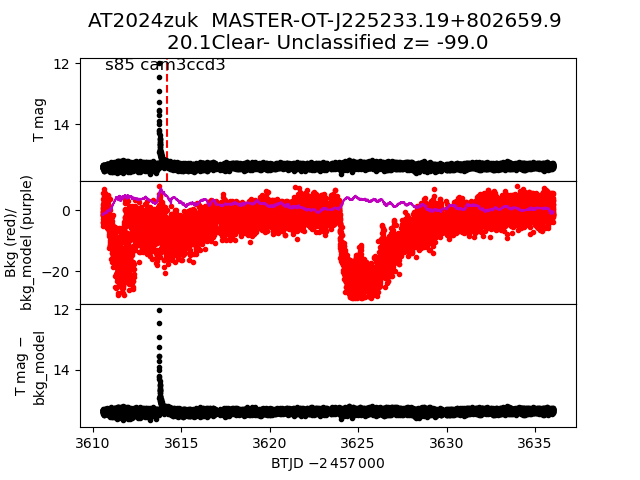
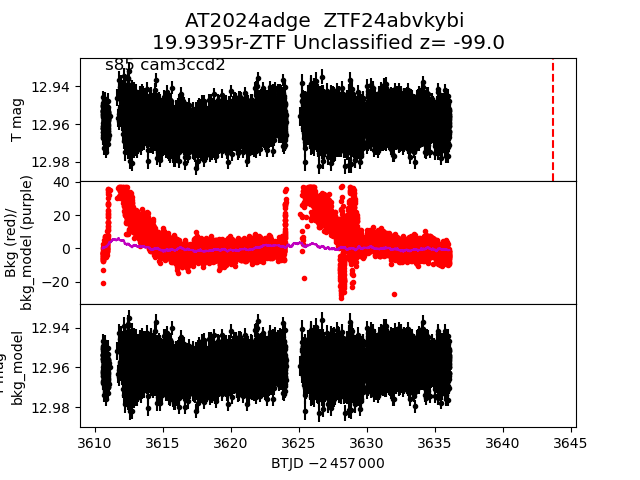
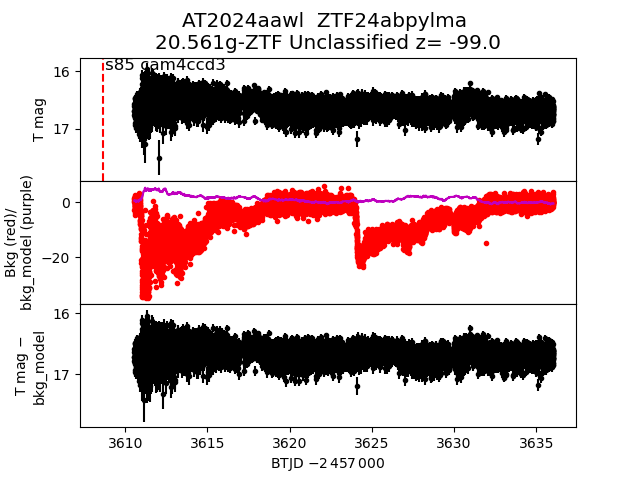
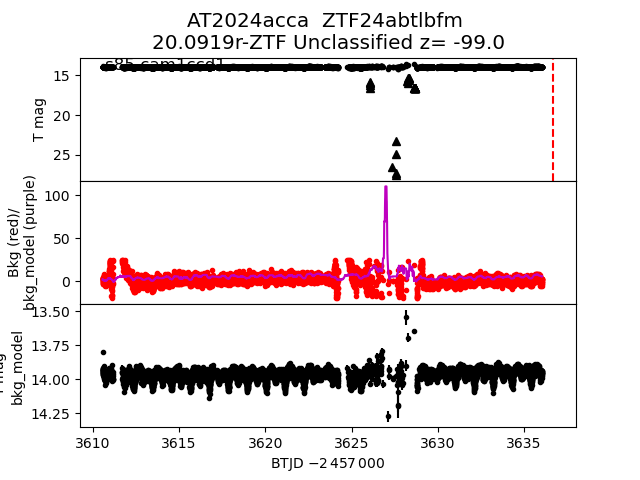
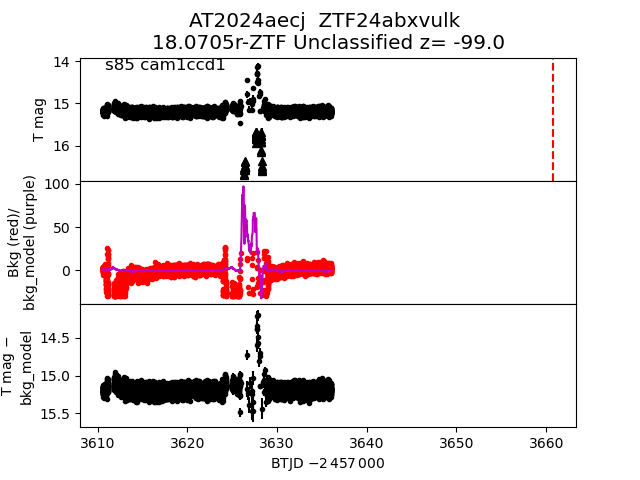
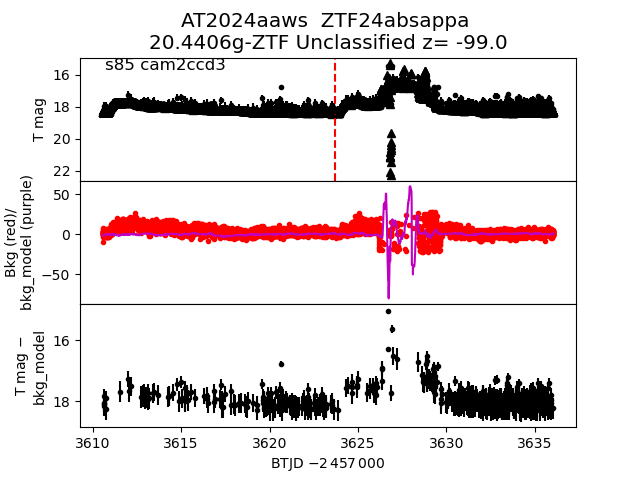
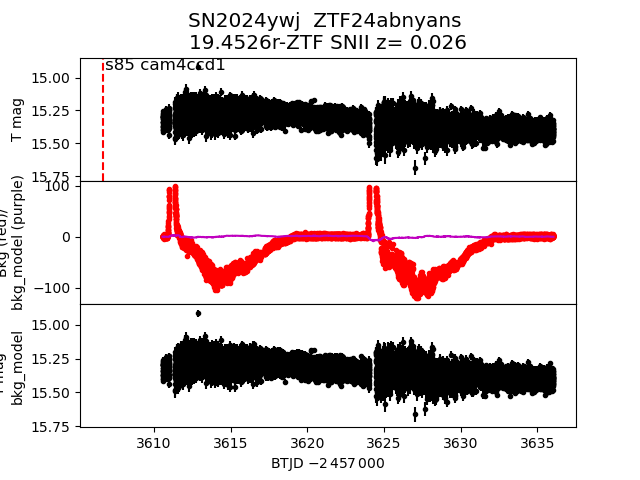
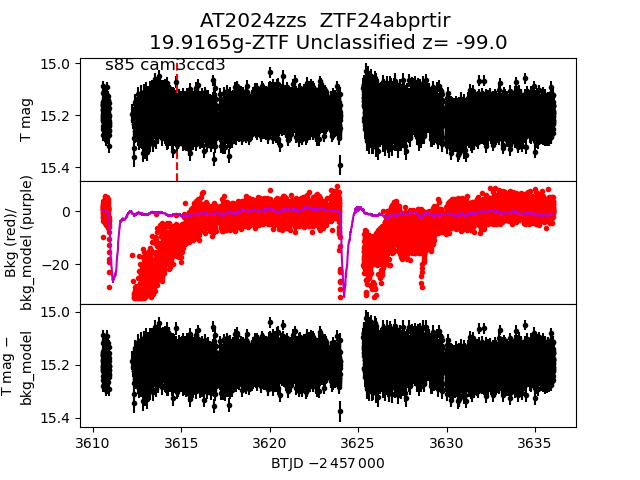
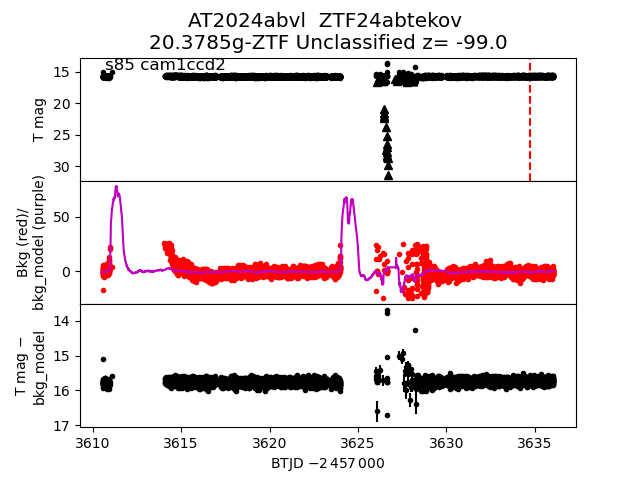
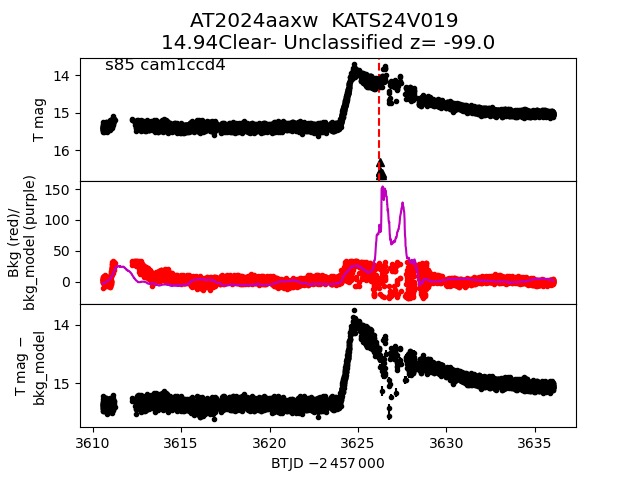
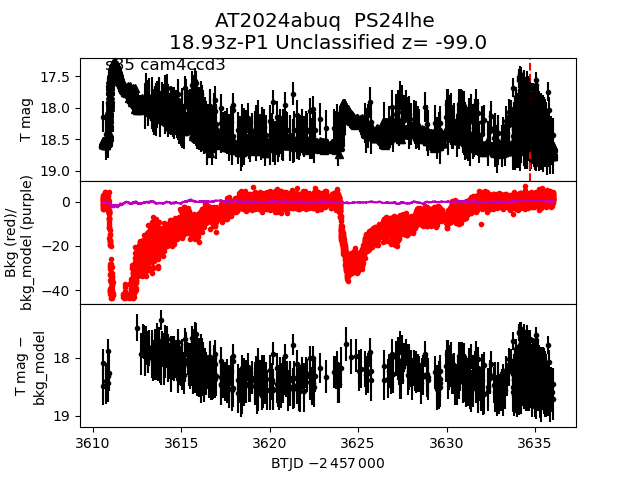
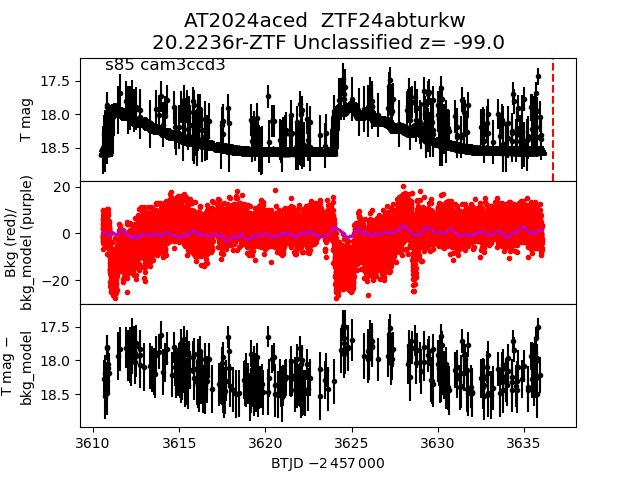
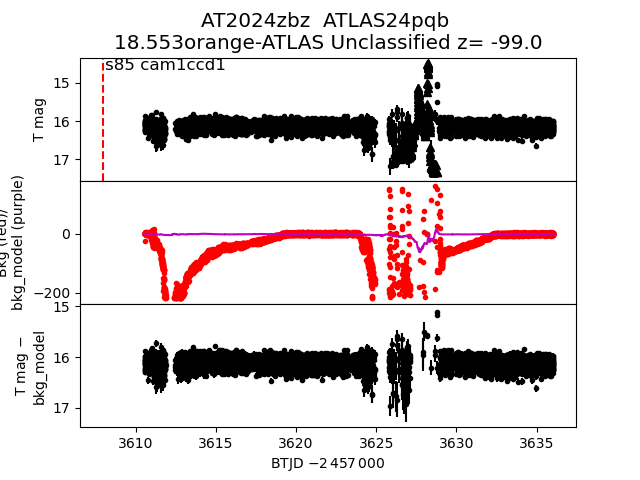
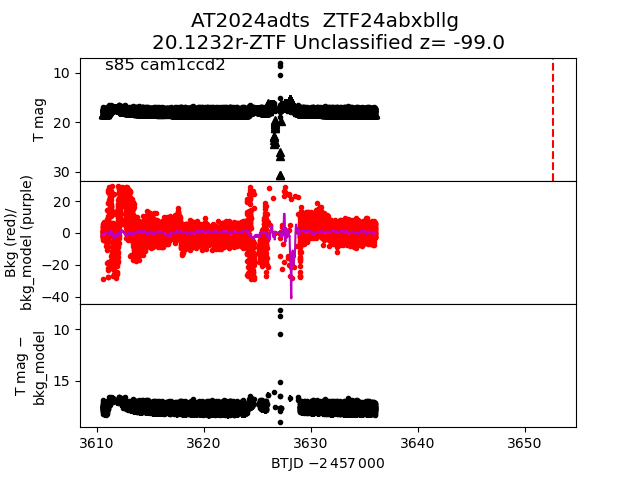
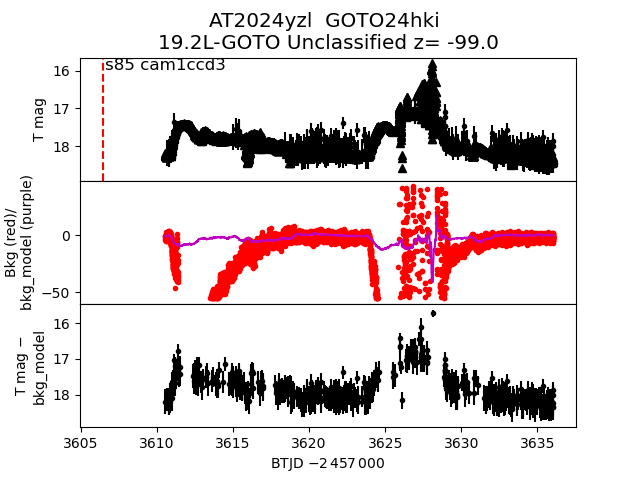
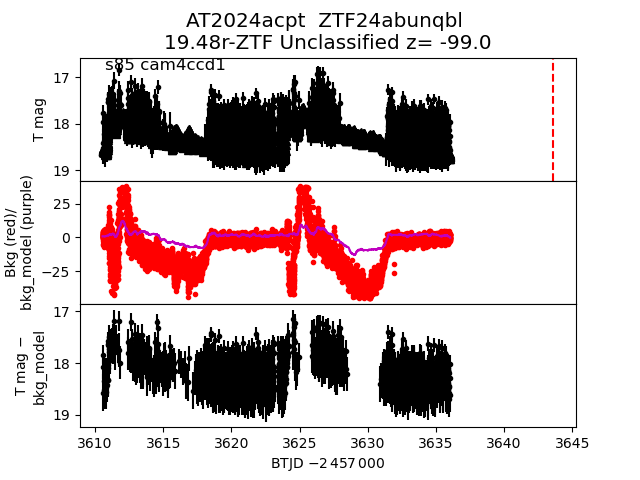
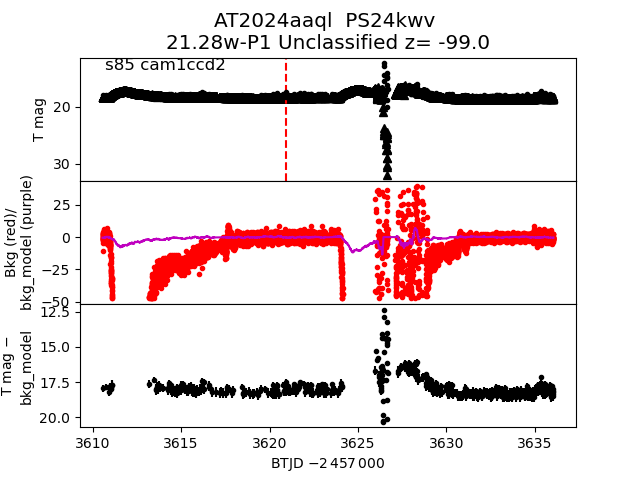
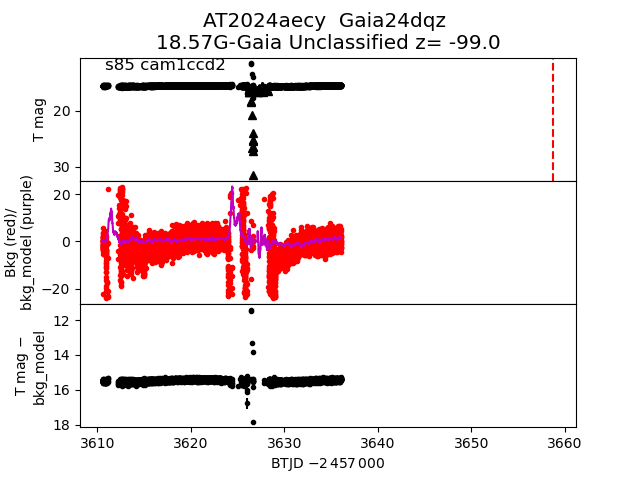
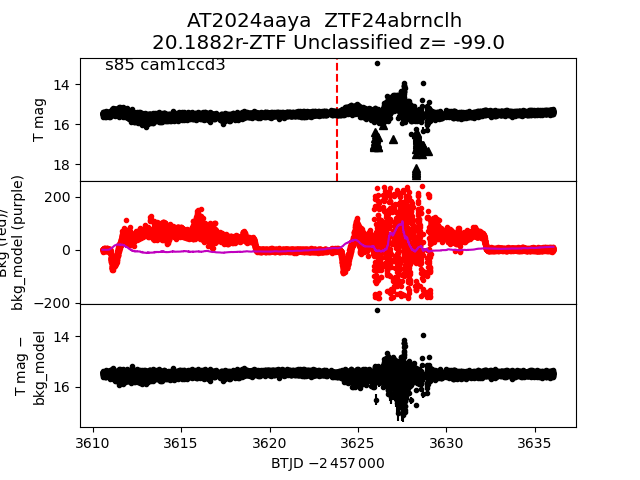
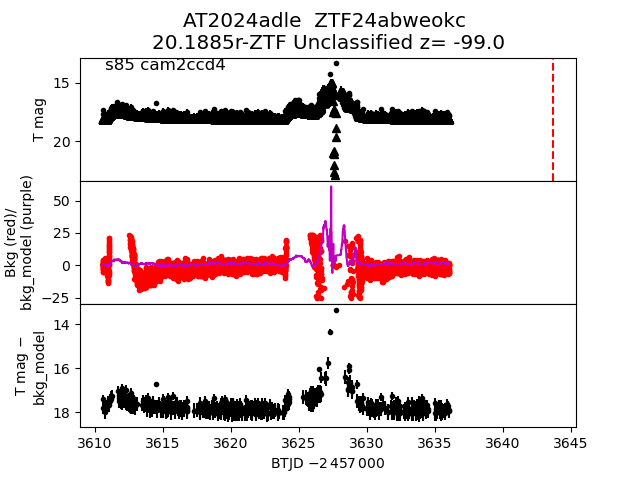
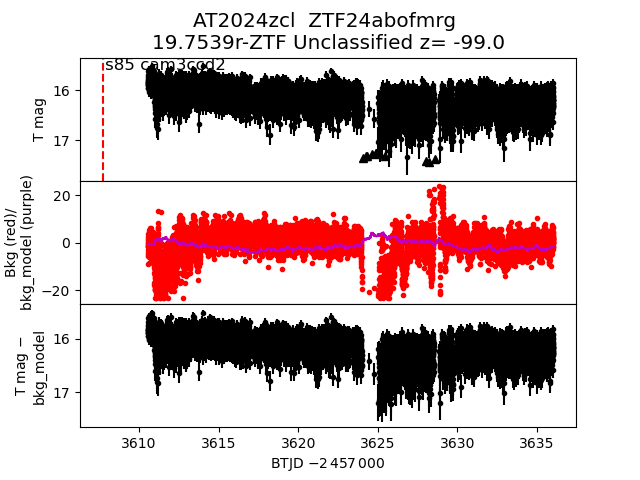
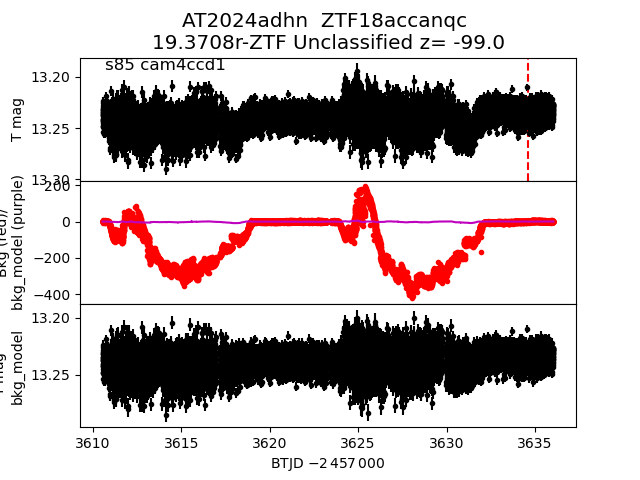
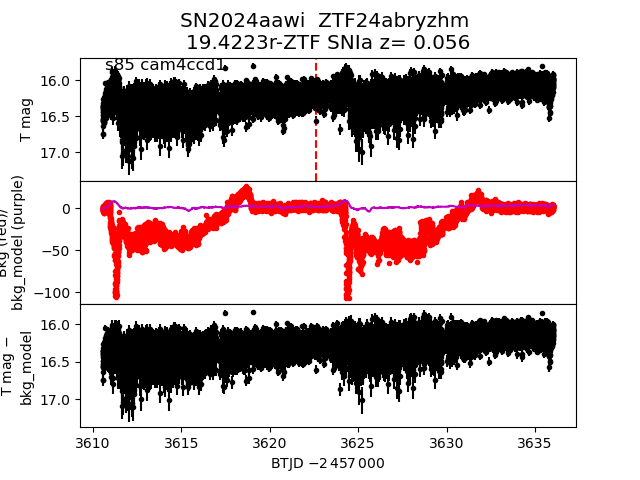
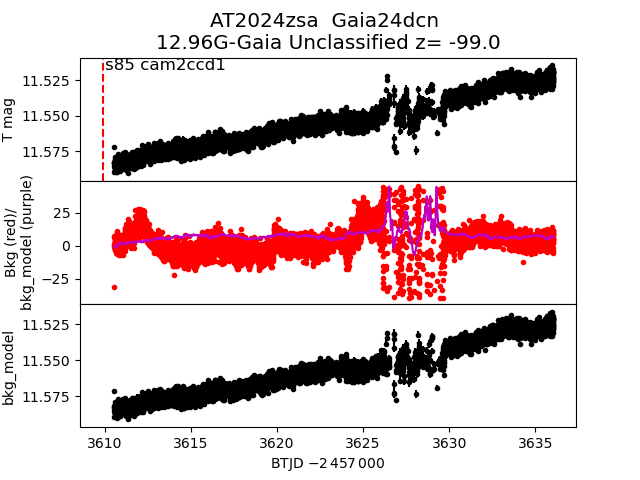
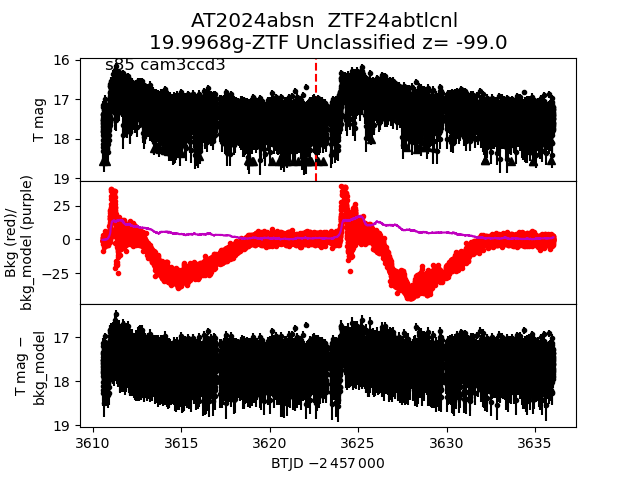
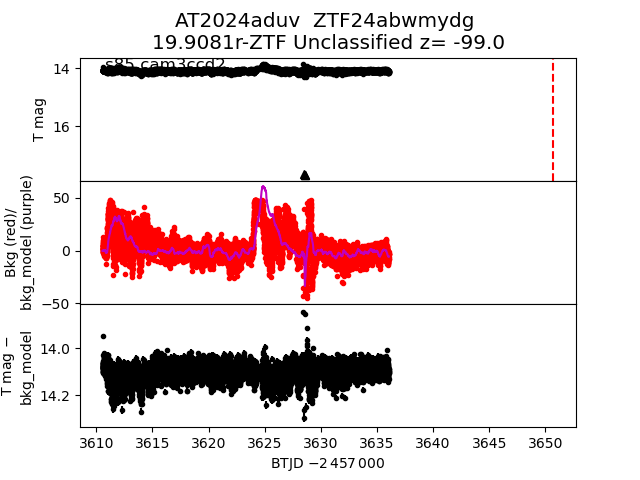
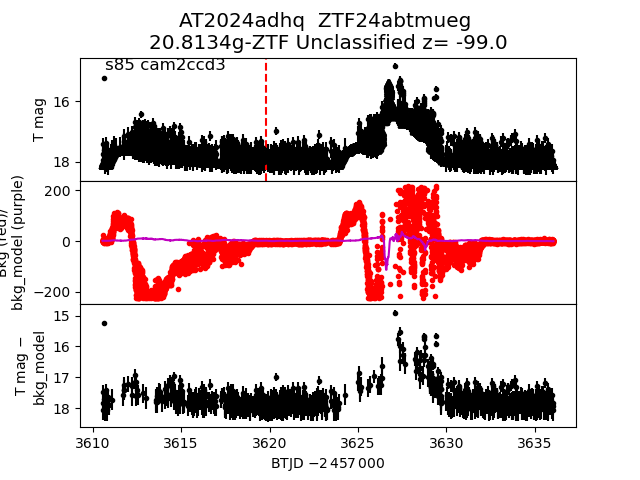
Each figure has three panels. The top panel shows the transient light curve, the middle panel shows the local background (estimated in an annulus), and the bottom panel shows a "background-model corrected" light curve. Details about the background model are in the README.
The vertical red line marks the time of discovery reported to TNS. Other useful metadata from TNS is in the figure title.
Note that the top and bottom panel are in magnitudes, while the middle panel is in differential flux units. The magnitudes are calibrated to the flux in the reference image used for image subtraction. Thus, flux from the host galaxy is included in these magnitudes.
3-sigma upper limits are plotted as triangles with no errorbars. A typical limiting magnitude is 19.6 in 30 minutes or 18.4 in 200 seconds (for low backgrounds).
The links allow you to download the light curve data as a text file.
More details in the README.
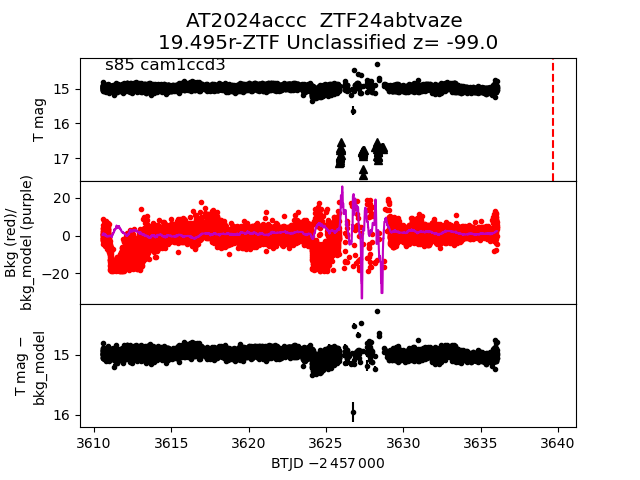
2024accc
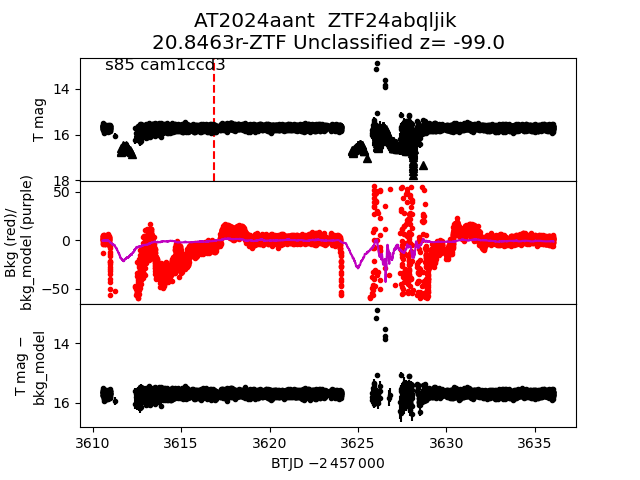
 2024aant
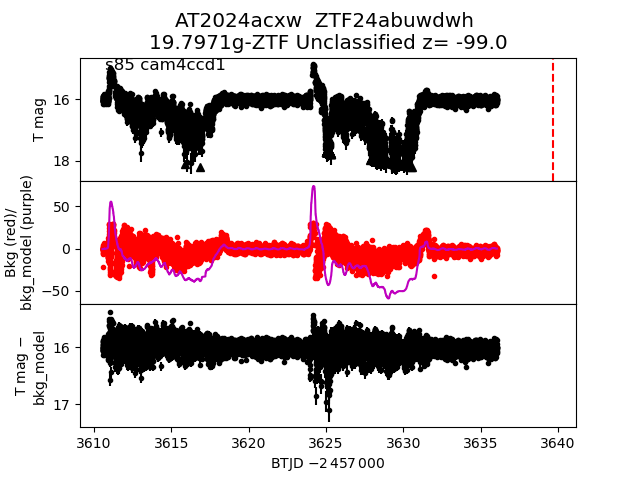
 2024acxw
 2024acep
 2024aale
 2024adhv
 2024abrz
 2024aeda
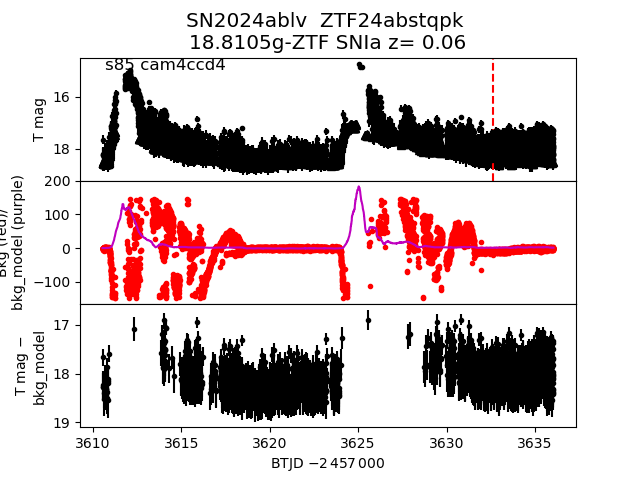
 2024ablv
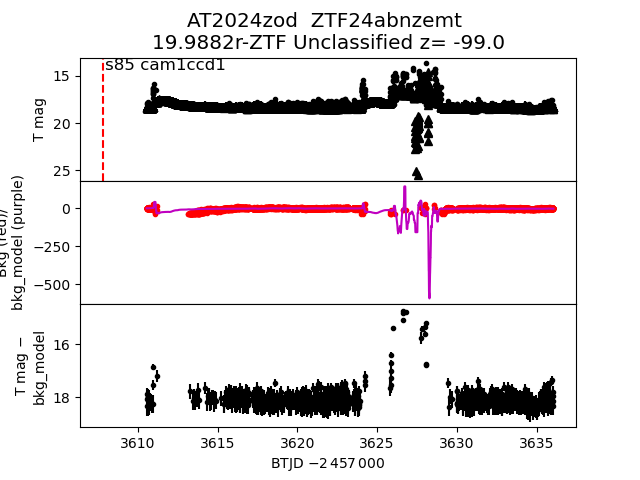
 2024zod
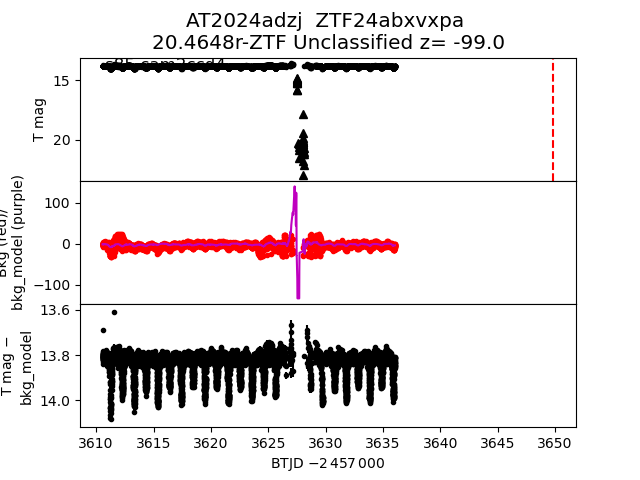
 2024adzj
 2024zhd
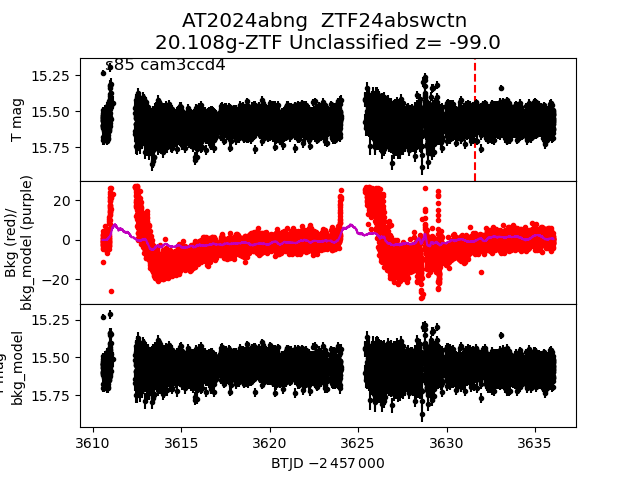
 2024abng
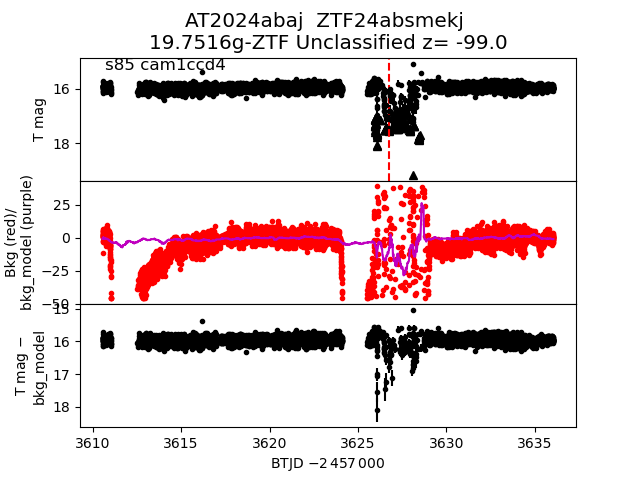
 2024abaj
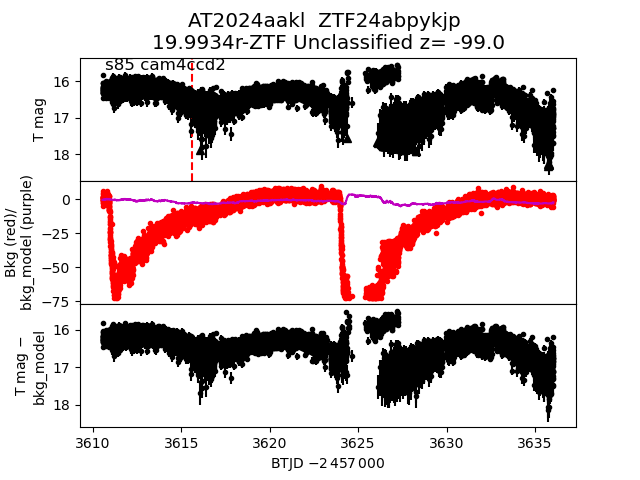
 2024aakl
 2024acpv
 2024adub
 2024abvt
 2024aebw
 2024aaus
 2024acah
 2024abss
 2024adfr
 2024zav
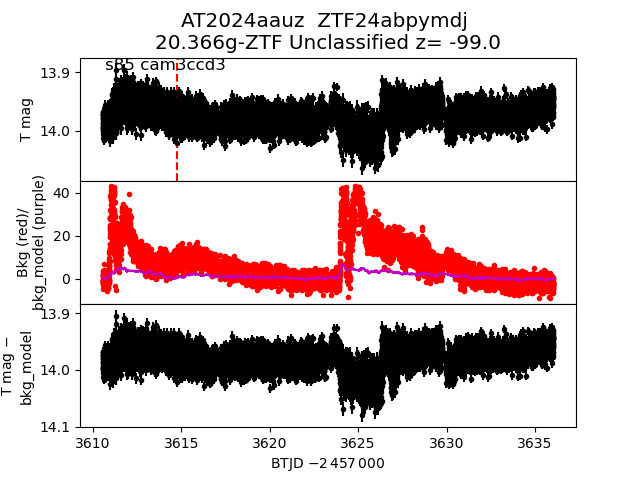
 2024aauz
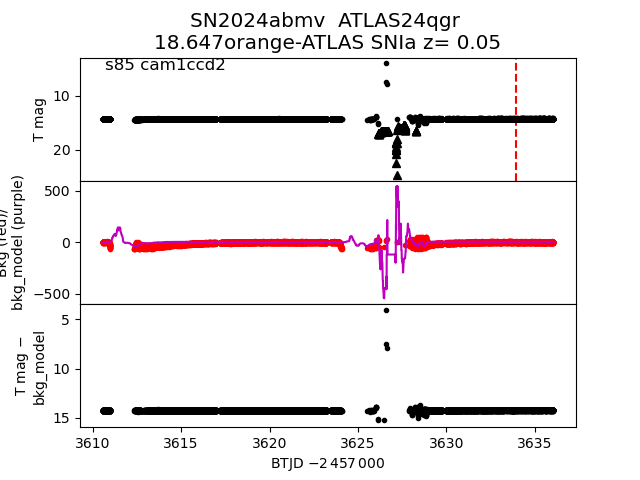
 2024abmv
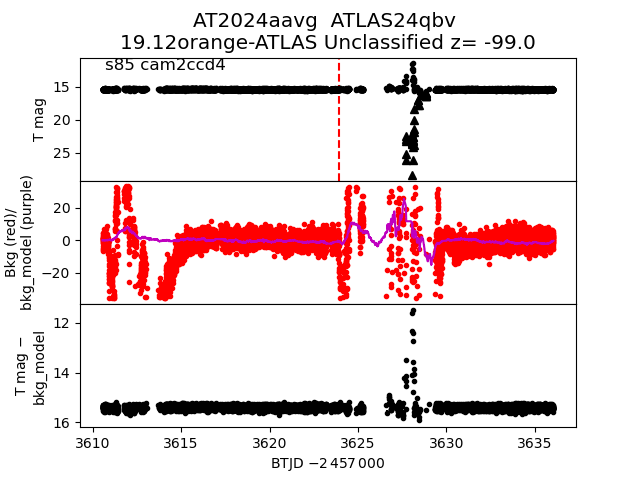
 2024aavg
 2024adfn
 2024advj
 2024adhp
 2024adfq
 2024adwp
 2024aecg
 2024ztv
 2024adpo
 2024abkp
 2024acxx
 2024aaxl
 2024aeas
 2024aalo
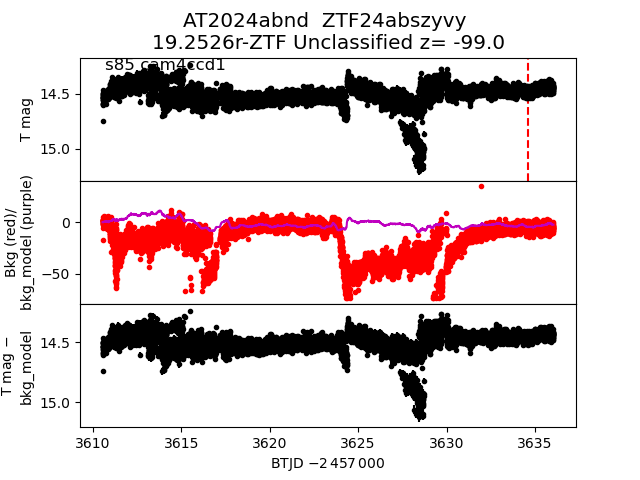
 2024abnd
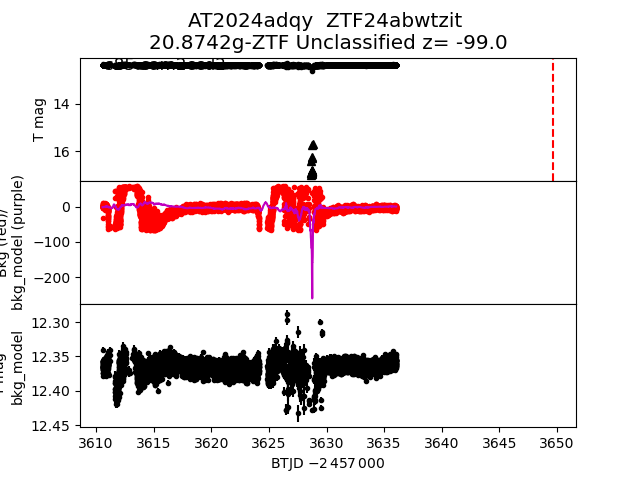
 2024adqy
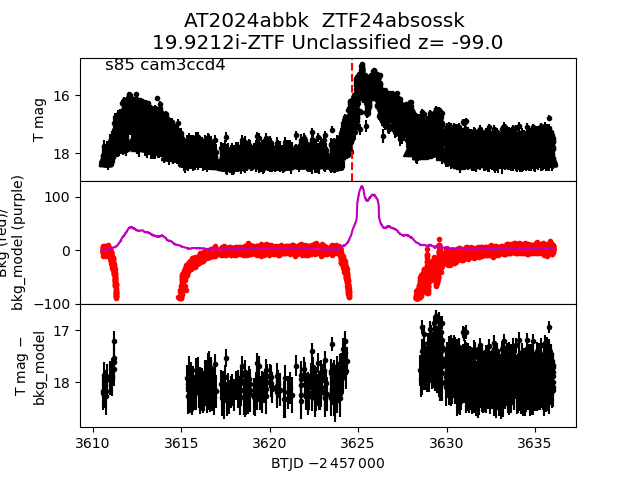
 2024abbk
 2024aakp
 2024zuv
 2024aaso
 2024aava
 2024aalf
 2024abuf
 2024adpc
 2024ztz
 2024aapu
 2024zuq
 2024abnj
 2024aeds
 2024admc
 2024adih
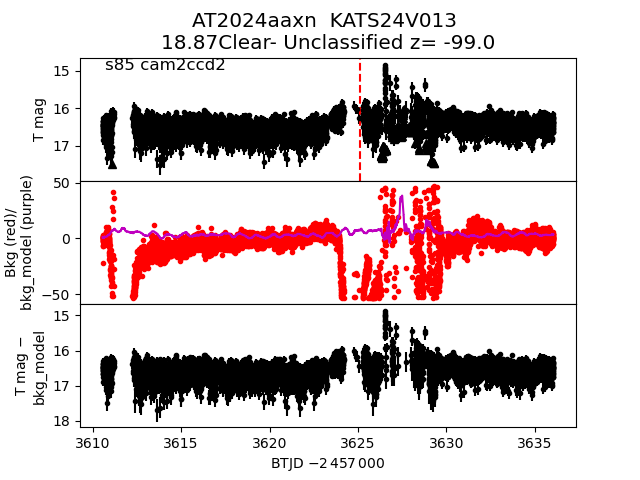
 2024aaxn
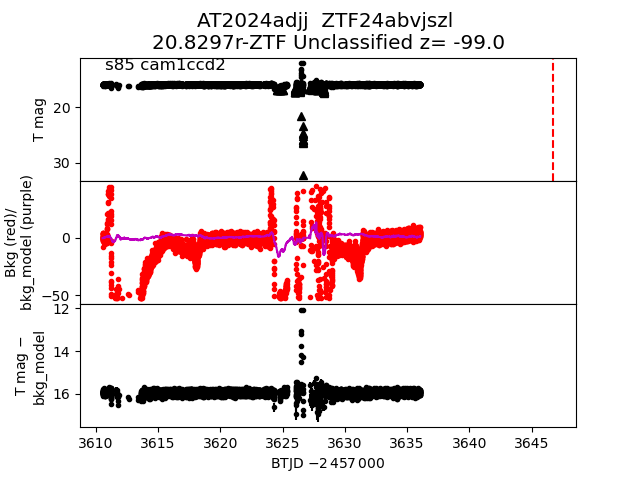
 2024adjj
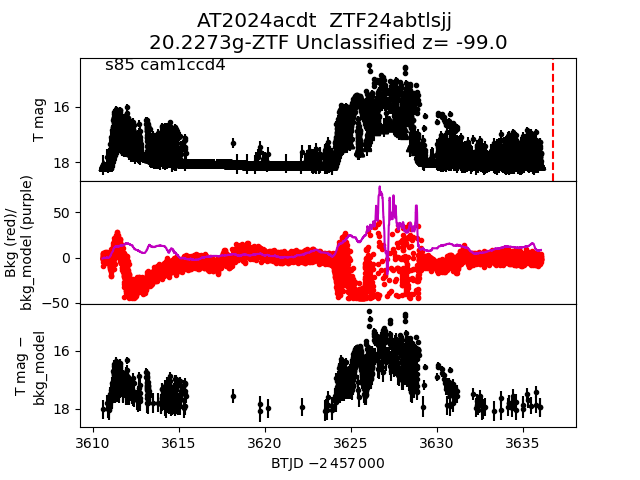
 2024acdt
 2024abyb
 2024acyl
 2024aboj
 2024abth
 2024aavc
 2024zqi
 2024adhw
 2024acbn
 2024adbk
 2024aaxb
 2024zuk
 2024adge
 2024aawl
 2024acca
 2024aecj
 2024aaws
 2024ywj
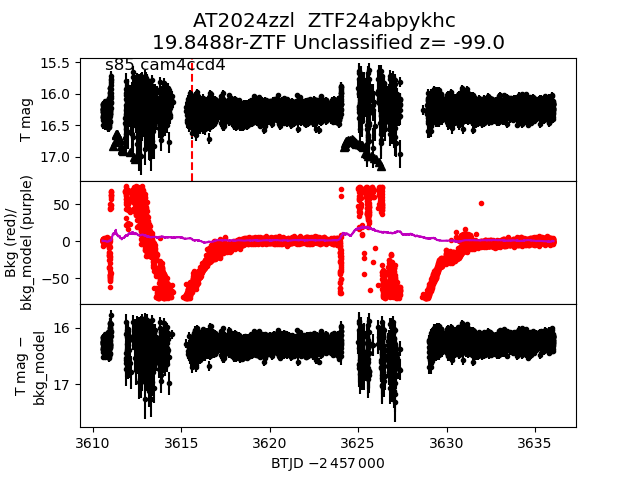
 2024zzl
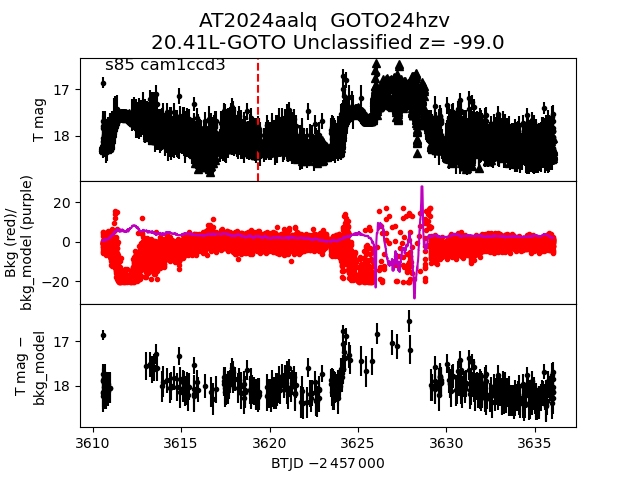
 2024aalq
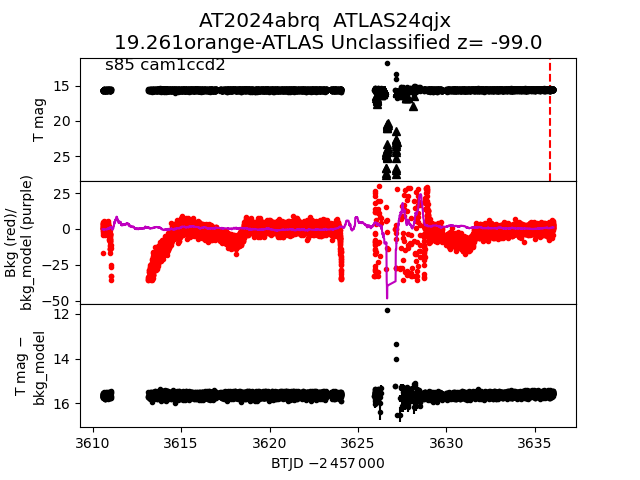
 2024abrq
 2024zzs
 2024abvl
 2024aaxw
 2024abuq
 2024aced
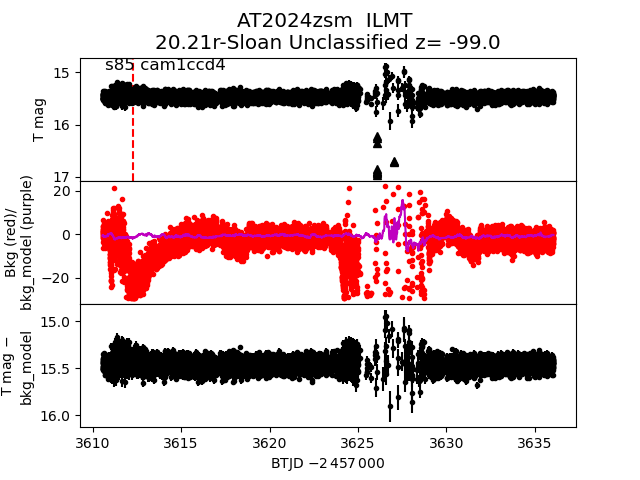
 2024zsm
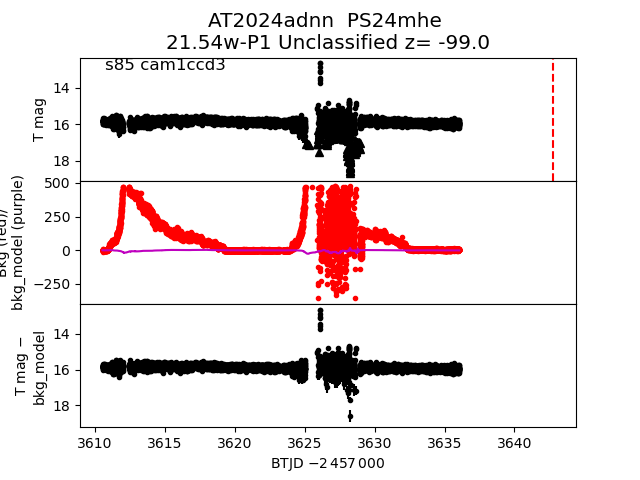
 2024adnn
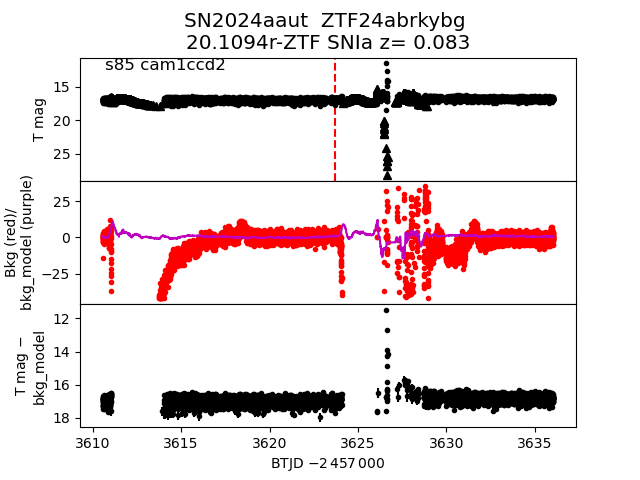
 2024aaut
 2024zbz
 2024adts
 2024yzl
 2024acpt
 2024aaql
 2024aecy
 2024aaya
 2024adle
 2024zcl
 2024adhn
 2024aawi
 2024zsa
 2024absn
 2024aduv
 2024adhq
 2024advk