all transients in sector82 (48 total)
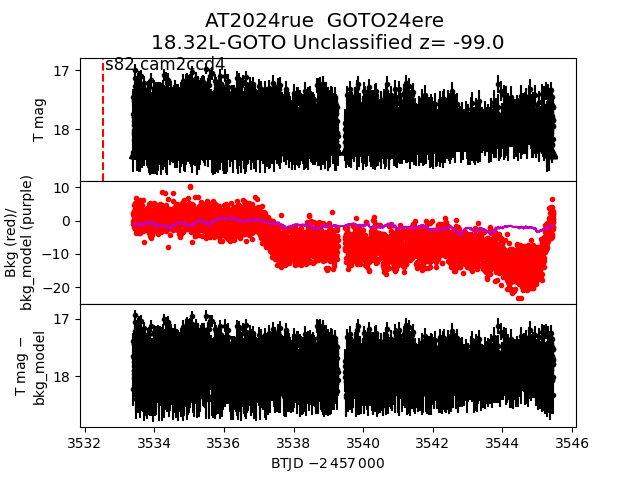
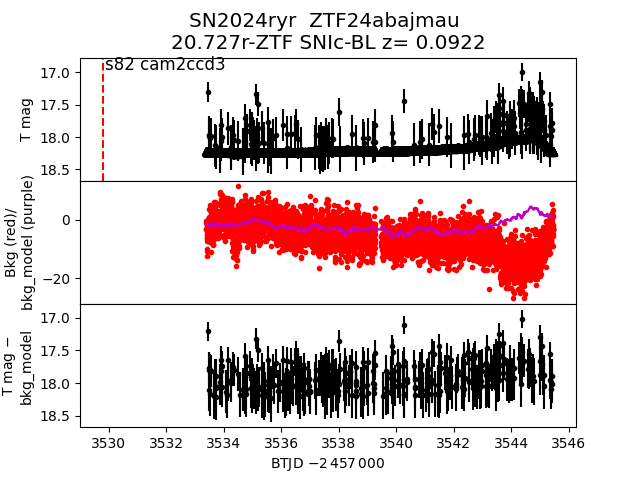
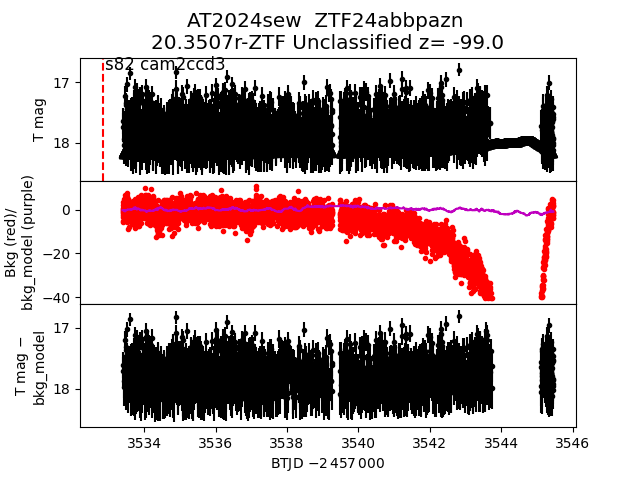
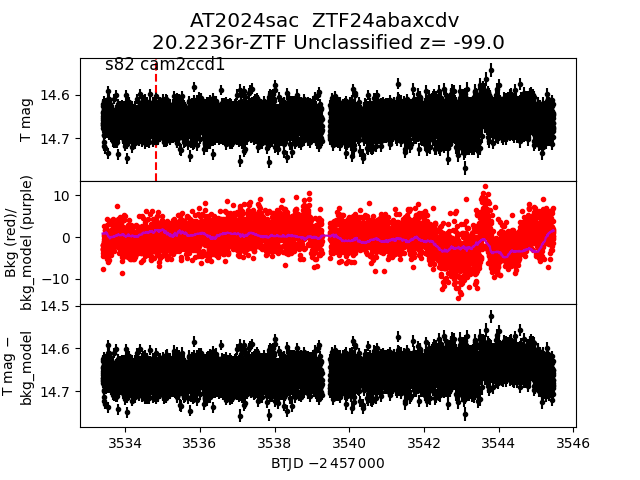
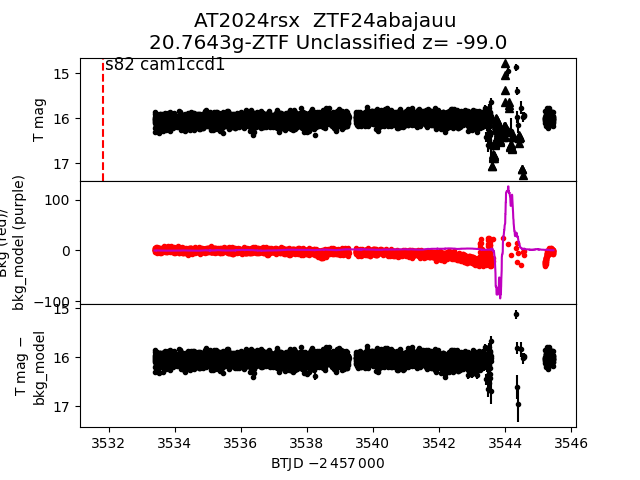
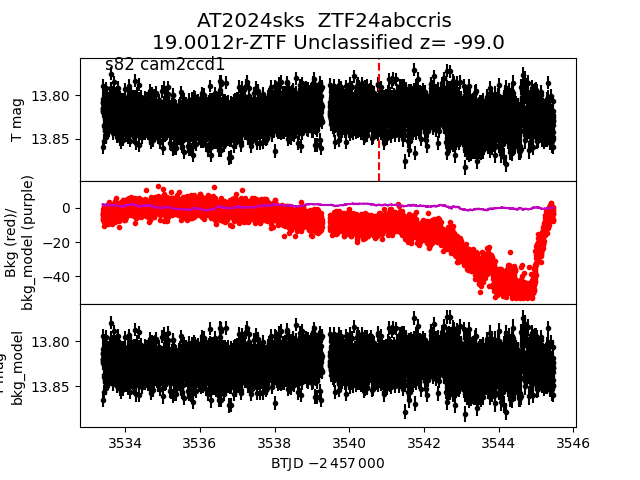
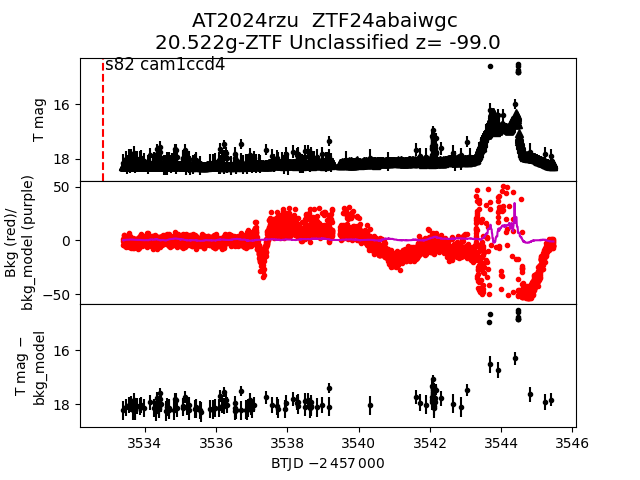
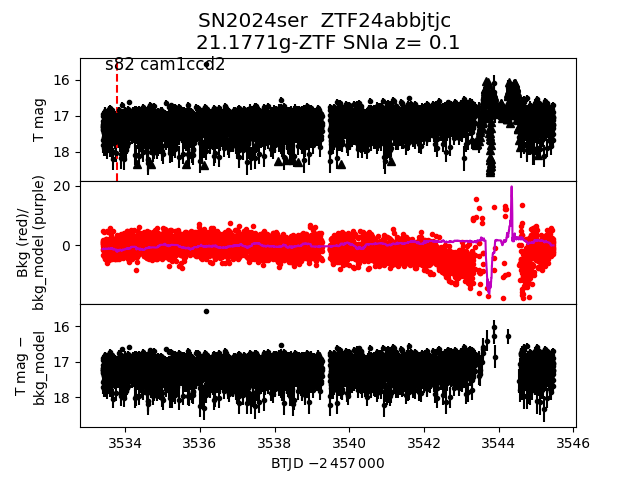
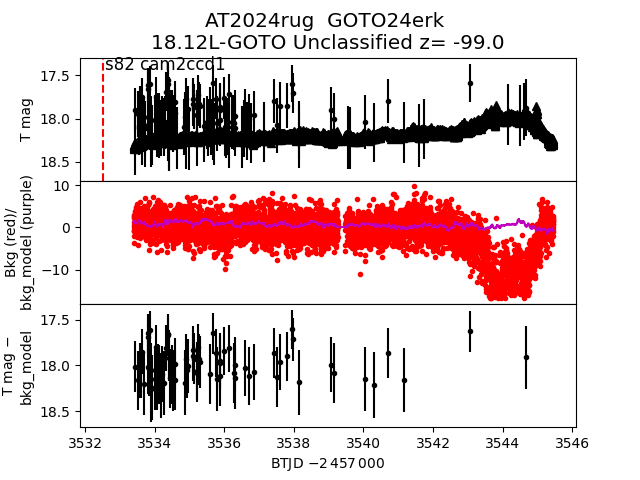
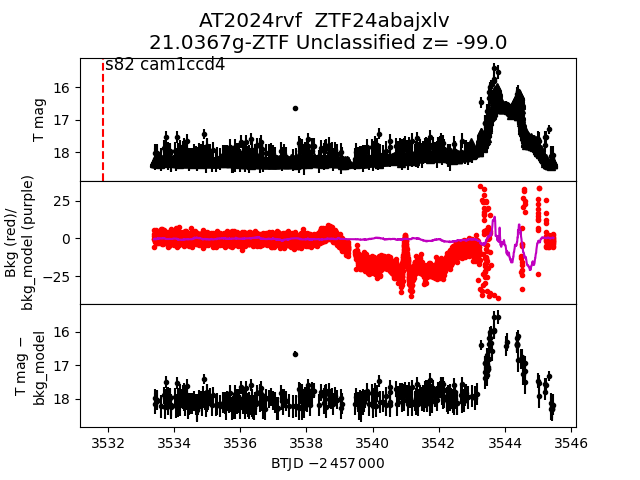
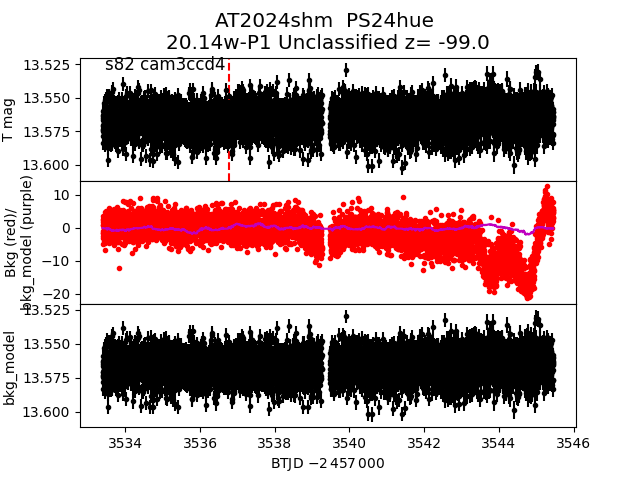
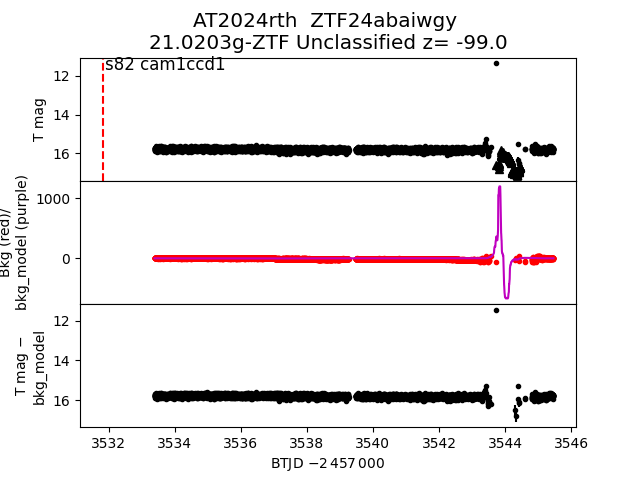
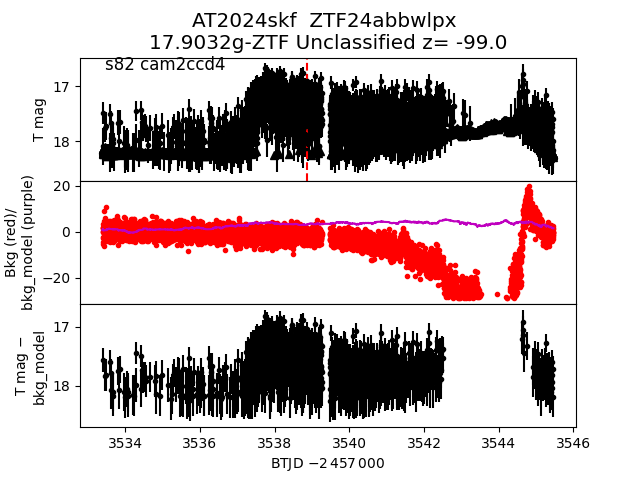
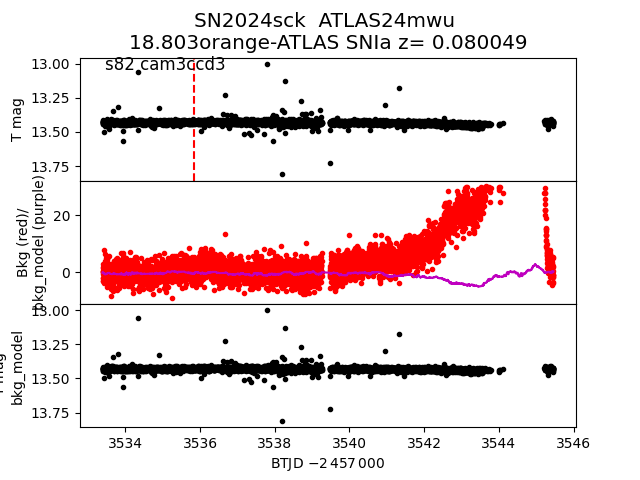
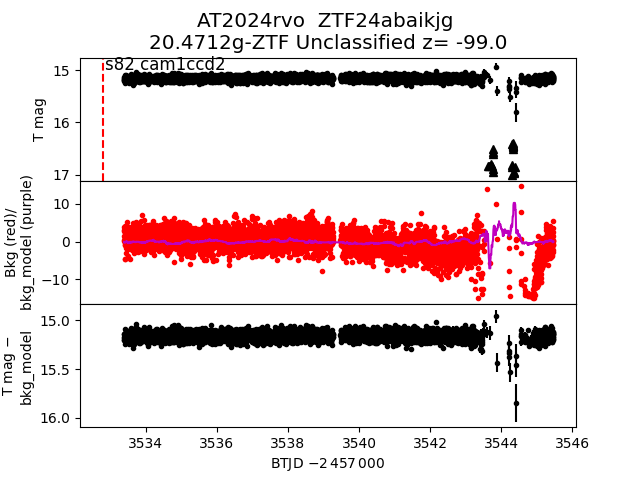
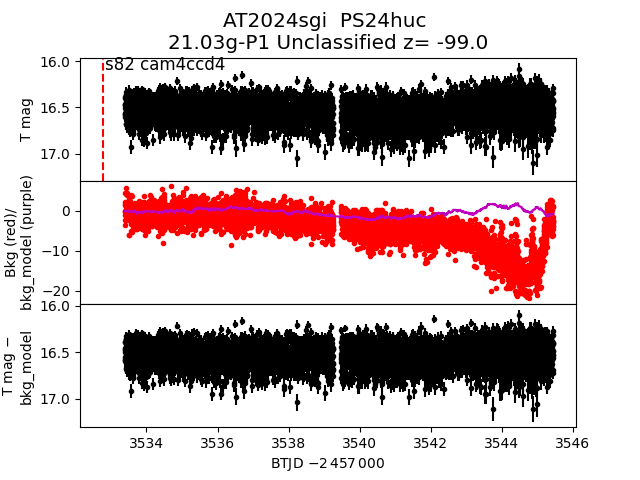
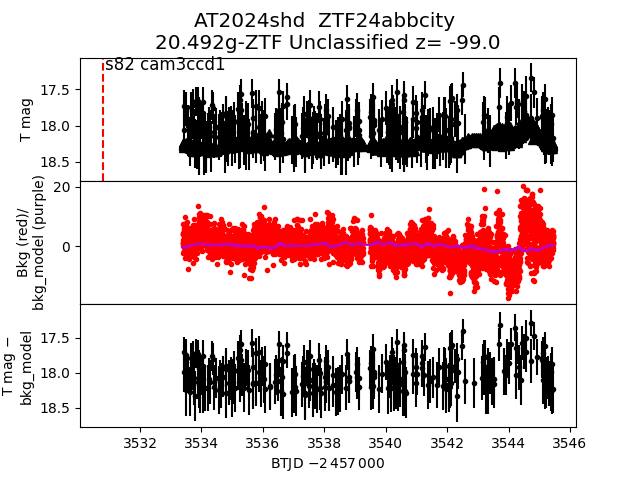
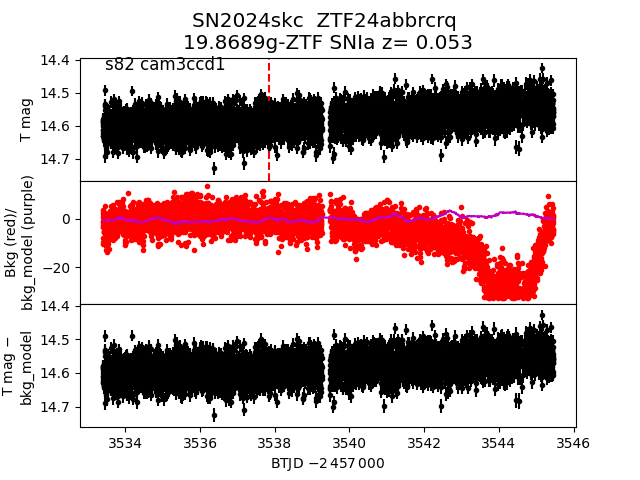
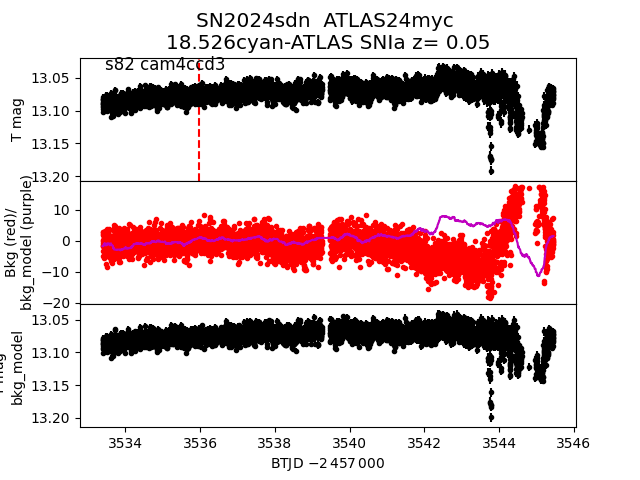
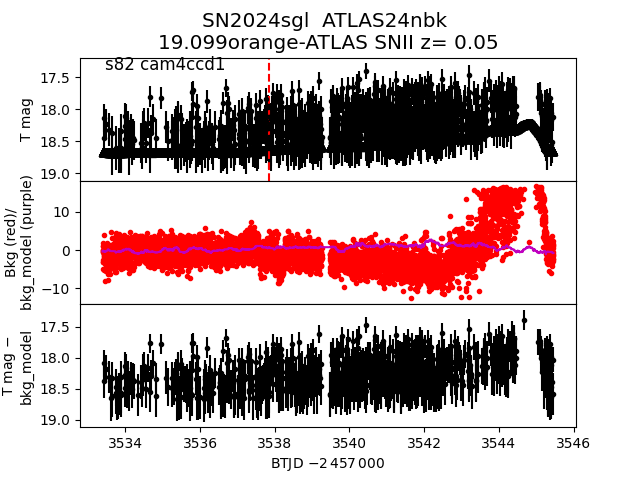
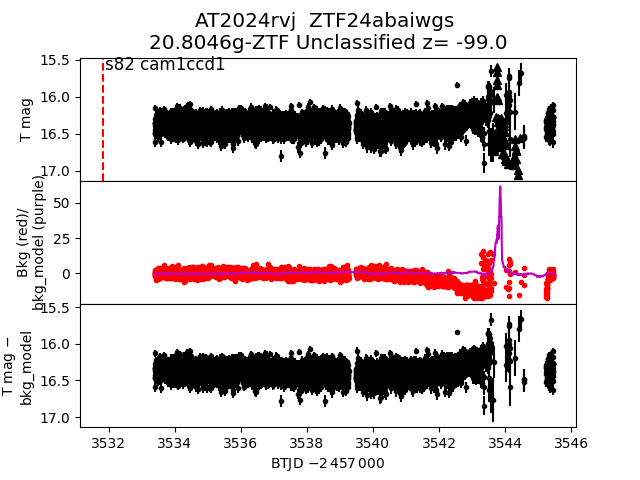
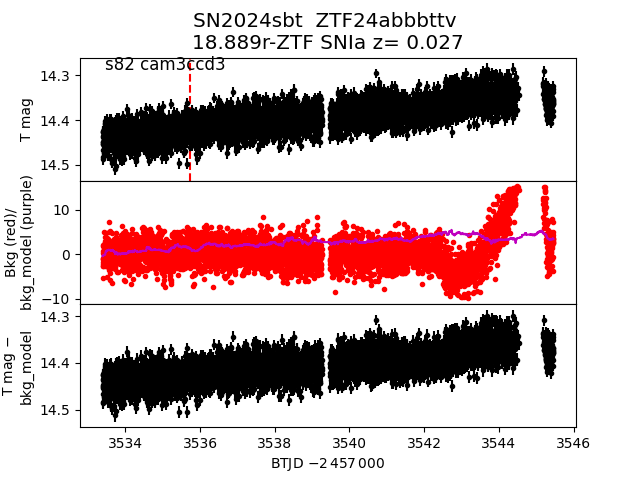
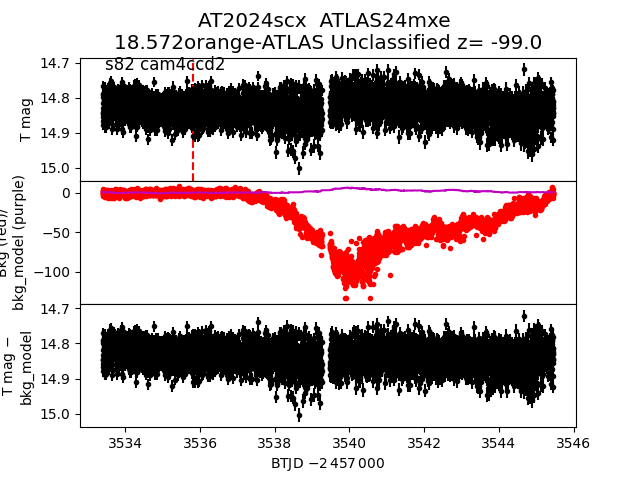
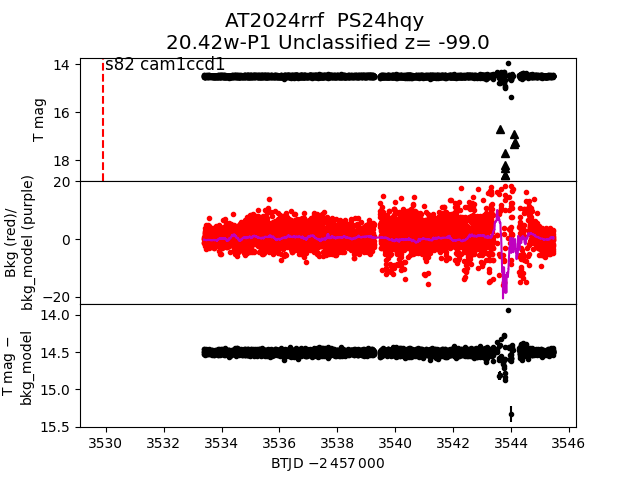
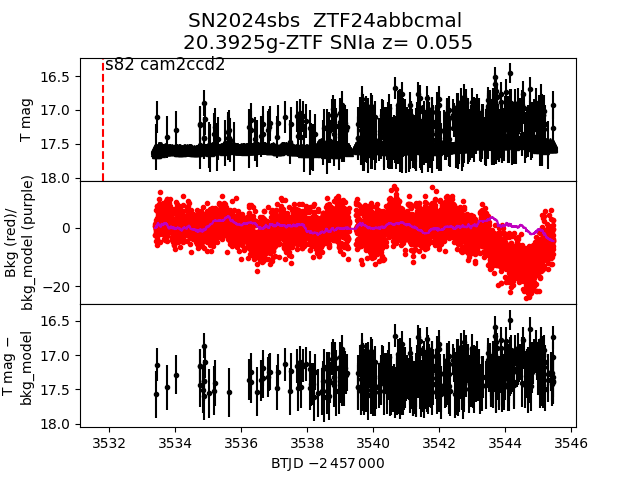
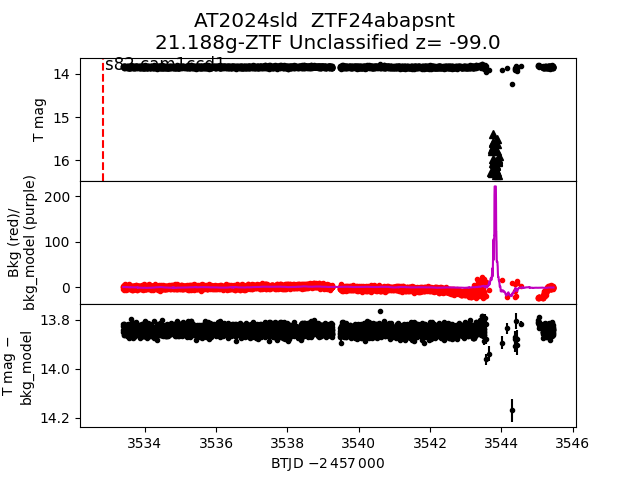
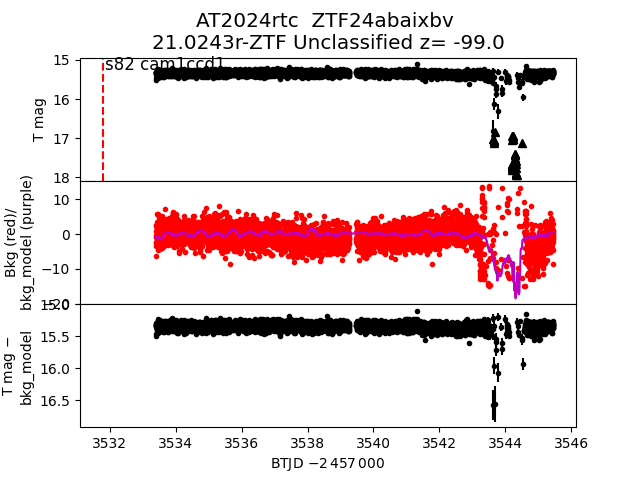
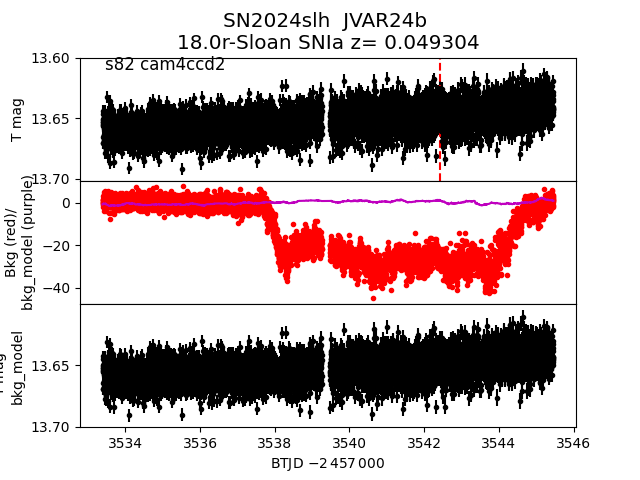
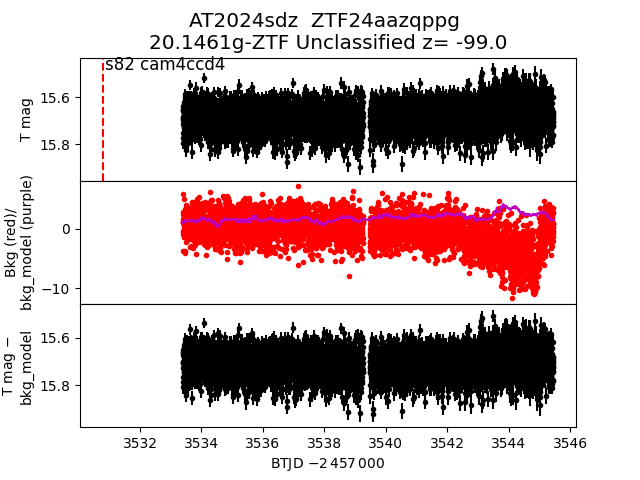
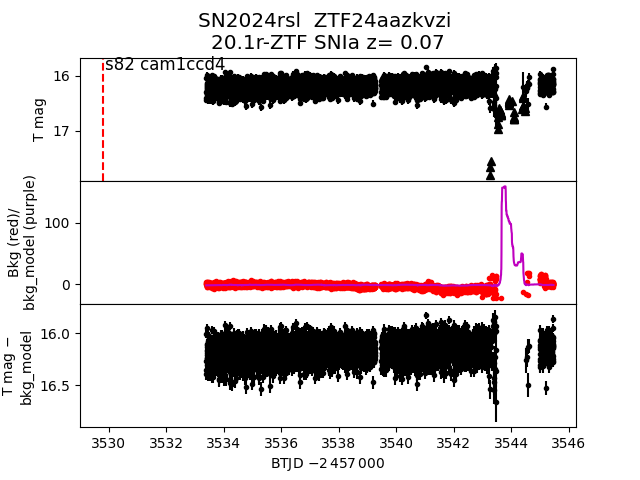
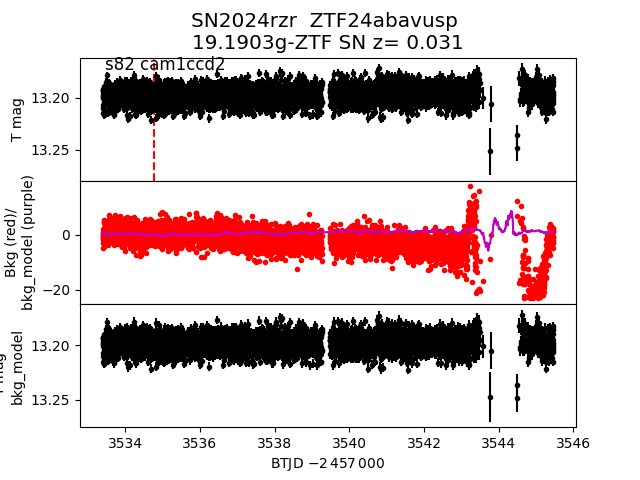
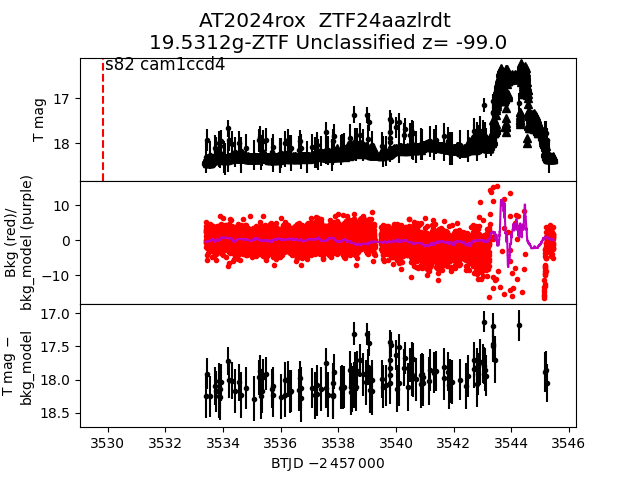
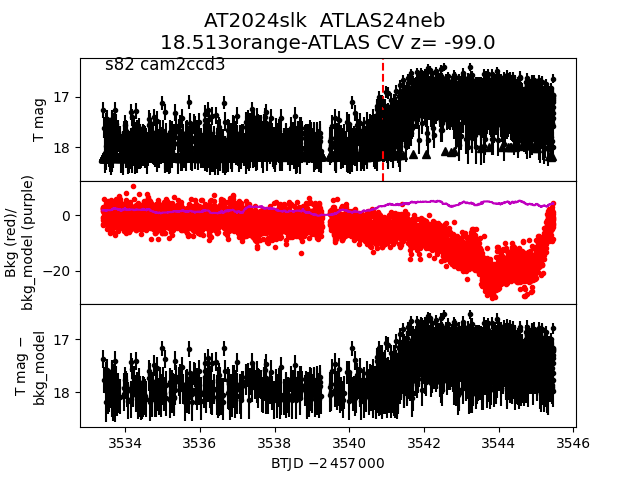
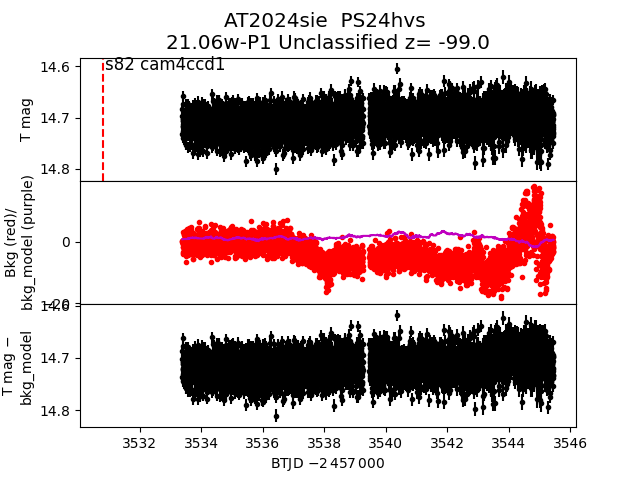
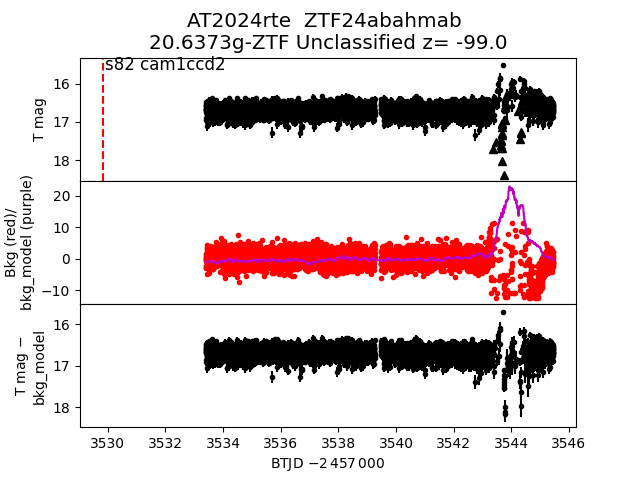
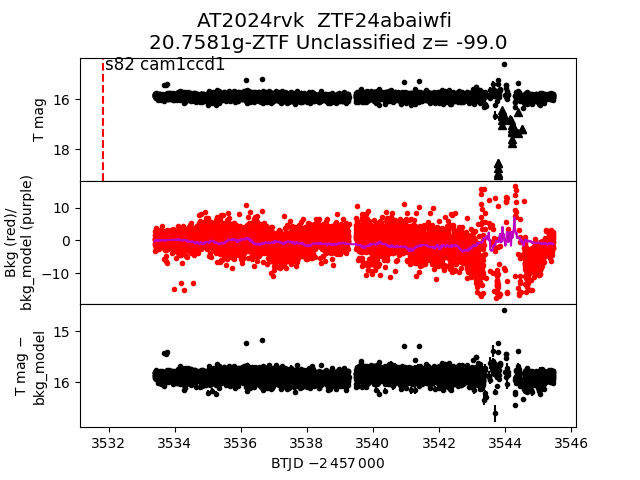
Each figure has three panels. The top panel shows the transient light curve, the middle panel shows the local background (estimated in an annulus), and the bottom panel shows a "background-model corrected" light curve. Details about the background model are in the README.
The vertical red line marks the time of discovery reported to TNS. Other useful metadata from TNS is in the figure title.
Note that the top and bottom panel are in magnitudes, while the middle panel is in differential flux units. The magnitudes are calibrated to the flux in the reference image used for image subtraction. Thus, flux from the host galaxy is included in these magnitudes.
3-sigma upper limits are plotted as triangles with no errorbars. A typical limiting magnitude is 19.6 in 30 minutes or 18.4 in 200 seconds (for low backgrounds).
The links allow you to download the light curve data as a text file.
More details in the README.
2024ryr
 2024sew
 2024sac
 2024rsx
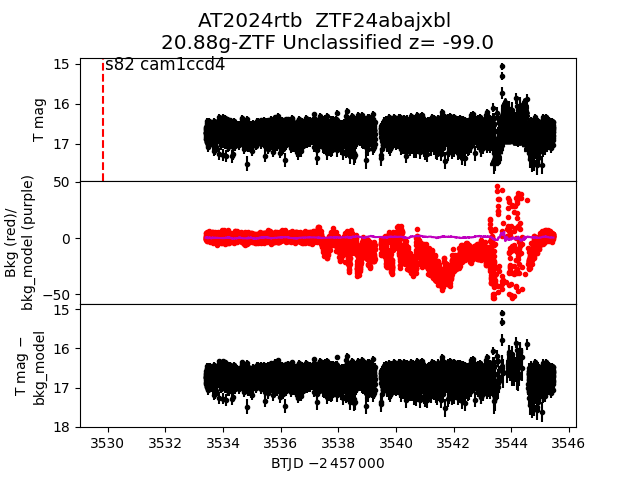
 2024rtb
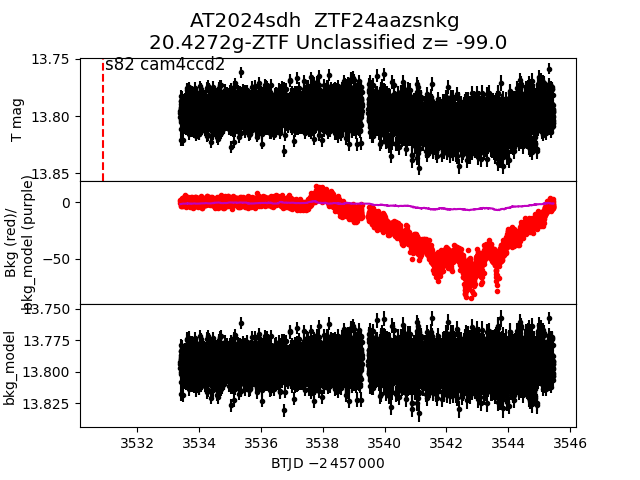
 2024sdh
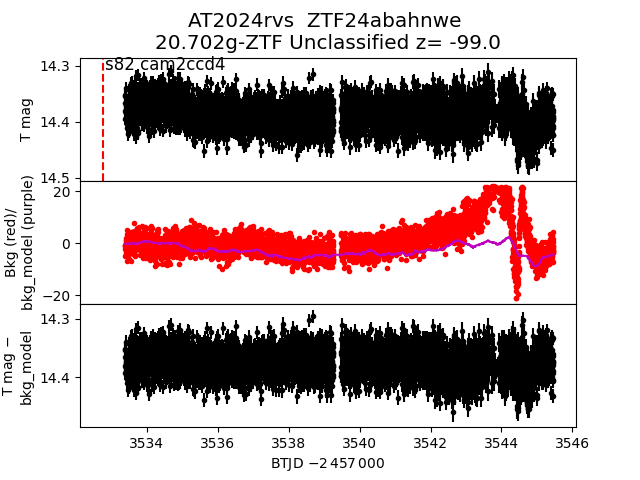
 2024rvs
 2024sks
 2024rzu
 2024ser
 2024rug
 2024rvf
 2024shm
 2024rth
 2024skf
 2024sck
 2024rvo
 2024sgi
 2024shd
 2024skc
 2024sdn
 2024sgl
 2024rvj
 2024sbt
 2024scx
 2024rrf
 2024sbs
 2024sld
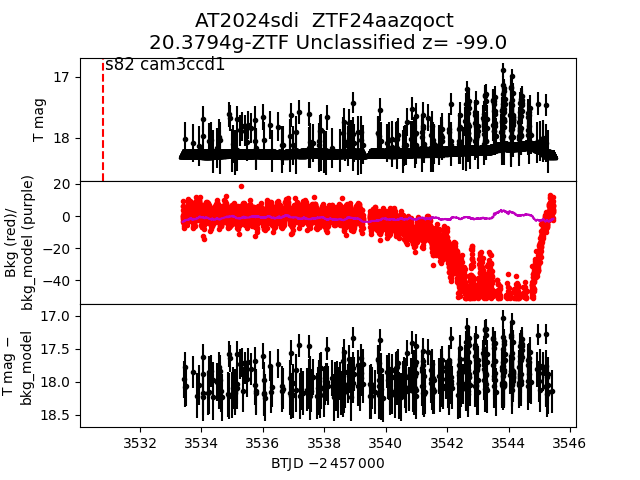
 2024sdi
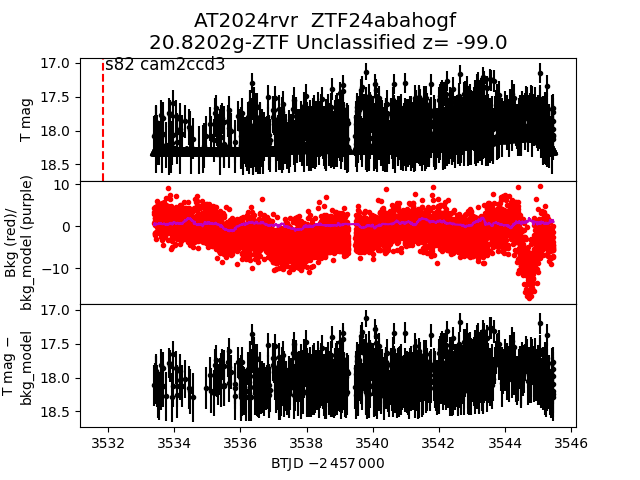
 2024rvr
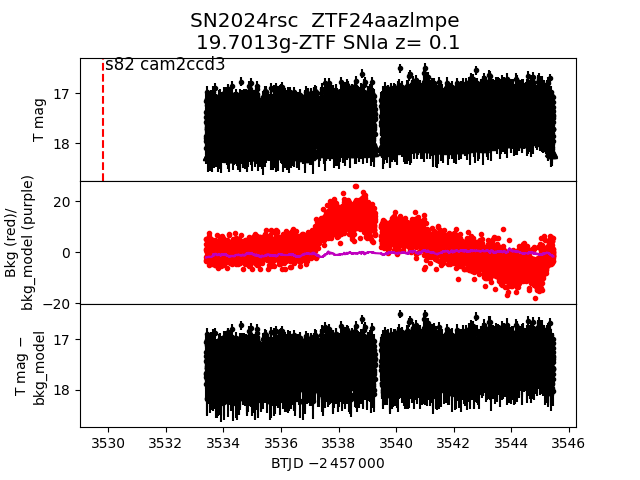
 2024rsc
 2024rtc
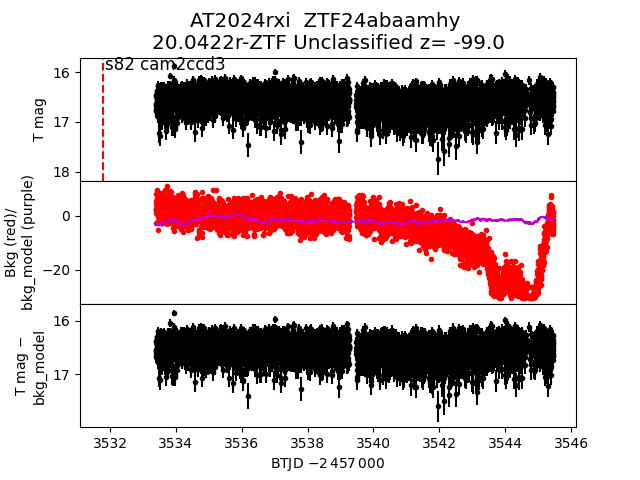
 2024rxi
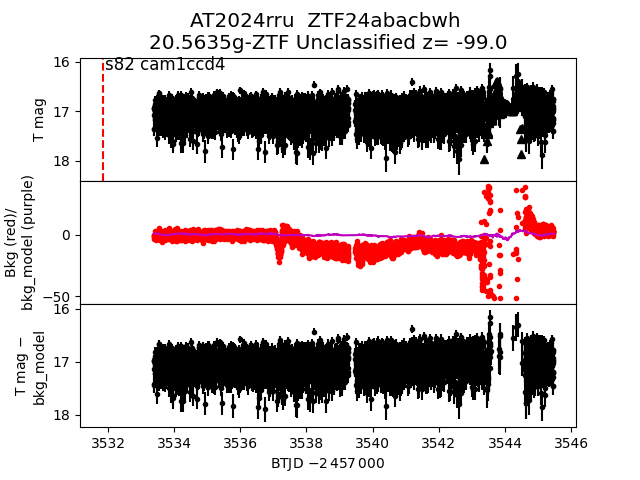
 2024rru
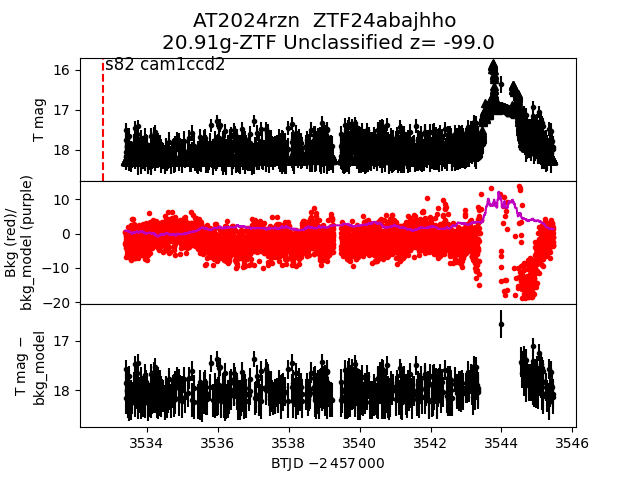
 2024rzn
 2024slh
 2024sdz
 2024rsl
 2024rzr
 2024rox
 2024slk
 2024sie
 2024rte
 2024rvk
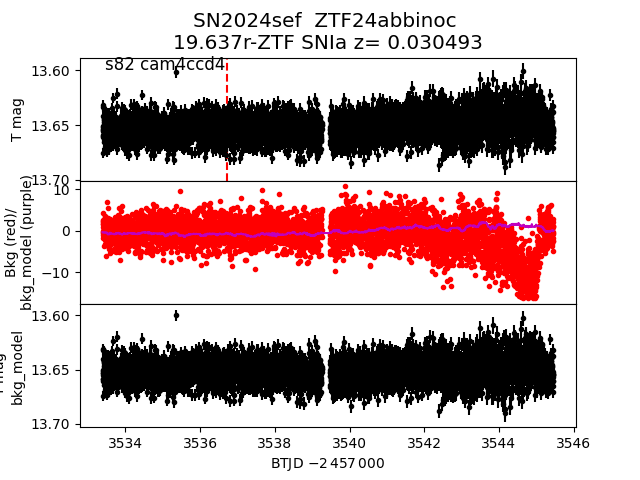
 2024sef
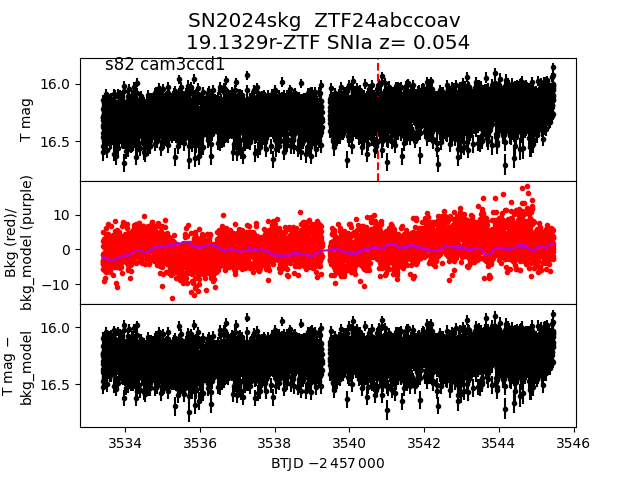
 2024skg
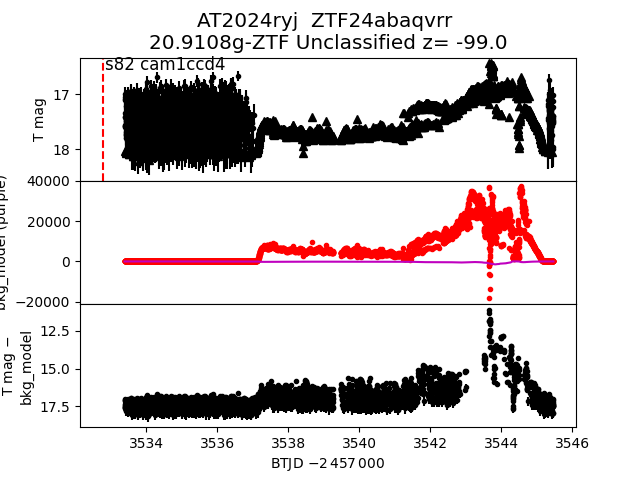
 2024ryj
 2024rue