sector79 supernovae (41 total)
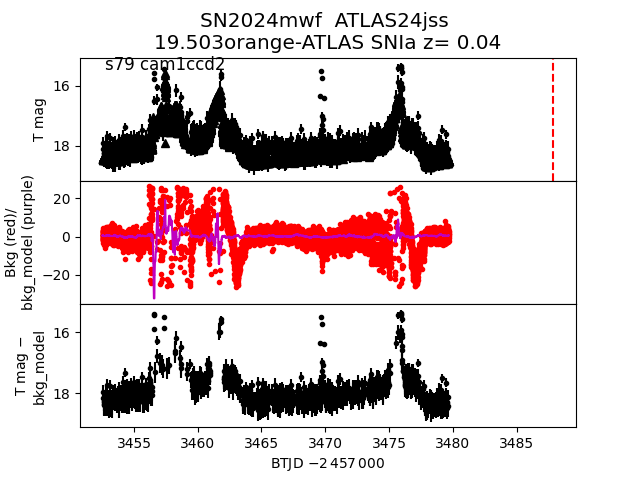
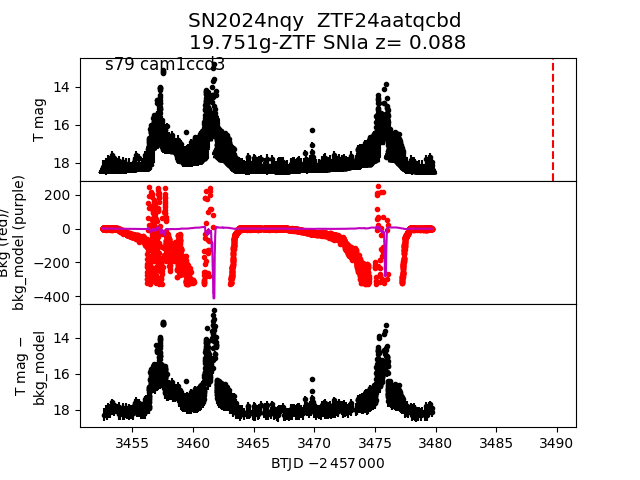
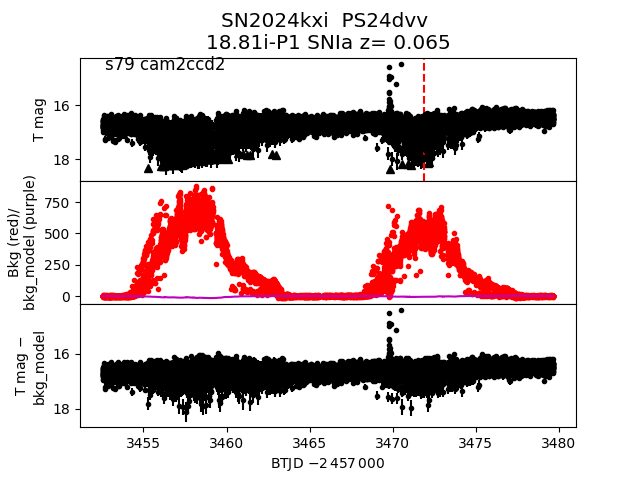
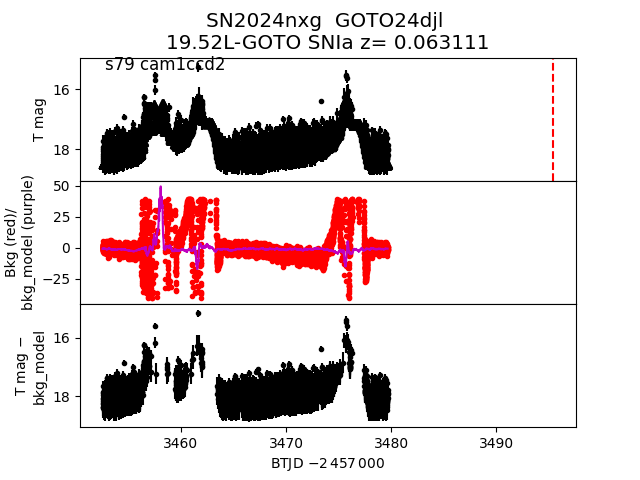
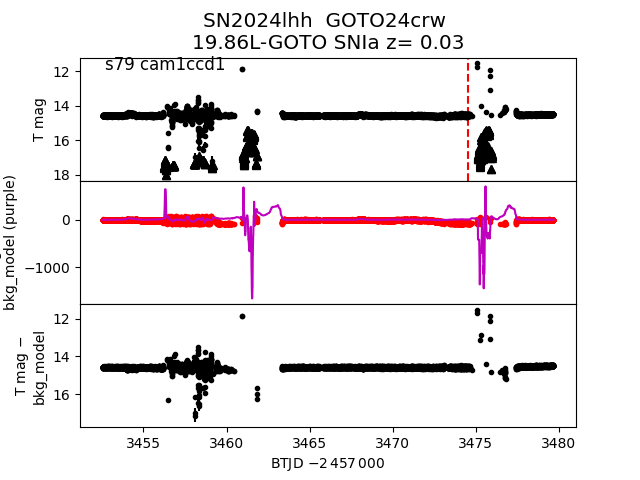
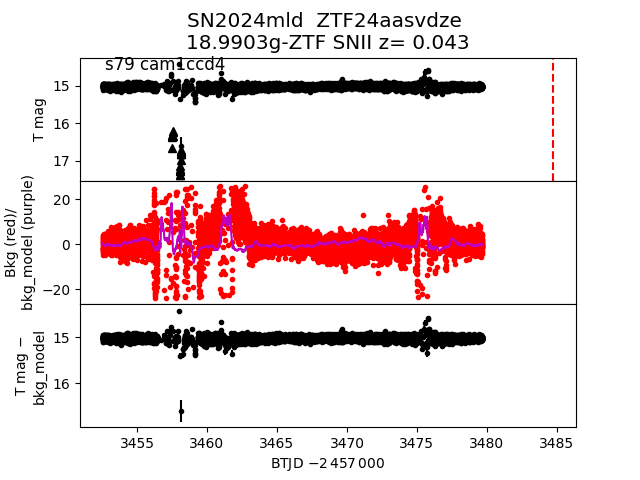
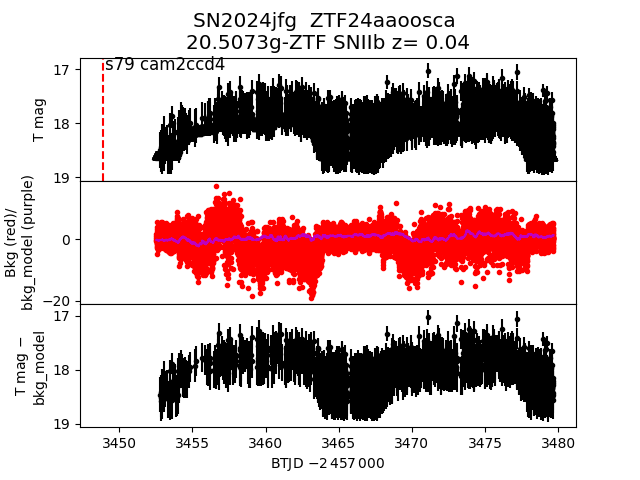
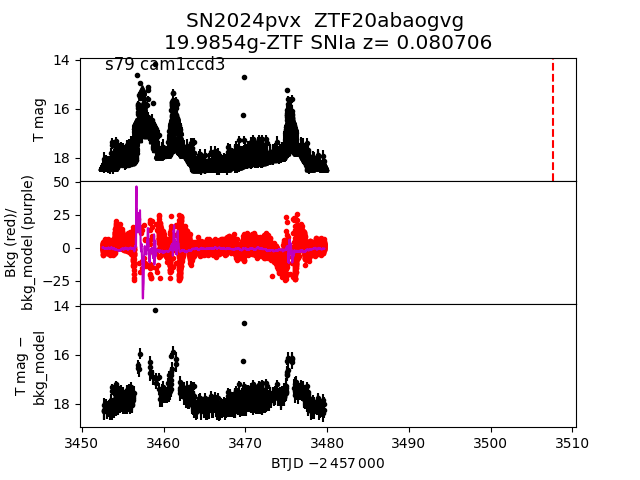
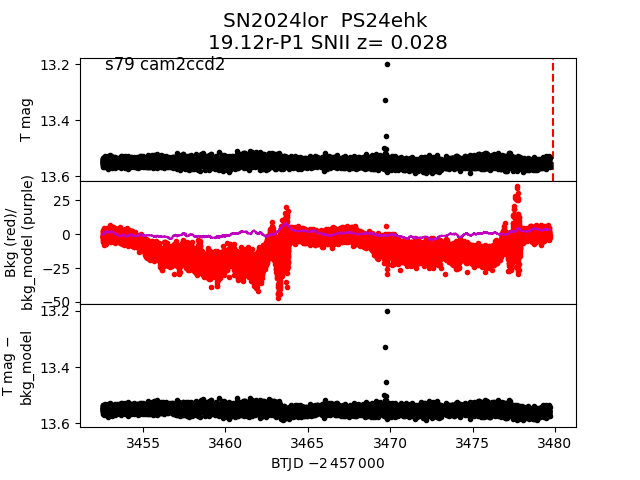
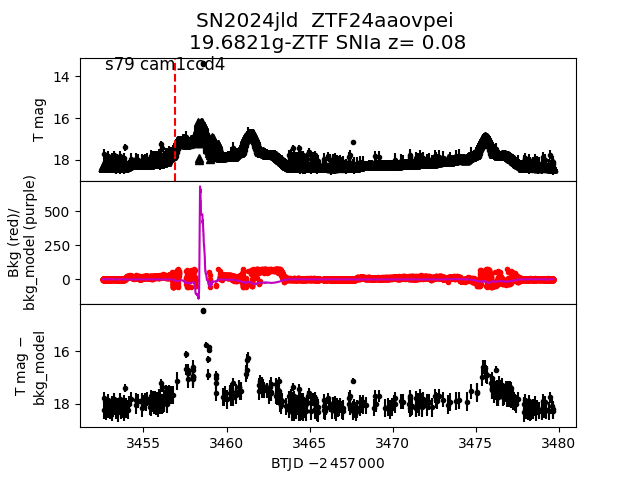
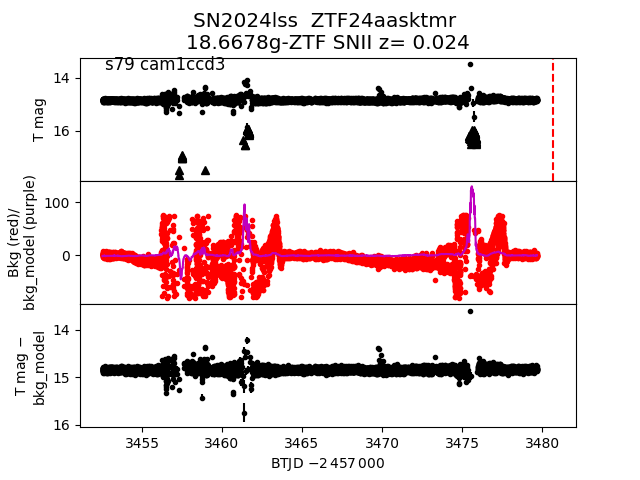
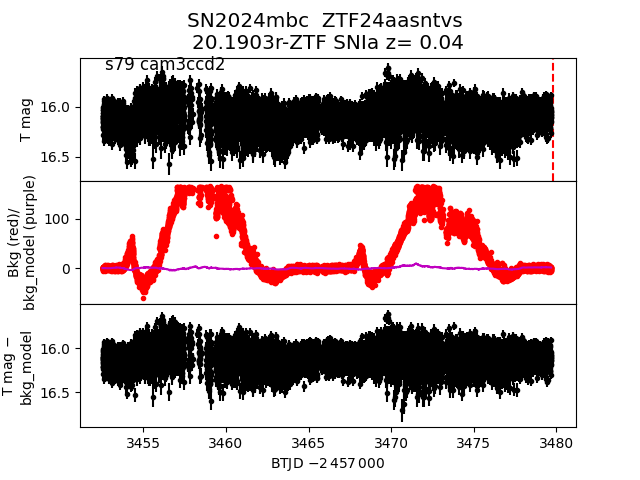
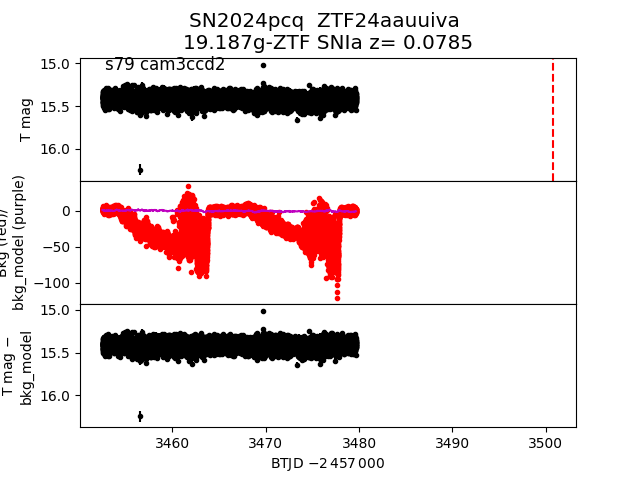
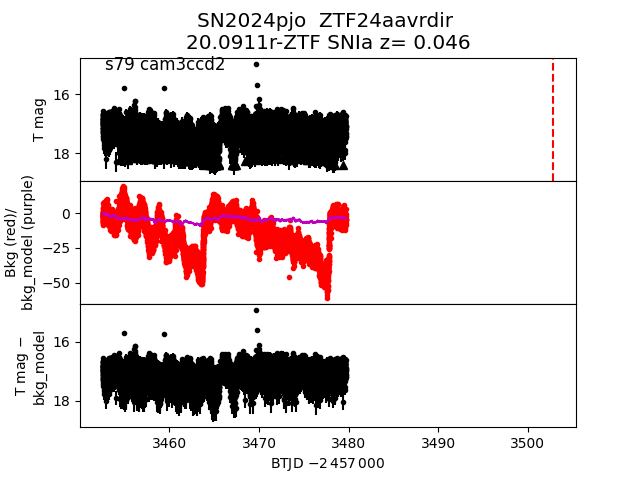
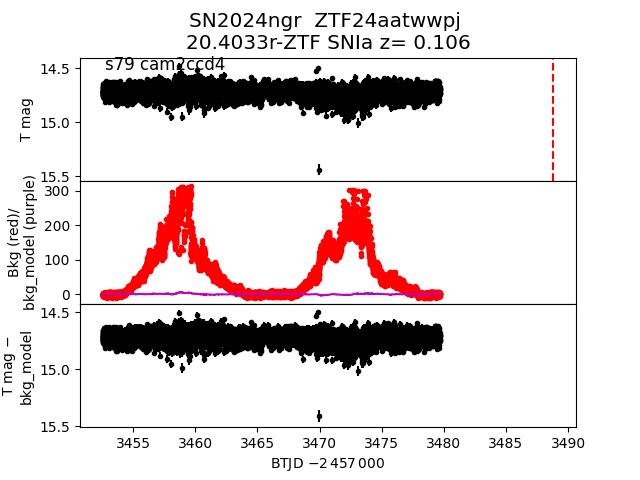
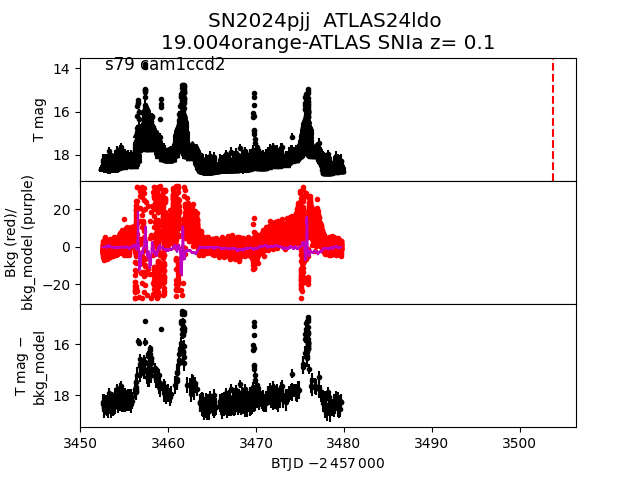
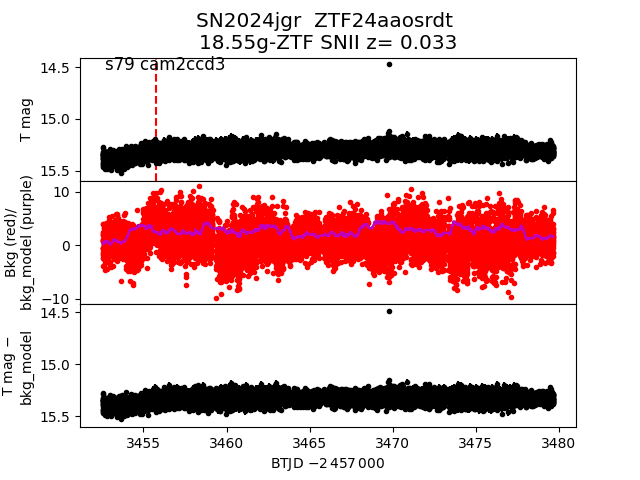
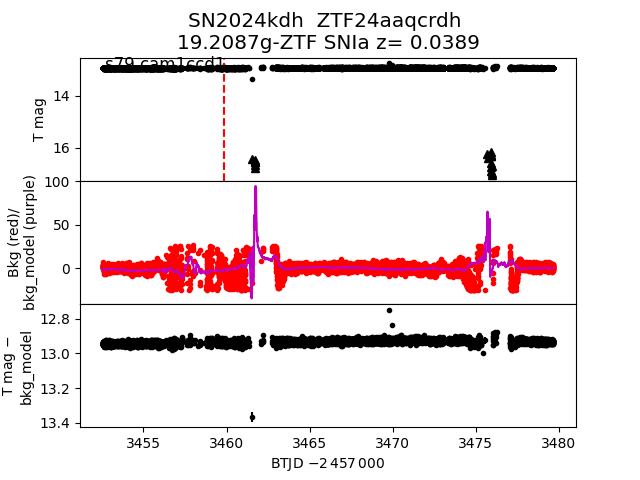
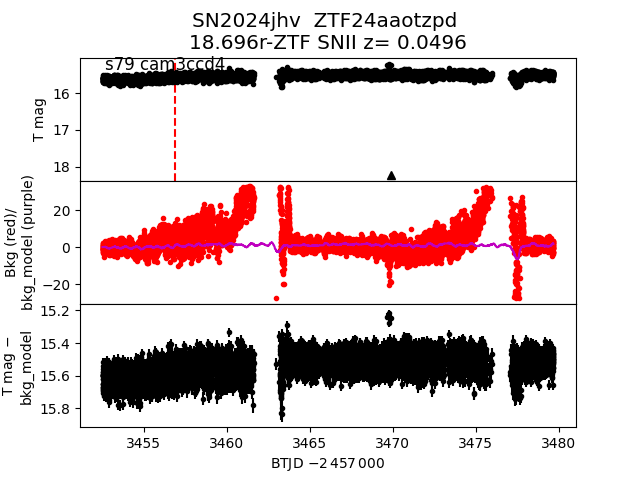
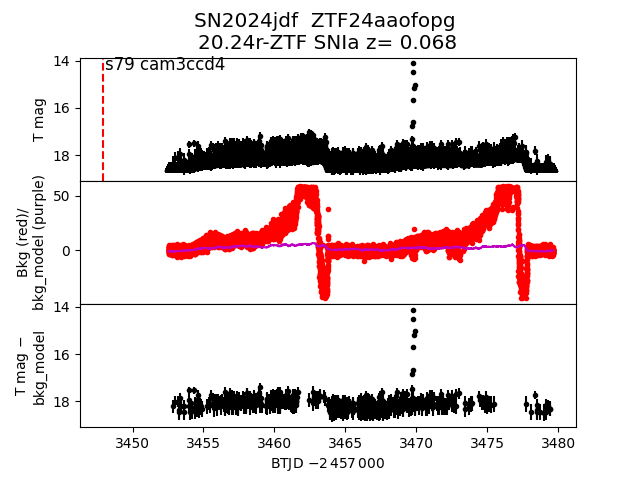
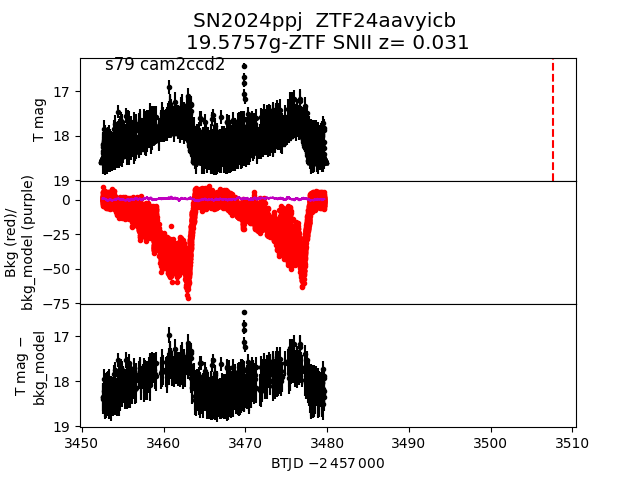
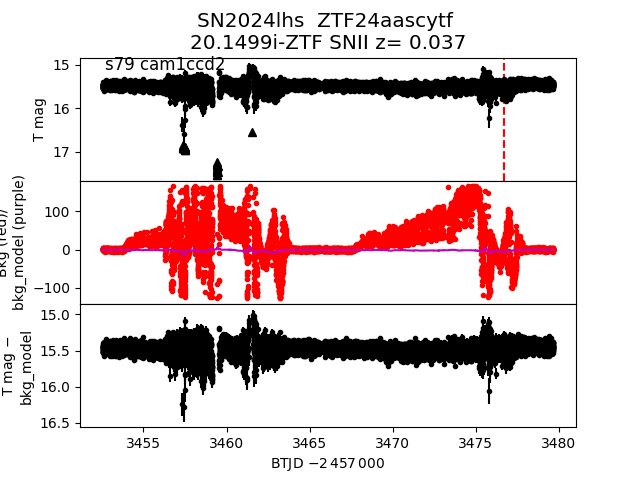
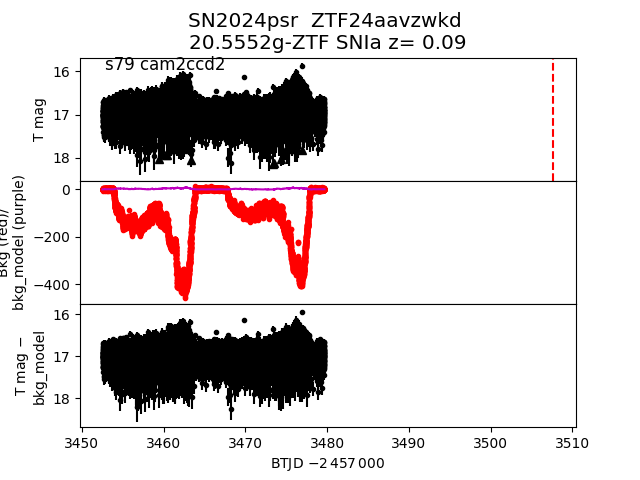
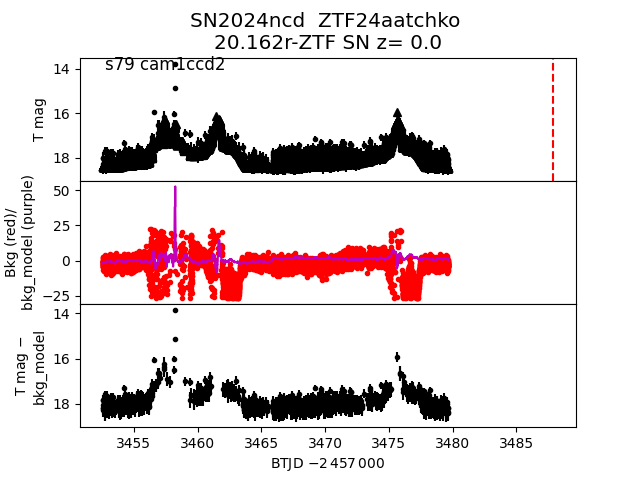
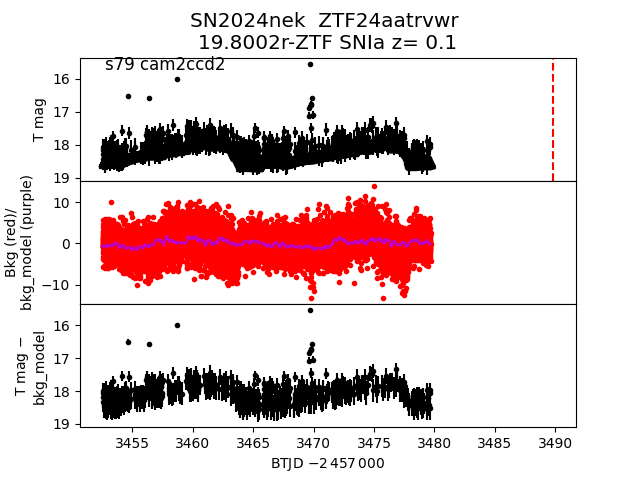
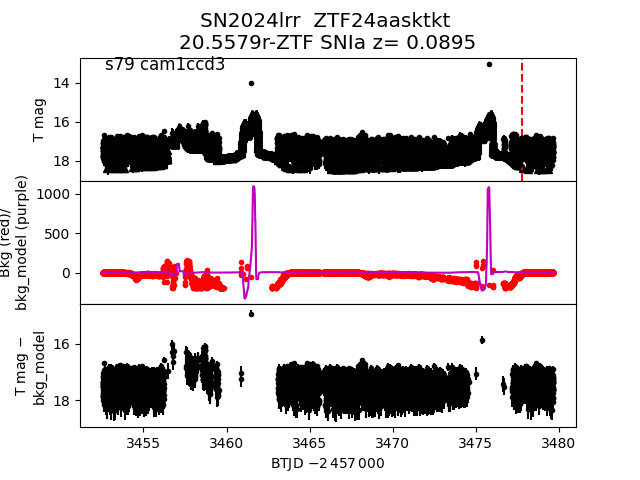
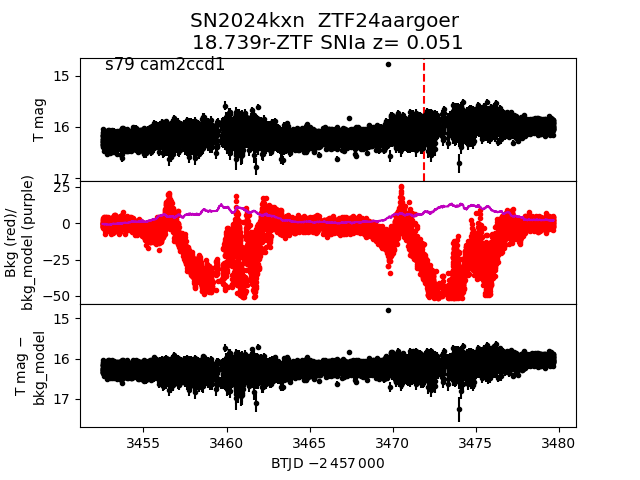
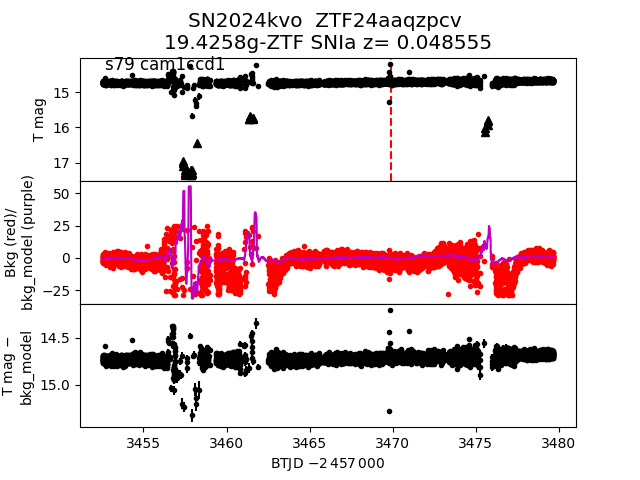
Each figure has three panels. The top panel shows the transient light curve, the middle panel shows the local background (estimated in an annulus), and the bottom panel shows a "background-model corrected" light curve. Details about the background model are in the README.
The vertical red line marks the time of discovery reported to TNS. Other useful metadata from TNS is in the figure title.
Note that the top and bottom panel are in magnitudes, while the middle panel is in differential flux units. The magnitudes are calibrated to the flux in the reference image used for image subtraction. Thus, flux from the host galaxy is included in these magnitudes.
3-sigma upper limits are plotted as triangles with no errorbars. A typical limiting magnitude is 19.6 in 30 minutes or 18.4 in 200 seconds (for low backgrounds).
The links allow you to download the light curve data as a text file.
More details in the README.
2024mwf
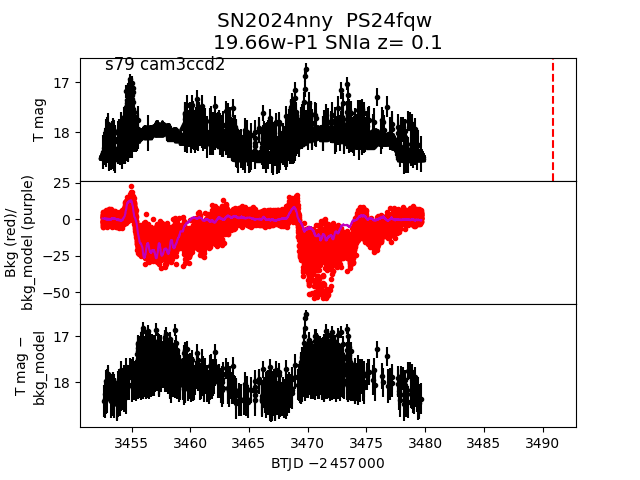
 2024nny
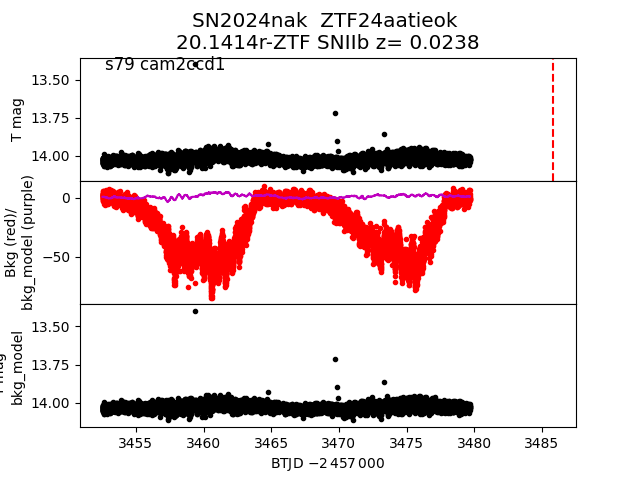
 2024nak
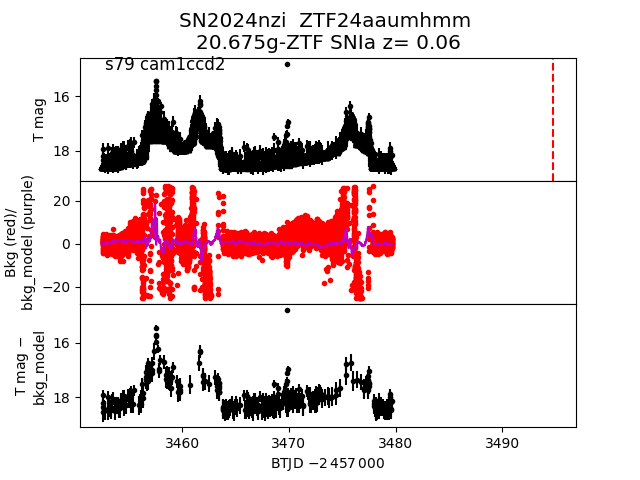
 2024nzi
 2024nqy
 2024kxi
 2024nxg
 2024lhh
 2024mld
 2024jfg
 2024pvx
 2024lor
 2024jld
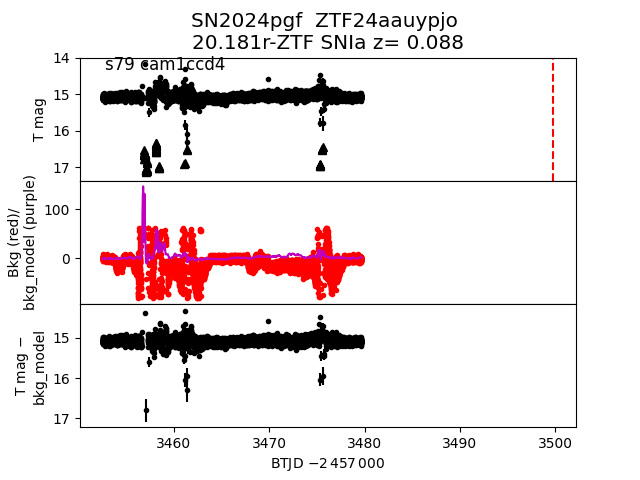
 2024pgf
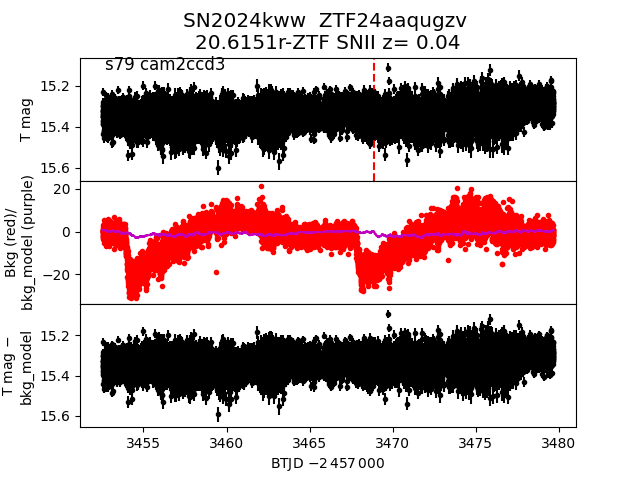
 2024kww
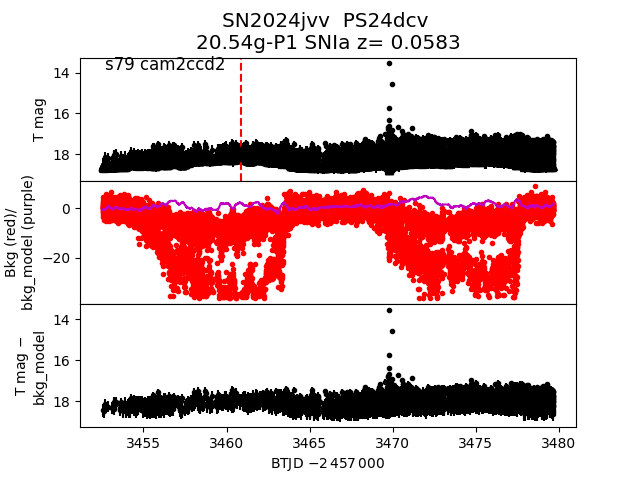
 2024jvv
 2024lss
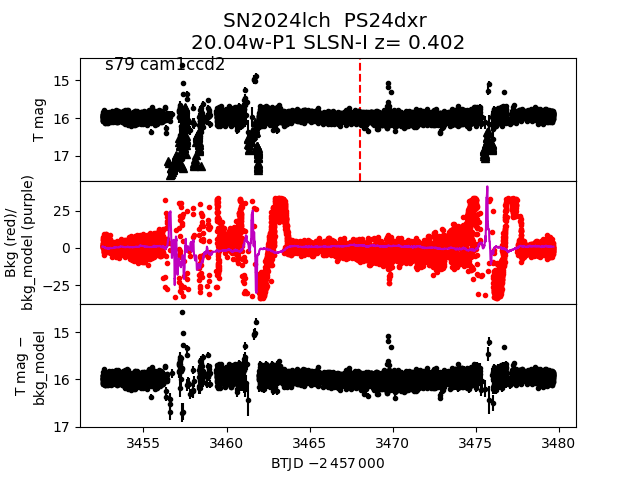
 2024lch
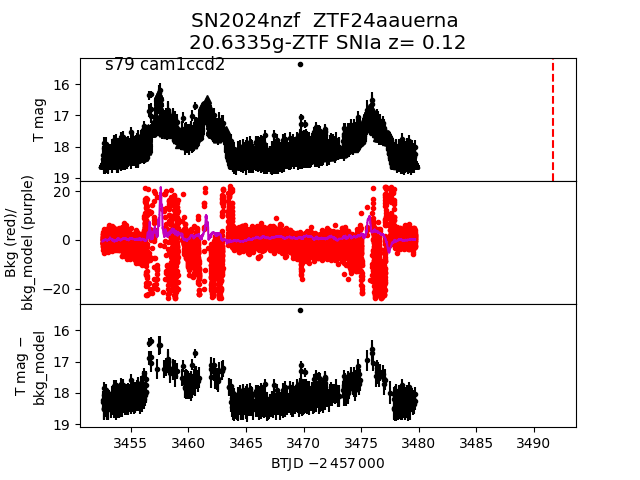
 2024nzf
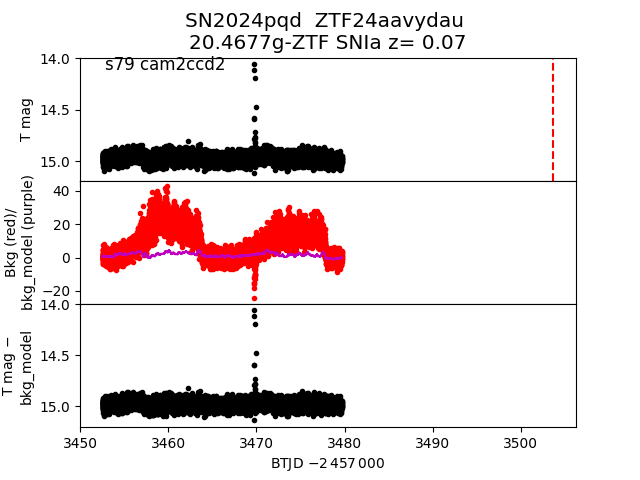
 2024pqd
 2024mbc
 2024pcq
 2024pjo
 2024ngr
 2024pjj
 2024jgr
 2024kdh
 2024jhv
 2024jdf
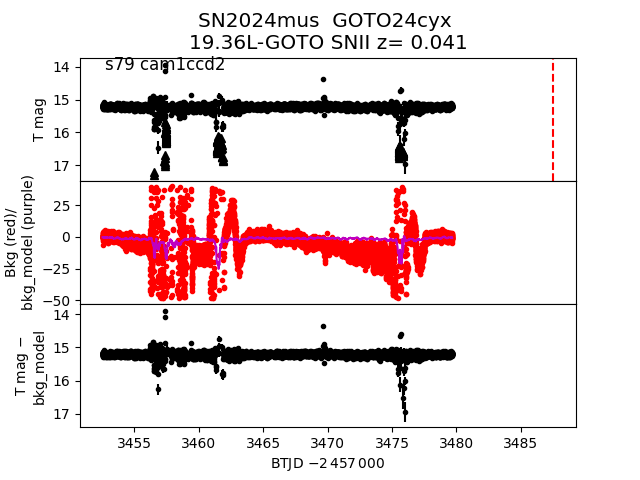
 2024mus
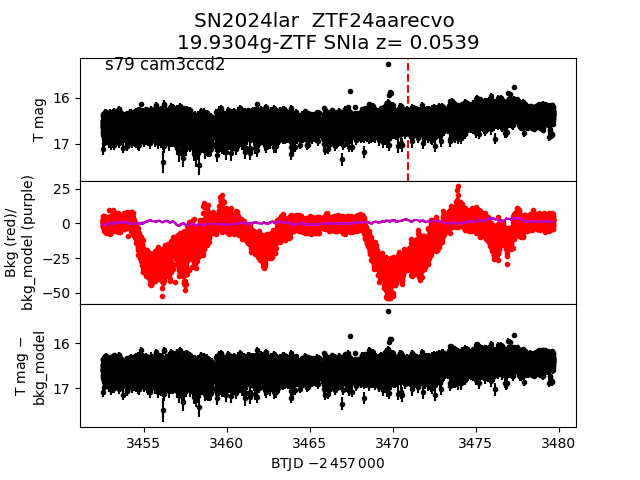
 2024lar
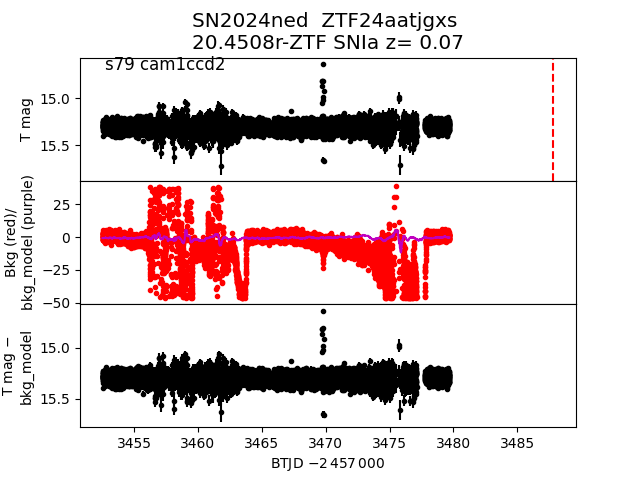
 2024ned
 2024ppj
 2024lhs
 2024psr
 2024ncd
 2024nek
 2024lrr
 2024kxn
 2024kvo
 2024nuu
