all transients in sector78 (108 total)
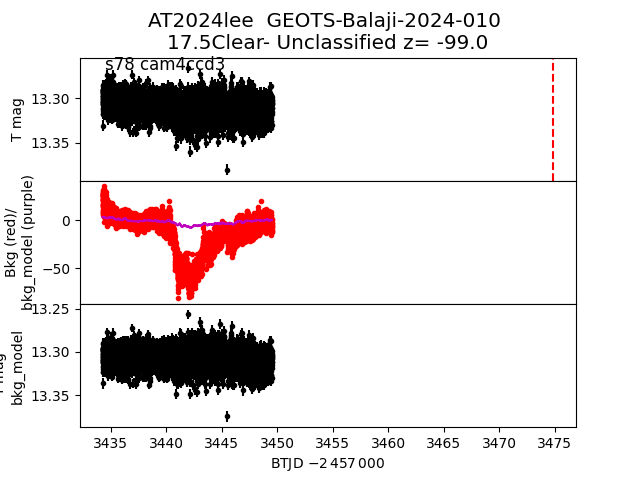
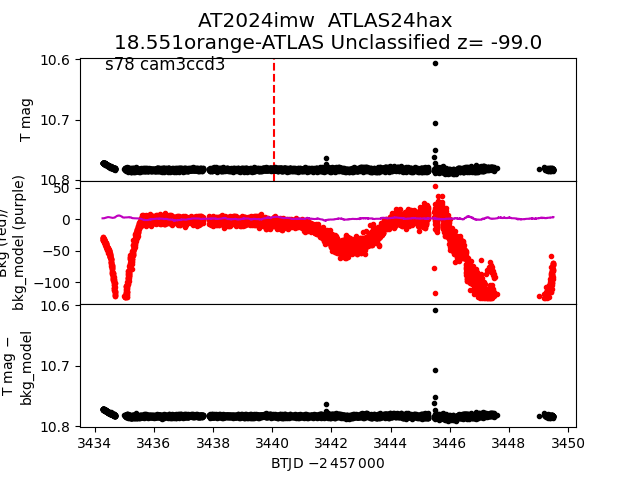
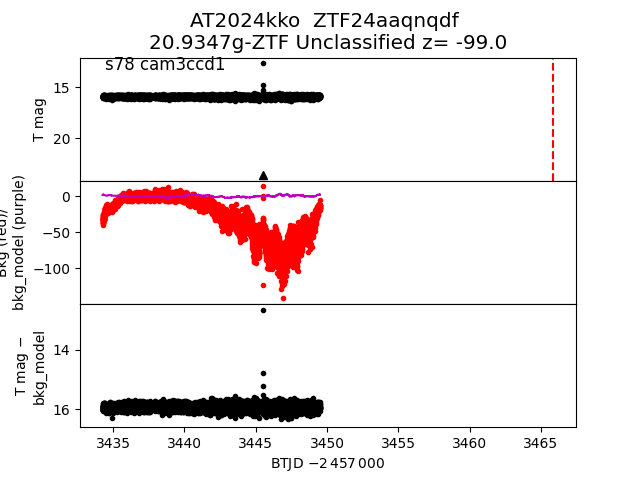
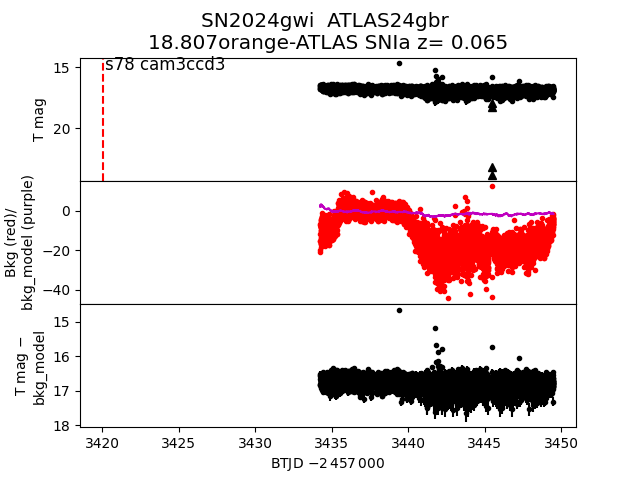
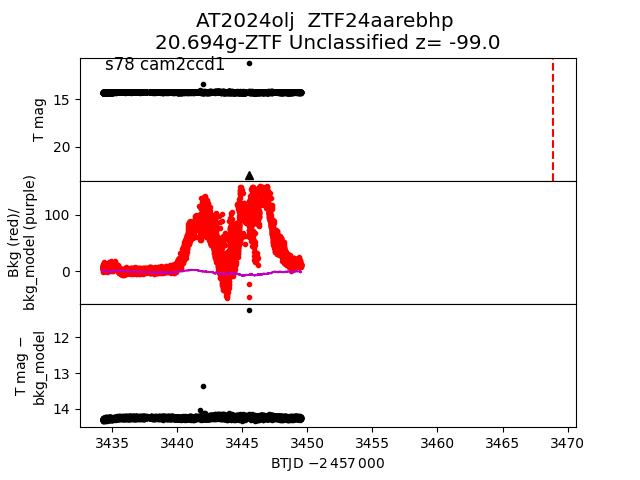
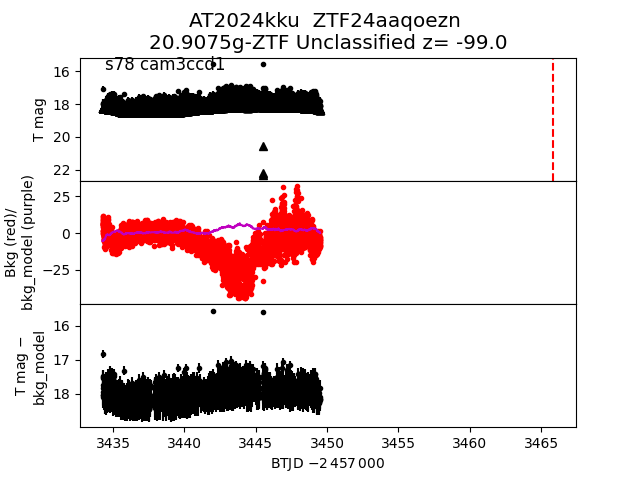
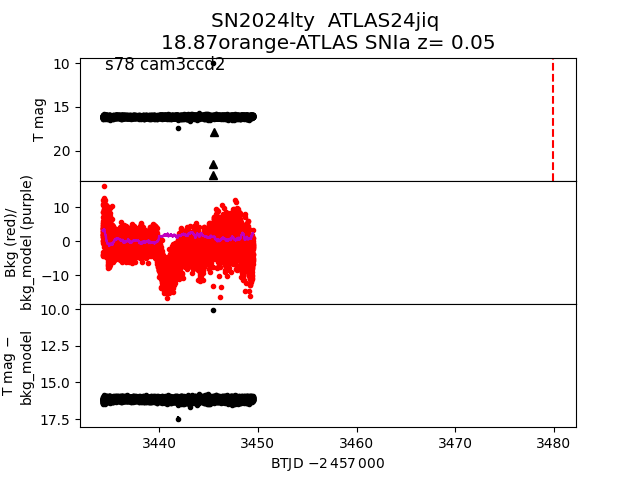
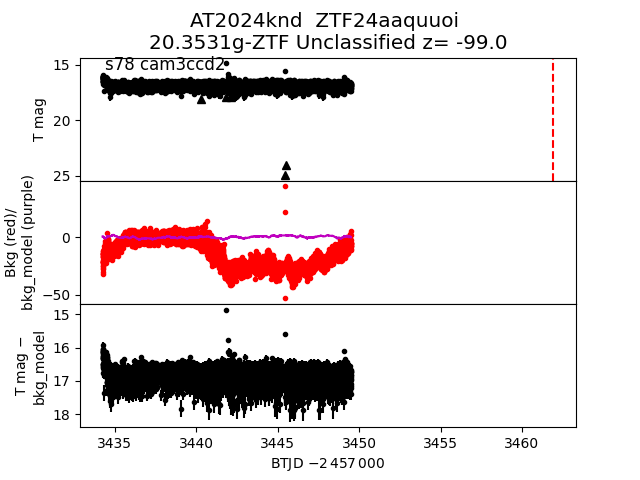
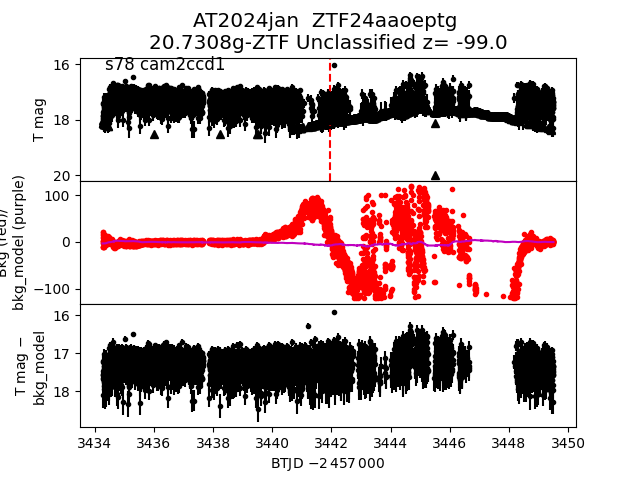
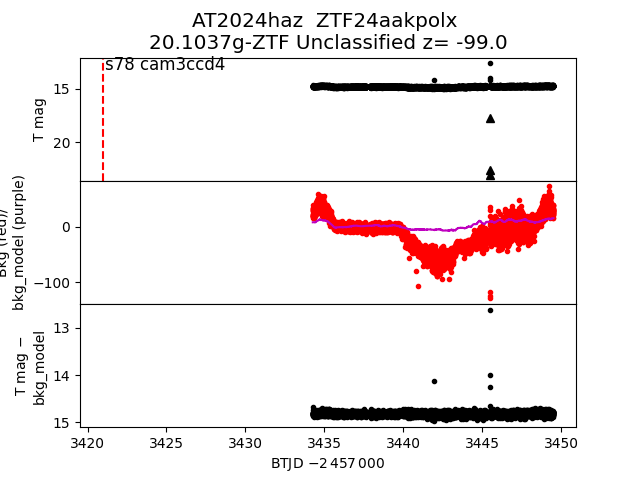
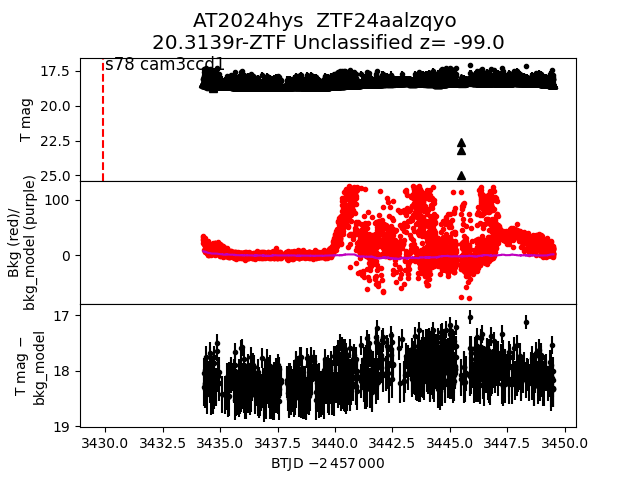
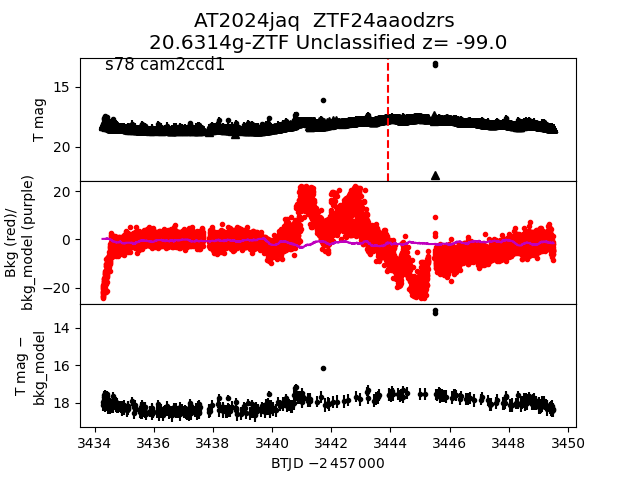
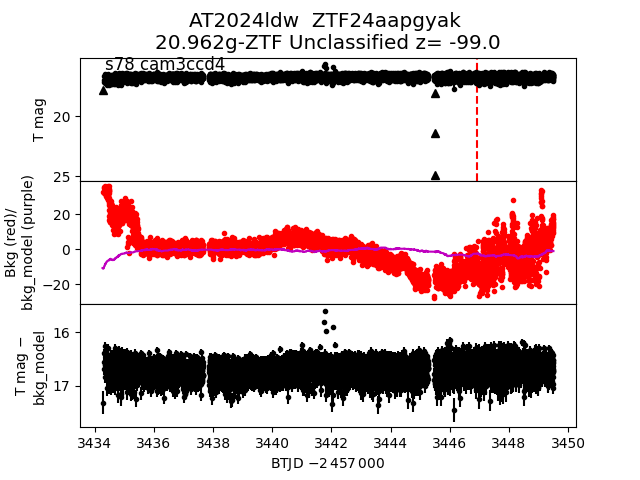
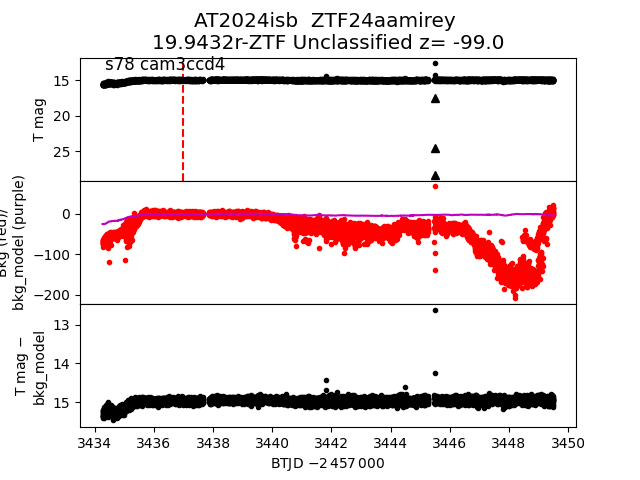
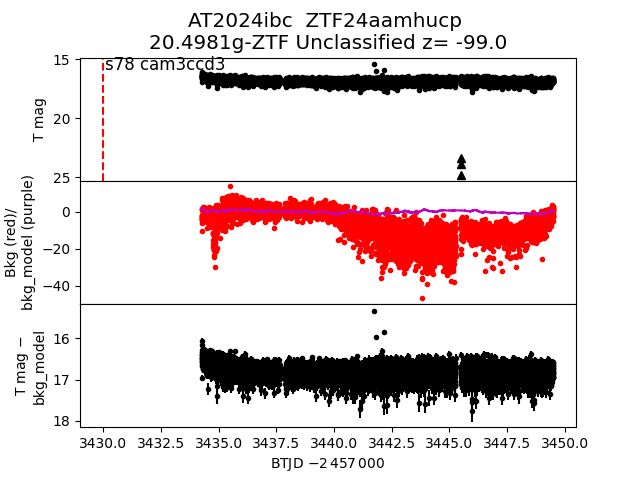
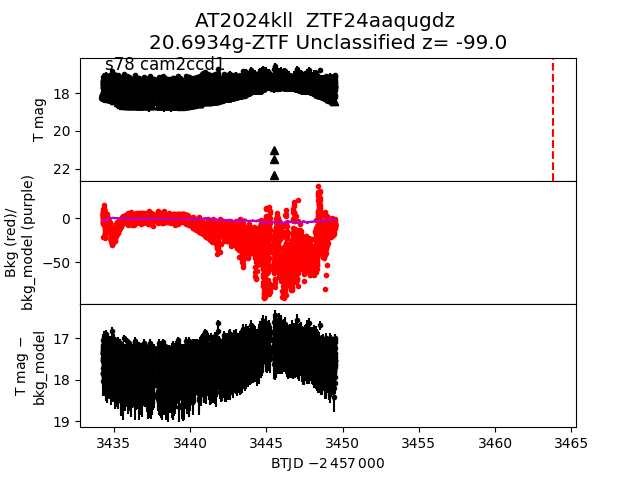
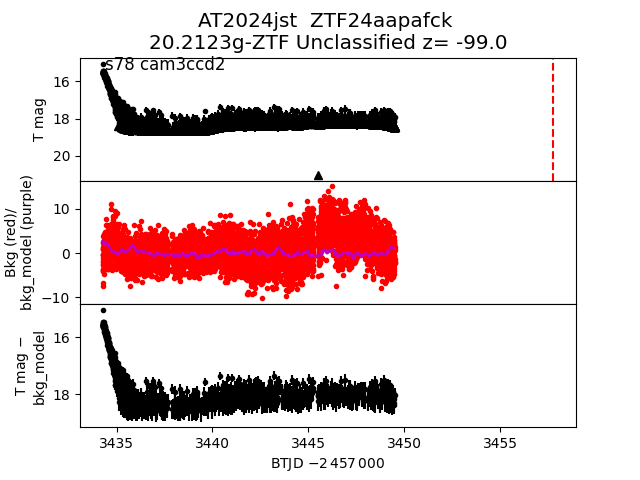
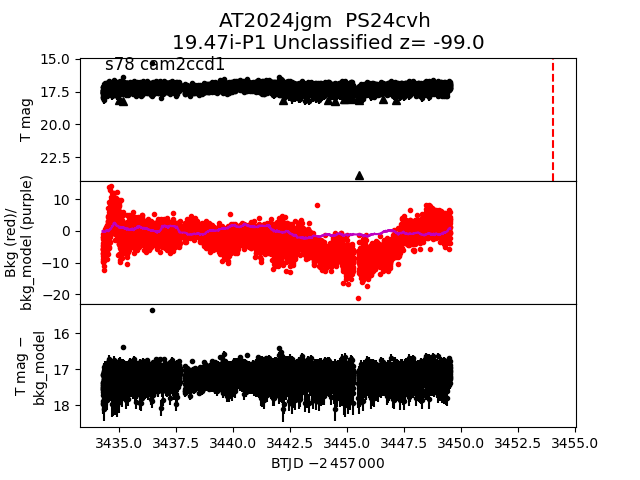
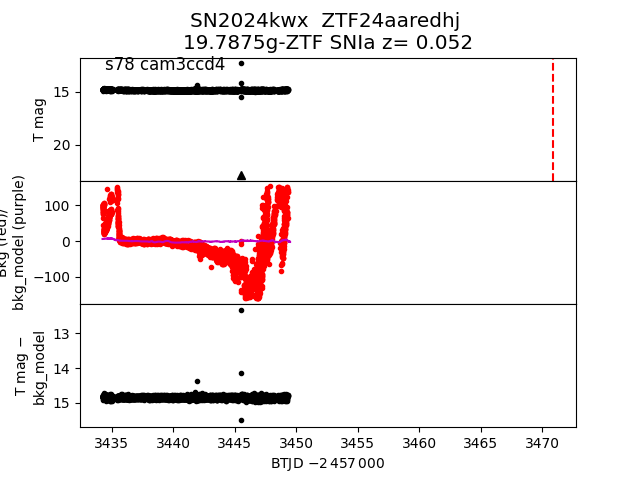
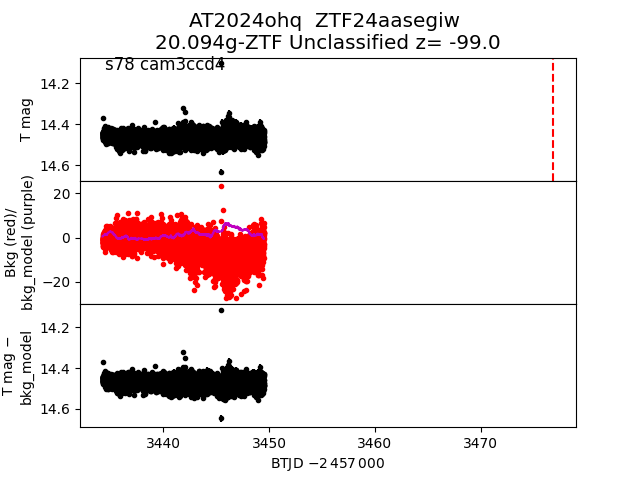
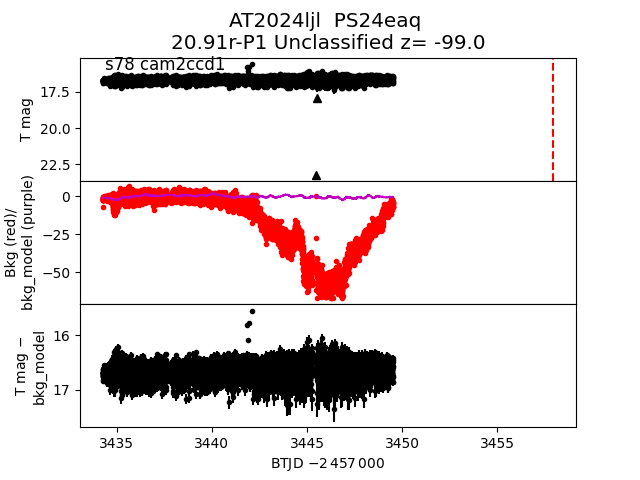
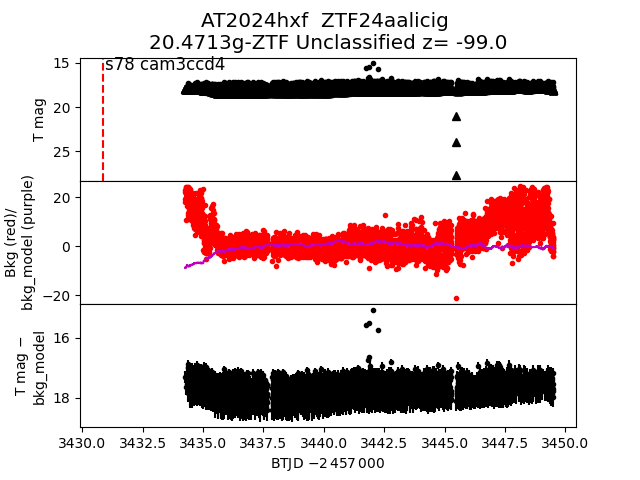
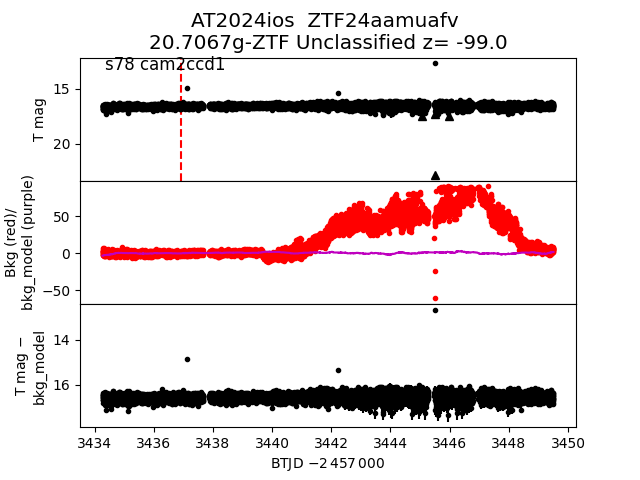
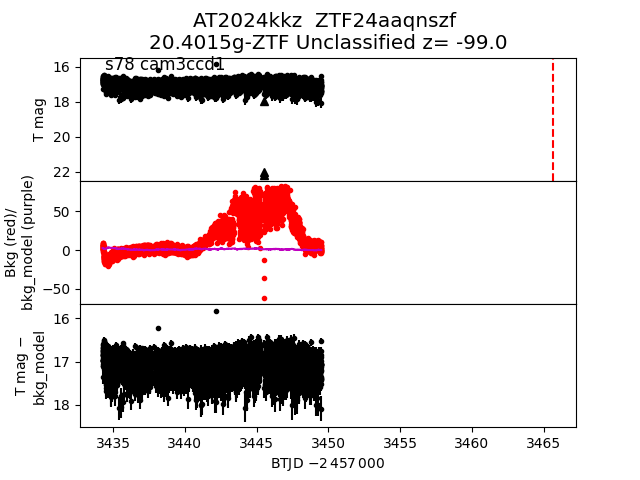
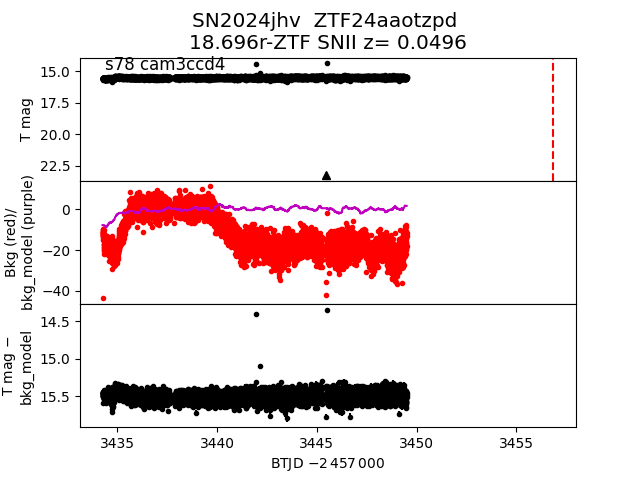
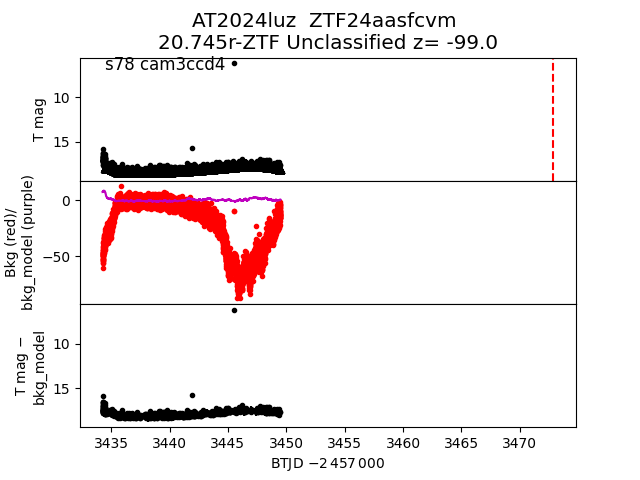
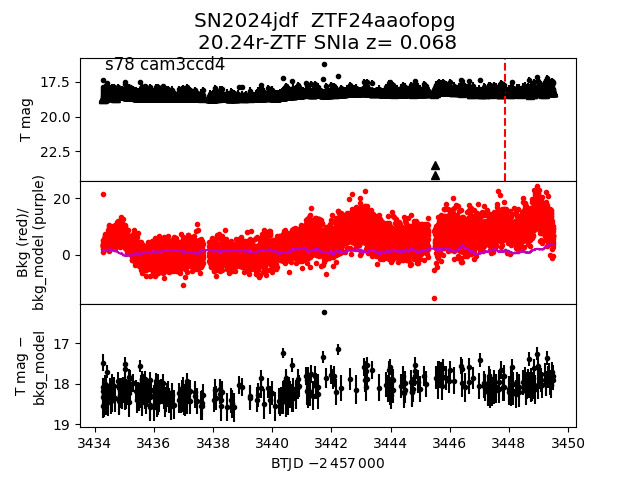
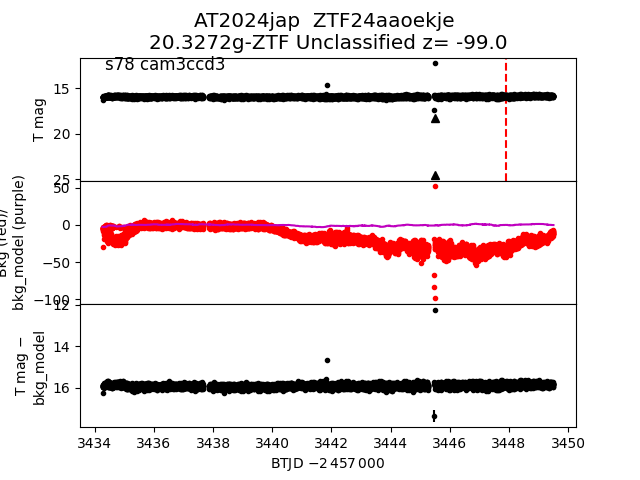
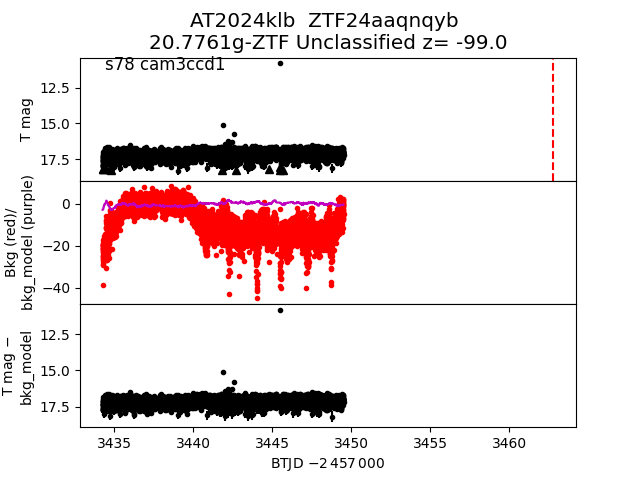
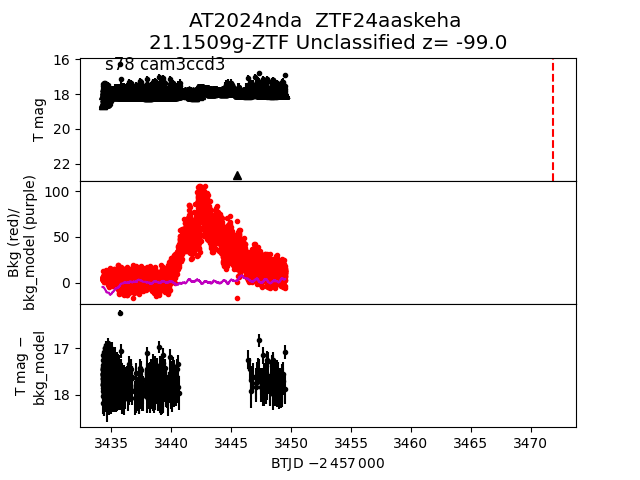
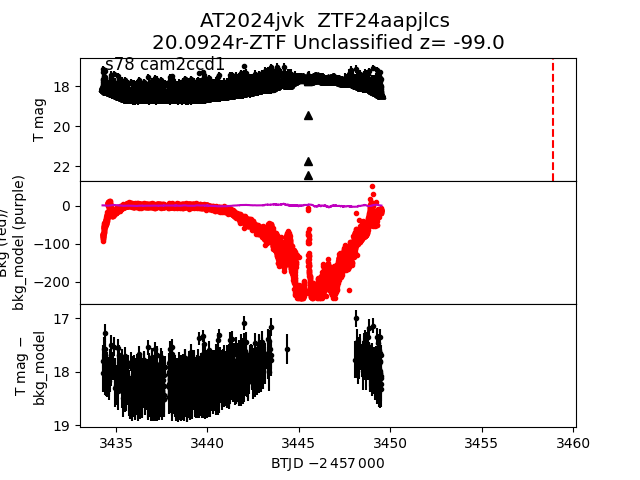
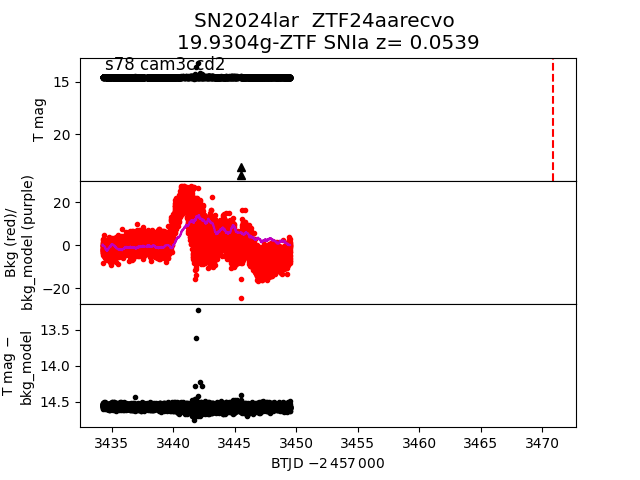
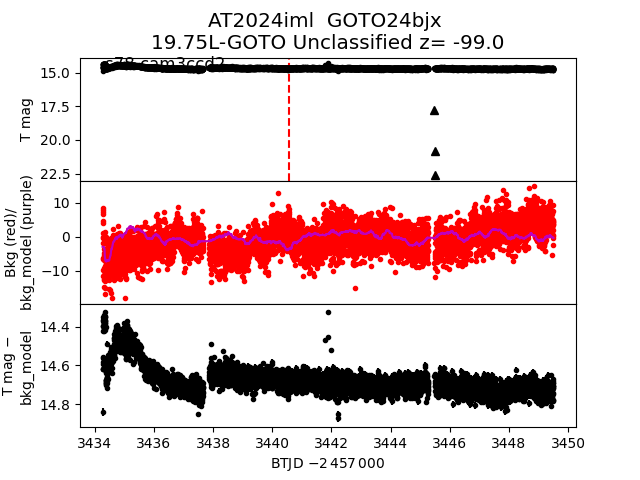
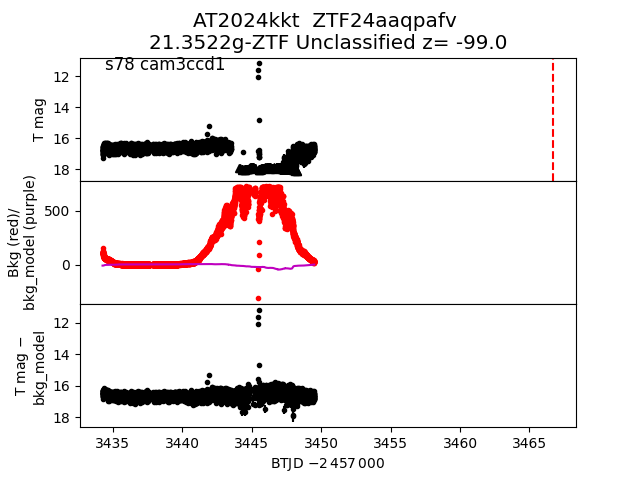
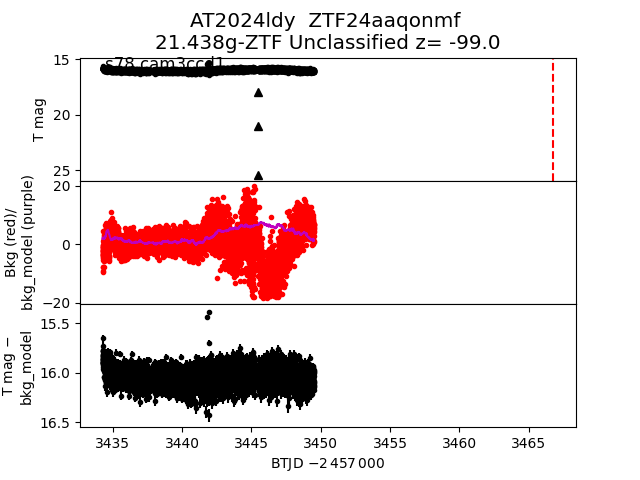
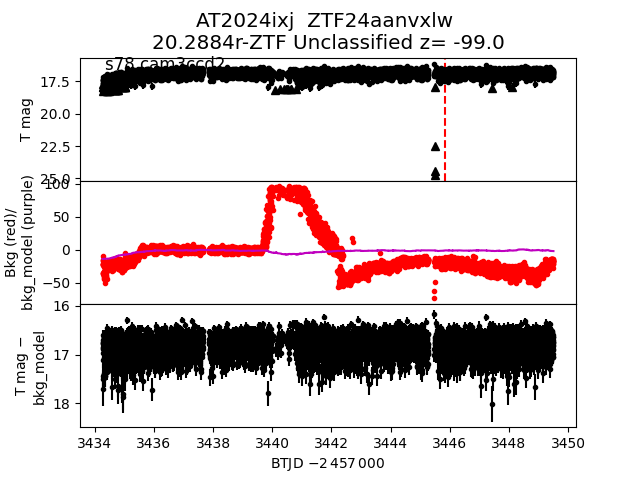
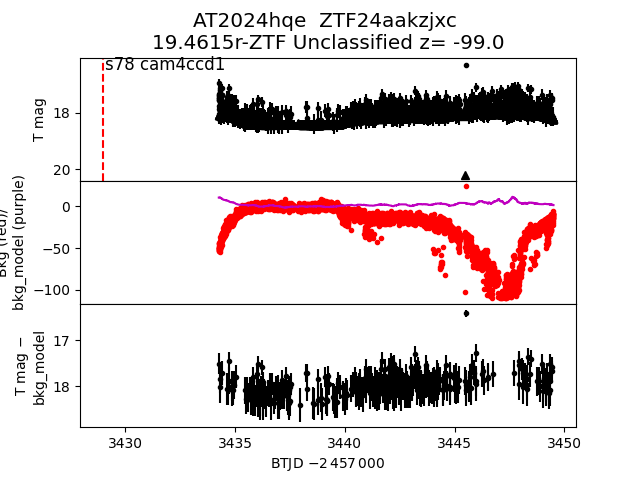
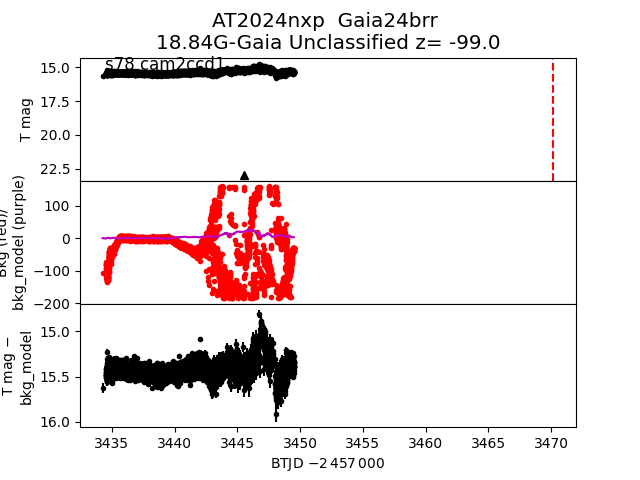
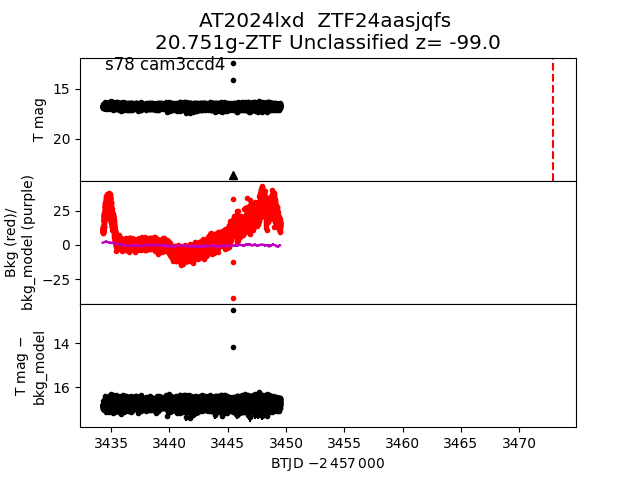
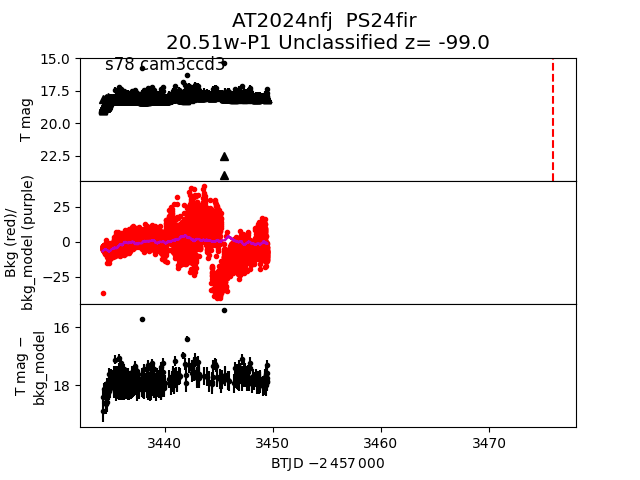
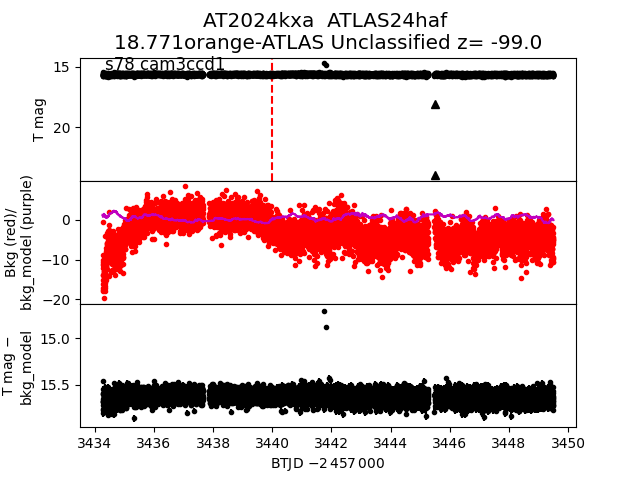
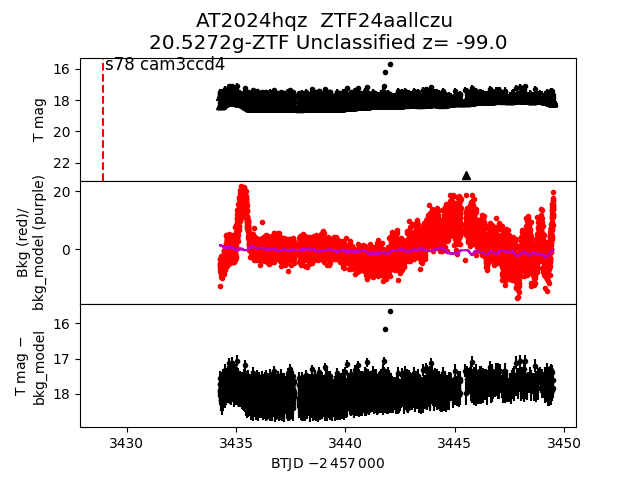
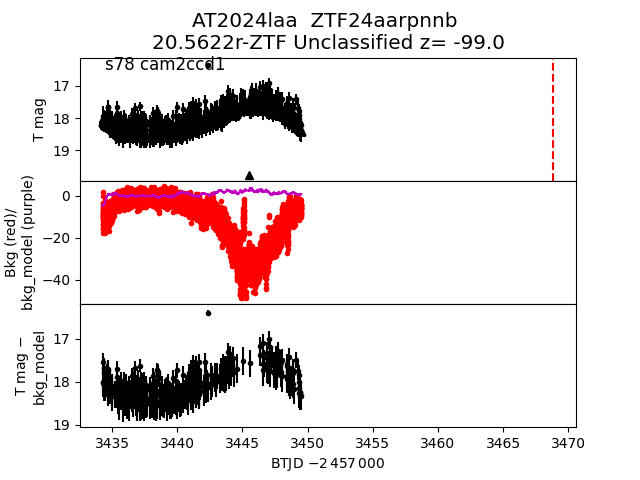
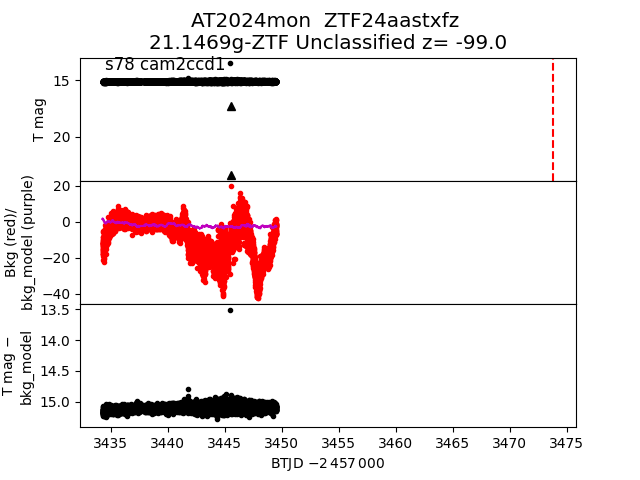
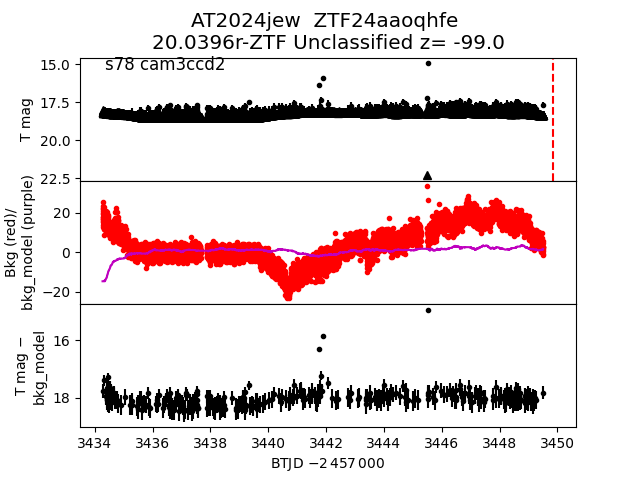
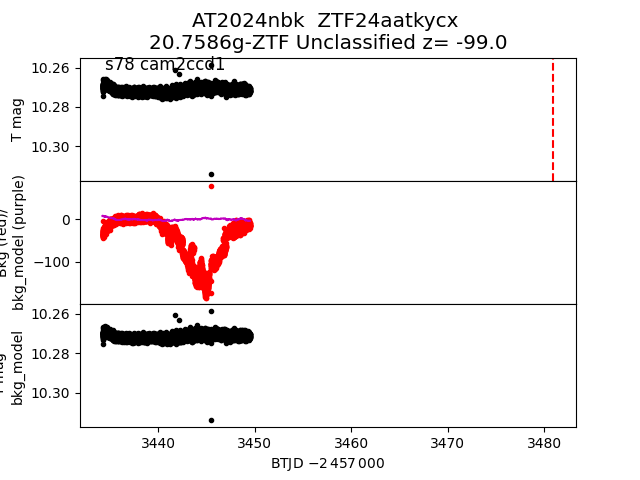
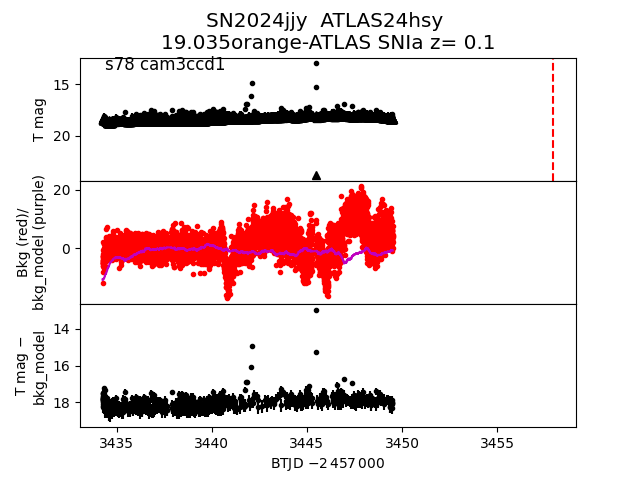
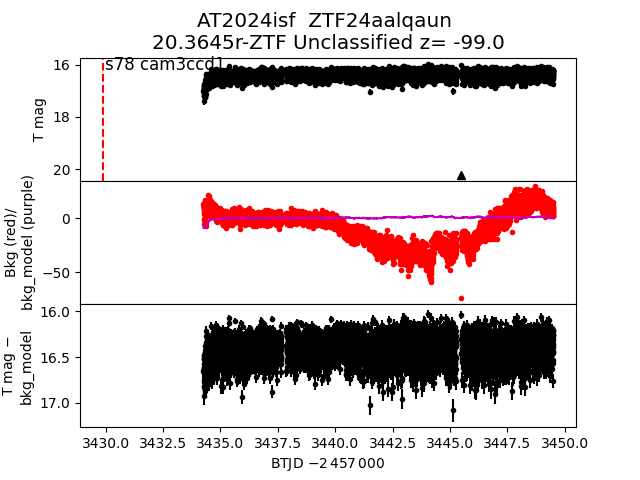
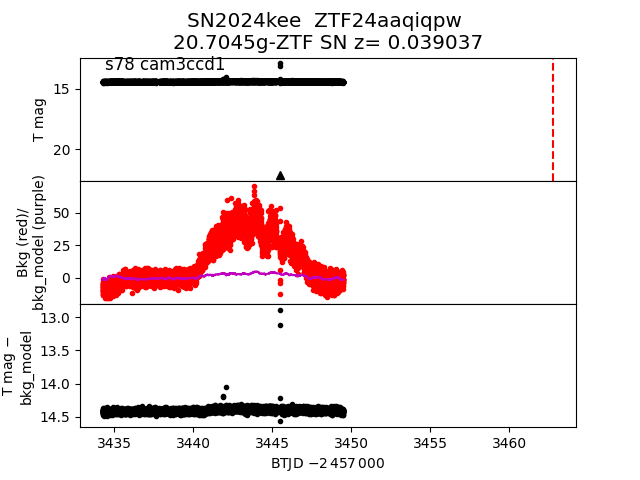
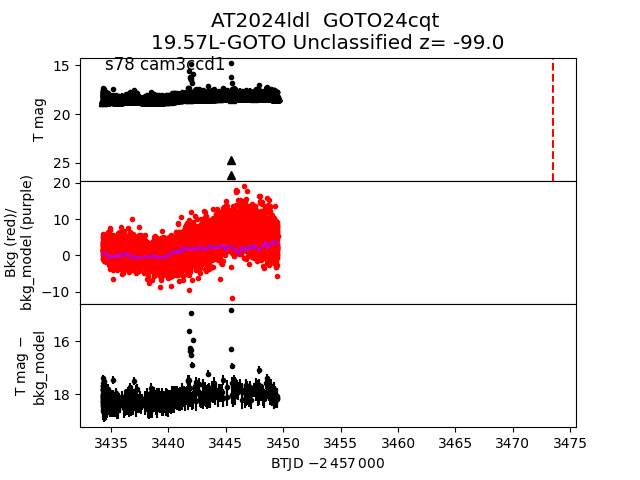
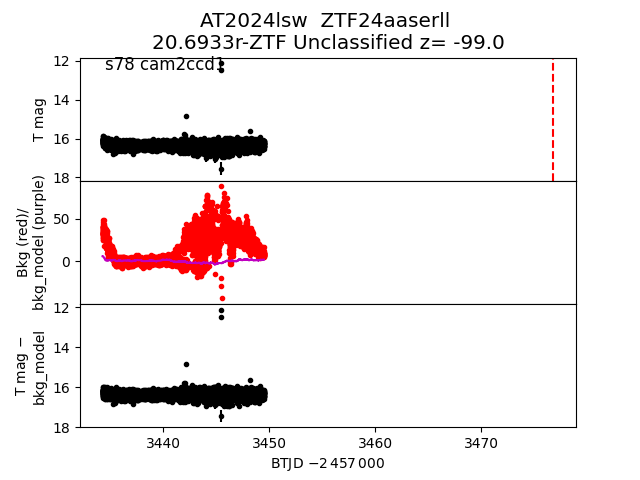
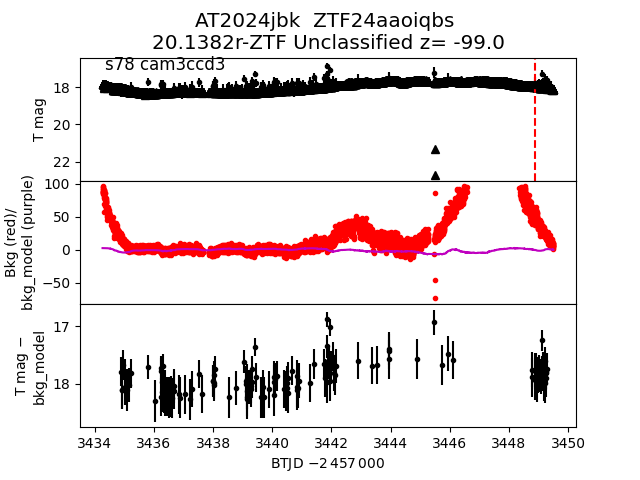
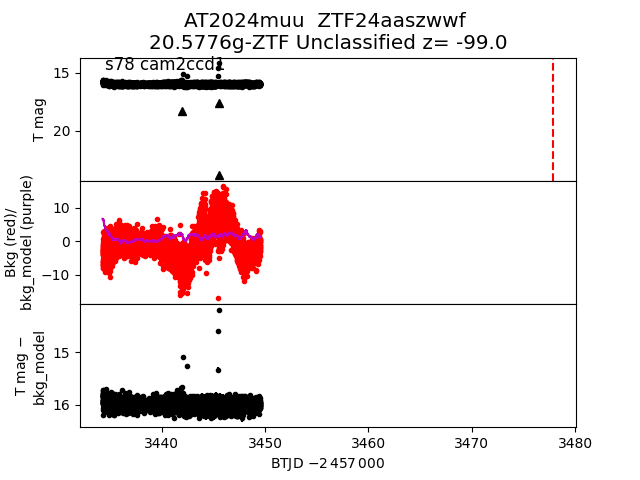
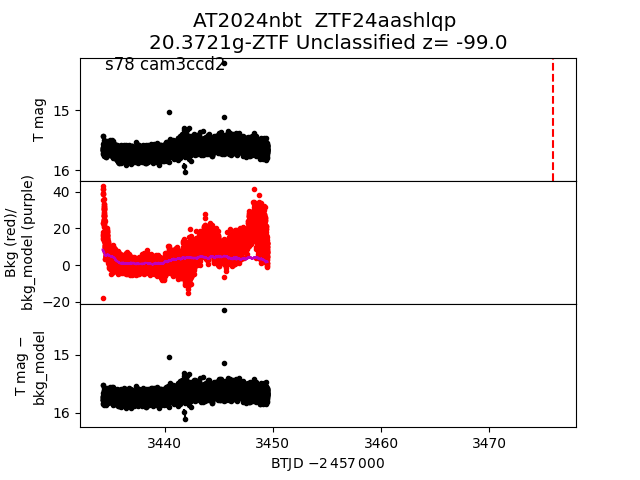
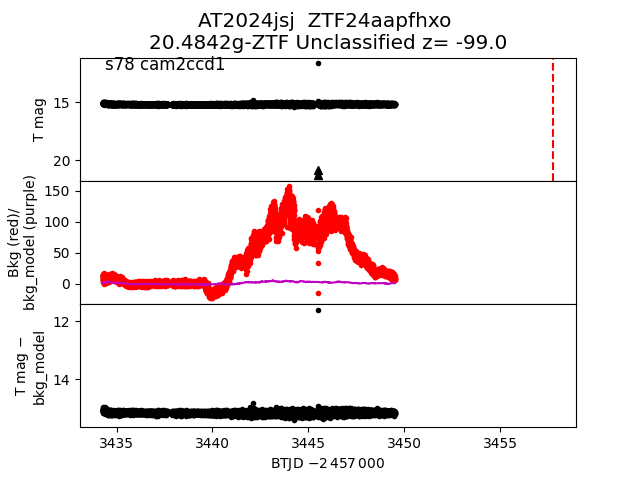
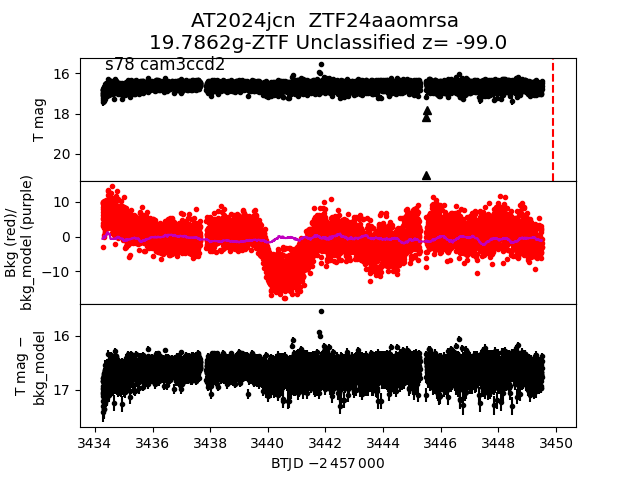
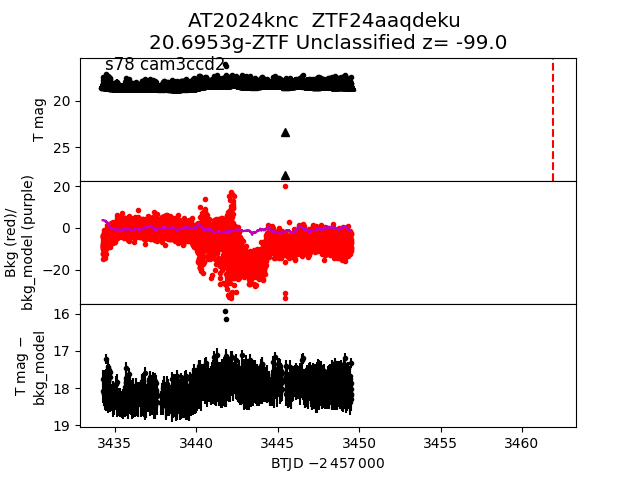
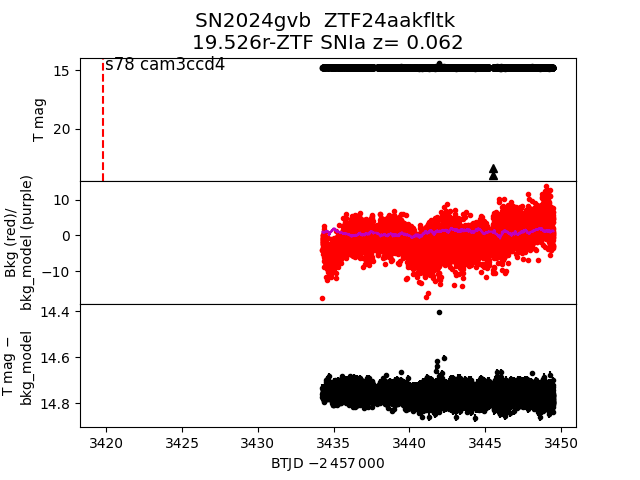
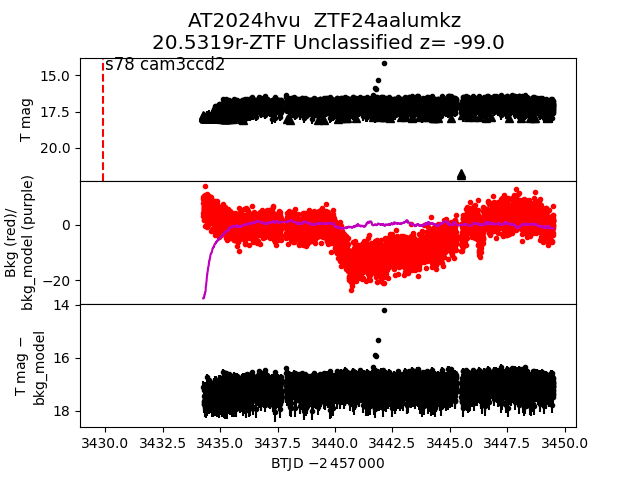
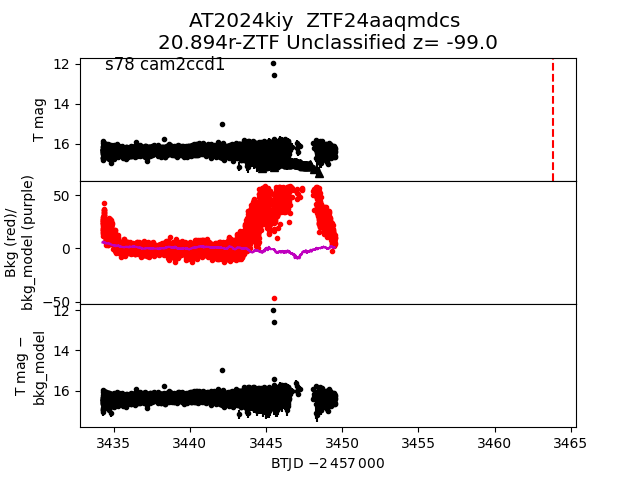
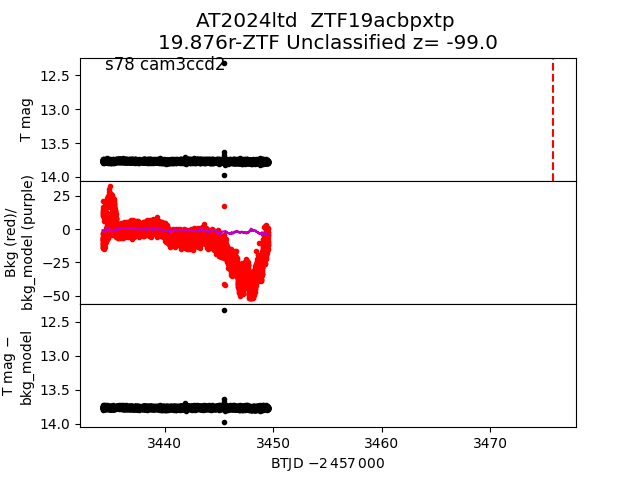
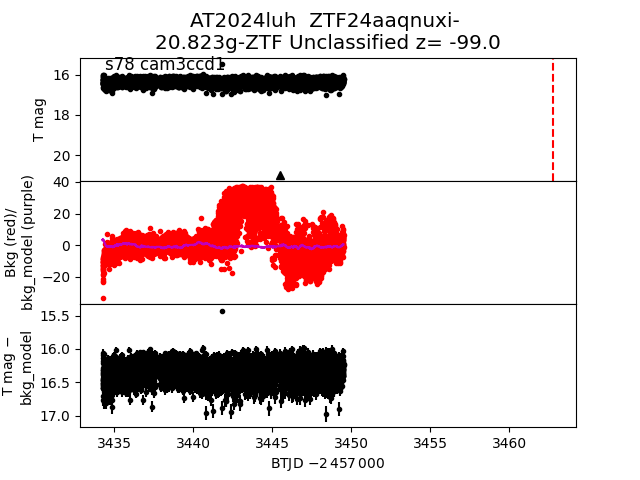
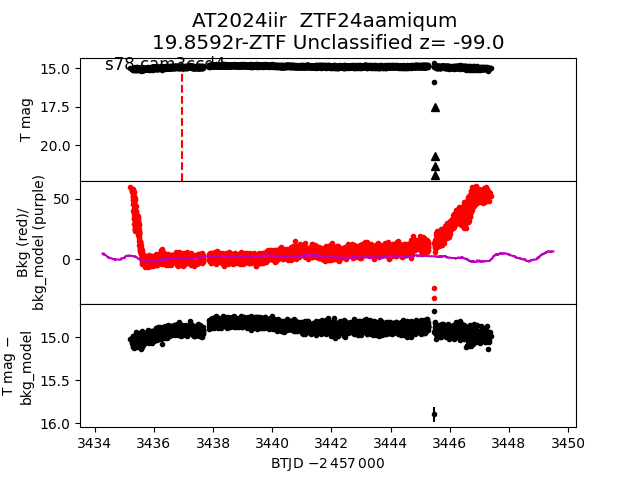
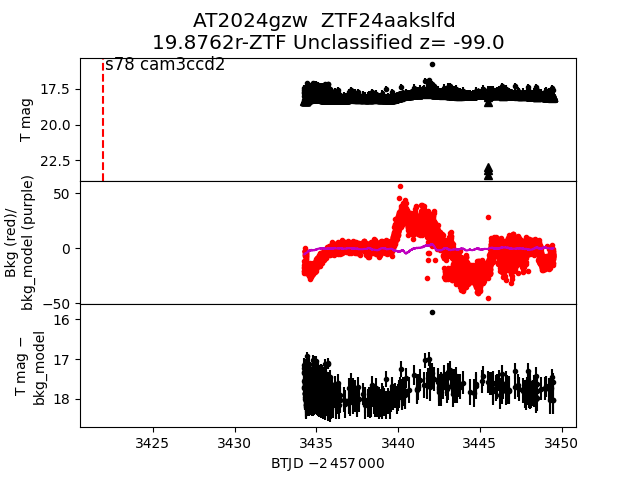
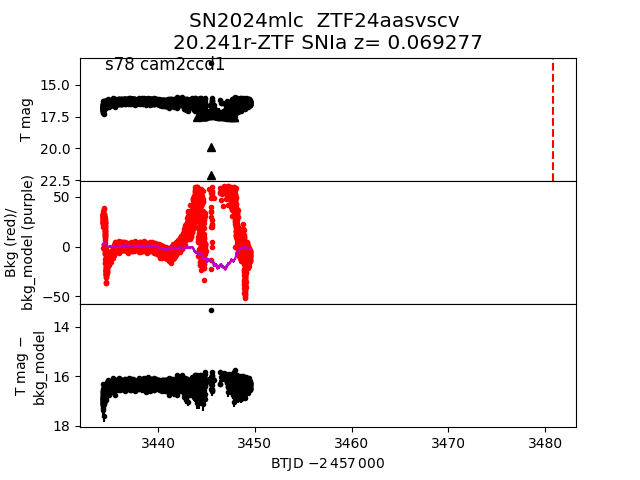
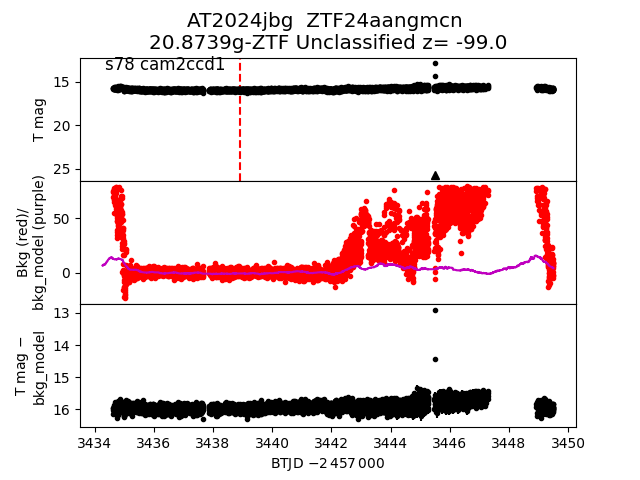
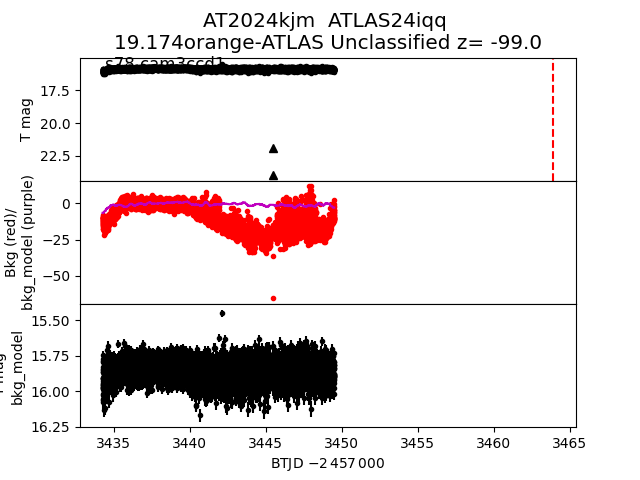
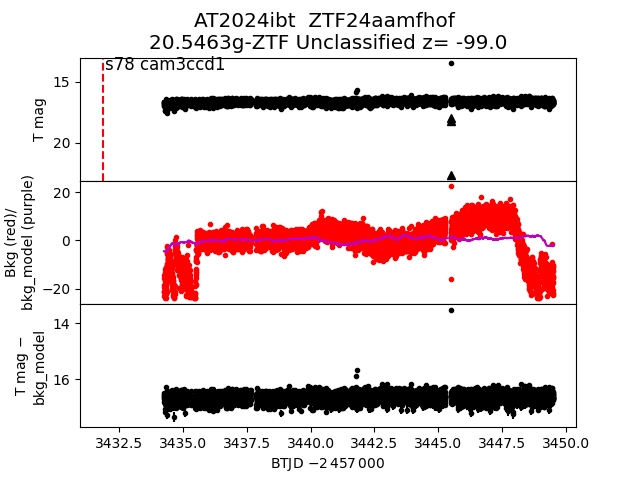
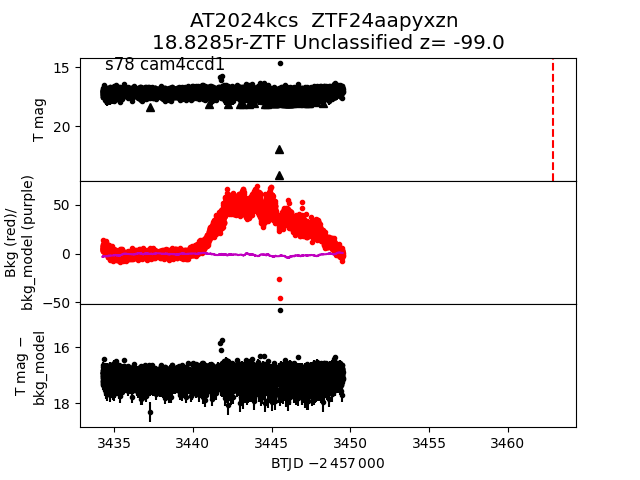
Each figure has three panels. The top panel shows the transient light curve, the middle panel shows the local background (estimated in an annulus), and the bottom panel shows a "background-model corrected" light curve. Details about the background model are in the README.
The vertical red line marks the time of discovery reported to TNS. Other useful metadata from TNS is in the figure title.
Note that the top and bottom panel are in magnitudes, while the middle panel is in differential flux units. The magnitudes are calibrated to the flux in the reference image used for image subtraction. Thus, flux from the host galaxy is included in these magnitudes.
3-sigma upper limits are plotted as triangles with no errorbars. A typical limiting magnitude is 19.6 in 30 minutes or 18.4 in 200 seconds (for low backgrounds).
The links allow you to download the light curve data as a text file.
More details in the README.
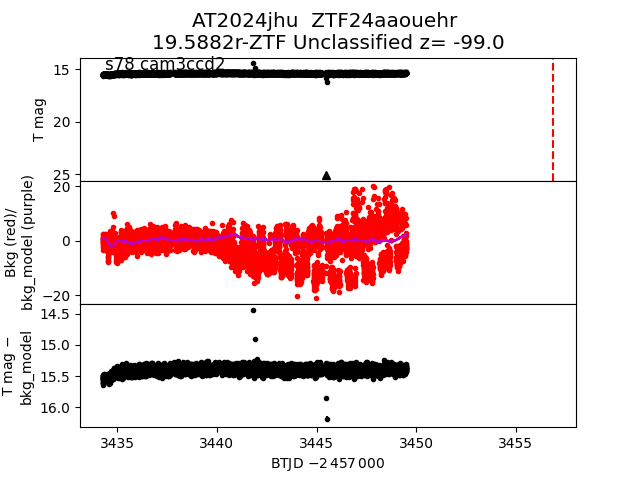
2024jhu
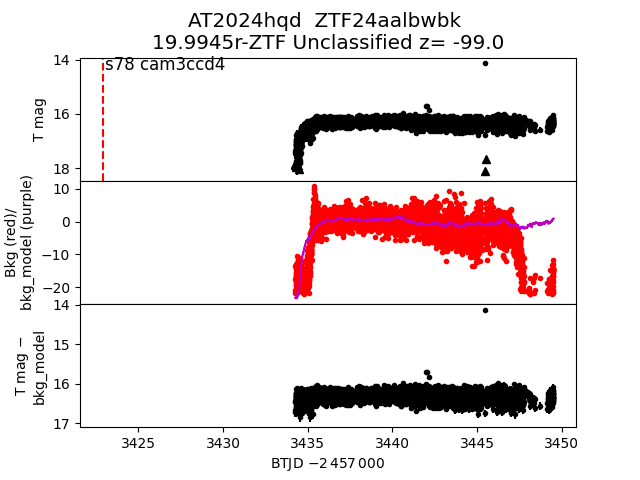
 2024hqd
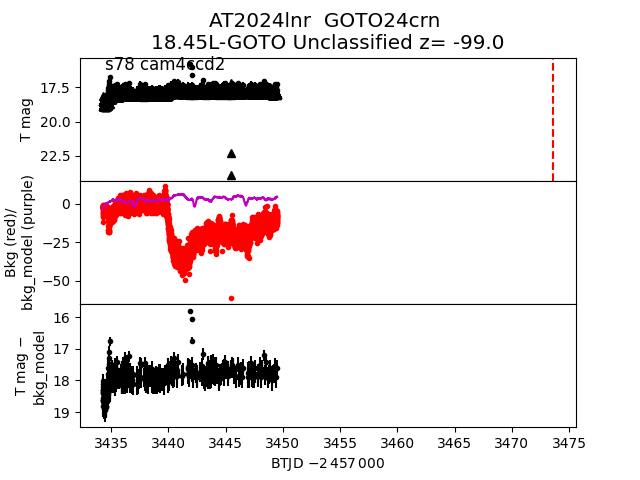
 2024lnr
 2024imw
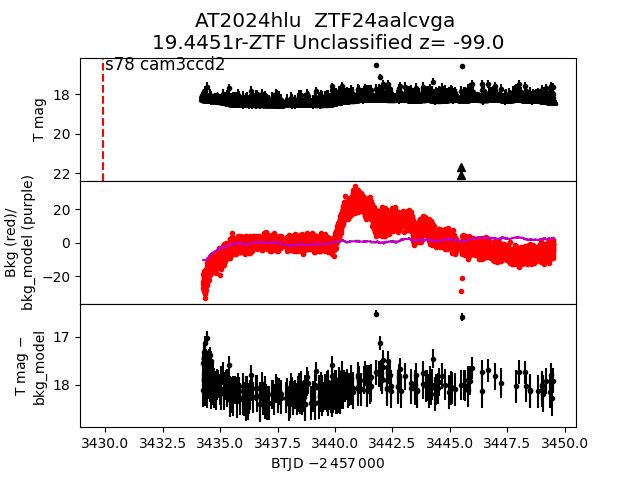
 2024hlu
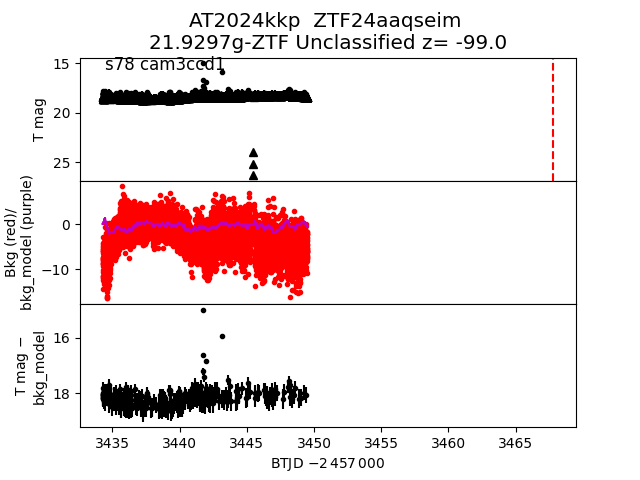
 2024kkp
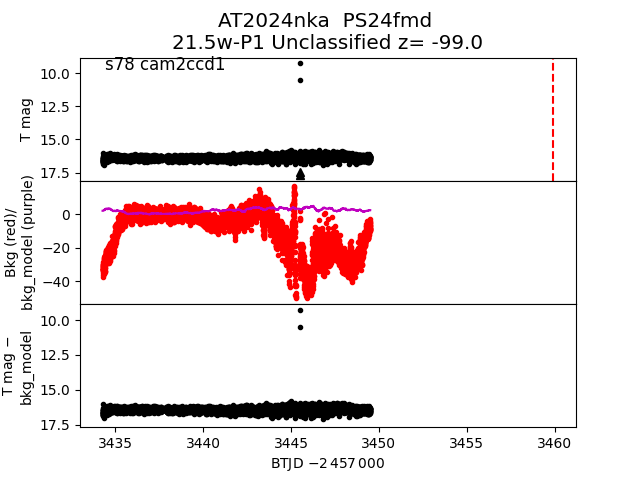
 2024nka
 2024kko
 2024gwi
 2024olj
 2024kku
 2024lty
 2024knd
 2024jan
 2024haz
 2024hys
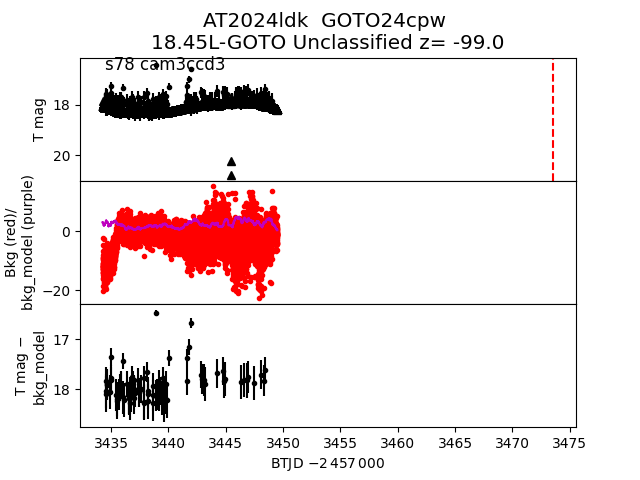
 2024ldk
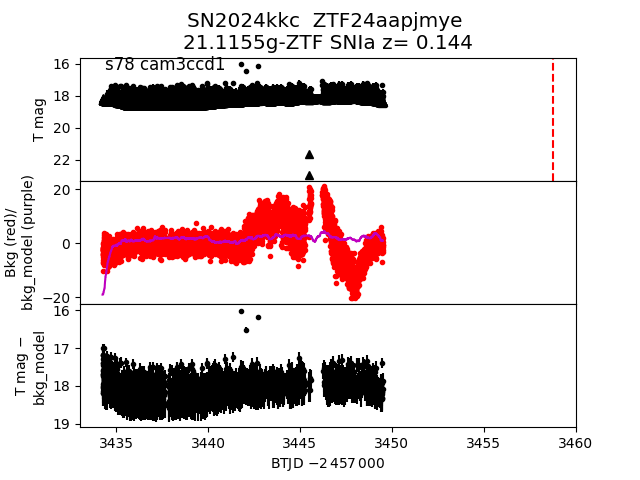
 2024kkc
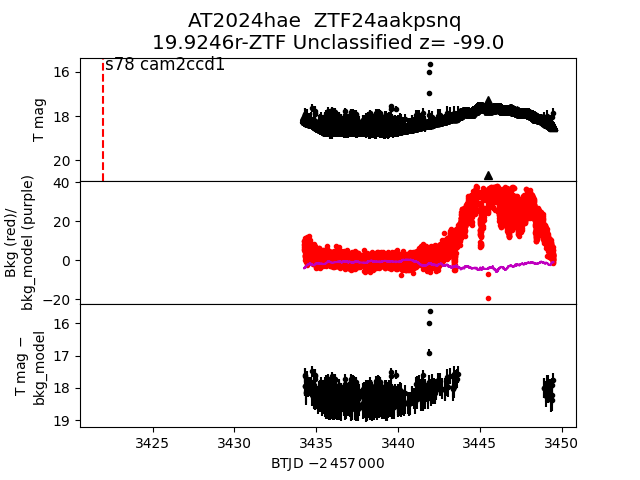
 2024hae
 2024jaq
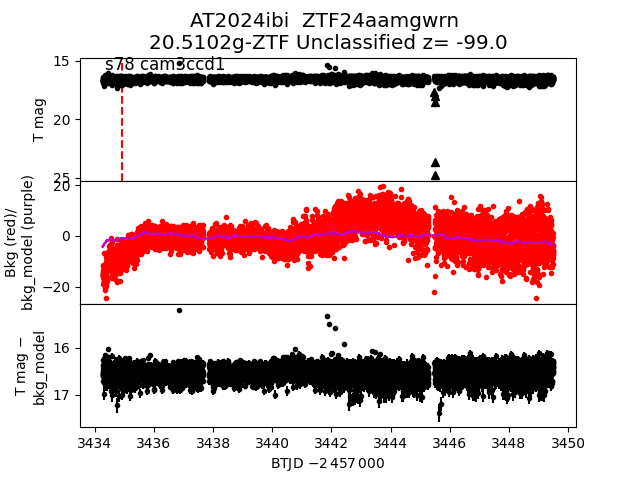
 2024ibi
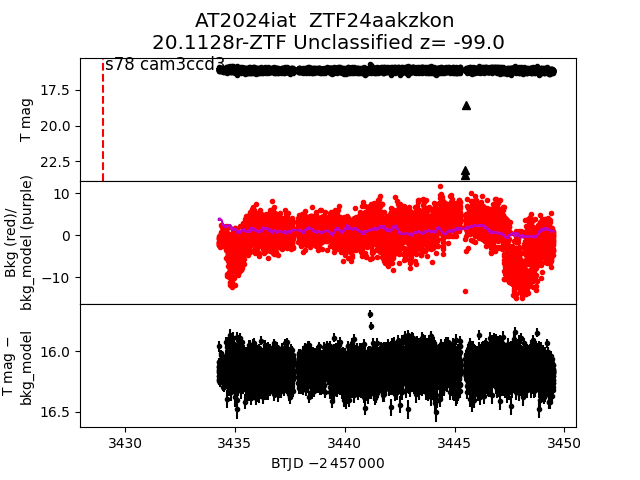
 2024iat
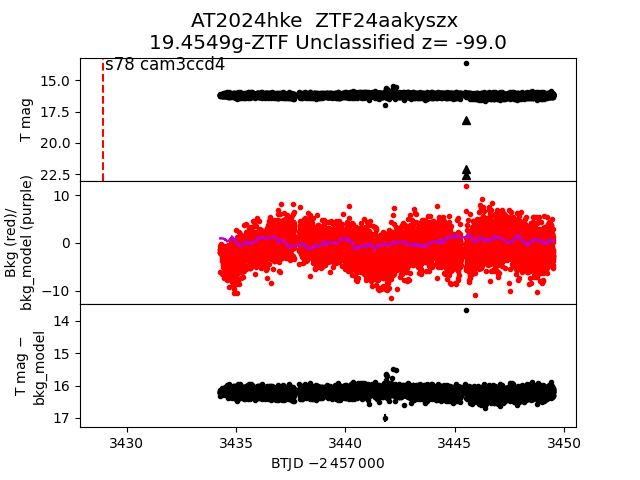
 2024hke
 2024ldw
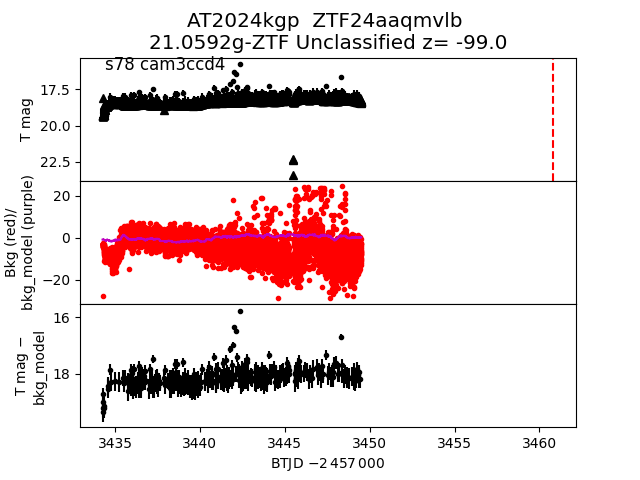
 2024kgp
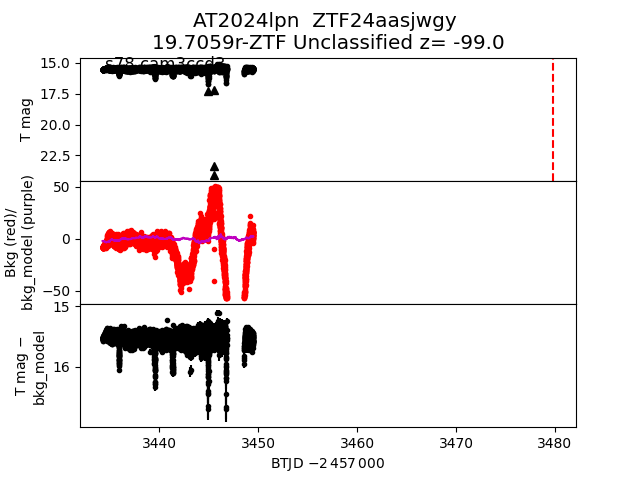
 2024lpn
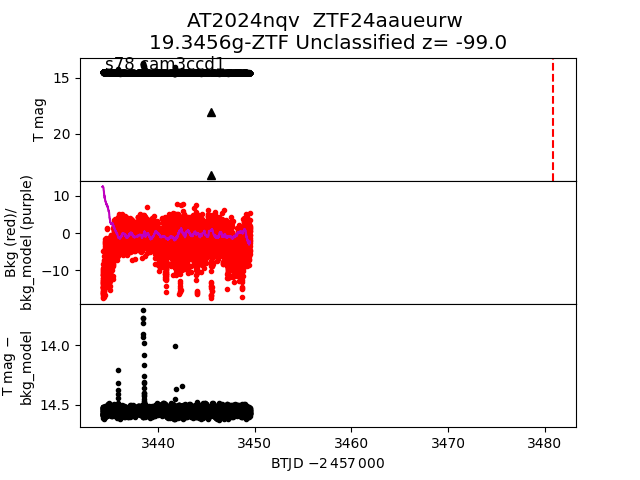
 2024nqv
 2024isb
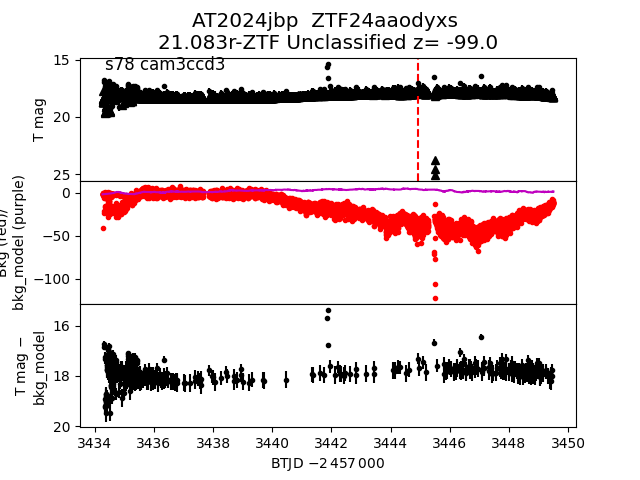
 2024jbp
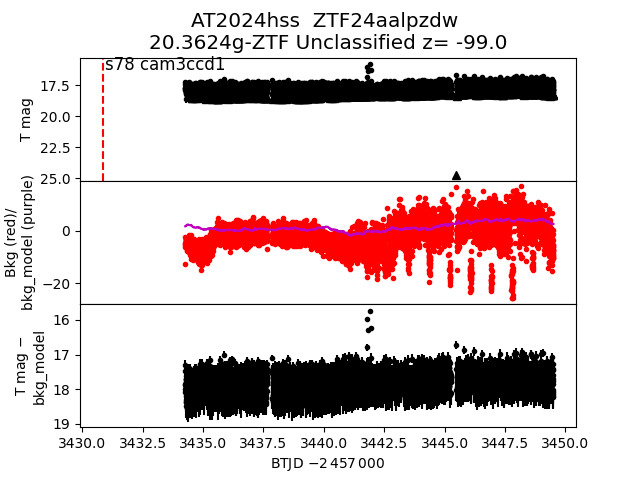
 2024hss
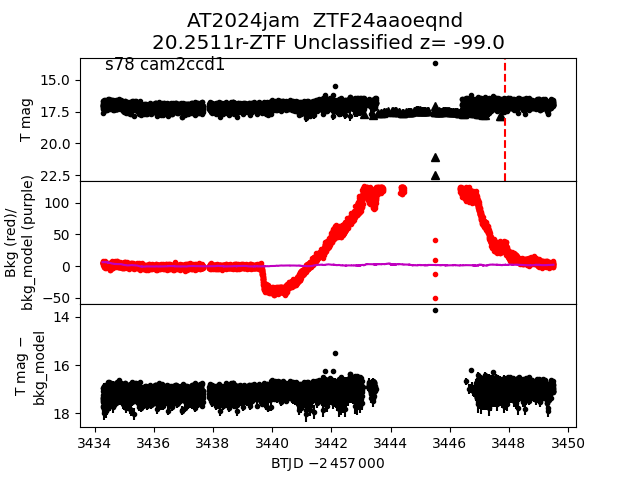
 2024jam
 2024ibc
 2024jpl
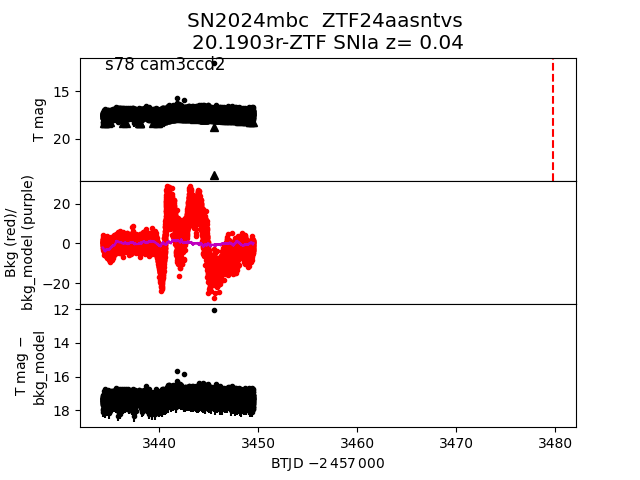
 2024mbc
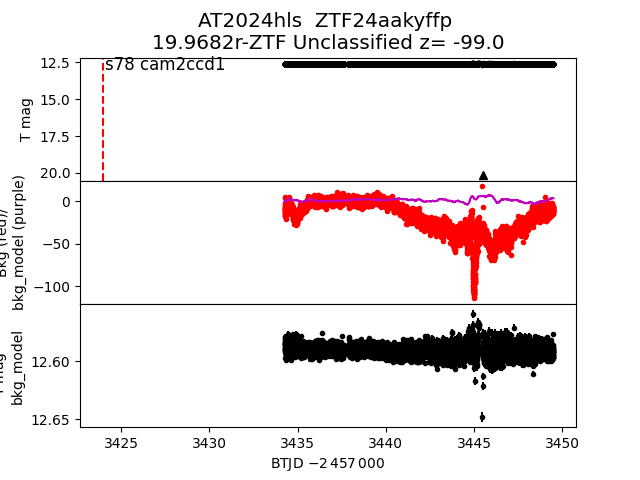
 2024hls
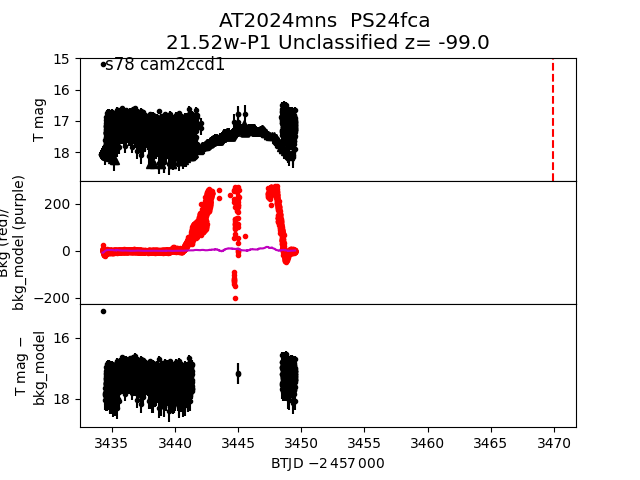
 2024mns
 2024kll
 2024jst
 2024jgm
 2024kwx
 2024ohq
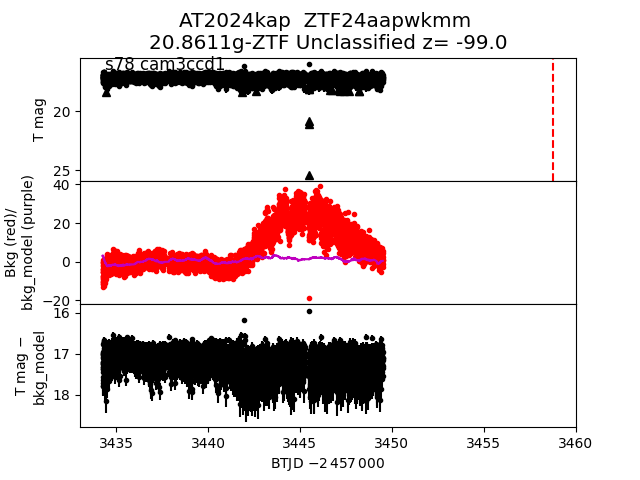
 2024kap
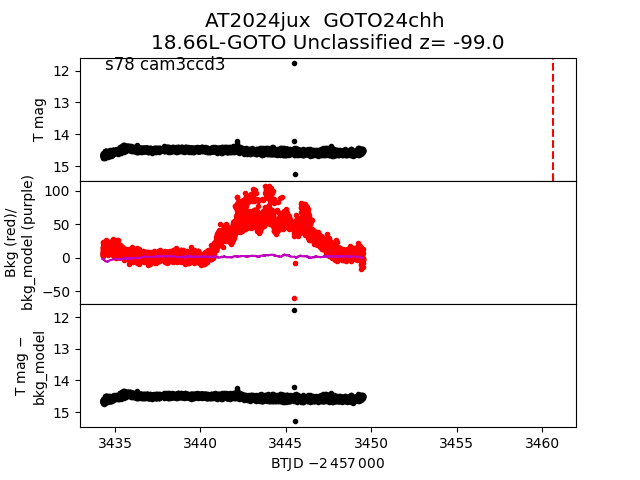
 2024jux
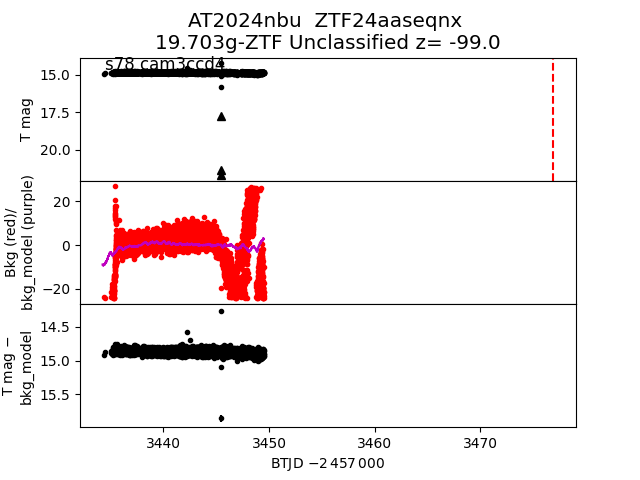
 2024nbu
 2024ljl
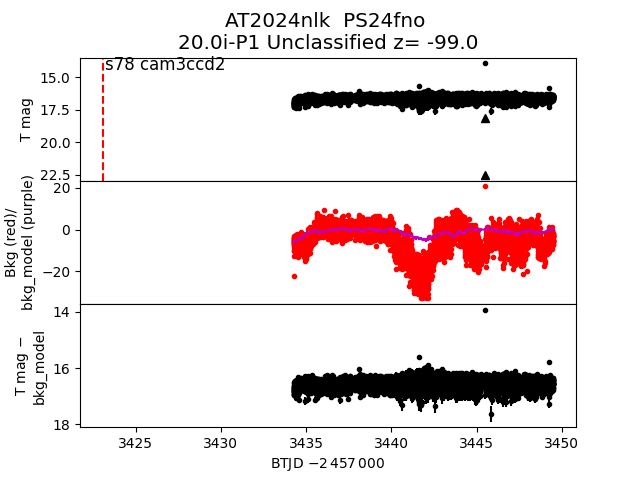
 2024nlk
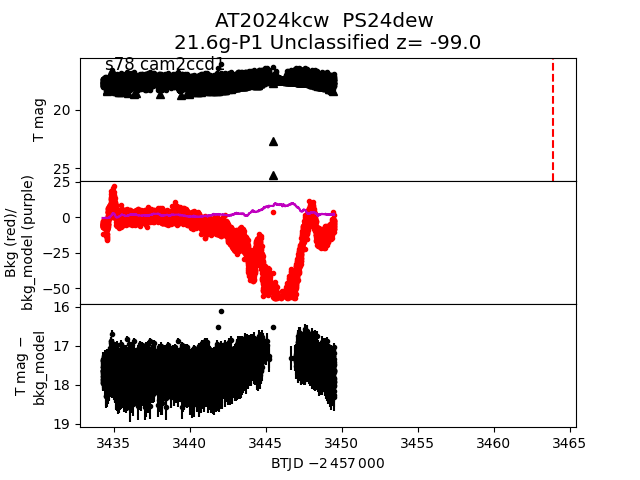
 2024kcw
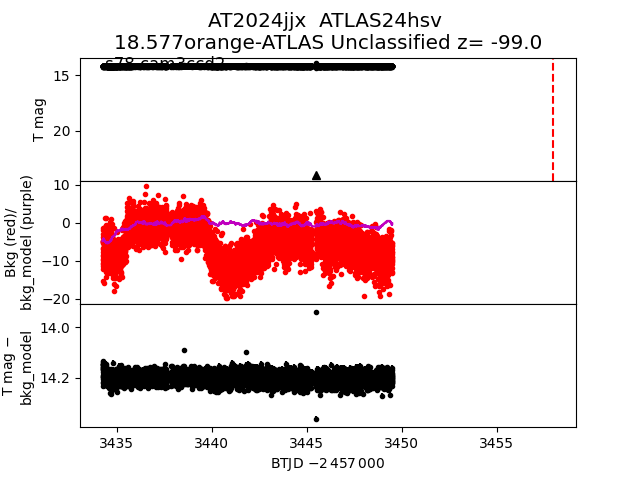
 2024jjx
 2024hxf
 2024ios
 2024kkz
 2024jhv
 2024luz
 2024jdf
 2024jap
 2024klb
 2024nda
 2024jvk
 2024lar
 2024iml
 2024kkt
 2024ldy
 2024ixj
 2024hqe
 2024nxp
 2024lxd
 2024nfj
 2024kxa
 2024hqz
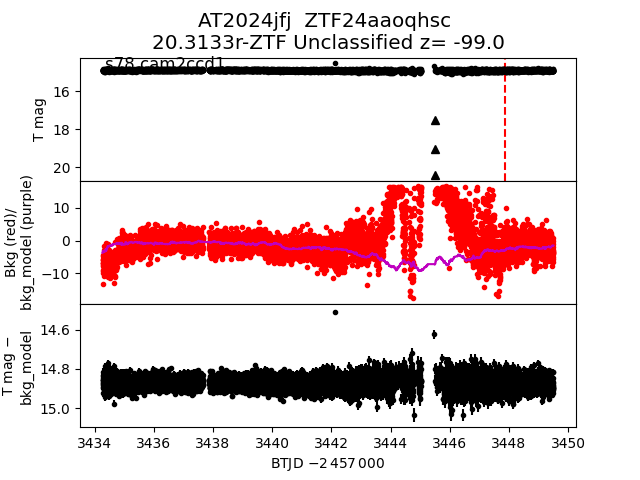
 2024jfj
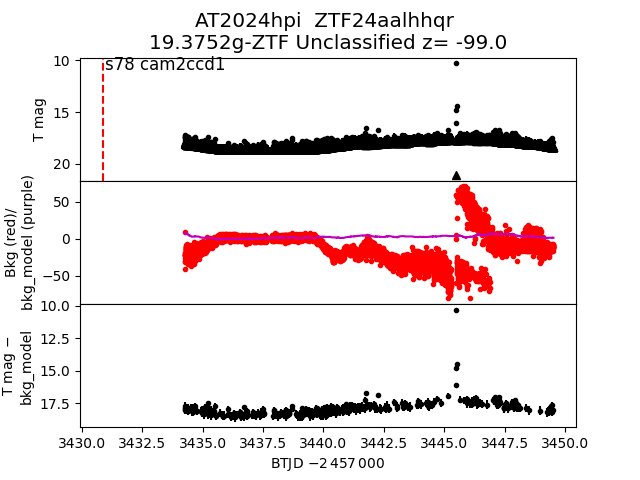
 2024hpi
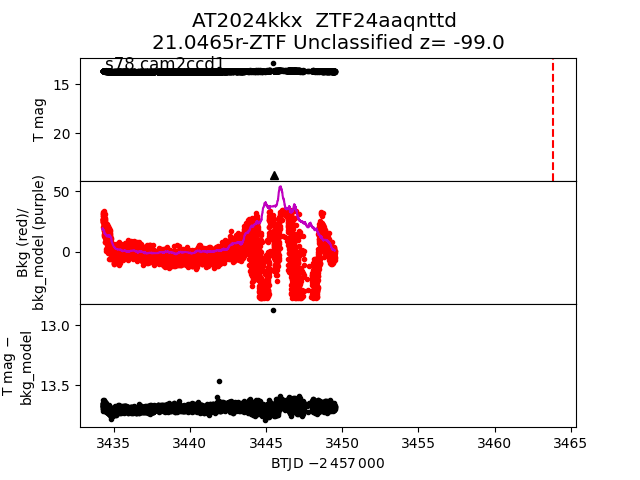
 2024kkx
 2024laa
 2024mon
 2024jew
 2024nbk
 2024jjy
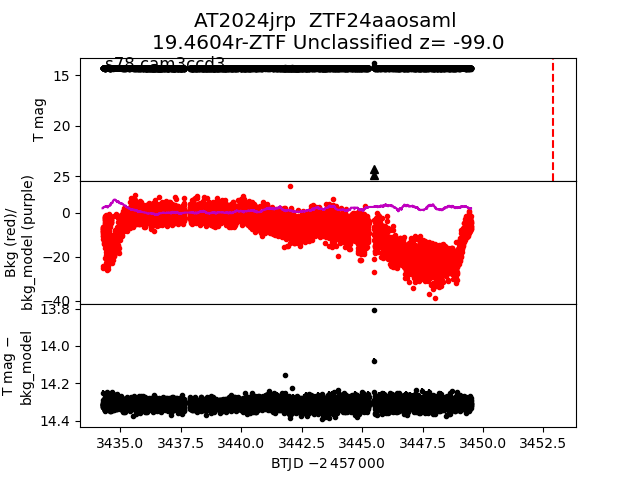
 2024jrp
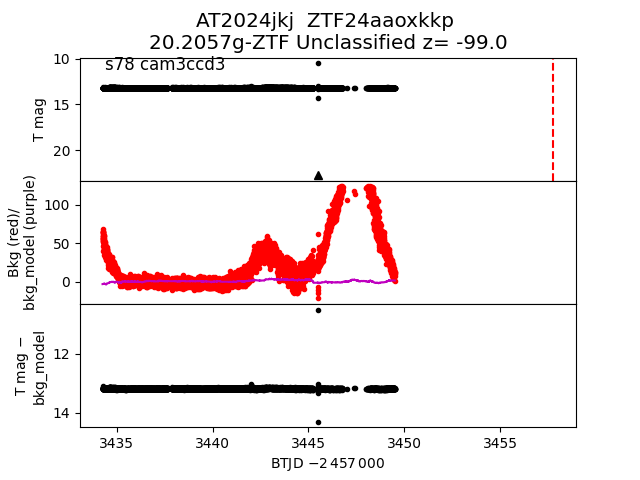
 2024jkj
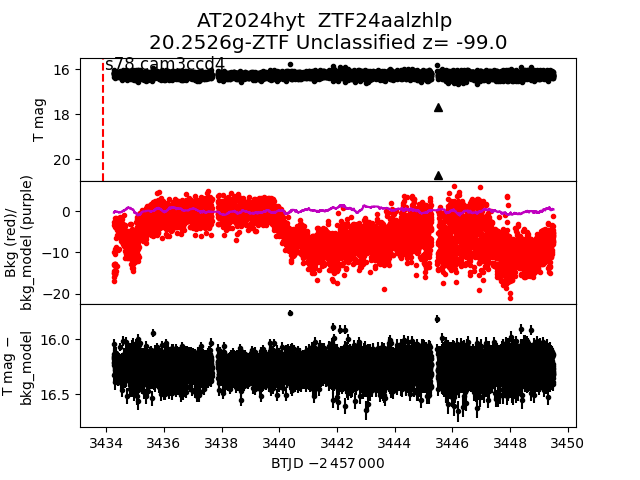
 2024hyt
 2024isf
 2024kee
 2024ldl
 2024lsw
 2024jbk
 2024muu
 2024nbt
 2024jsj
 2024jcn
 2024knc
 2024gvb
 2024hvu
 2024kiy
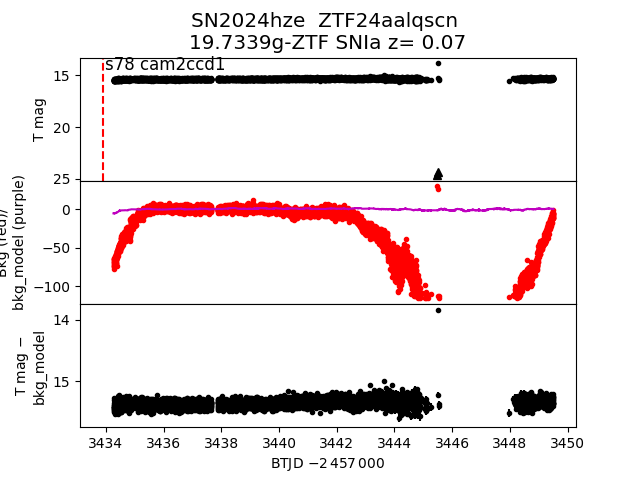
 2024hze
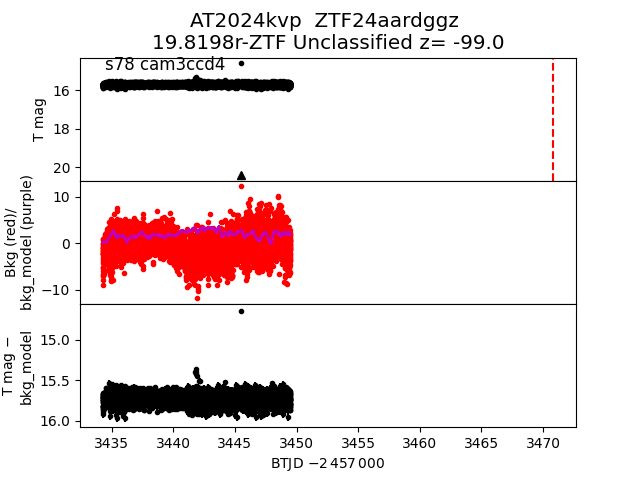
 2024kvp
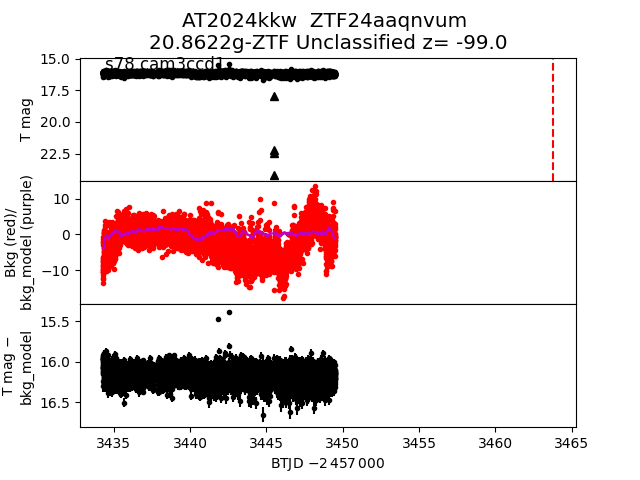
 2024kkw
 2024ltd
 2024luh
 2024iir
 2024gzw
 2024mlc
 2024jbg
 2024kjm
 2024ibt
 2024kcs
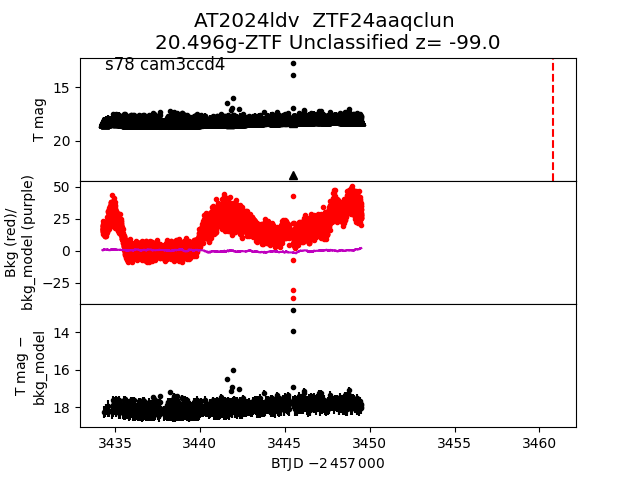
 2024ldv
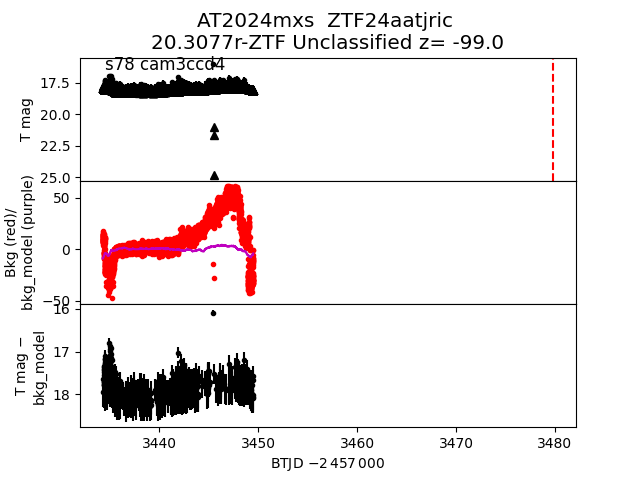
 2024mxs
 2024lee