sector77 supernovae (36 total)
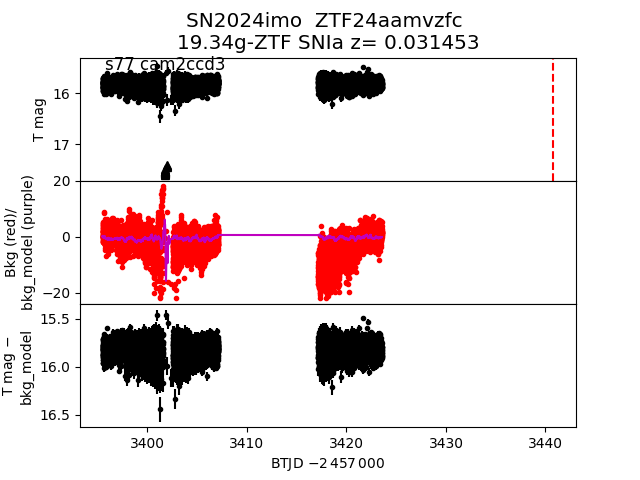
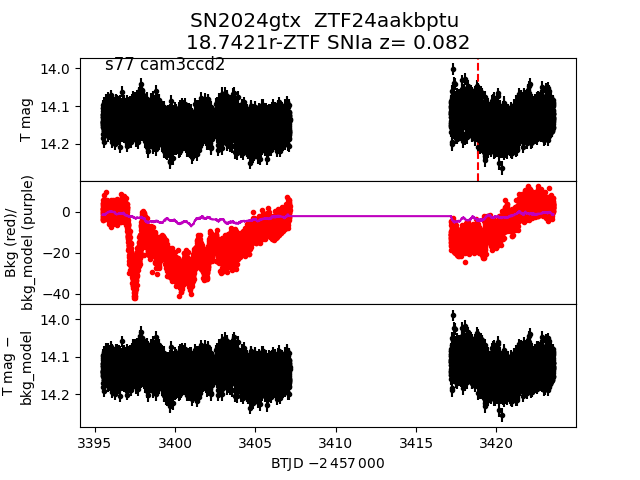
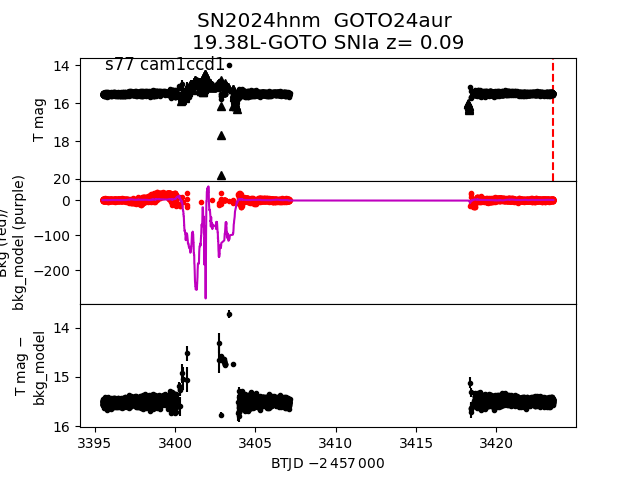
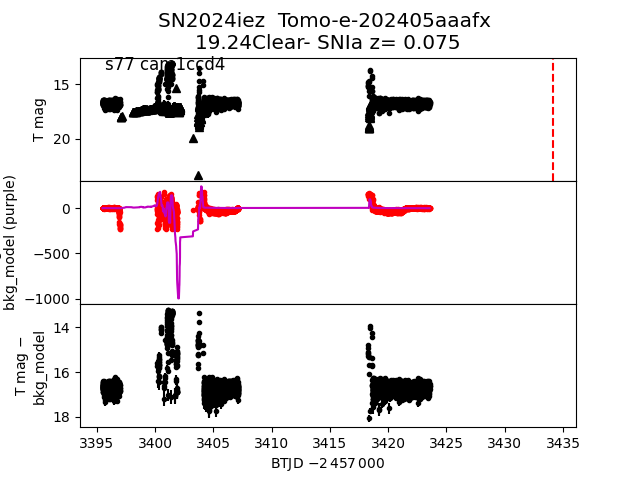
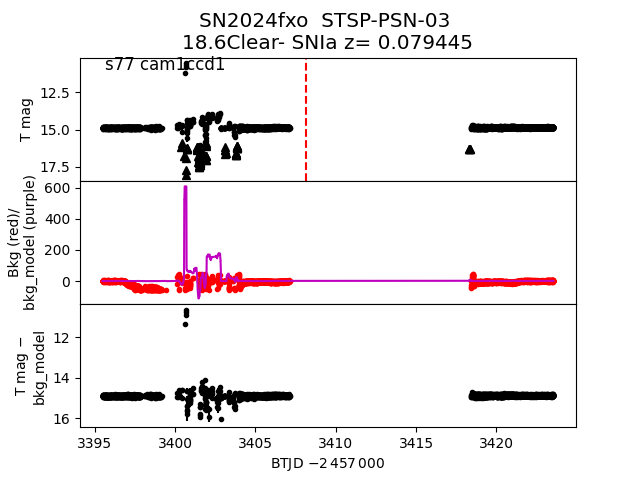
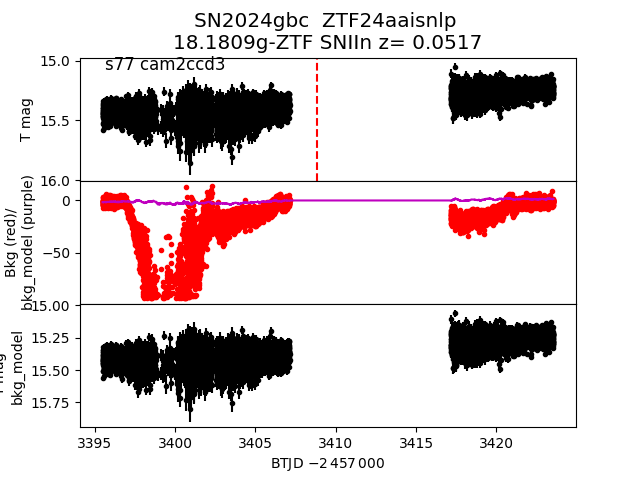
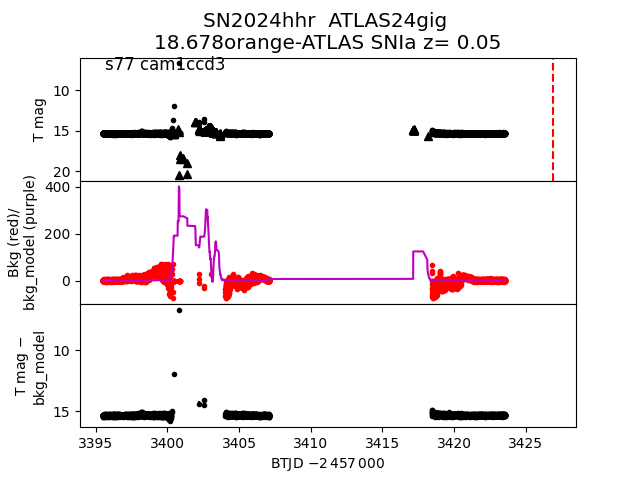
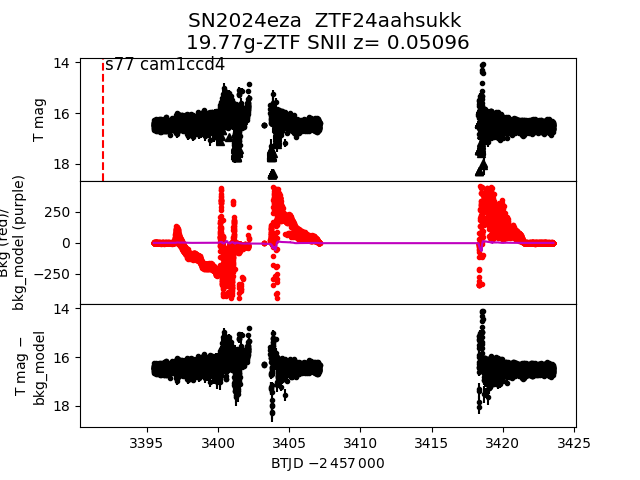
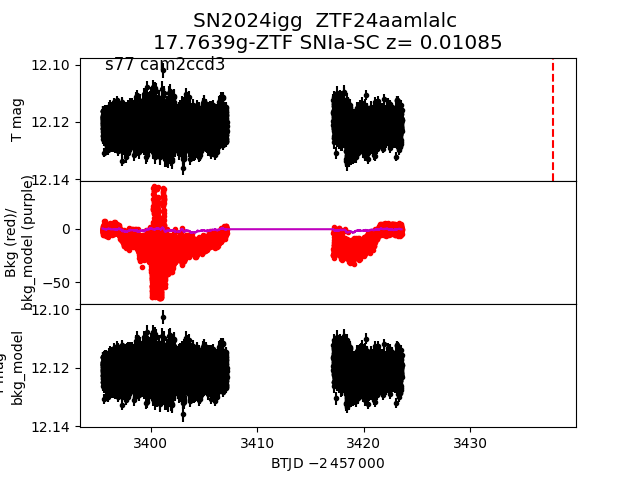
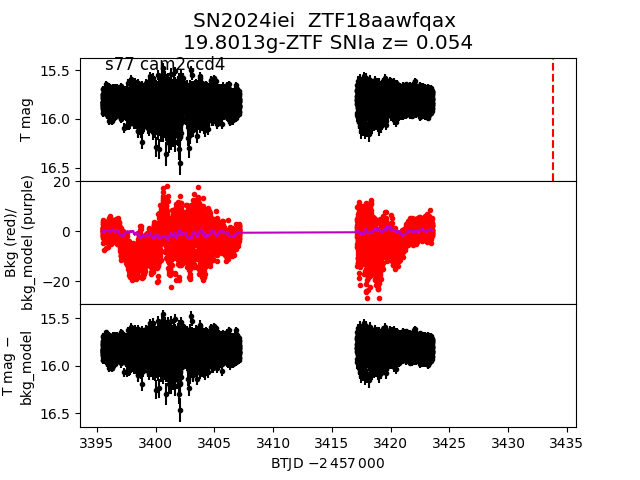
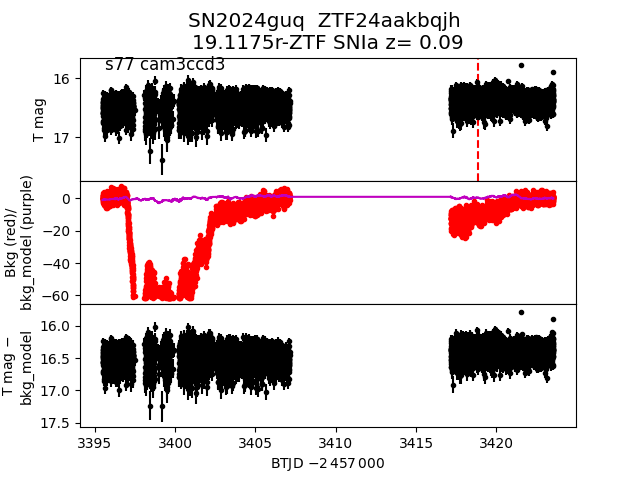
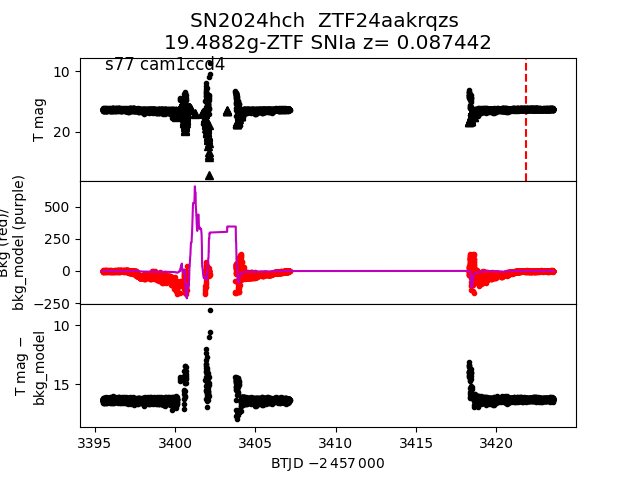
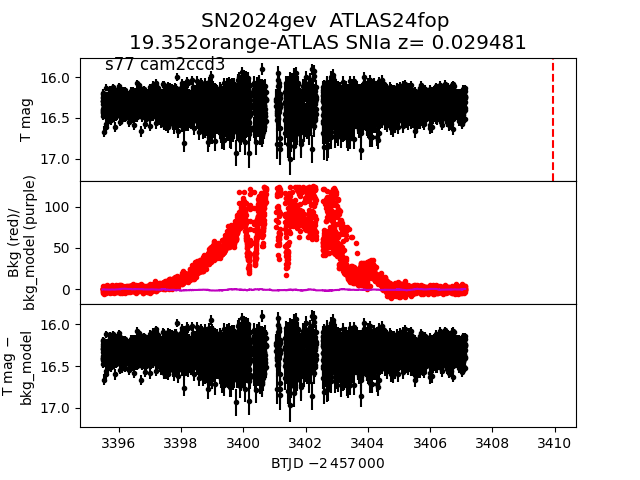
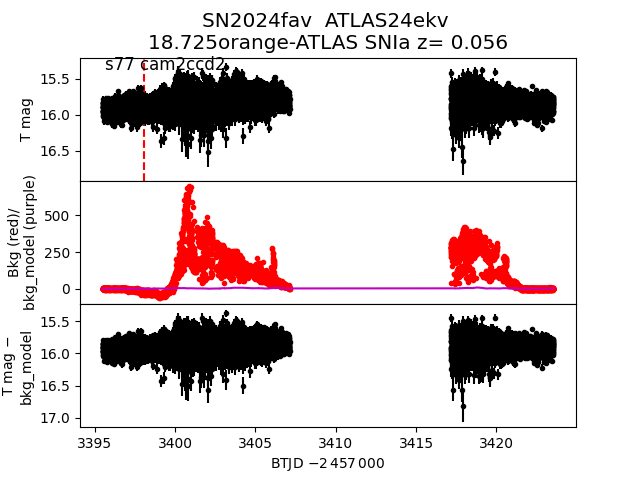
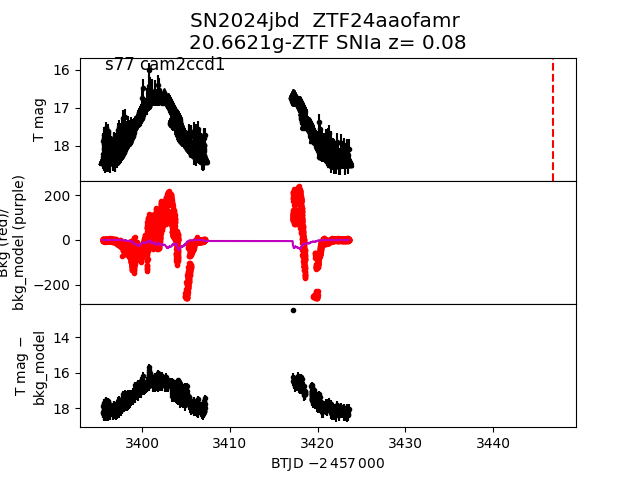
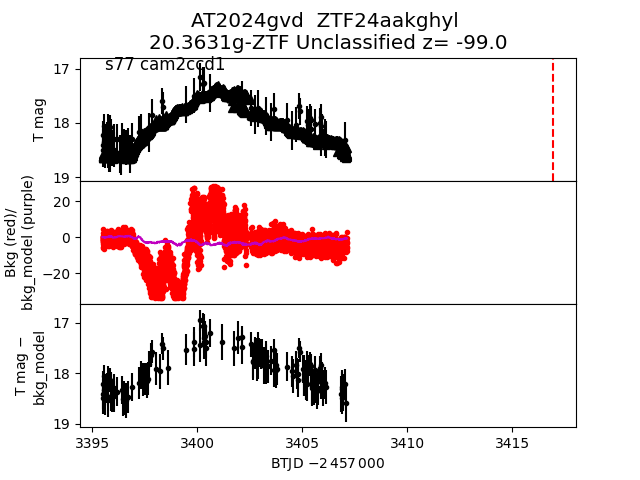
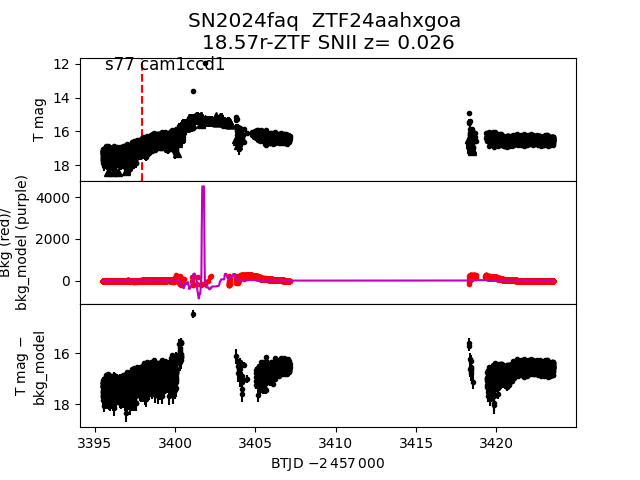
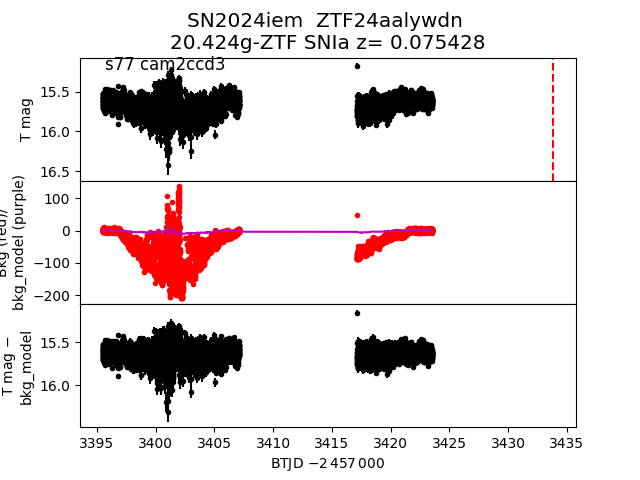
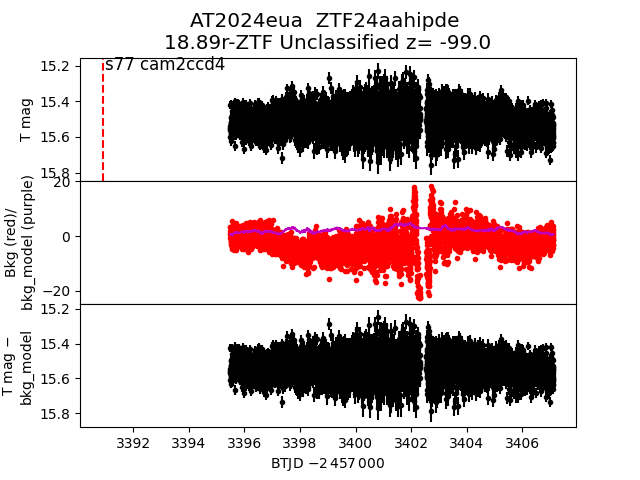
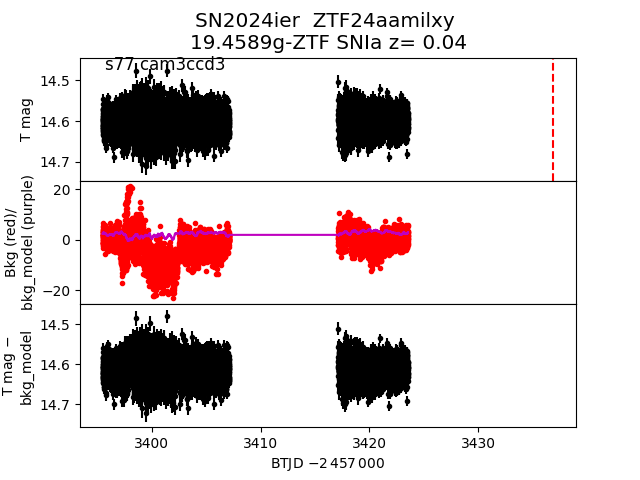
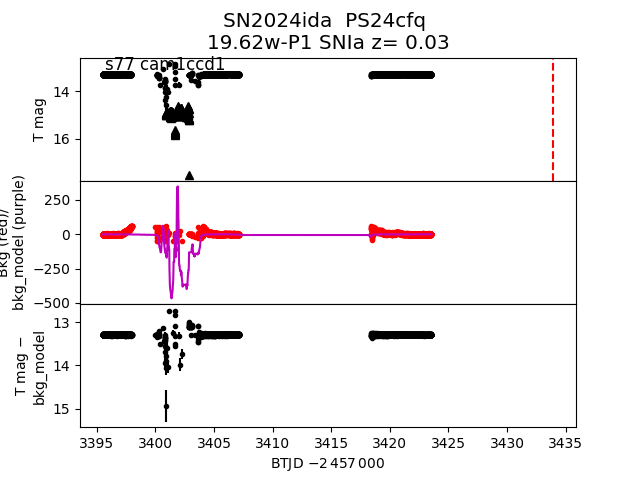
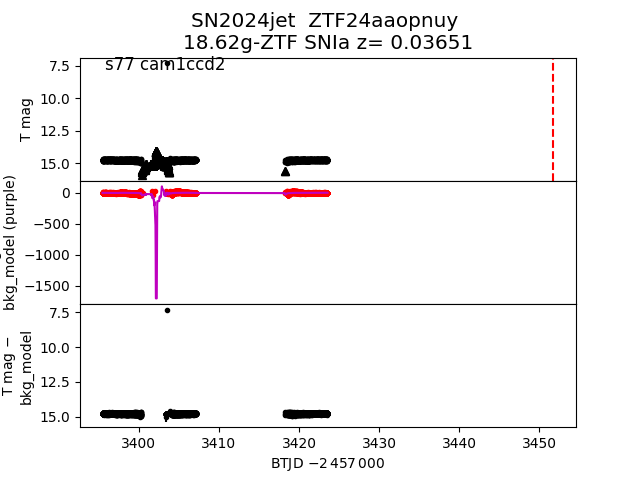
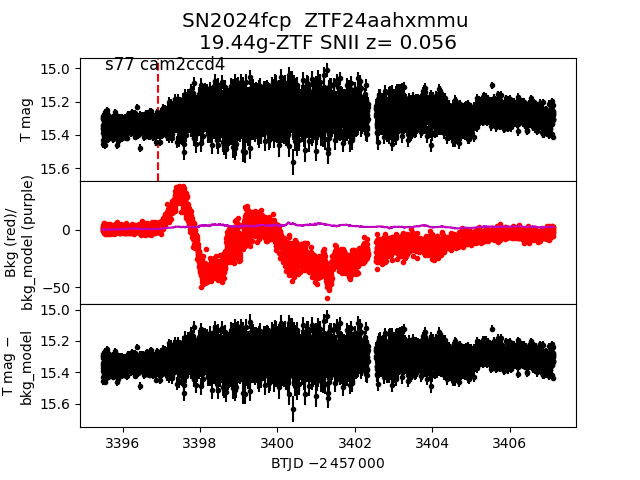
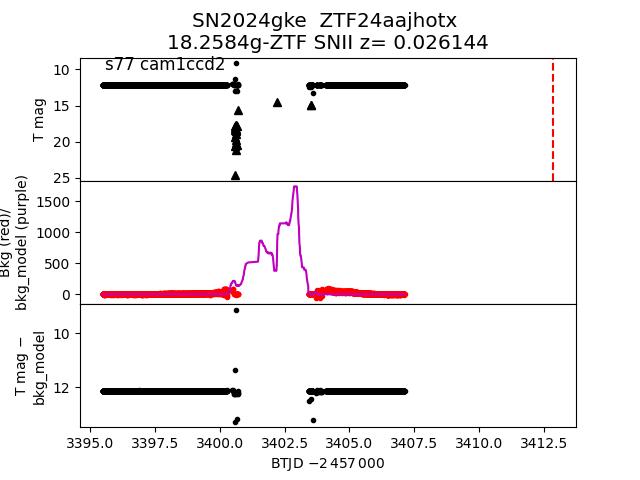
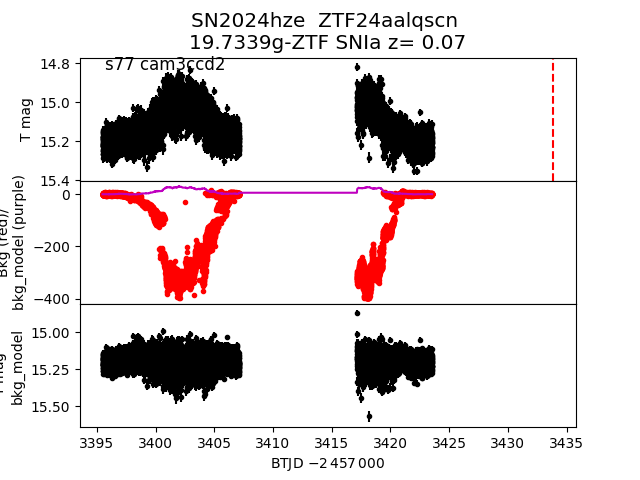
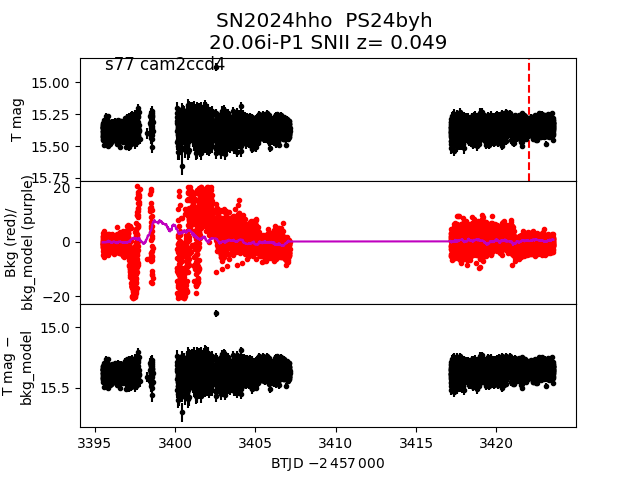
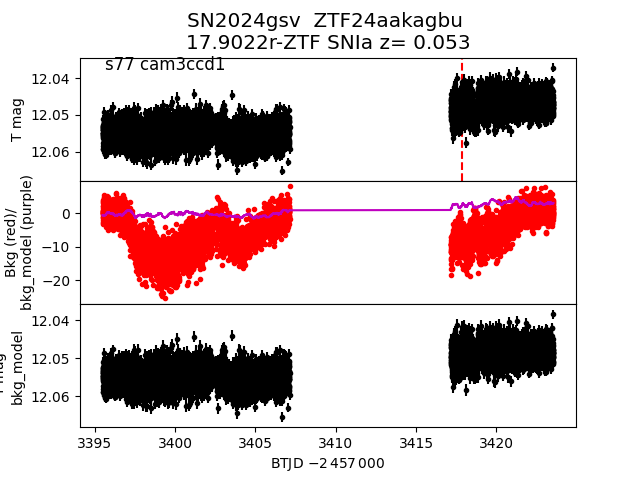
Each figure has three panels. The top panel shows the transient light curve, the middle panel shows the local background (estimated in an annulus), and the bottom panel shows a "background-model corrected" light curve. Details about the background model are in the README.
The vertical red line marks the time of discovery reported to TNS. Other useful metadata from TNS is in the figure title.
Note that the top and bottom panel are in magnitudes, while the middle panel is in differential flux units. The magnitudes are calibrated to the flux in the reference image used for image subtraction. Thus, flux from the host galaxy is included in these magnitudes.
3-sigma upper limits are plotted as triangles with no errorbars. A typical limiting magnitude is 19.6 in 30 minutes or 18.4 in 200 seconds (for low backgrounds).
The links allow you to download the light curve data as a text file.
More details in the README.
2024gtx
 2024hnm
 2024iez
 2024fxo
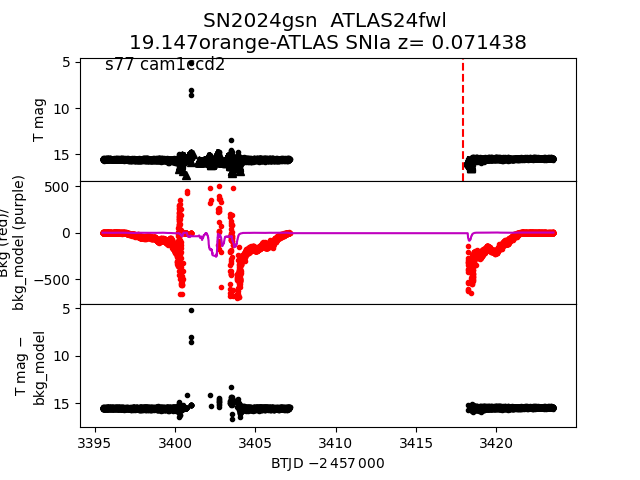
 2024gsn
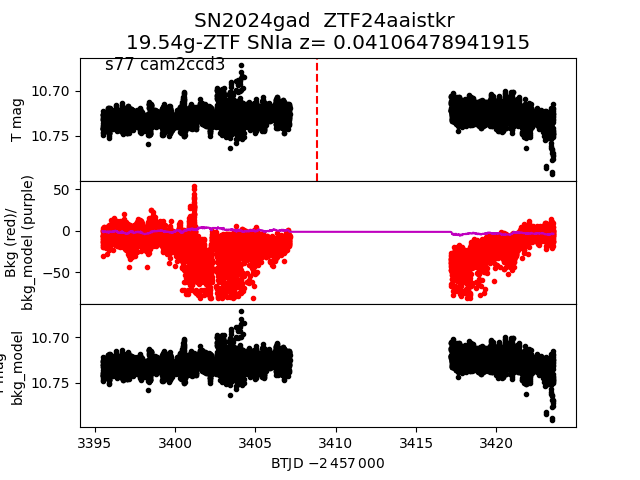
 2024gad
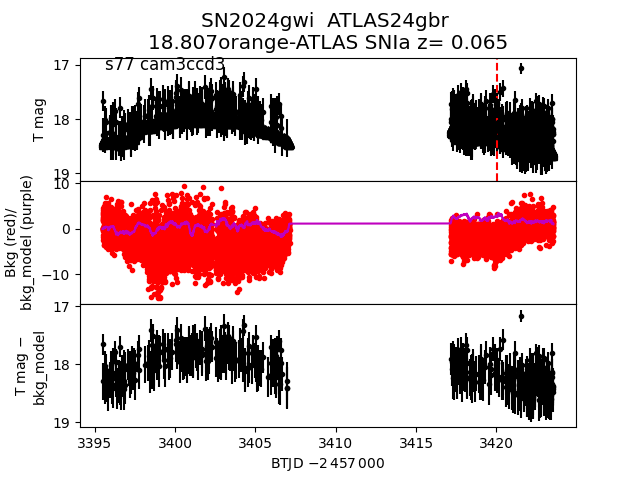
 2024gwi
 2024gbc
 2024hhr
 2024eza
 2024igg
 2024iei
 2024guq
 2024hch
 2024gev
 2024fav
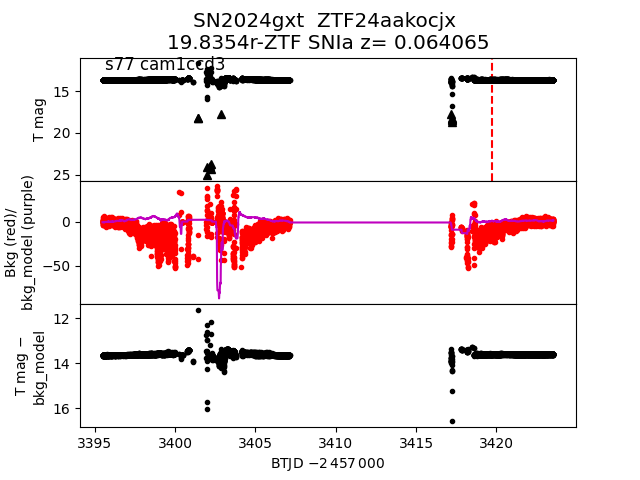
 2024gxt
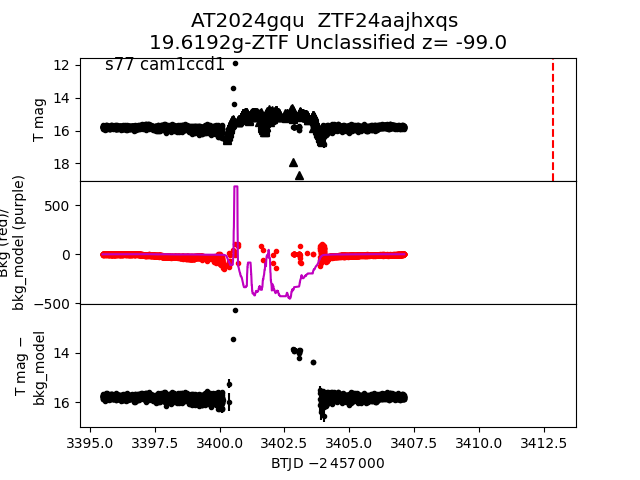
 2024gqu
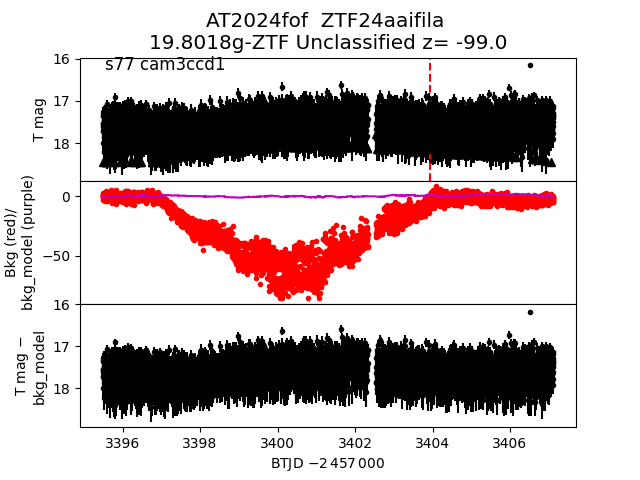
 2024fof
 2024jbd
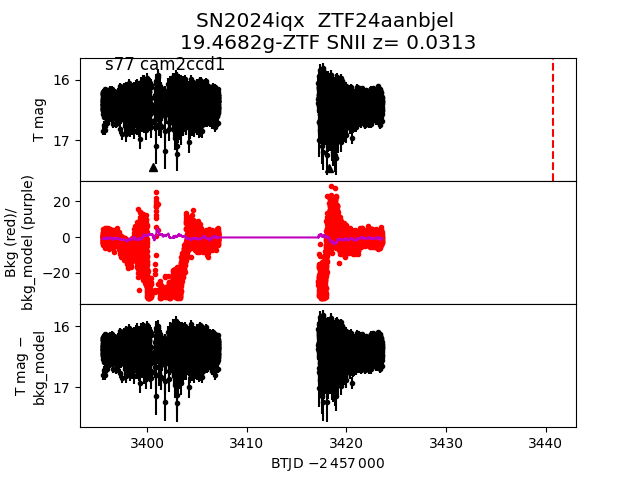
 2024iqx
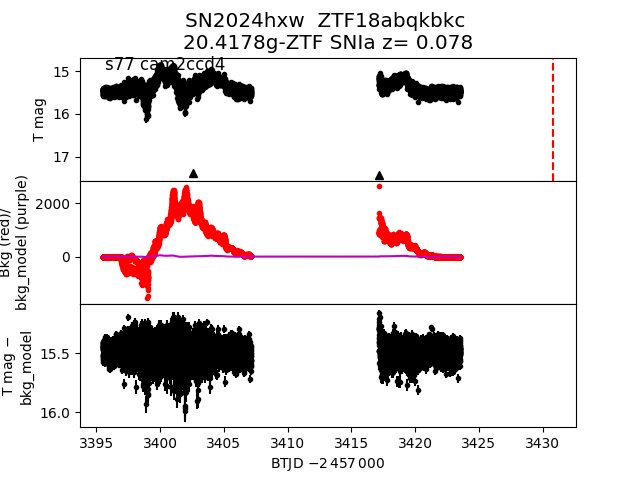
 2024hxw
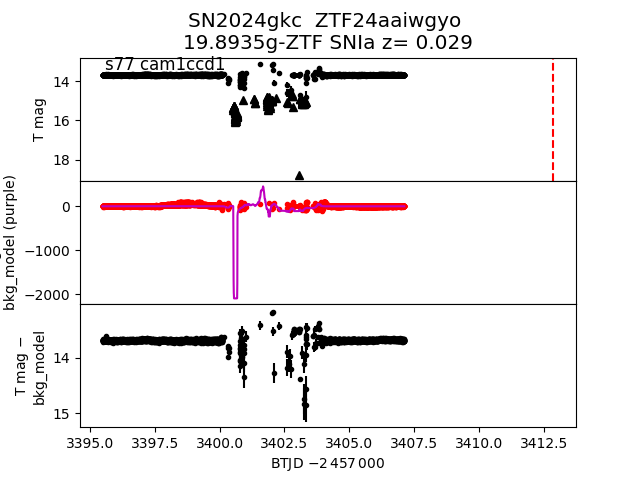
 2024gkc
 2024gvd
 2024faq
 2024iem
 2024eua
 2024ier
 2024ida
 2024jet
 2024fcp
 2024gke
 2024hze
 2024hho
 2024gsv
 2024imo