sector76 supernovae (21 total)
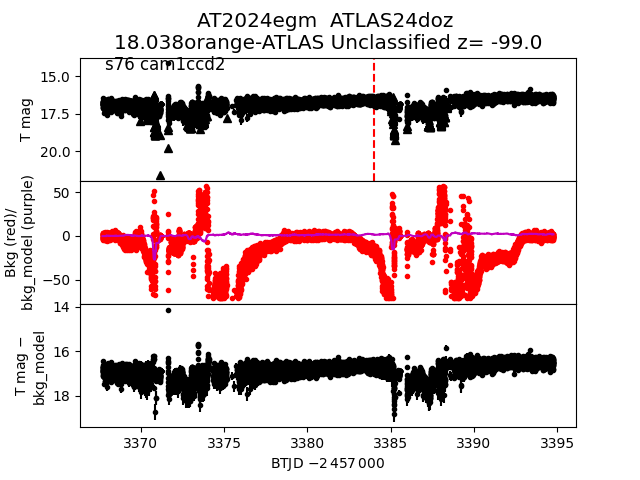
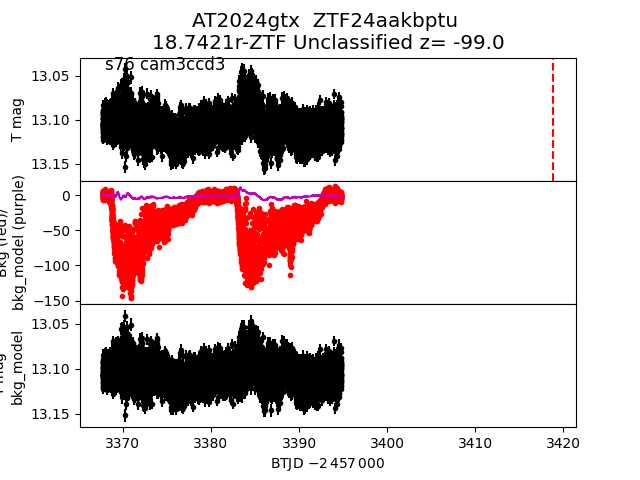
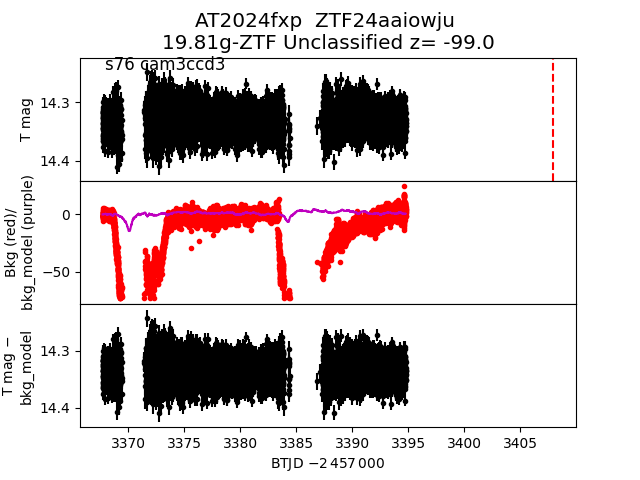
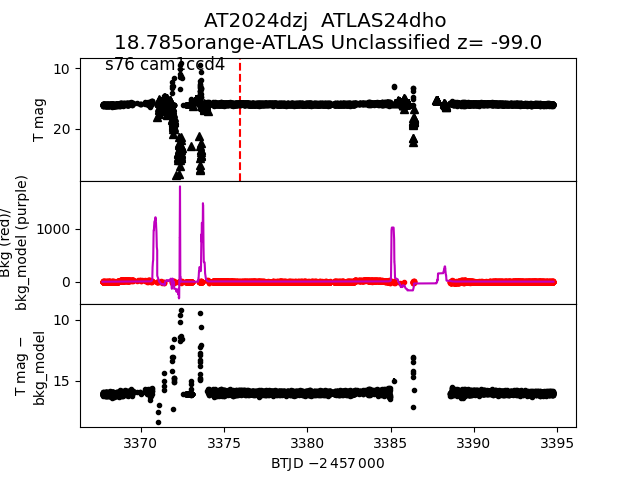
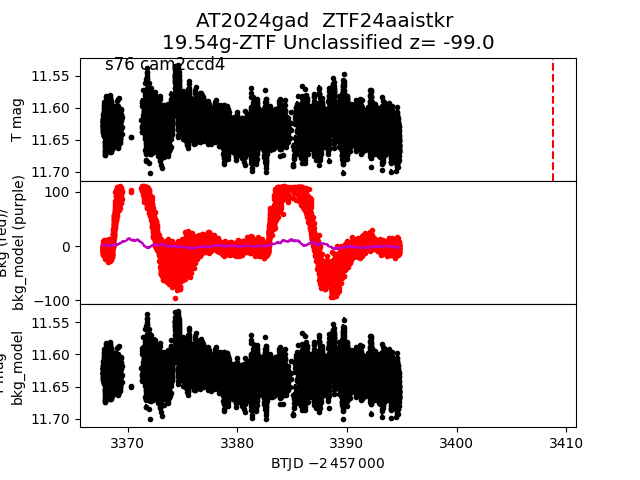
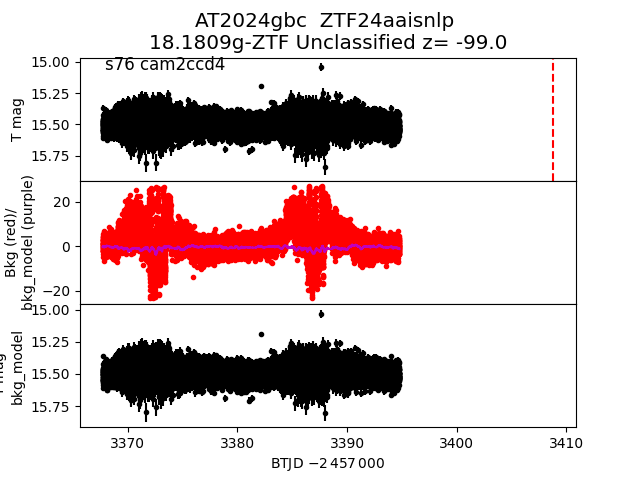
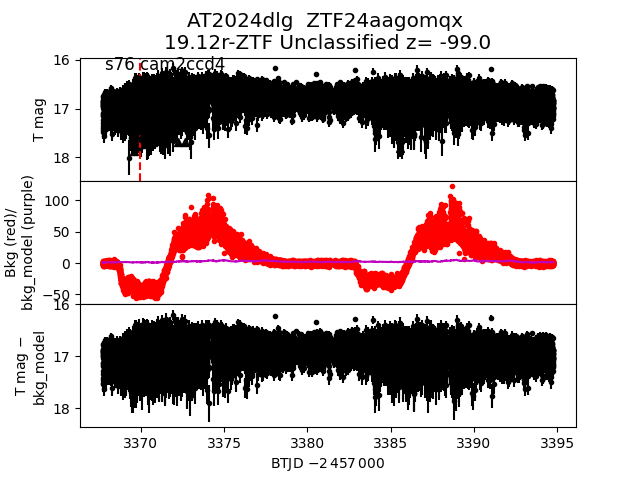
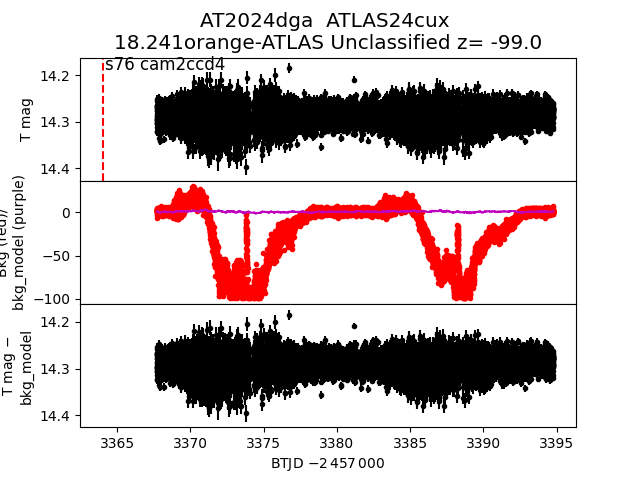
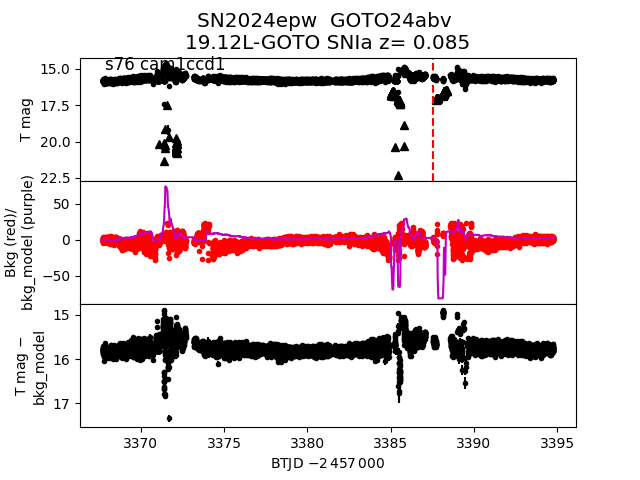
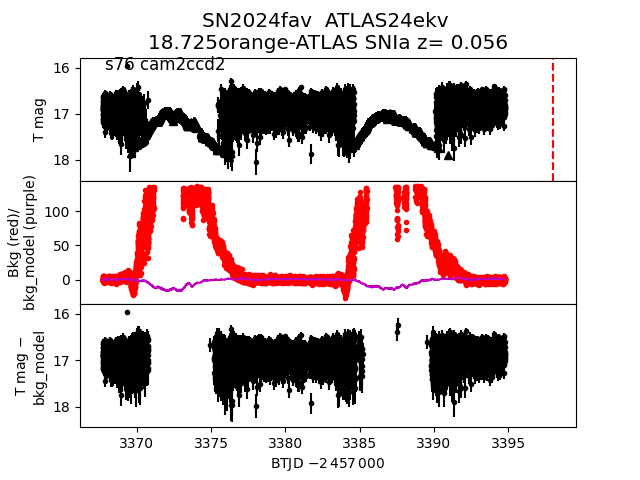
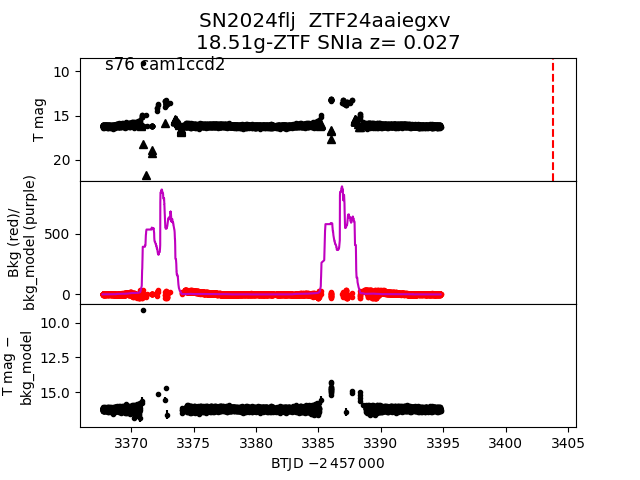
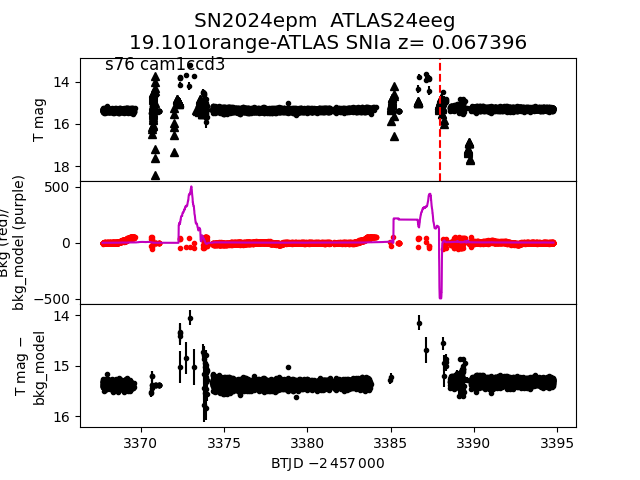
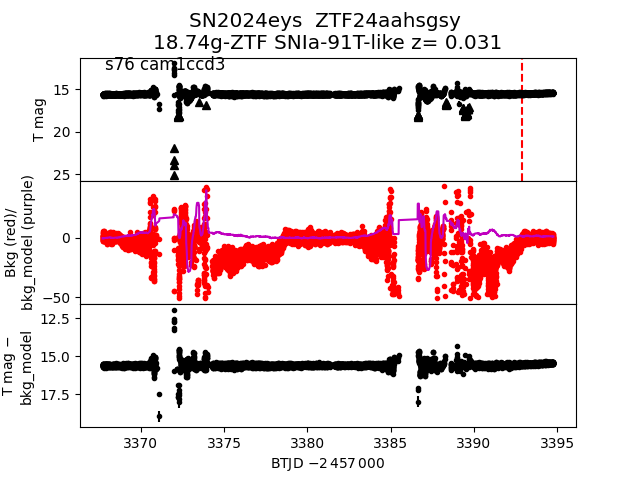
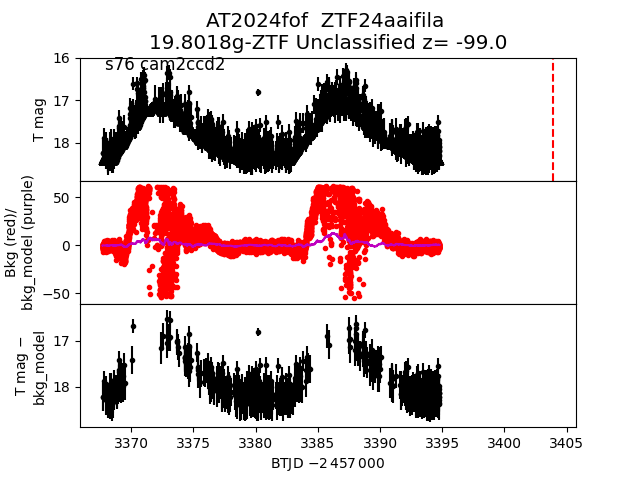
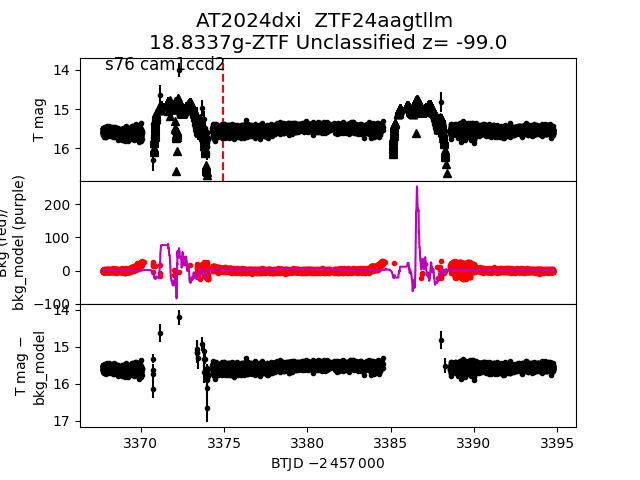
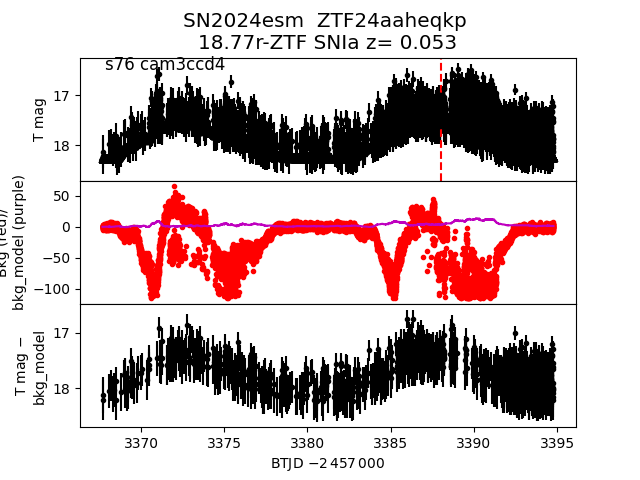
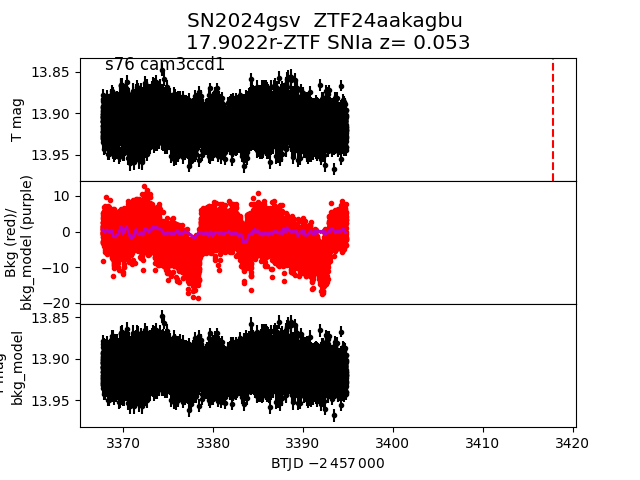
Each figure has three panels. The top panel shows the transient light curve, the middle panel shows the local background (estimated in an annulus), and the bottom panel shows a "background-model corrected" light curve. Details about the background model are in the README.
The vertical red line marks the time of discovery reported to TNS. Other useful metadata from TNS is in the figure title.
Note that the top and bottom panel are in magnitudes, while the middle panel is in differential flux units. The magnitudes are calibrated to the flux in the reference image used for image subtraction. Thus, flux from the host galaxy is included in these magnitudes.
3-sigma upper limits are plotted as triangles with no errorbars. A typical limiting magnitude is 19.6 in 30 minutes or 18.4 in 200 seconds (for low backgrounds).
The links allow you to download the light curve data as a text file.
More details in the README.
2024gtx
 2024fxp
 2024dzj
 2024gad
 2024gbc
 2024dlg
 2024dga
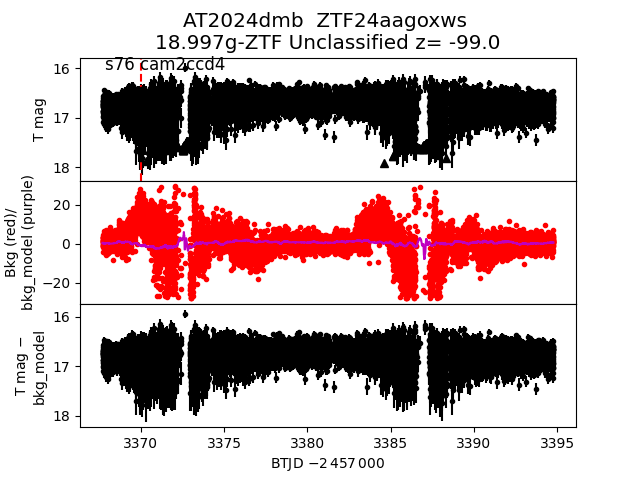
 2024dmb
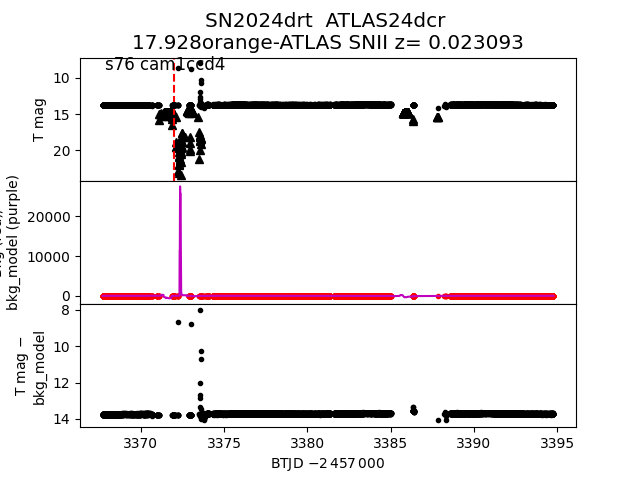
 2024drt
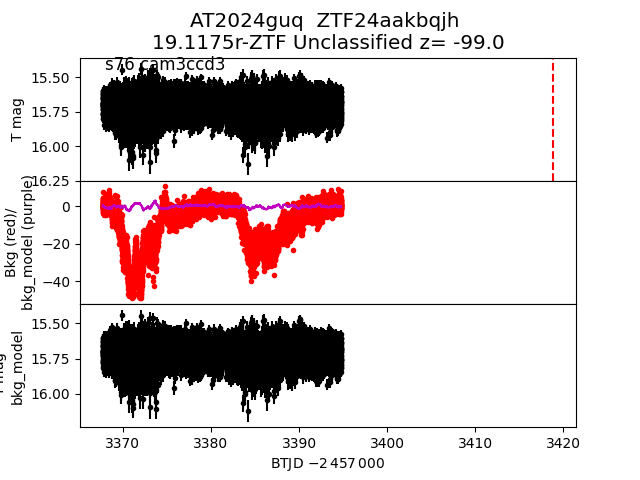
 2024guq
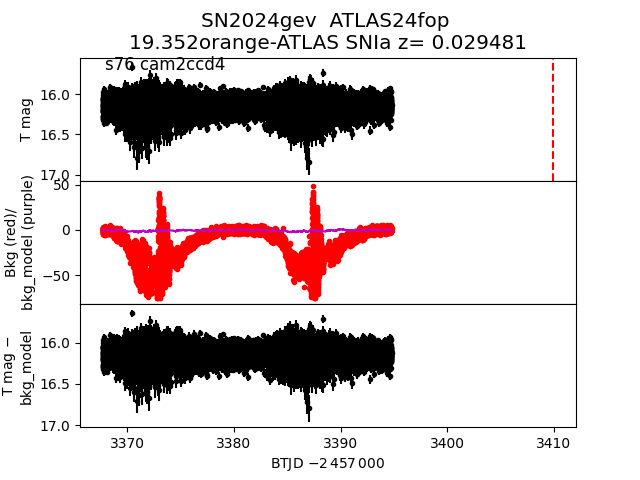
 2024gev
 2024epw
 2024fav
 2024flj
 2024epm
 2024eys
 2024fof
 2024dxi
 2024esm
 2024gsv
 2024egm