sector72 supernovae (32 total)
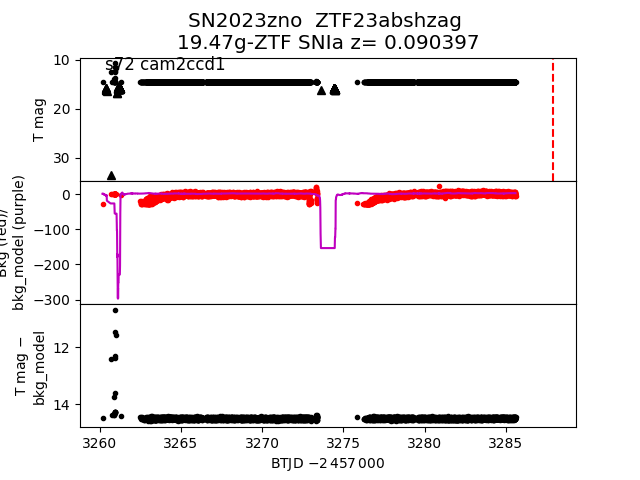
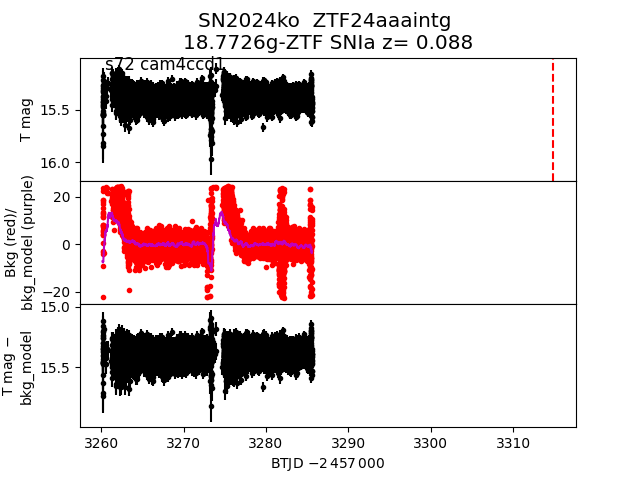
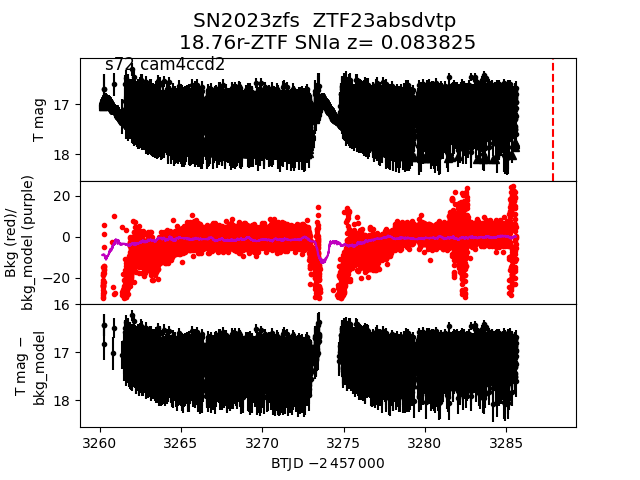
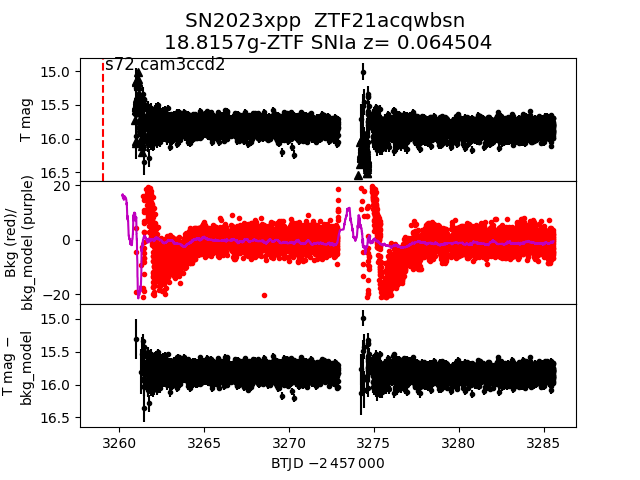
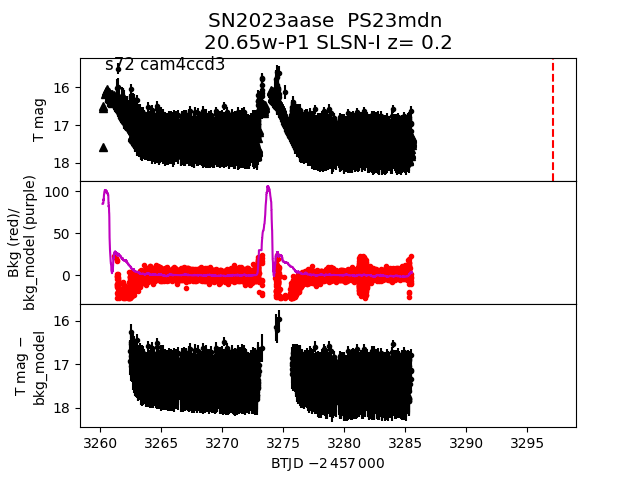
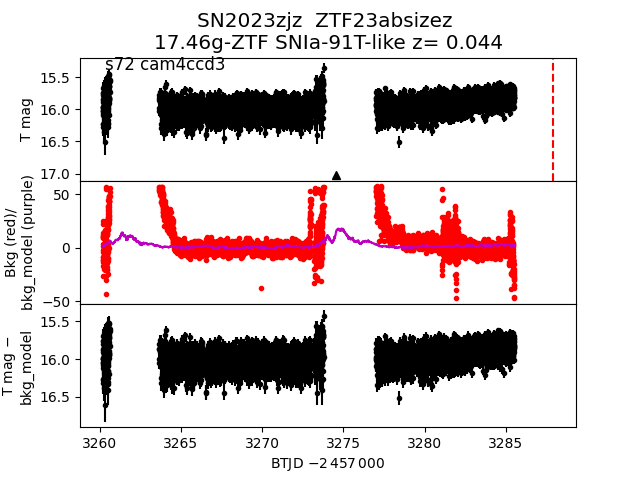
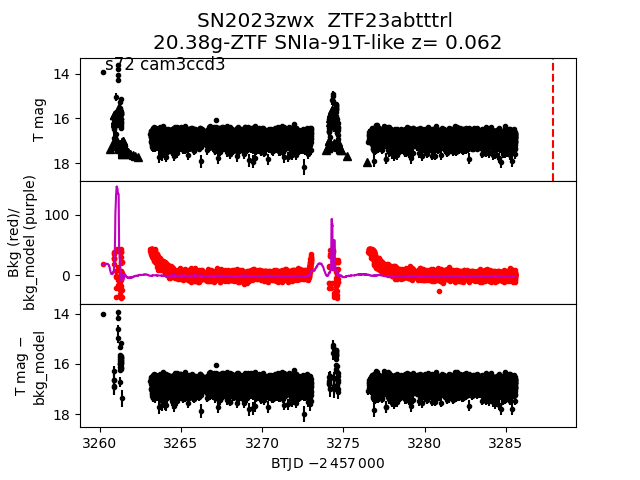
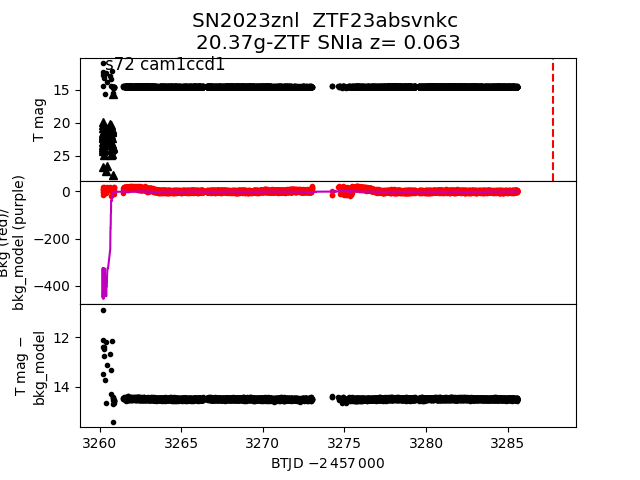
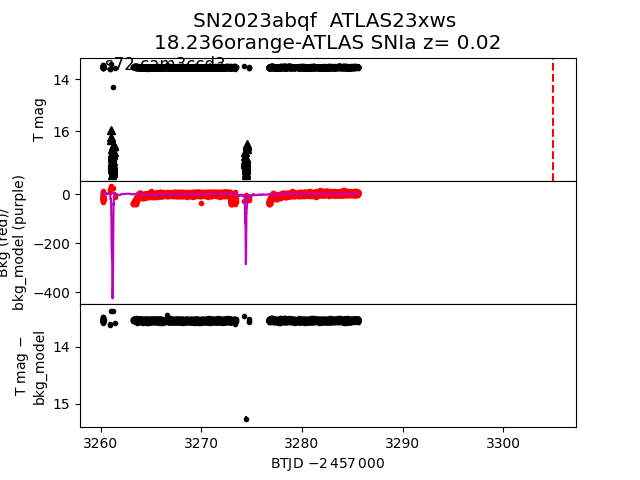
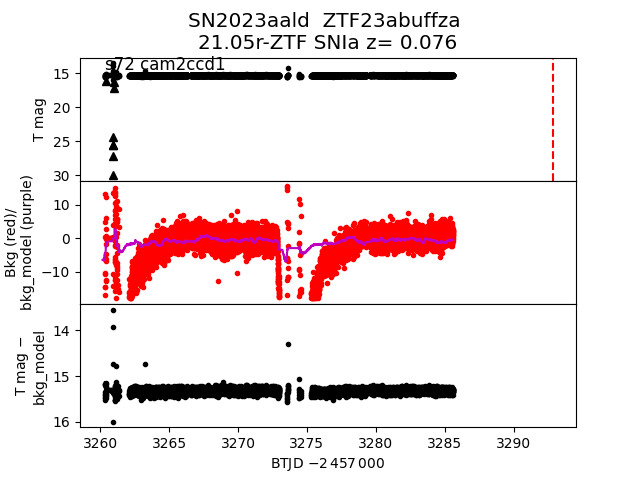
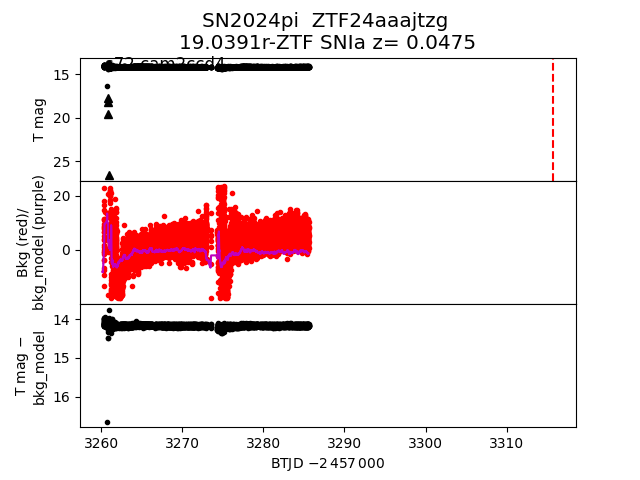
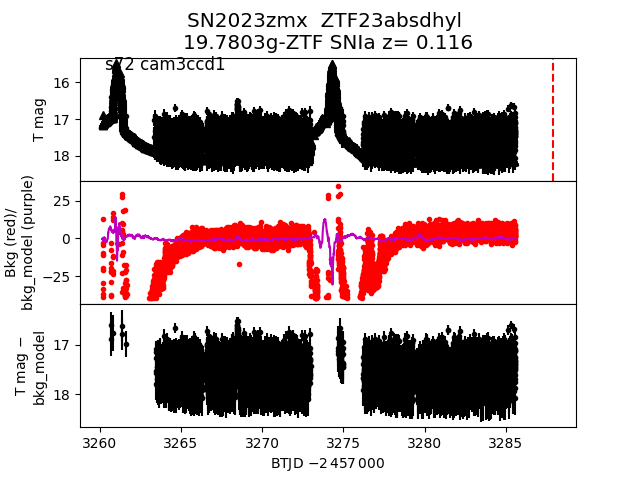
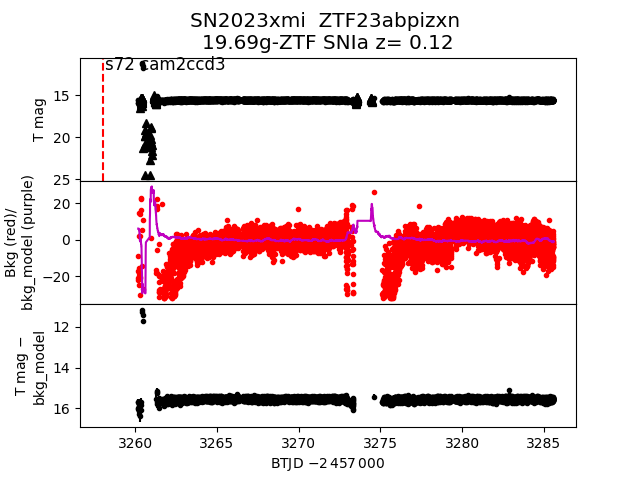
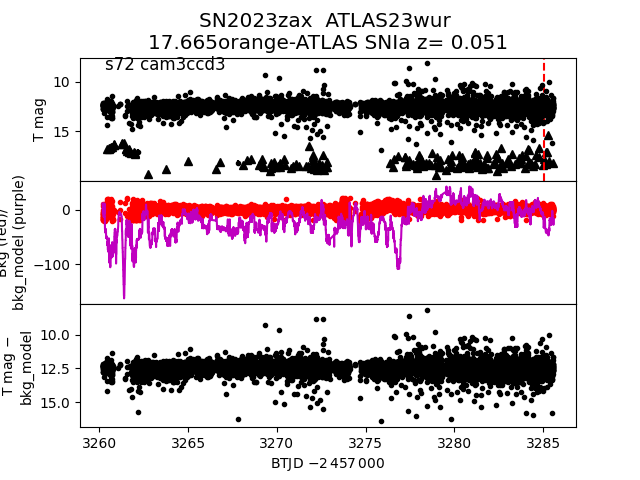
Each figure has three panels. The top panel shows the transient light curve, the middle panel shows the local background (estimated in an annulus), and the bottom panel shows a "background-model corrected" light curve. Details about the background model are in the README.
The vertical red line marks the time of discovery reported to TNS. Other useful metadata from TNS is in the figure title.
Note that the top and bottom panel are in magnitudes, while the middle panel is in differential flux units. The magnitudes are calibrated to the flux in the reference image used for image subtraction. Thus, flux from the host galaxy is included in these magnitudes.
3-sigma upper limits are plotted as triangles with no errorbars. A typical limiting magnitude is 19.6 in 30 minutes or 18.4 in 200 seconds (for low backgrounds).
The links allow you to download the light curve data as a text file.
More details in the README.
2024ko
 2023zfs
 2023xpp
 2023aase
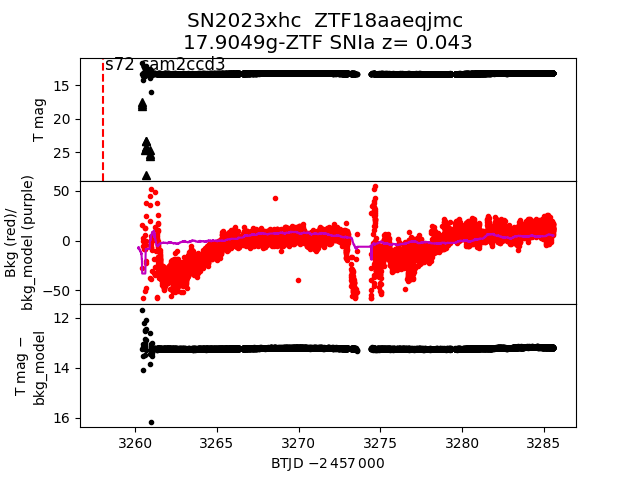
 2023xhc
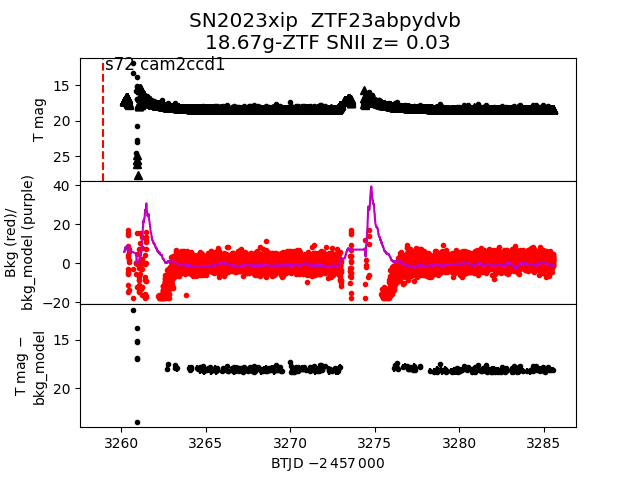
 2023xip
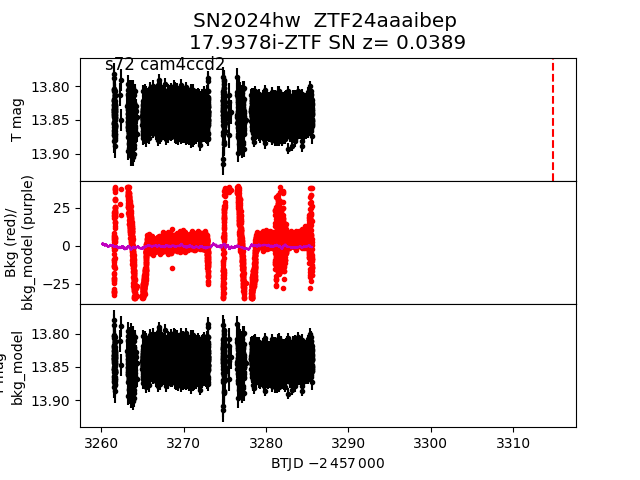
 2024hw
 2023zjz
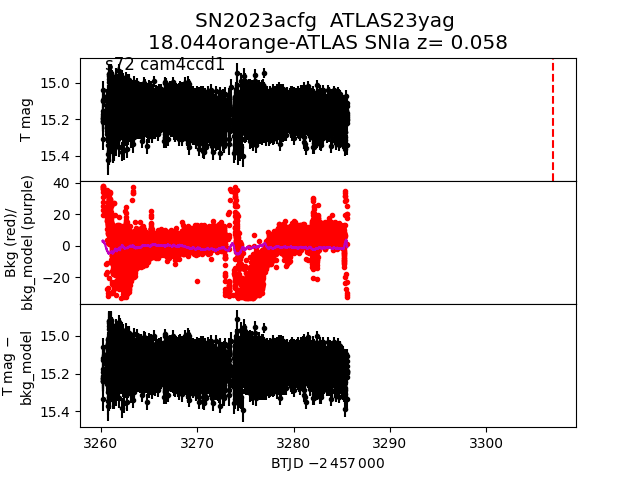
 2023acfg
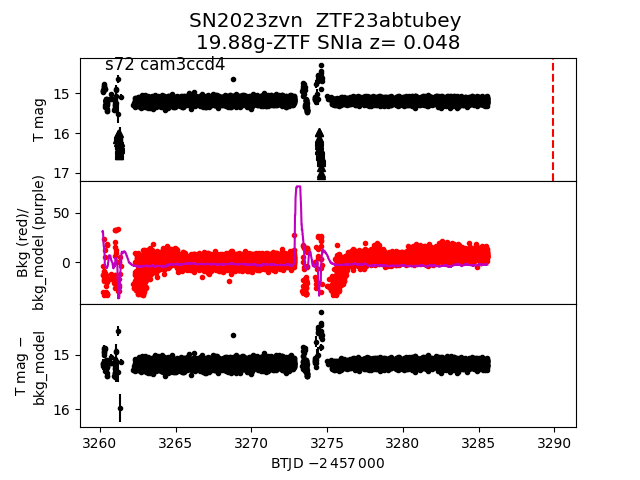
 2023zvn
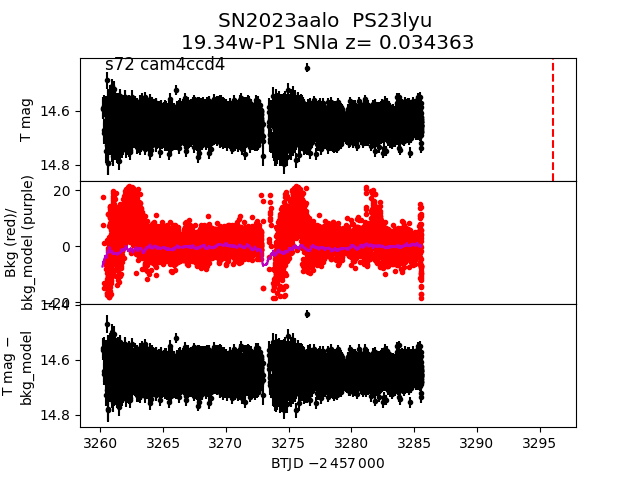
 2023aalo
 2023zwx
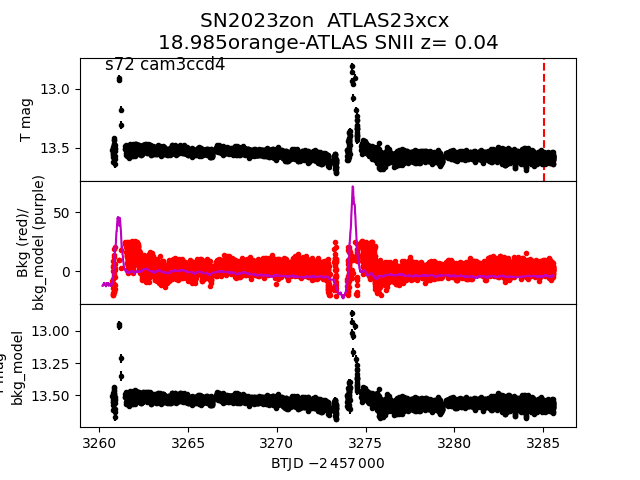
 2023zon
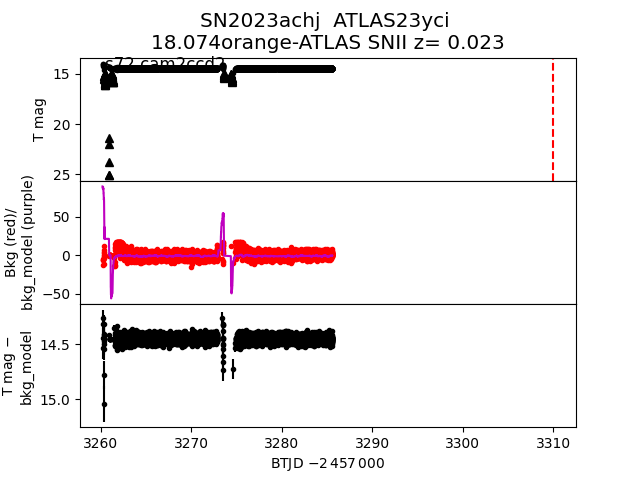
 2023achj
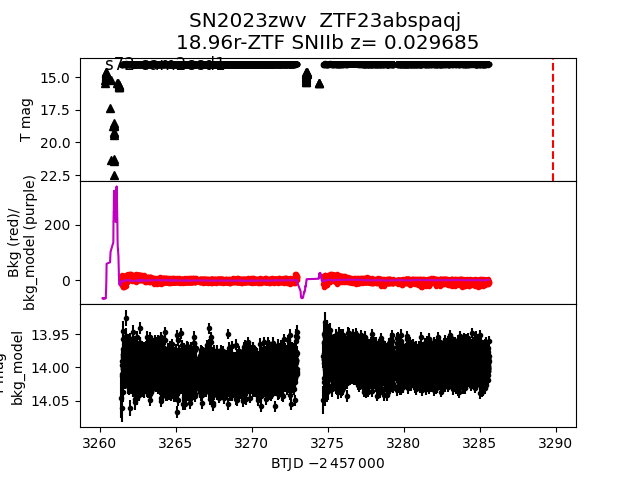
 2023zwv
 2023znl
 2023abqf
 2023aald
 2024pi
 2023zmx
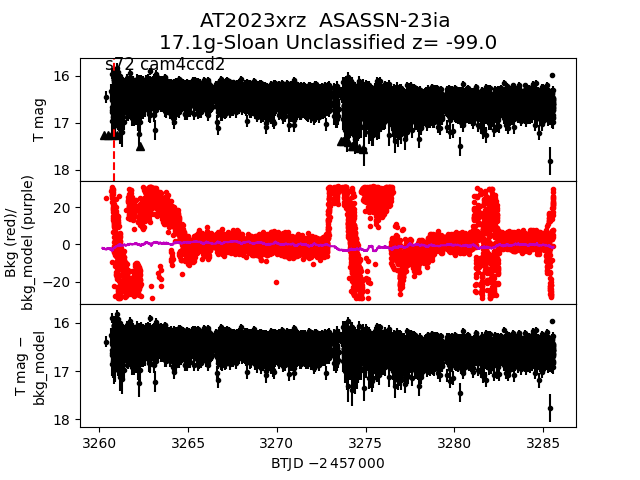
 2023xrz
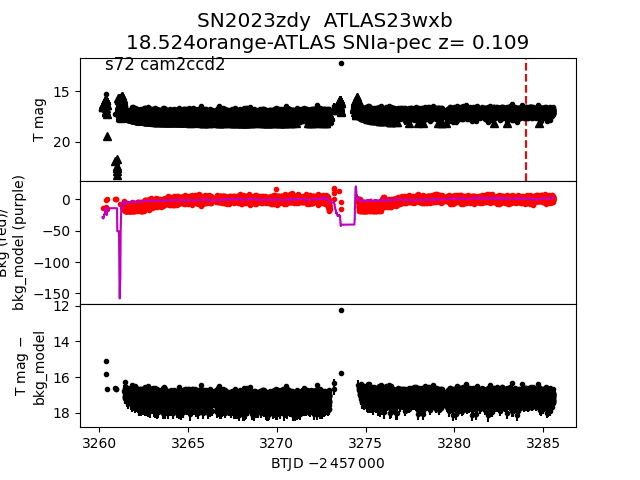
 2023zdy
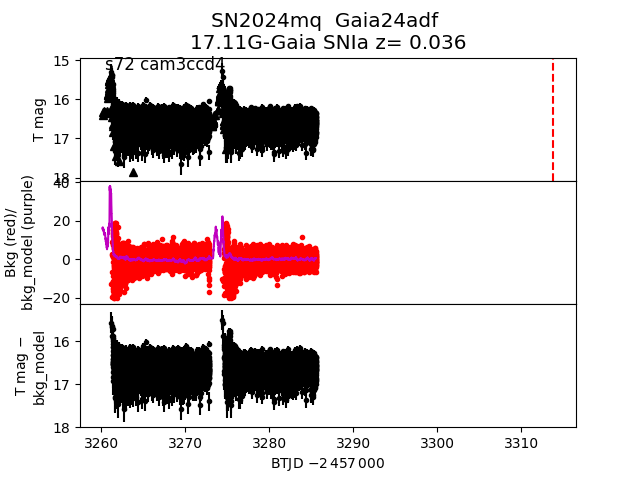
 2024mq
 2023xmi
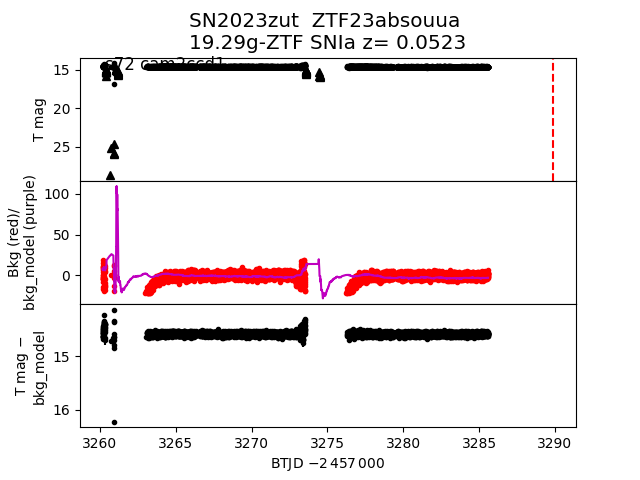
 2023zut
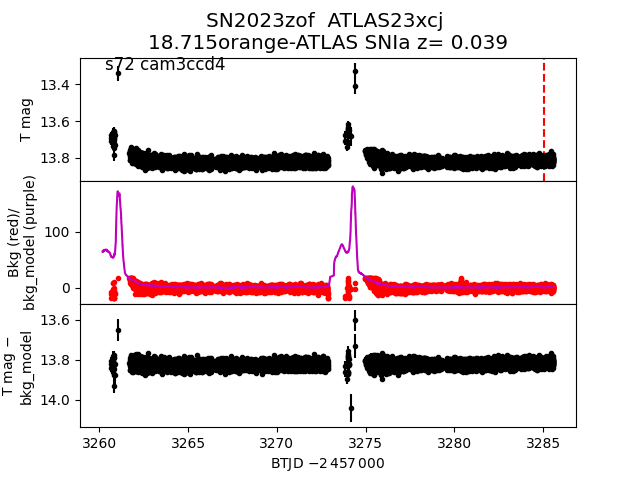
 2023zof
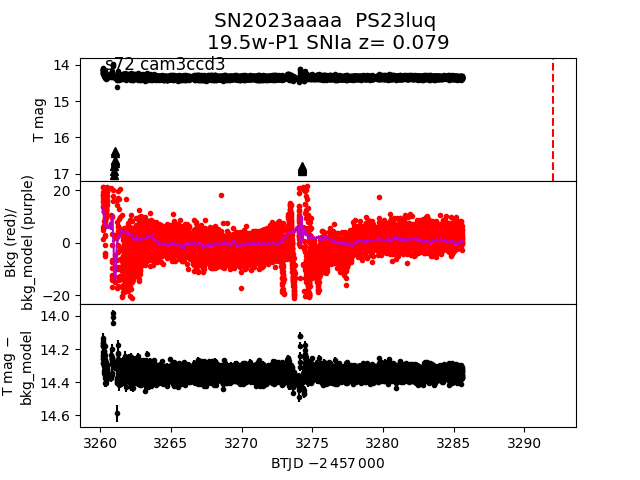
 2023aaaa
 2023zax
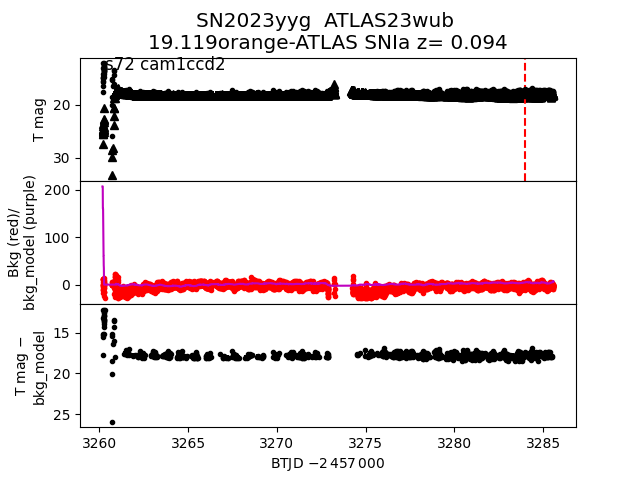
 2023yyg
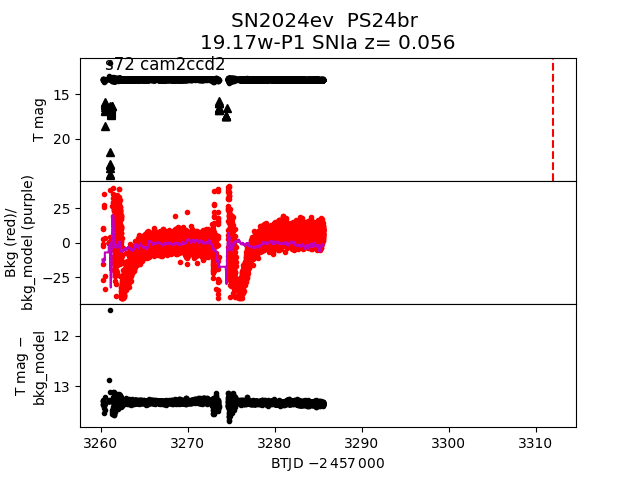
 2024ev
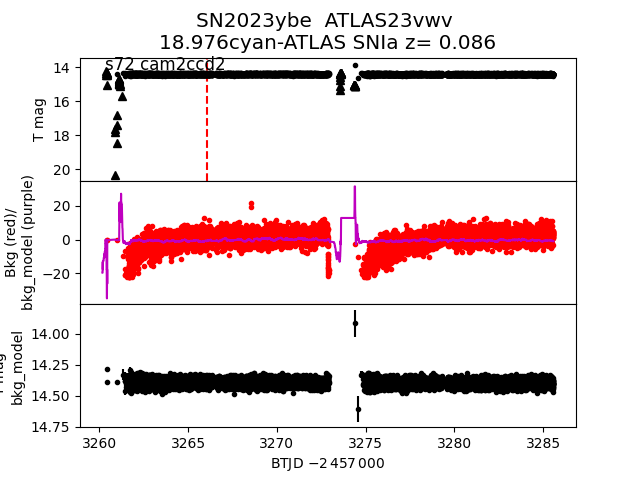
 2023ybe
 2023zno