sector71 supernovae (22 total)
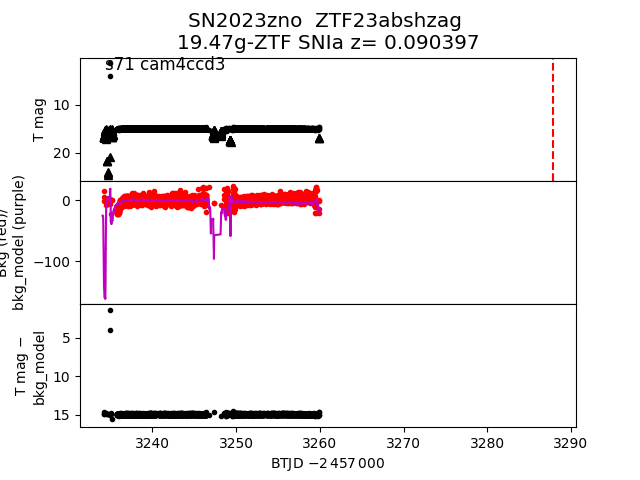
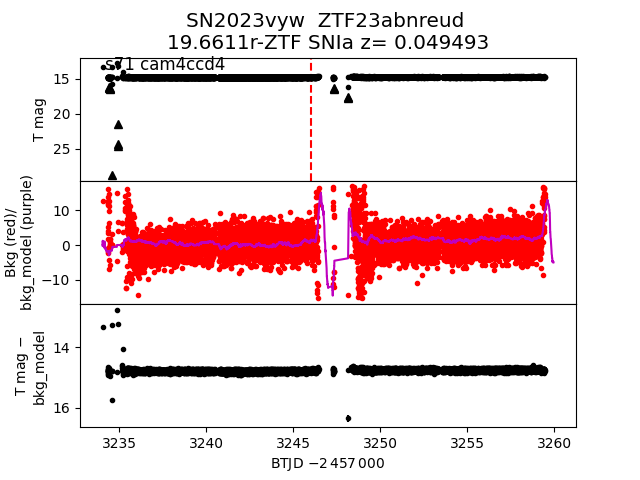
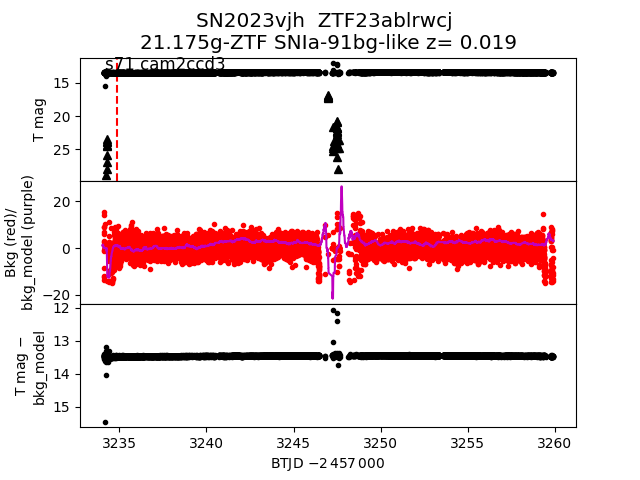
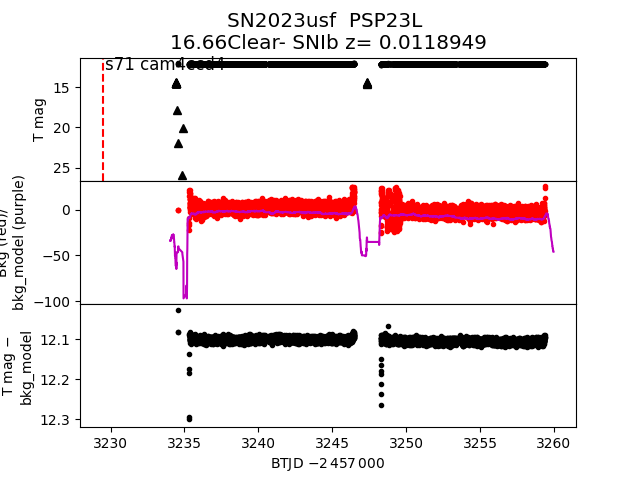
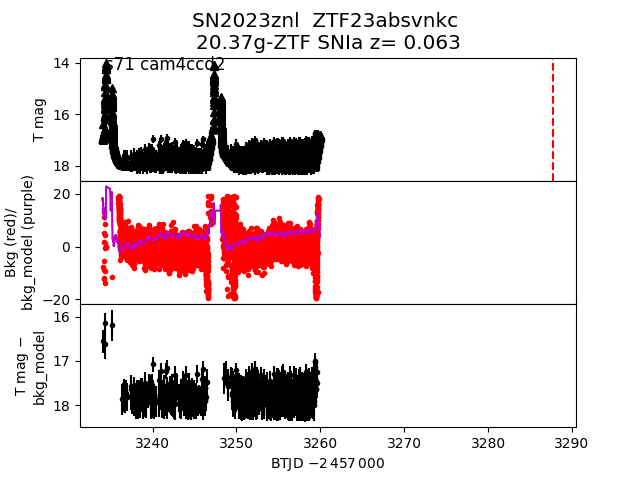
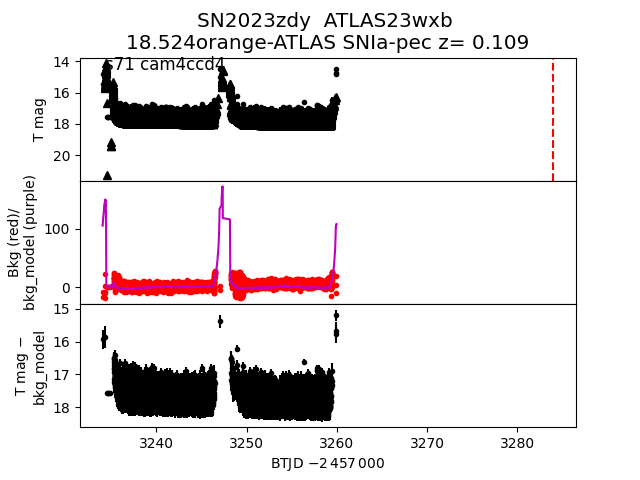
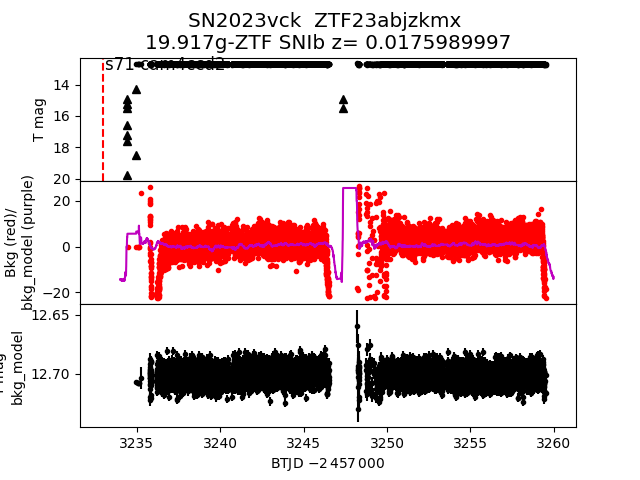
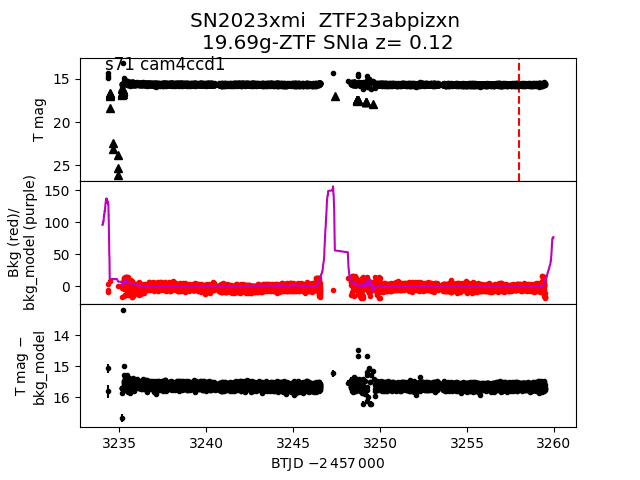
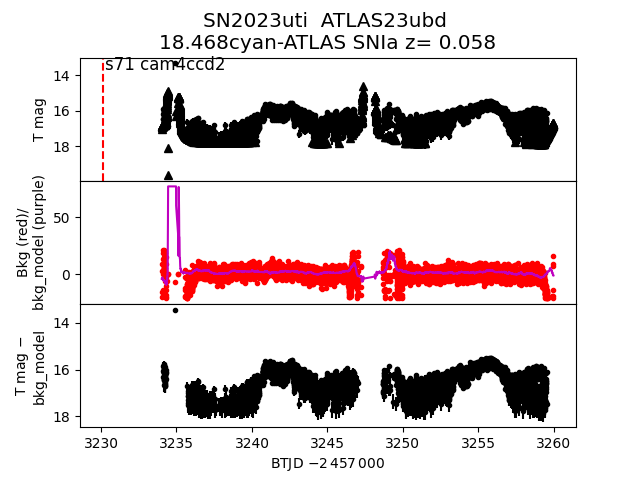
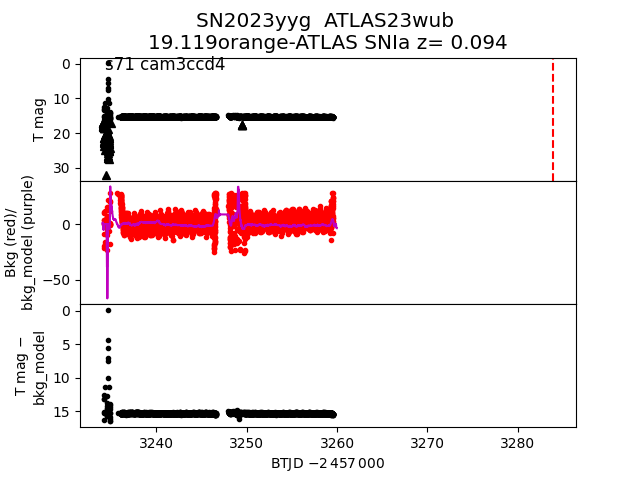
Each figure has three panels. The top panel shows the transient light curve, the middle panel shows the local background (estimated in an annulus), and the bottom panel shows a "background-model corrected" light curve. Details about the background model are in the README.
The vertical red line marks the time of discovery reported to TNS. Other useful metadata from TNS is in the figure title.
Note that the top and bottom panel are in magnitudes, while the middle panel is in differential flux units. The magnitudes are calibrated to the flux in the reference image used for image subtraction. Thus, flux from the host galaxy is included in these magnitudes.
3-sigma upper limits are plotted as triangles with no errorbars. A typical limiting magnitude is 19.6 in 30 minutes or 18.4 in 200 seconds (for low backgrounds).
The links allow you to download the light curve data as a text file.
More details in the README.
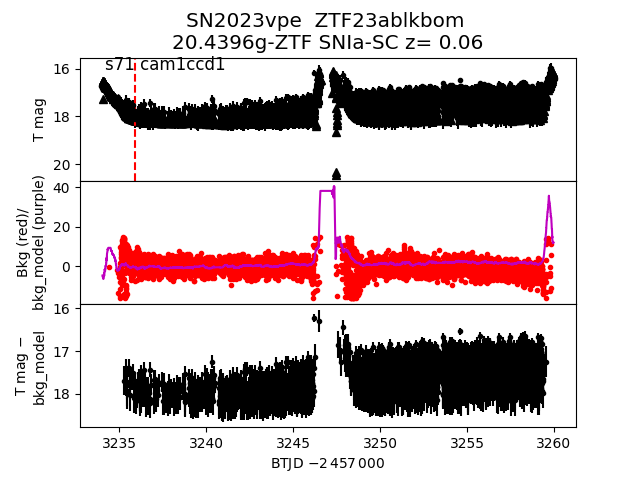
2023vpe
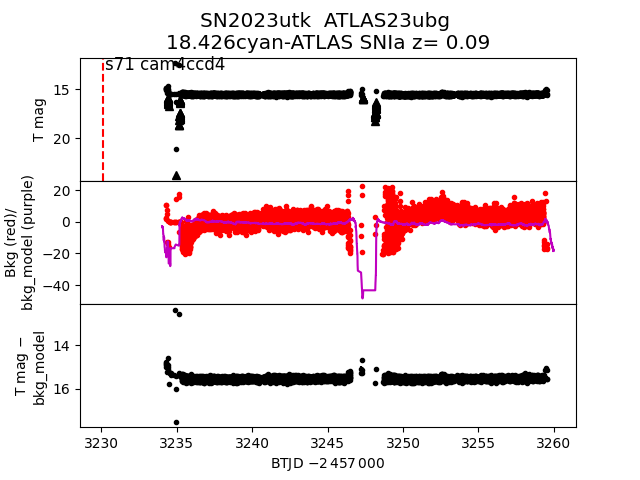
 2023utk
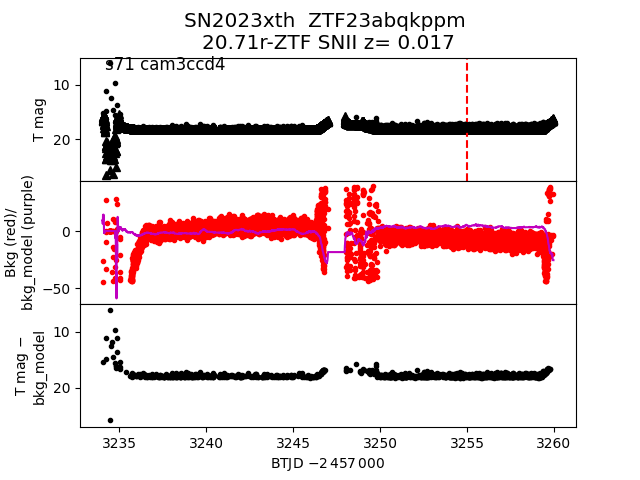
 2023xth
 2023vyw
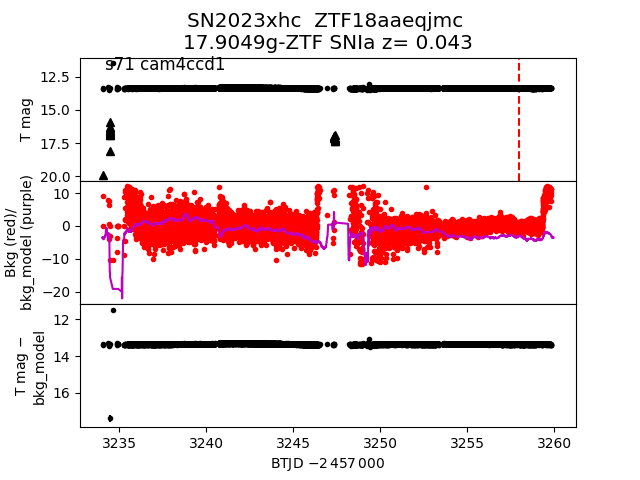
 2023xhc
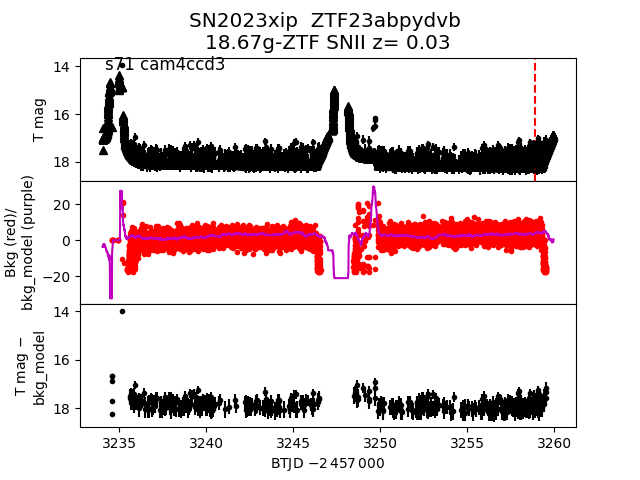
 2023xip
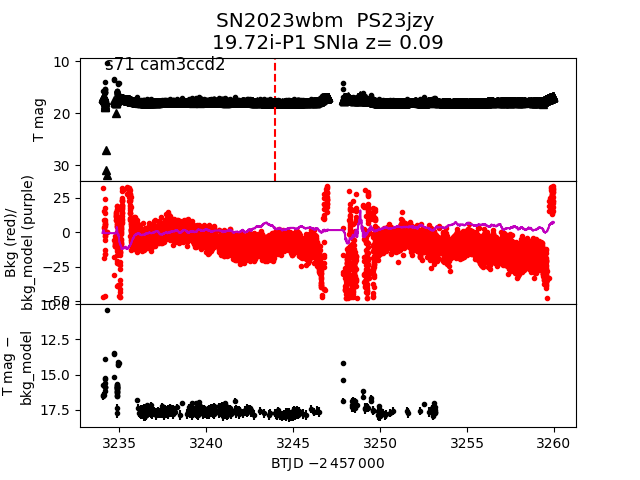
 2023wbm
 2023vjh
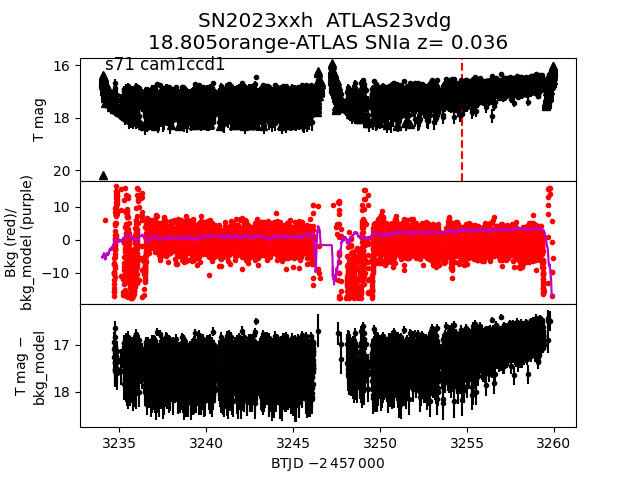
 2023xxh
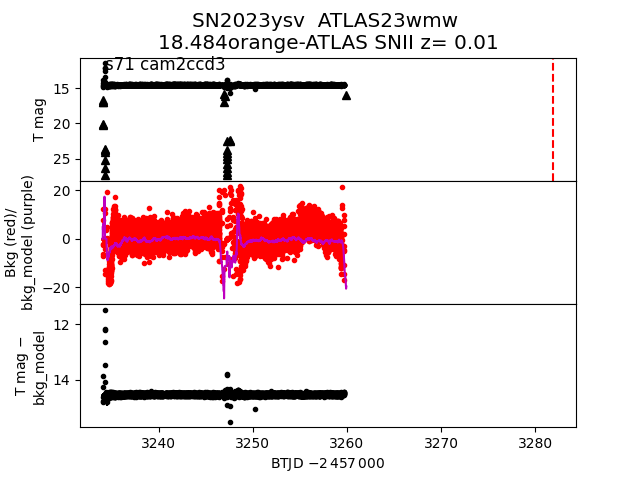
 2023ysv
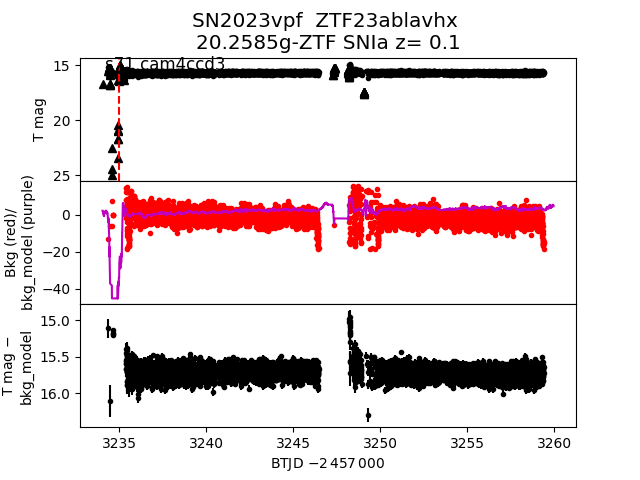
 2023vpf
 2023usf
 2023znl
 2023zdy
 2023vck
 2023xmi
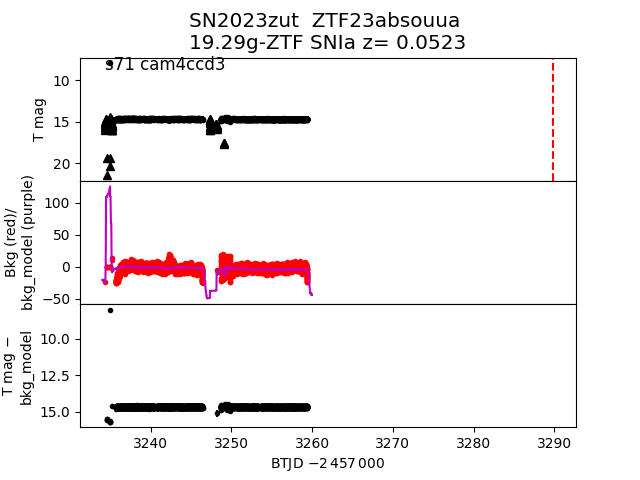
 2023zut
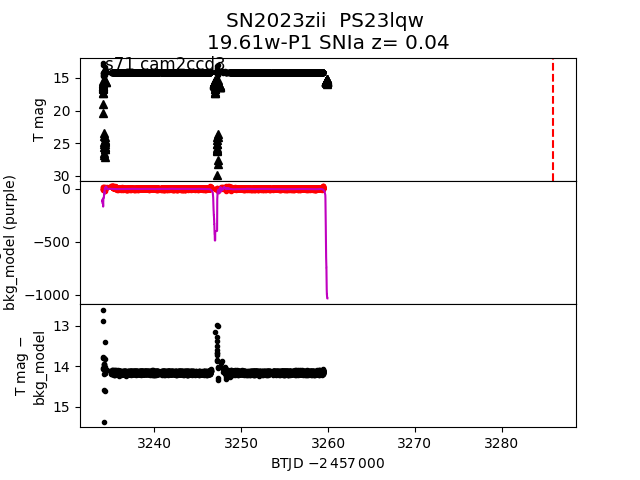
 2023zii
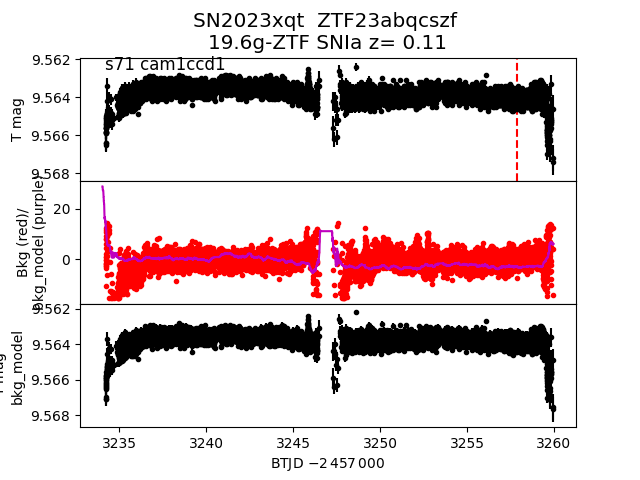
 2023xqt
 2023uti
 2023yyg
 2023zno