sector70 supernovae (30 total)
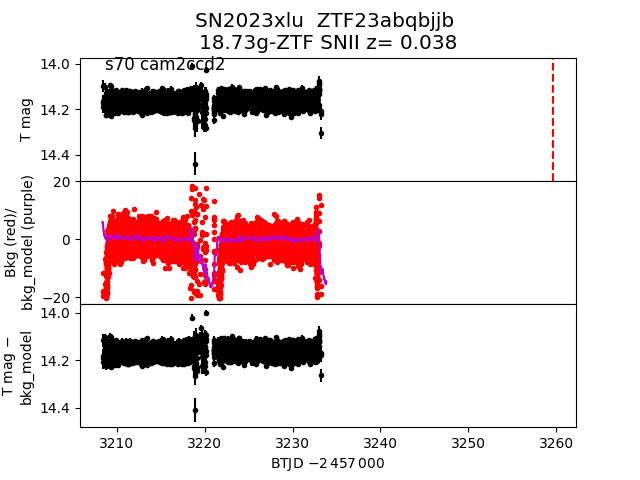
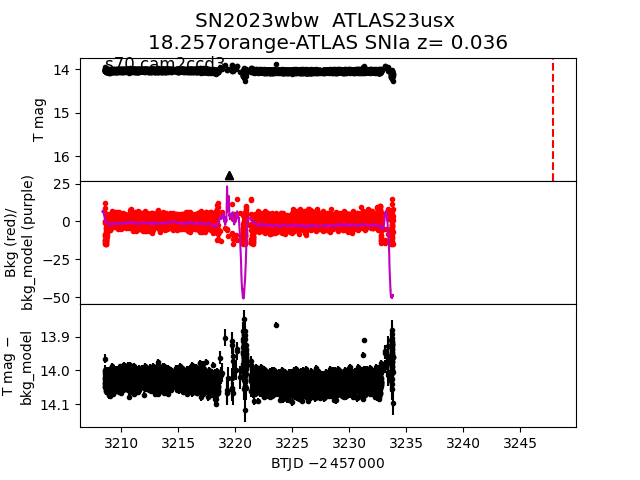
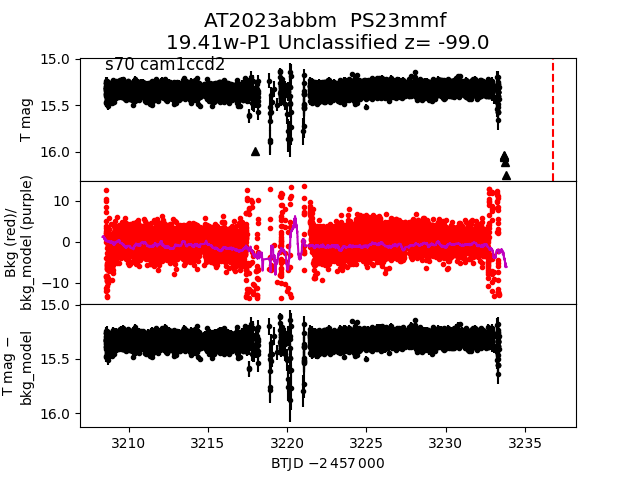
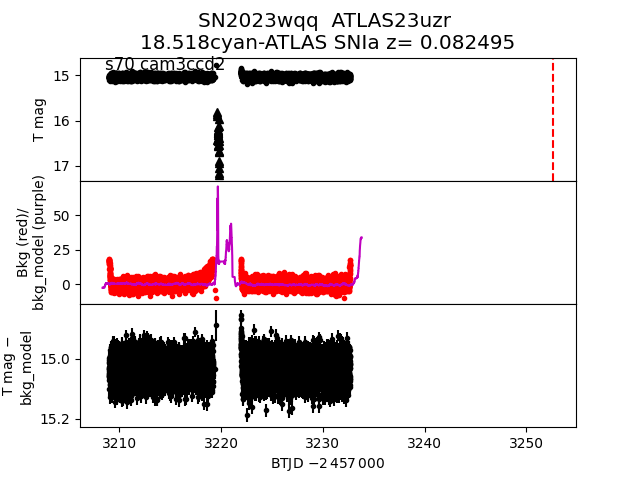
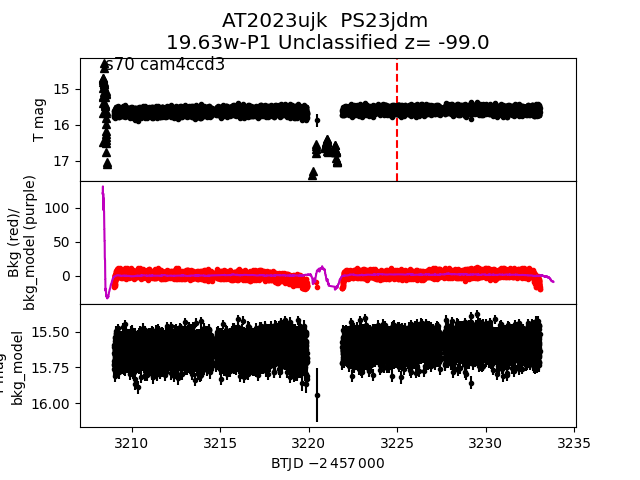
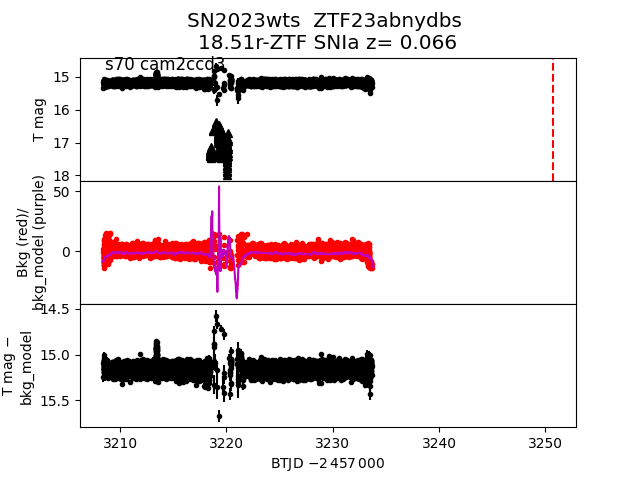
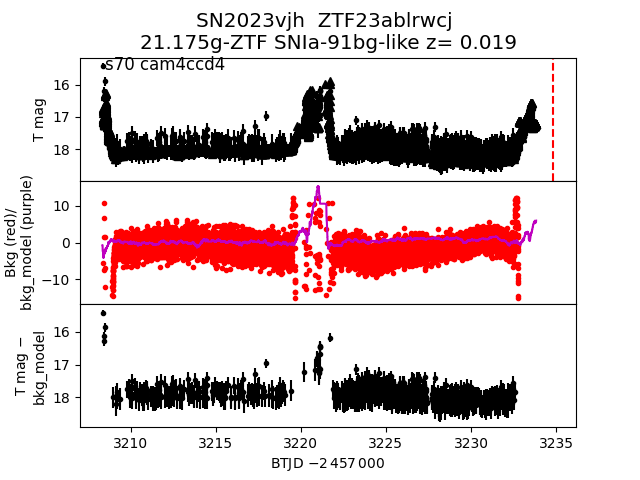
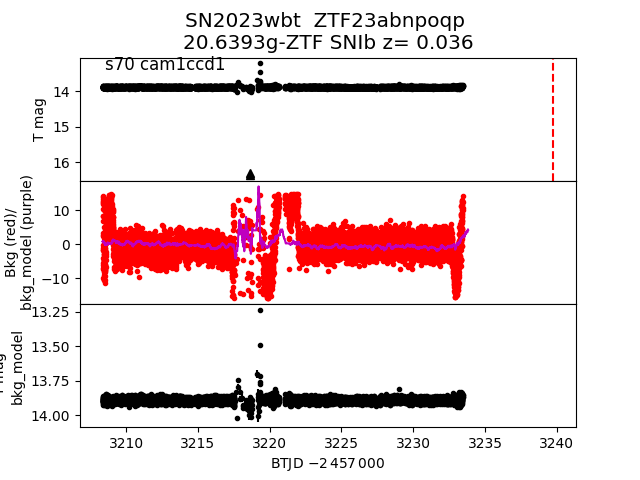
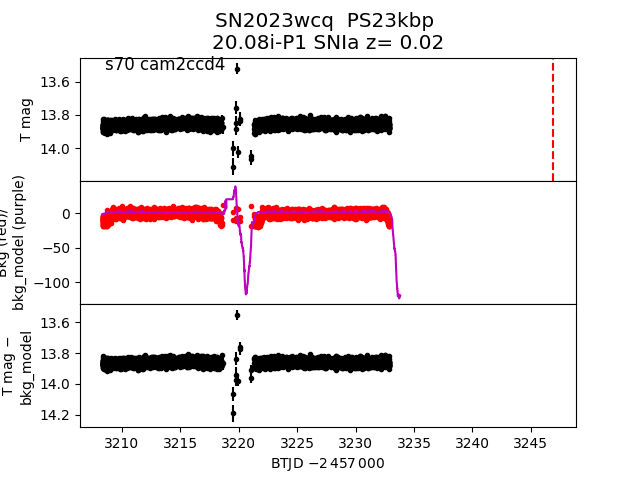
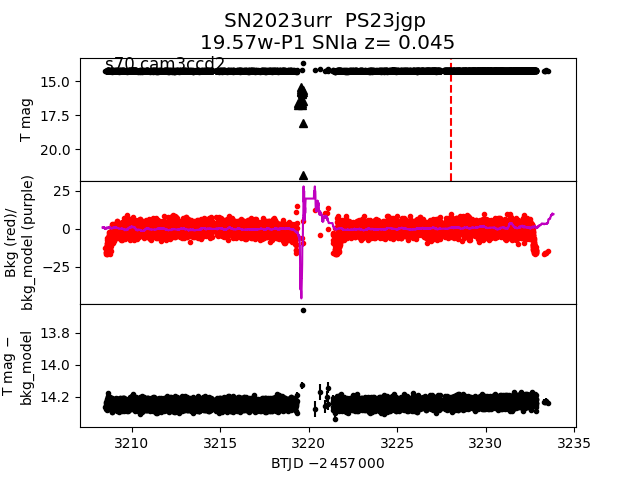
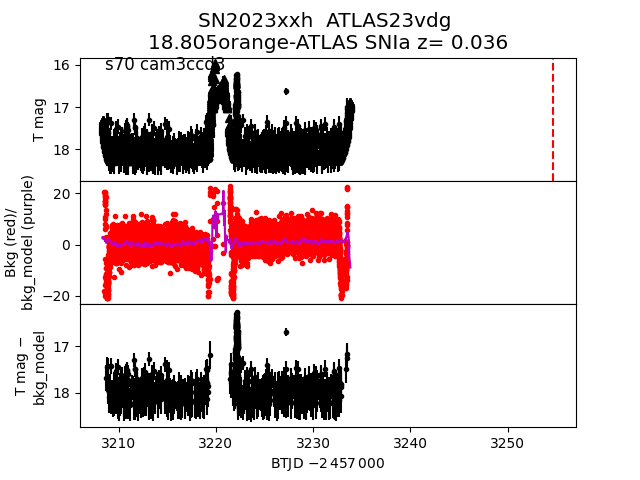
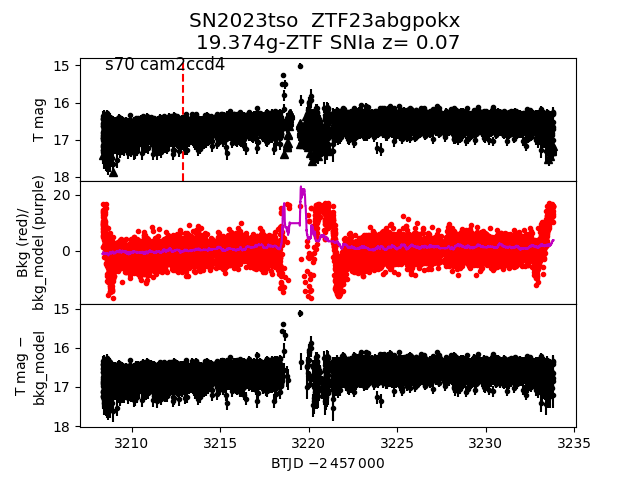
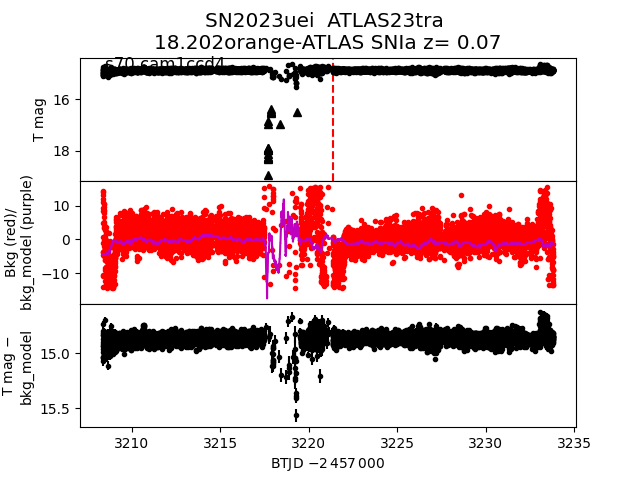
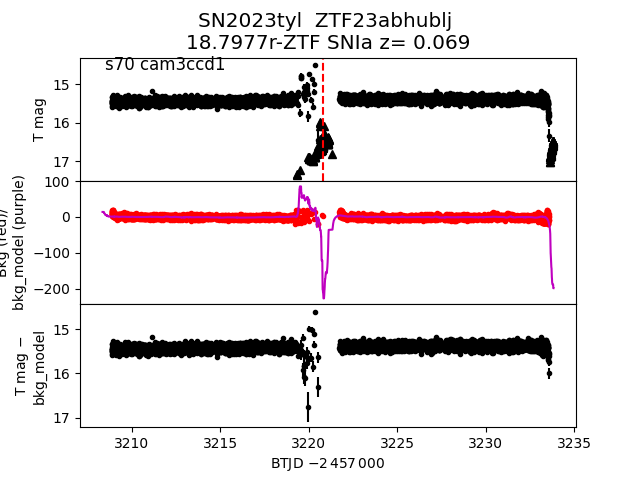
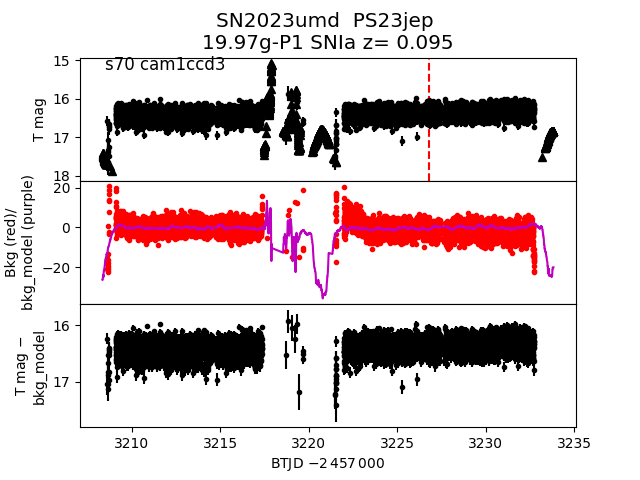
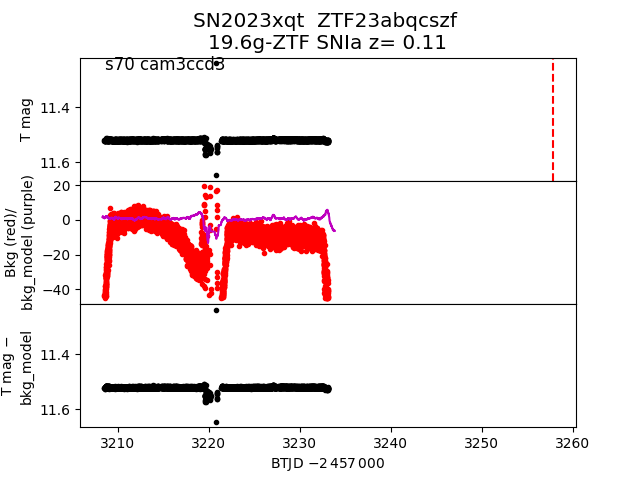
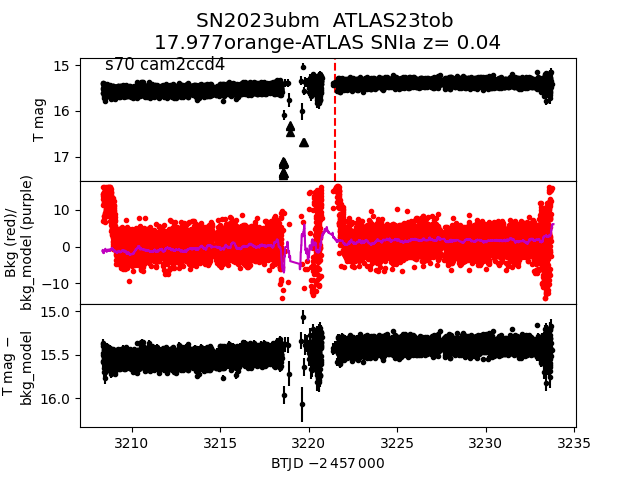
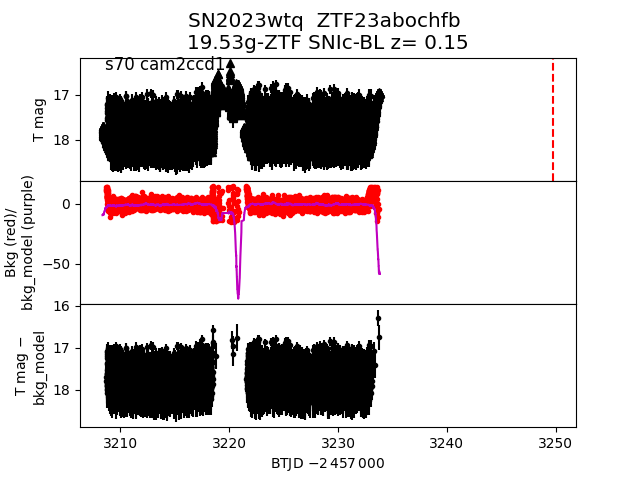
Each figure has three panels. The top panel shows the transient light curve, the middle panel shows the local background (estimated in an annulus), and the bottom panel shows a "background-model corrected" light curve. Details about the background model are in the README.
The vertical red line marks the time of discovery reported to TNS. Other useful metadata from TNS is in the figure title.
Note that the top and bottom panel are in magnitudes, while the middle panel is in differential flux units. The magnitudes are calibrated to the flux in the reference image used for image subtraction. Thus, flux from the host galaxy is included in these magnitudes.
3-sigma upper limits are plotted as triangles with no errorbars. A typical limiting magnitude is 19.6 in 30 minutes or 18.4 in 200 seconds (for low backgrounds).
The links allow you to download the light curve data as a text file.
More details in the README.
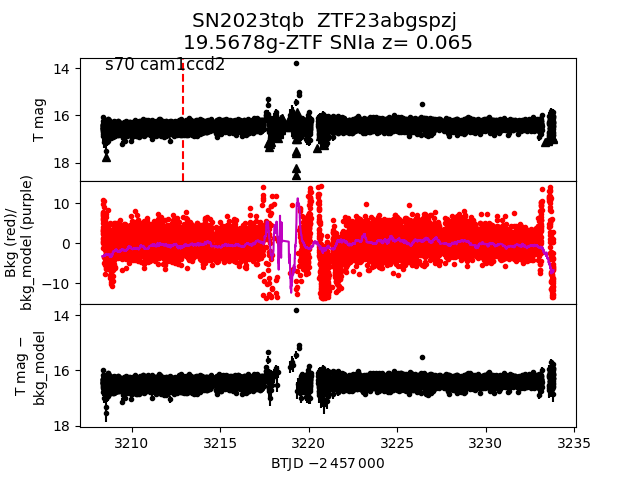
2023tqb
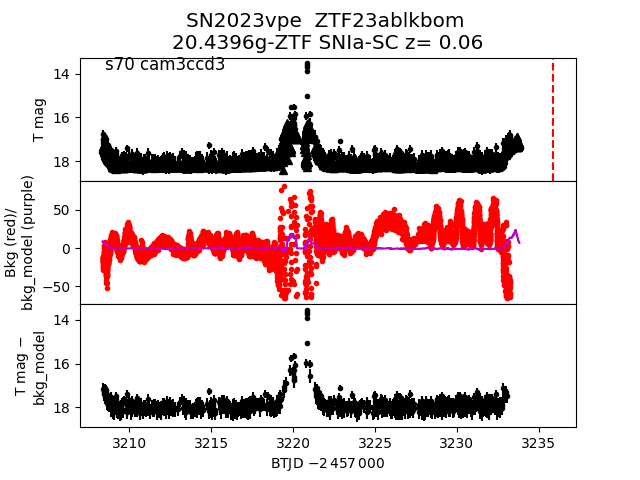
 2023vpe
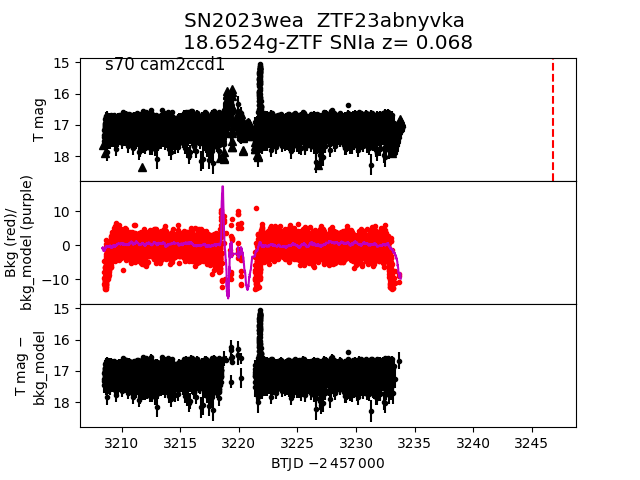
 2023wea
 2023wbw
 2023abbm
 2023wqq
 2023ujk
 2023wts
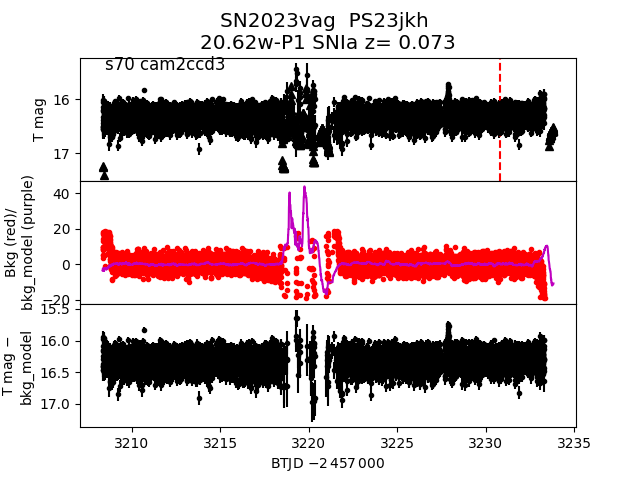
 2023vag
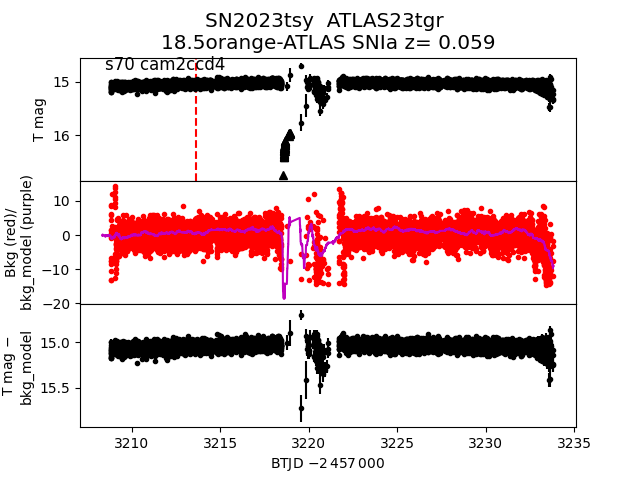
 2023tsy
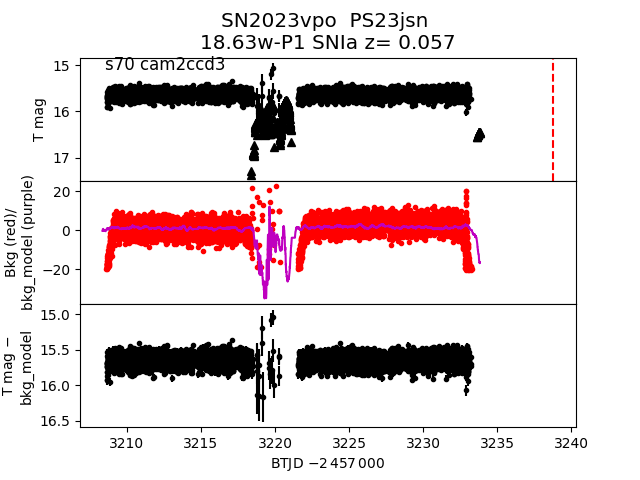
 2023vpo
 2023vjh
 2023wbt
 2023wcq
 2023urr
 2023xxh
 2023tso
 2023uei
 2023tyl
 2023umd
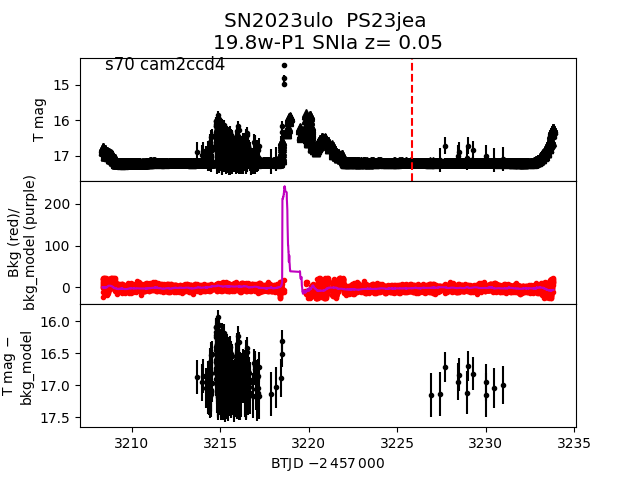
 2023ulo
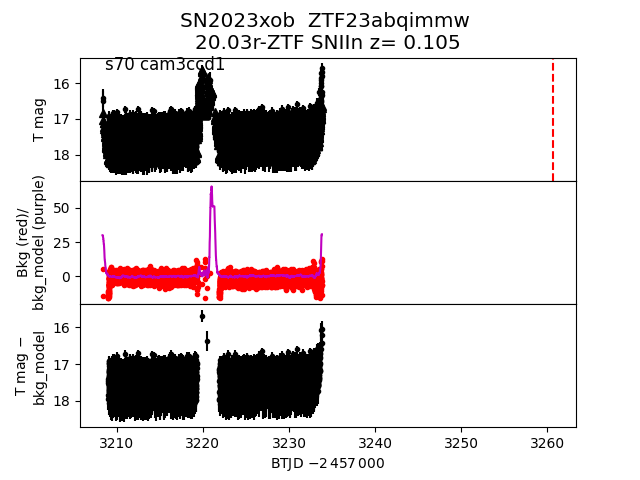
 2023xob
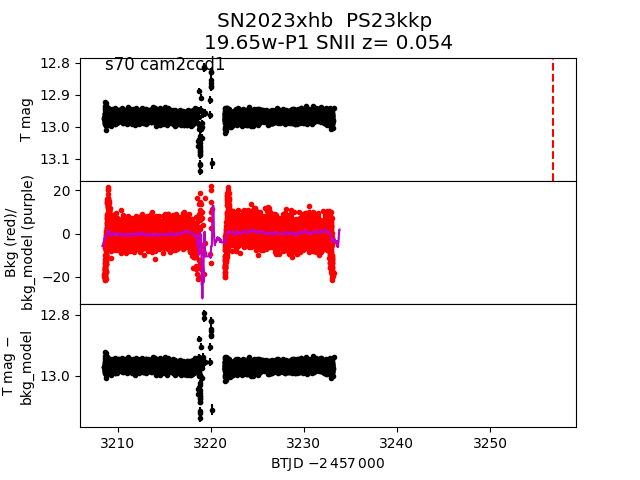
 2023xhb
 2023xqt
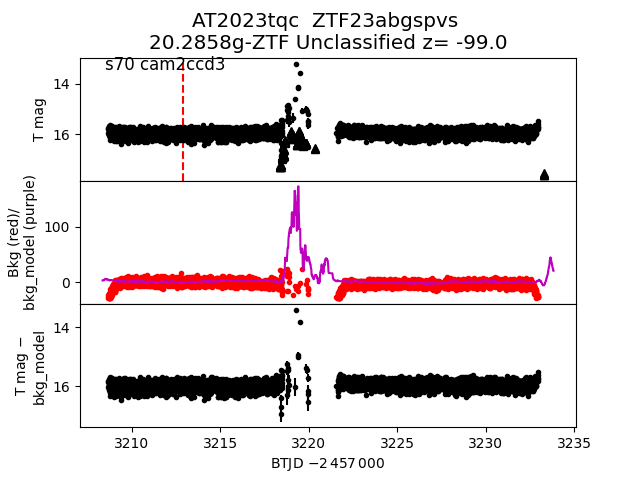
 2023tqc
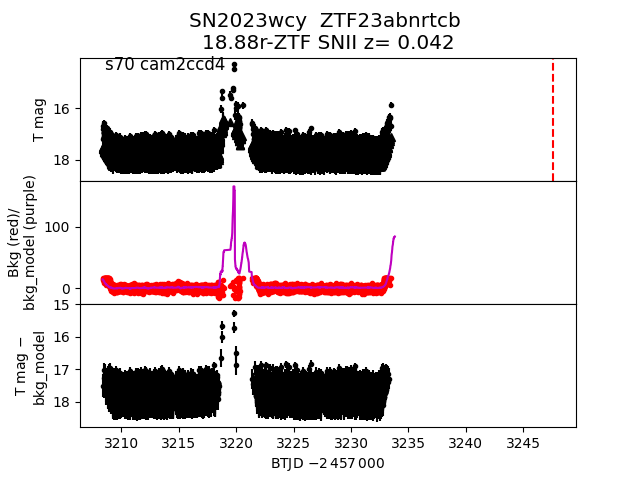
 2023wcy
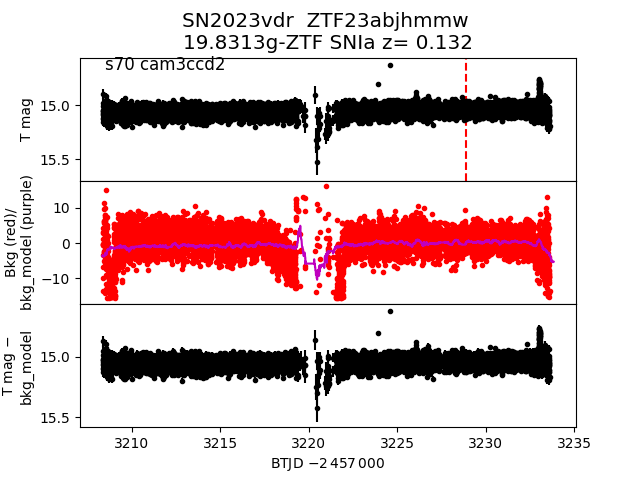
 2023vdr
 2023ubm
 2023wtq
 2023xlu