sector69 supernovae (28 total)
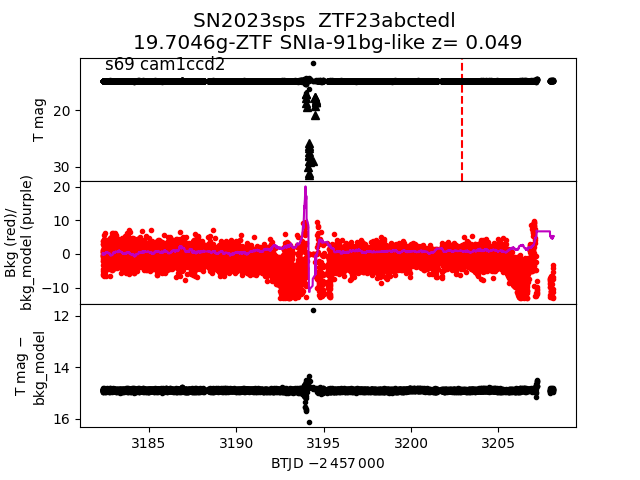
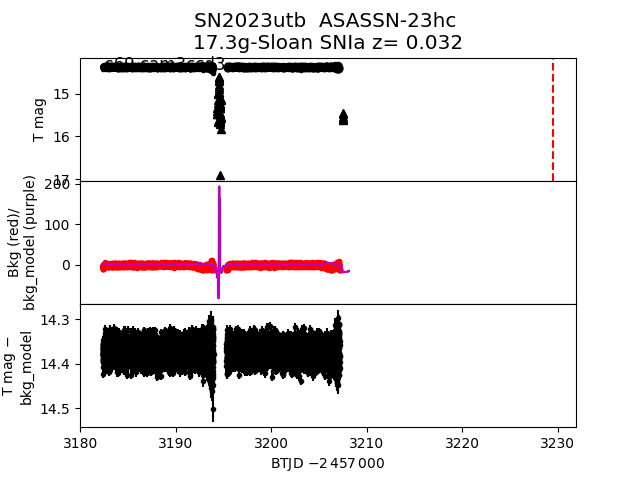
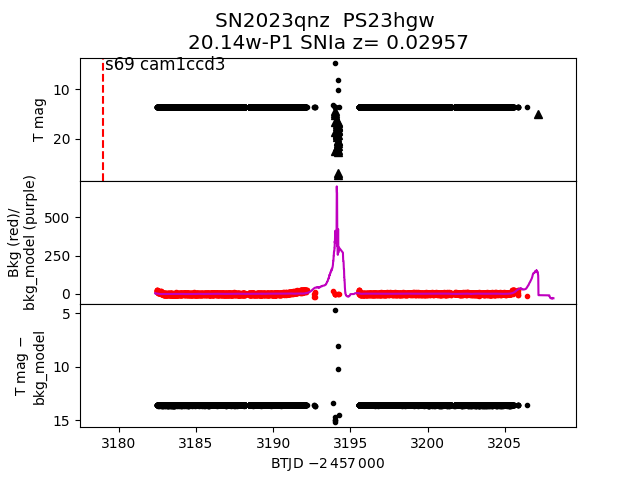
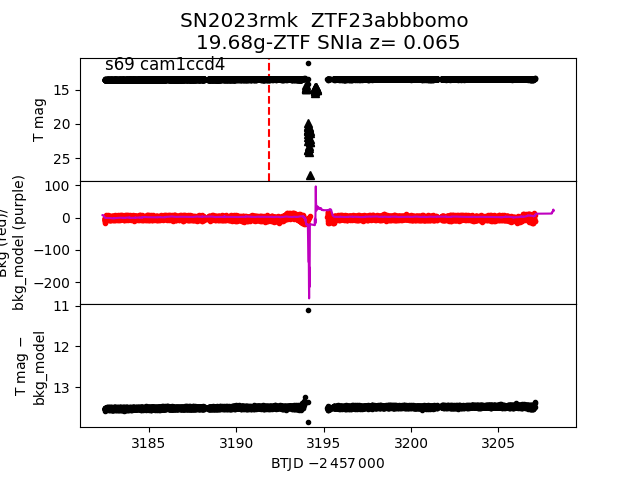
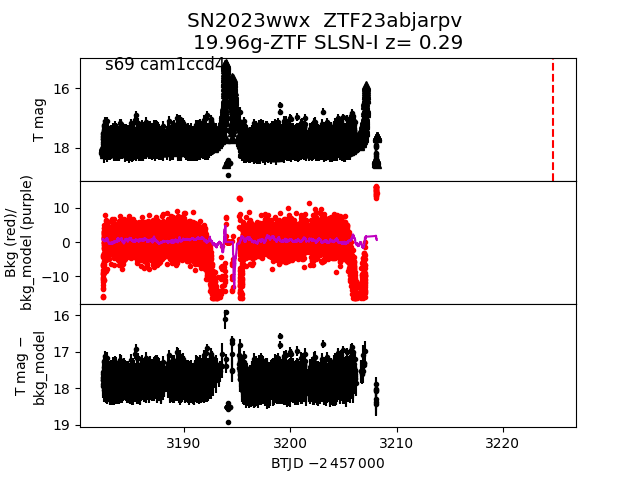
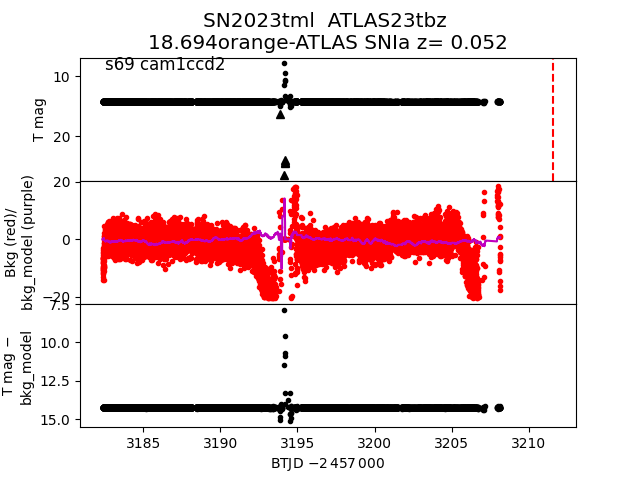
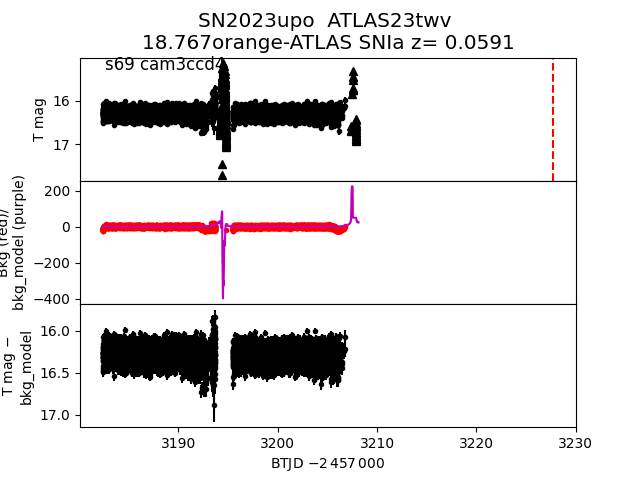
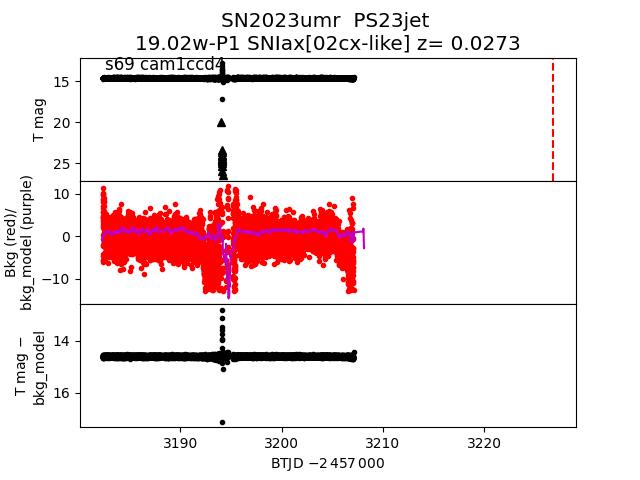
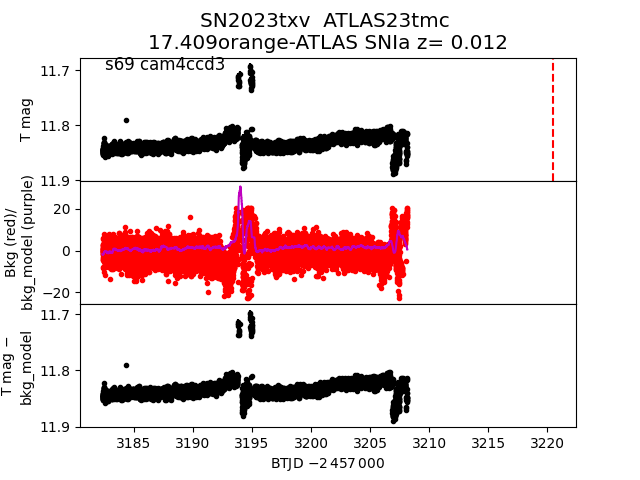
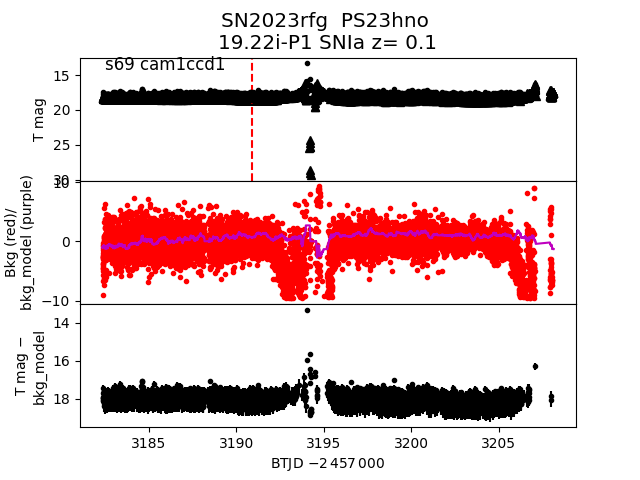
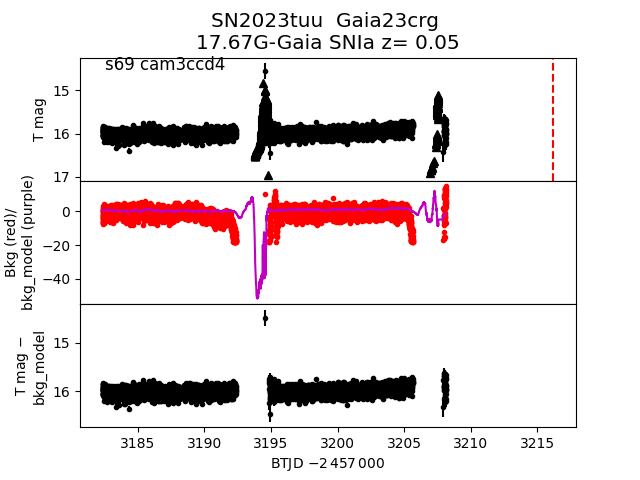
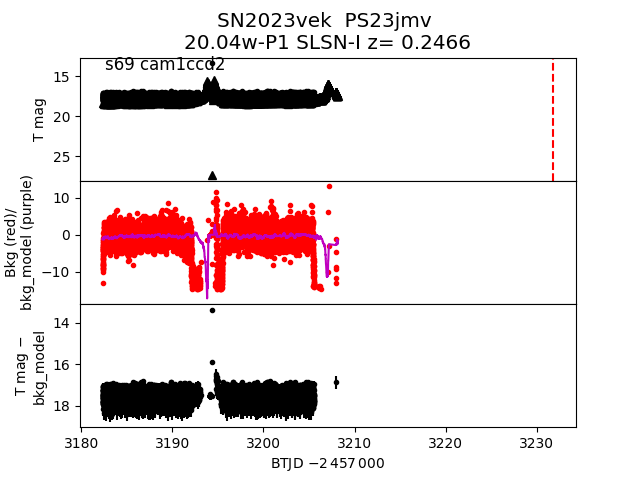
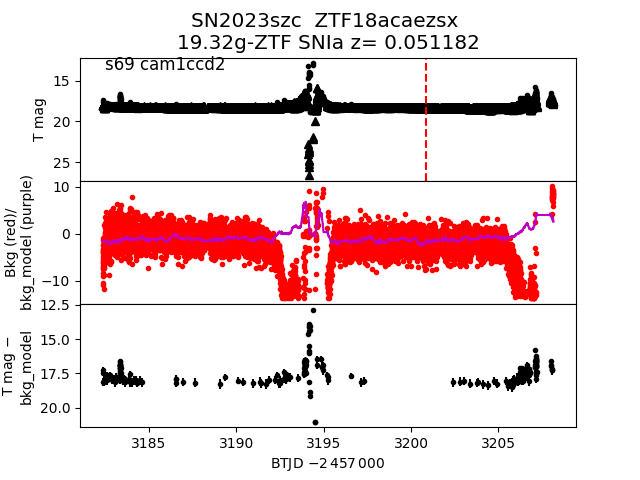
Each figure has three panels. The top panel shows the transient light curve, the middle panel shows the local background (estimated in an annulus), and the bottom panel shows a "background-model corrected" light curve. Details about the background model are in the README.
The vertical red line marks the time of discovery reported to TNS. Other useful metadata from TNS is in the figure title.
Note that the top and bottom panel are in magnitudes, while the middle panel is in differential flux units. The magnitudes are calibrated to the flux in the reference image used for image subtraction. Thus, flux from the host galaxy is included in these magnitudes.
3-sigma upper limits are plotted as triangles with no errorbars. A typical limiting magnitude is 19.6 in 30 minutes or 18.4 in 200 seconds (for low backgrounds).
The links allow you to download the light curve data as a text file.
More details in the README.
2023utb
 2023qnz
 2023rmk
 2023wwx
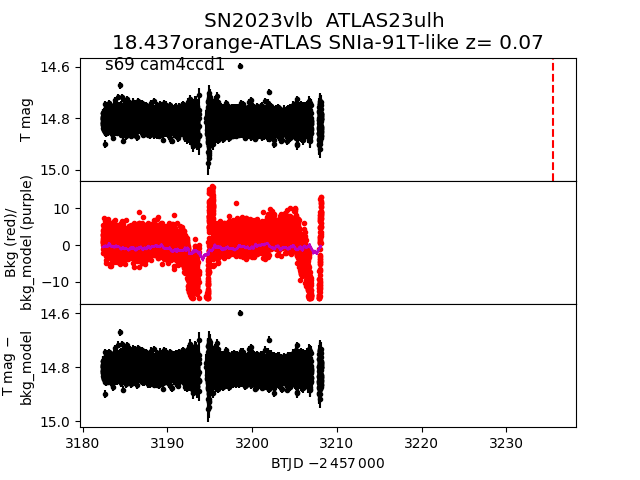
 2023vlb
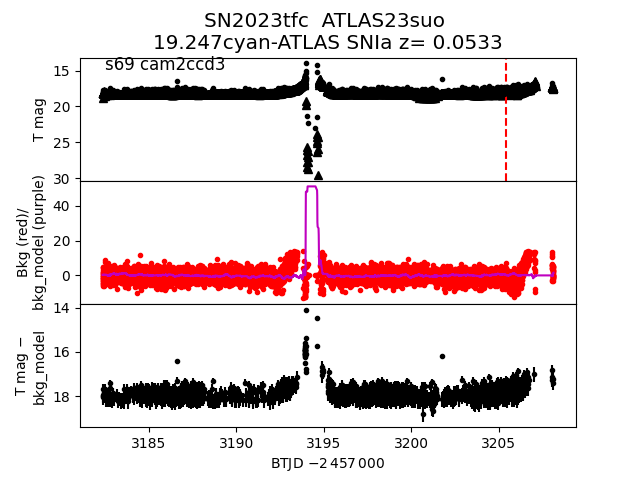
 2023tfc
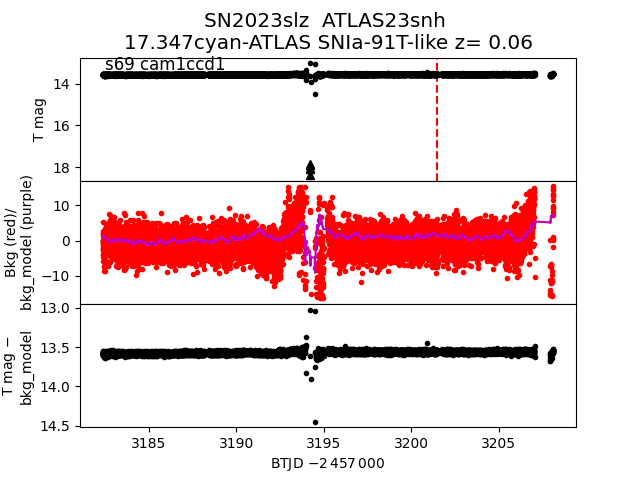
 2023slz
 2023tml
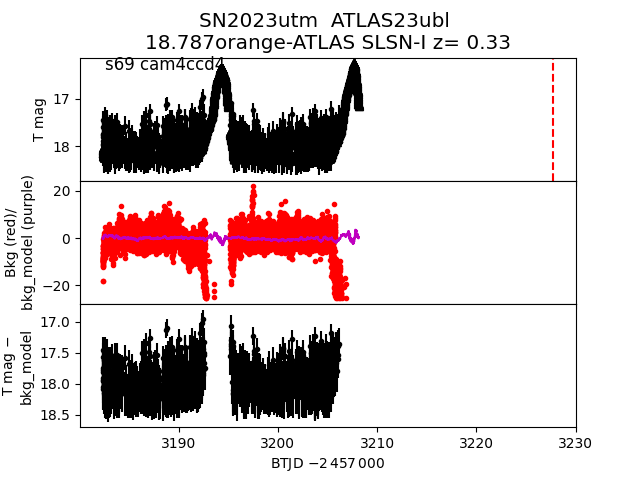
 2023utm
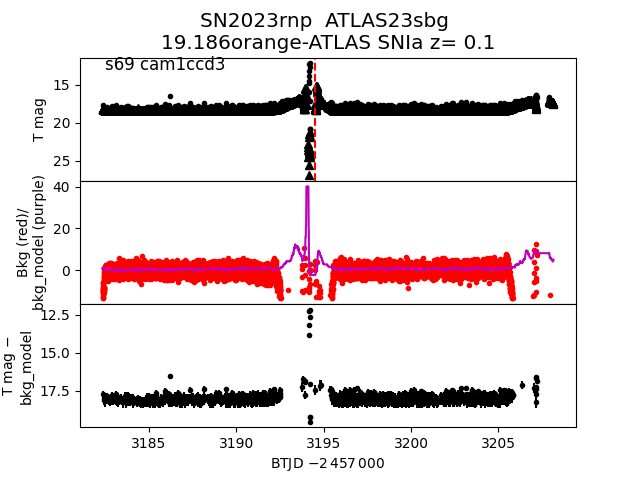
 2023rnp
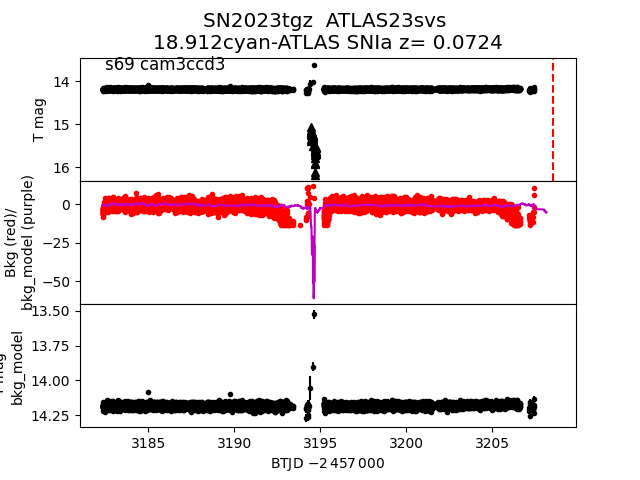
 2023tgz
 2023upo
 2023umr
 2023txv
 2023rfg
 2023tuu
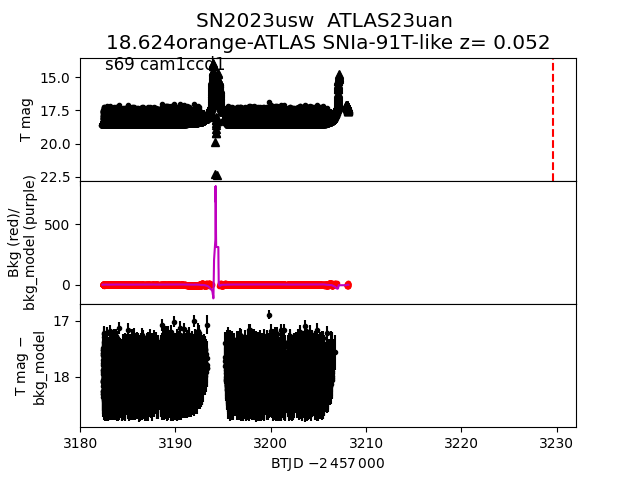
 2023usw
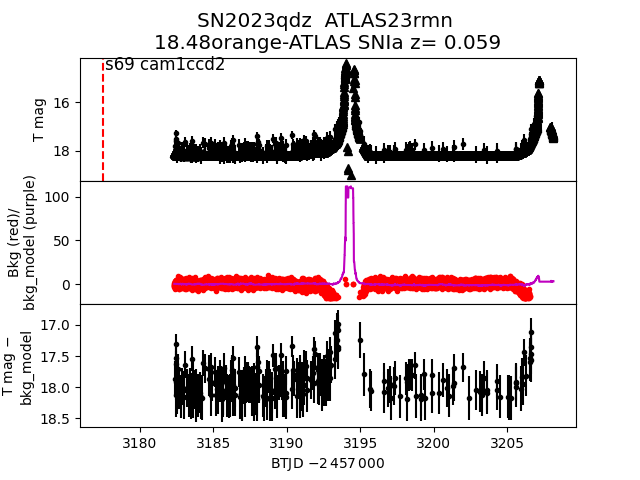
 2023qdz
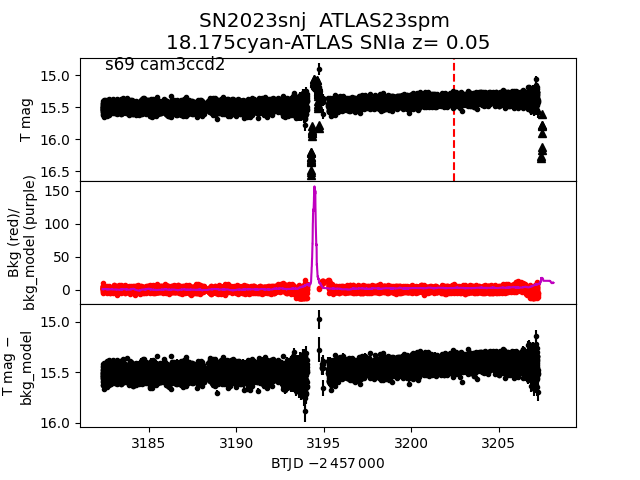
 2023snj
 2023vek
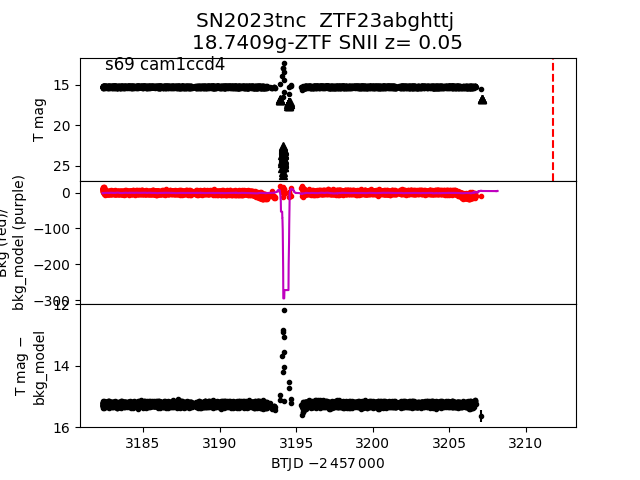
 2023tnc
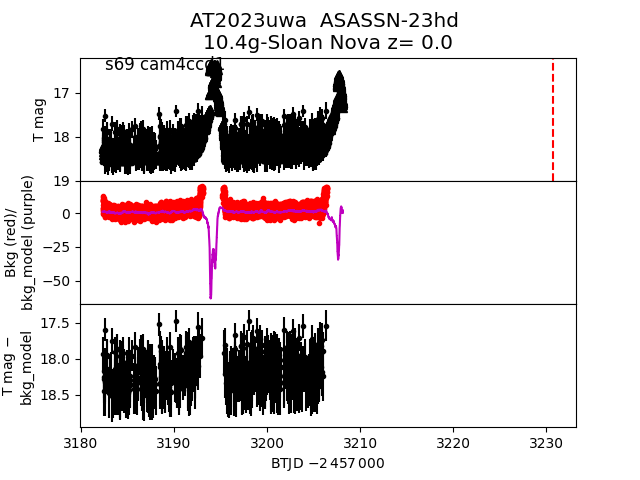
 2023uwa
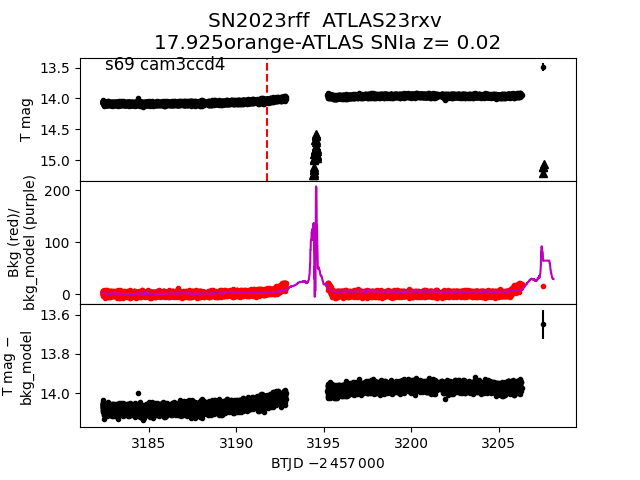
 2023rff
 2023szc
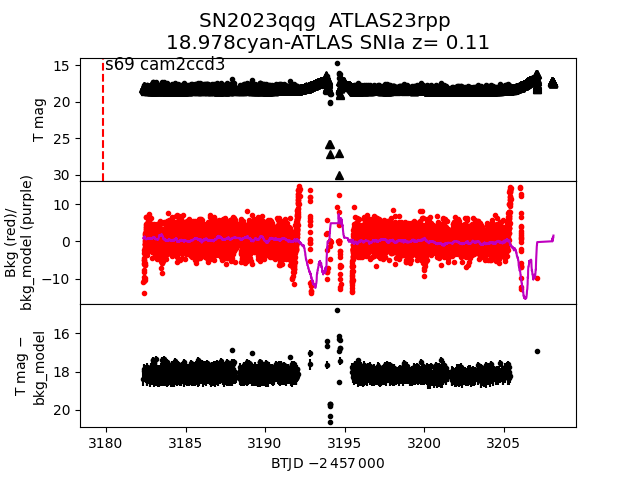
 2023qqg
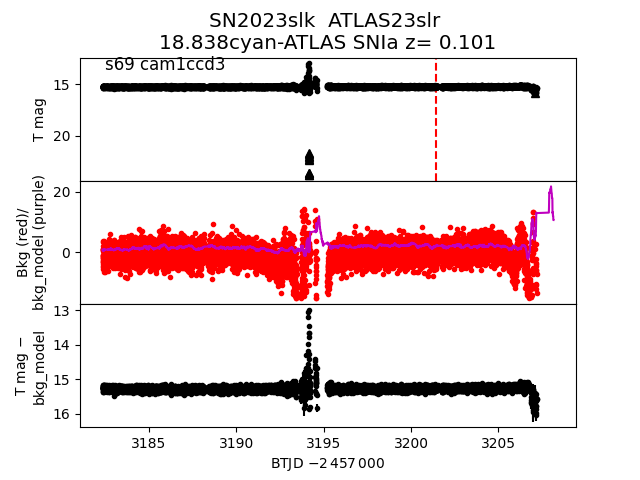
 2023slk
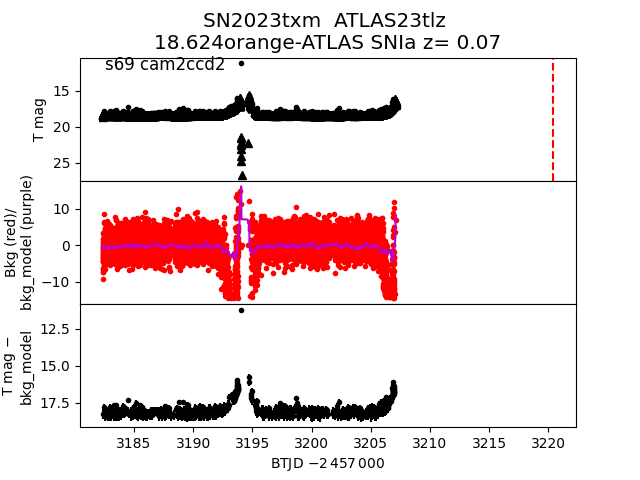
 2023txm
 2023sps