all transients in sector67 (66 total)
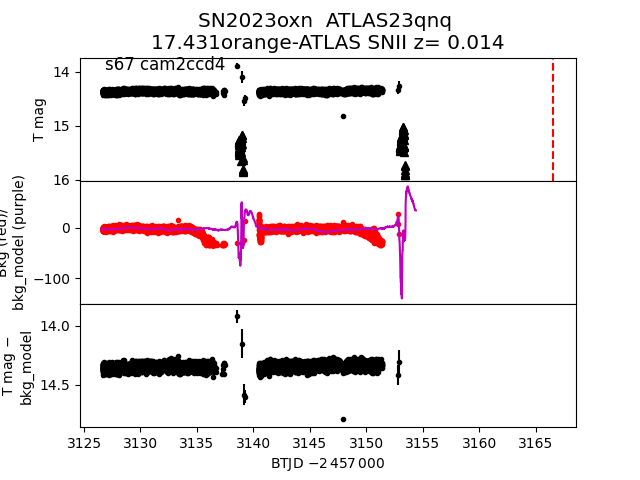
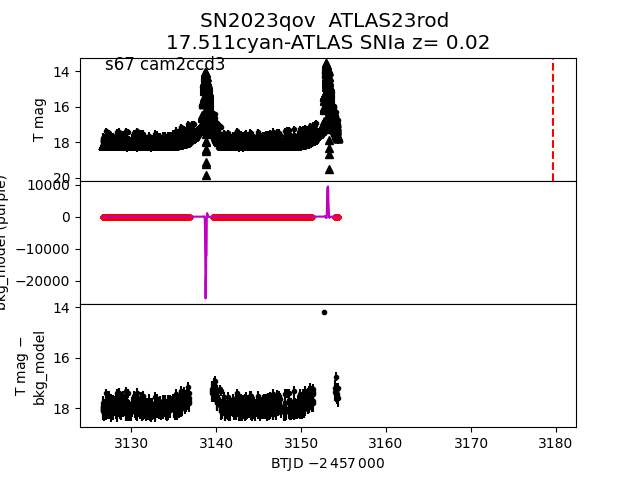
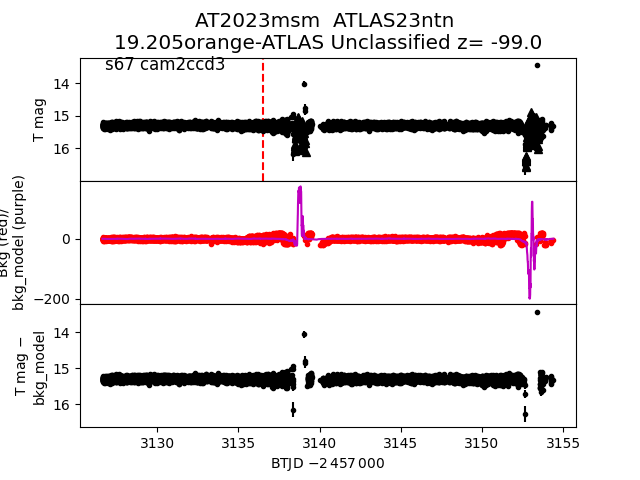
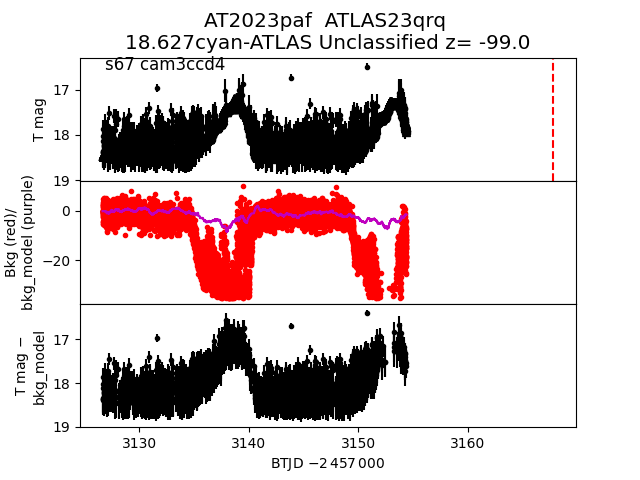
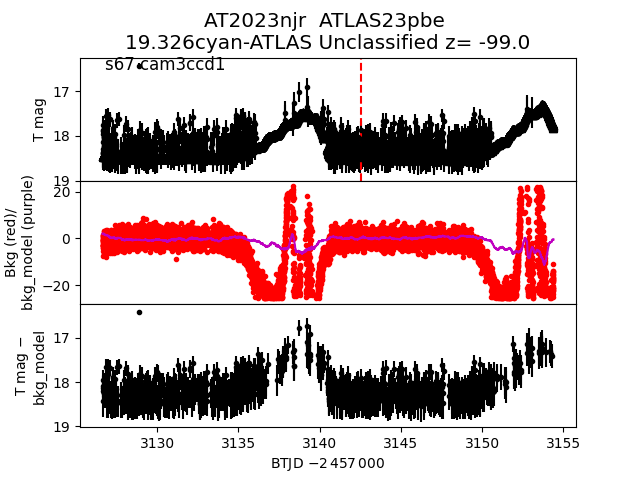
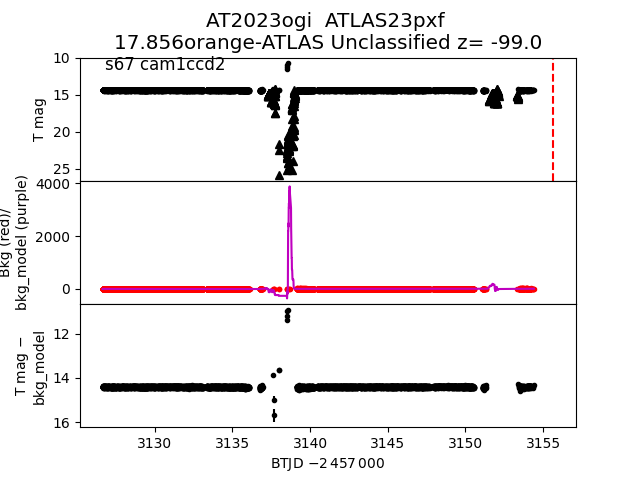
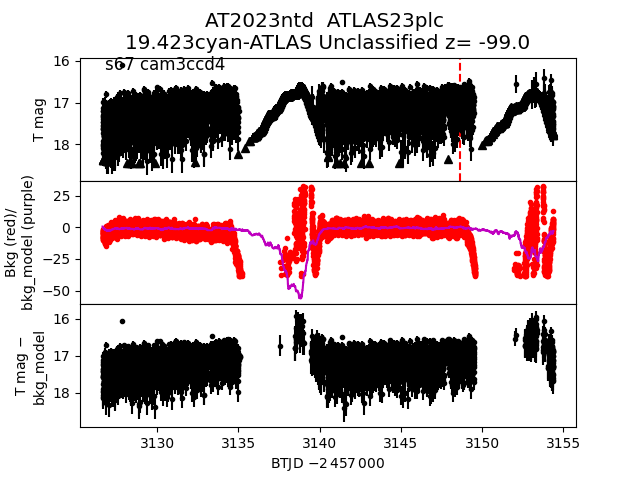
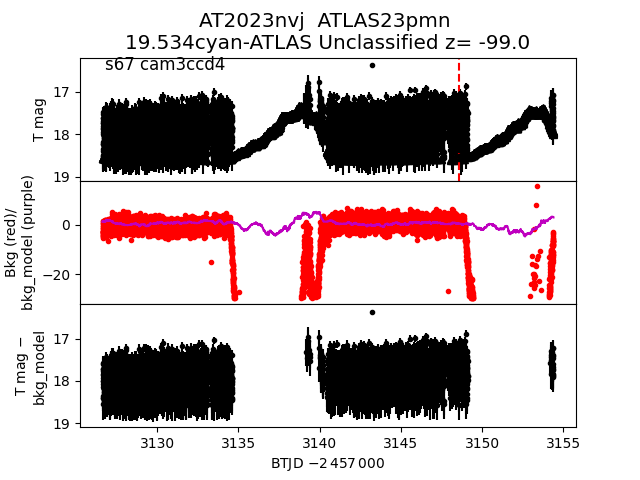
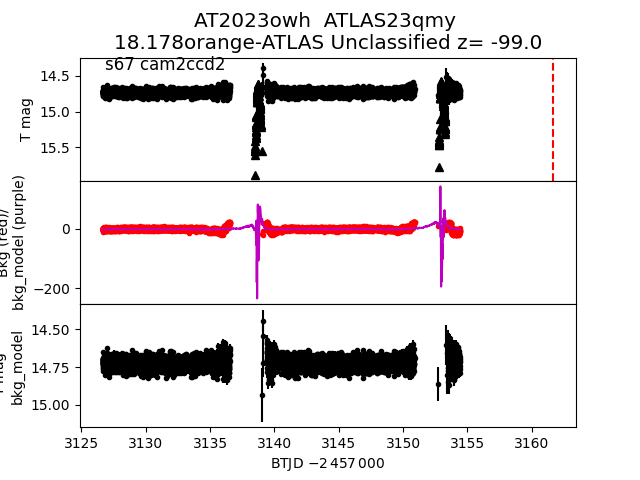
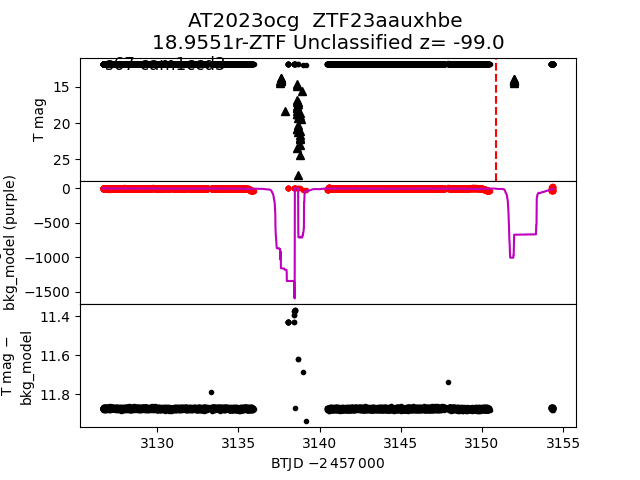
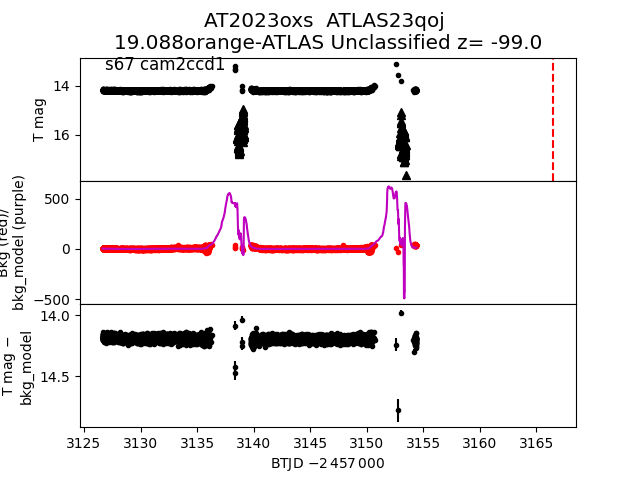
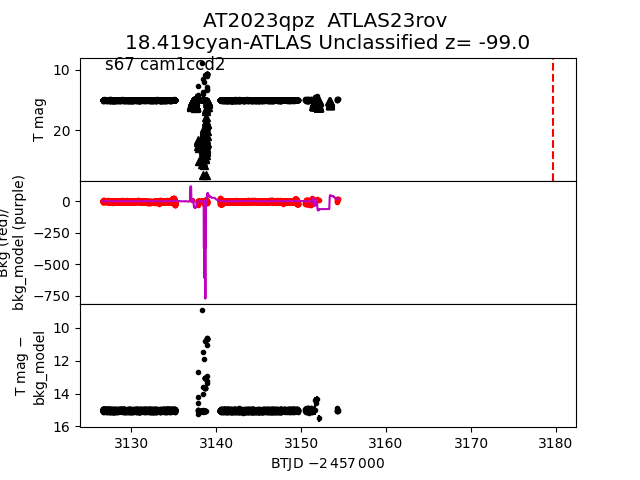
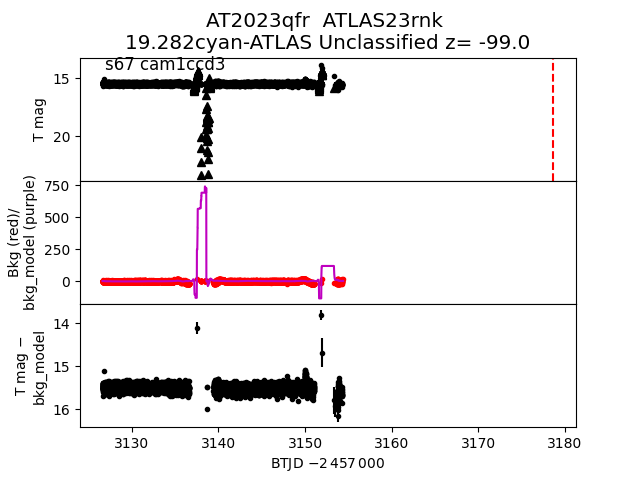
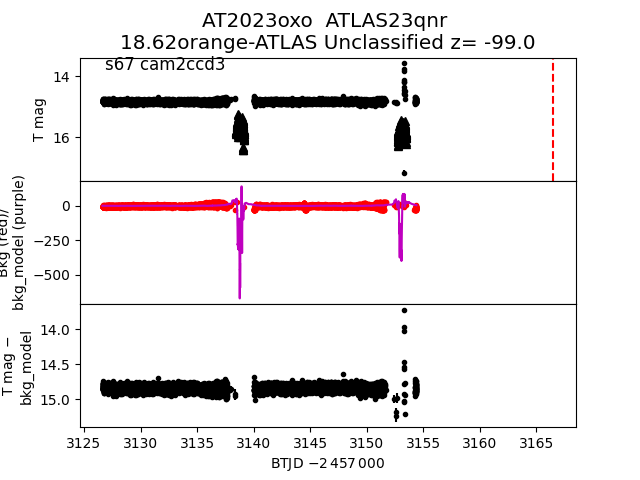
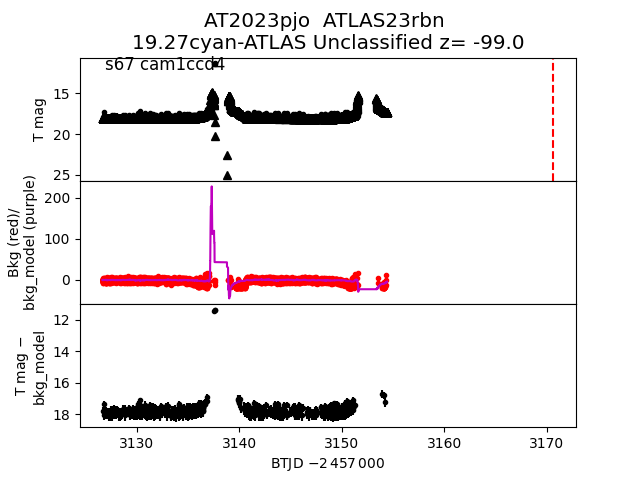
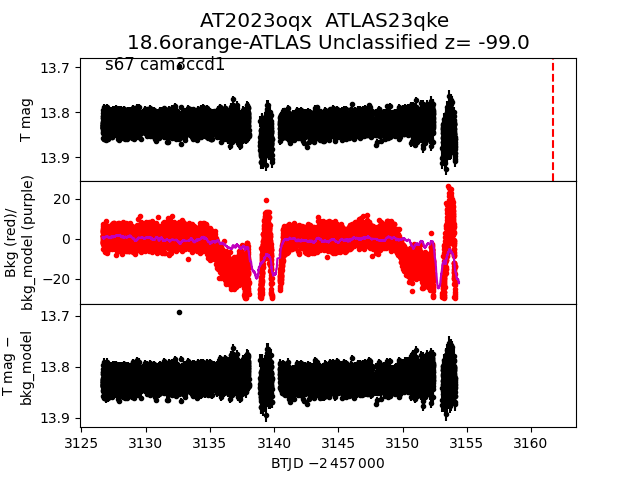
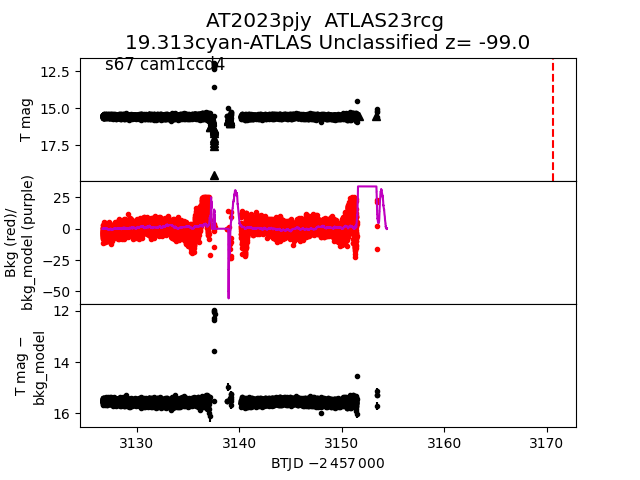
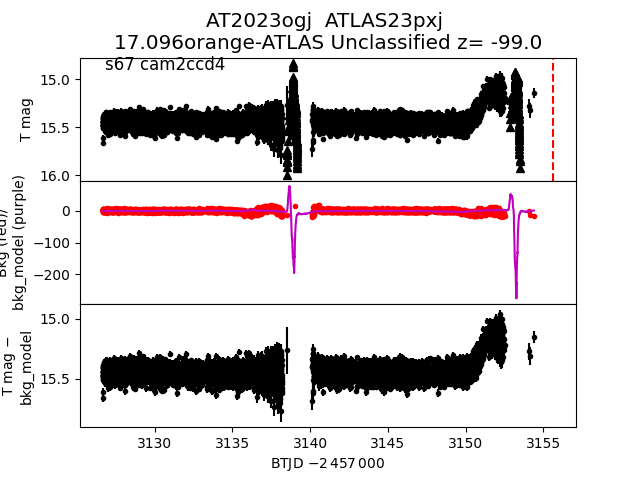
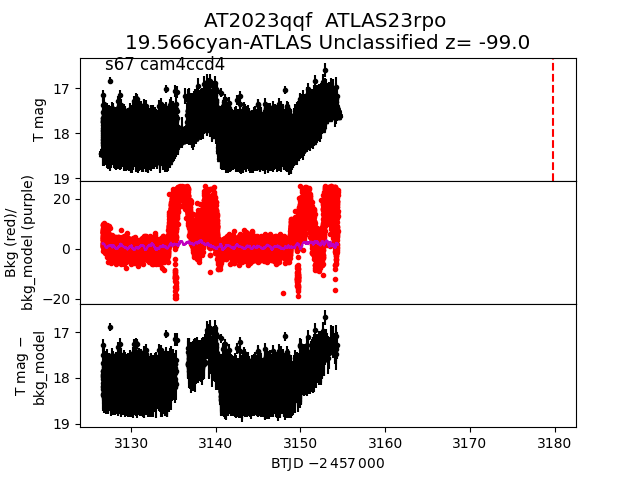
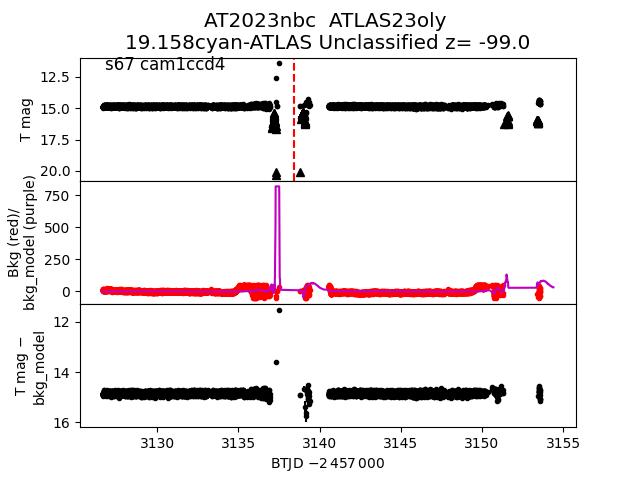
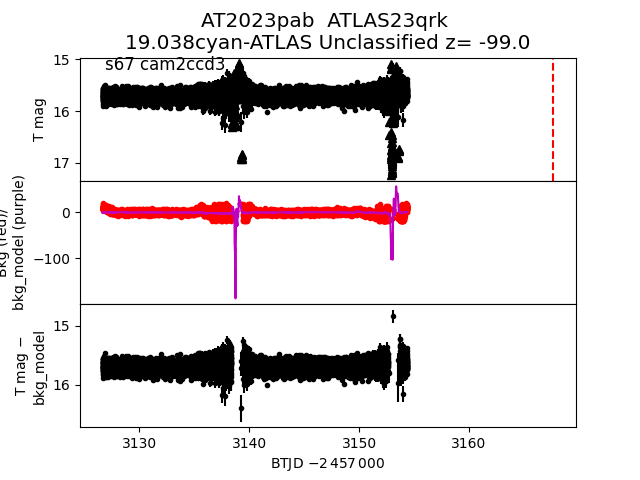
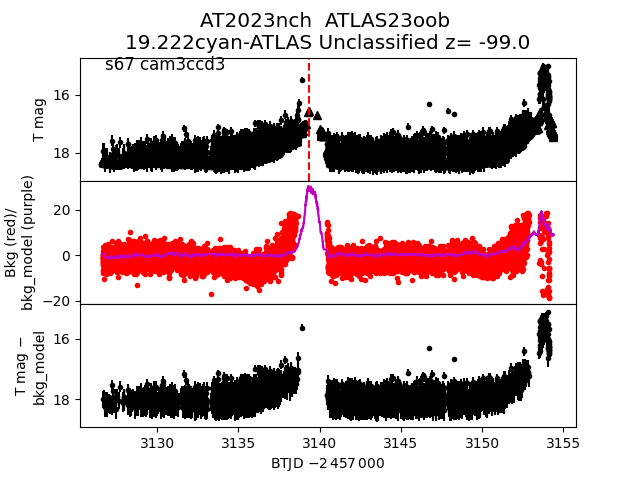
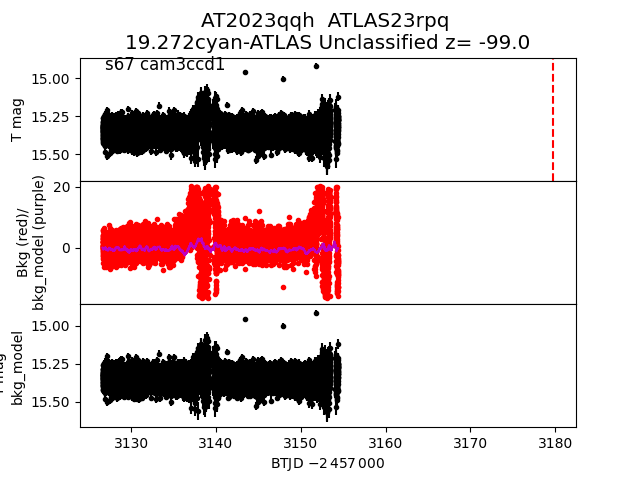
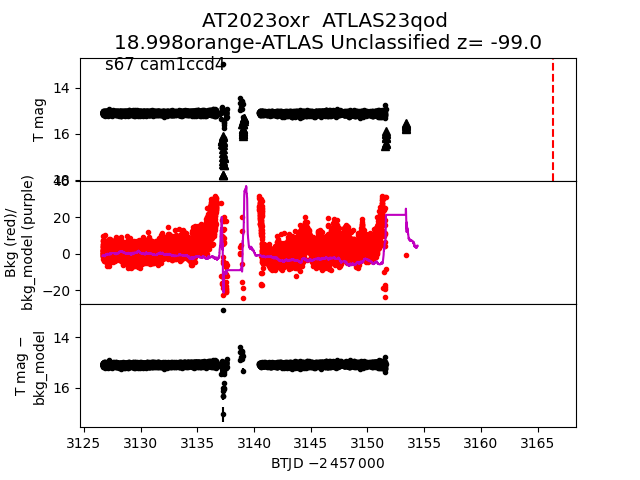
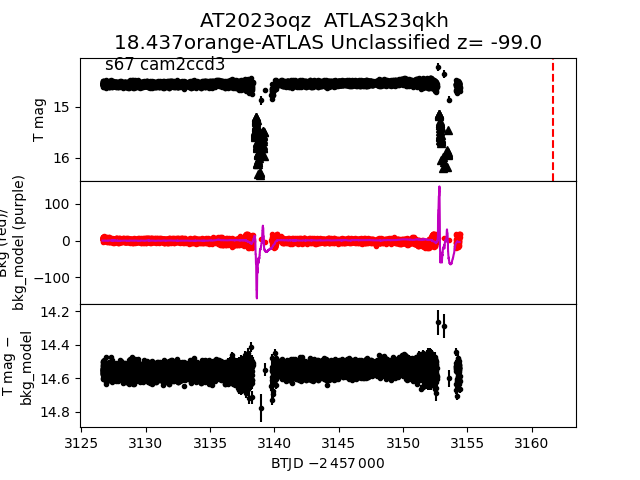
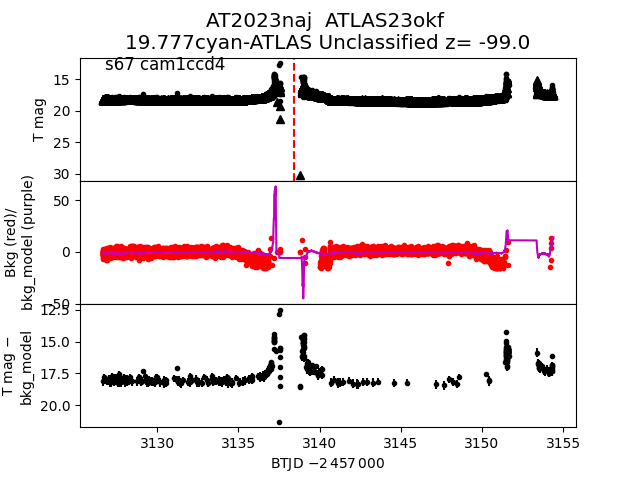
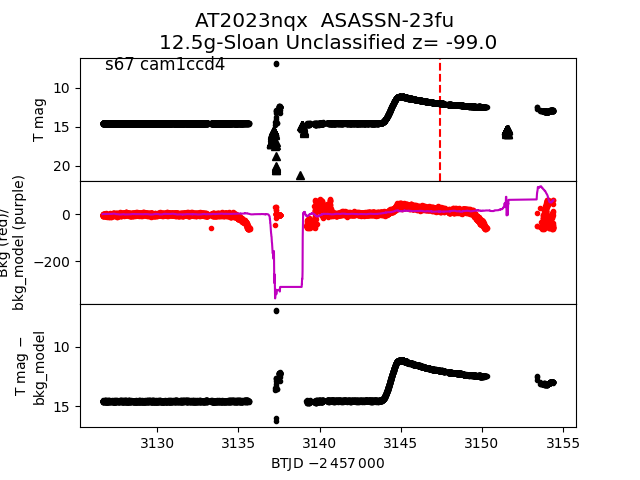
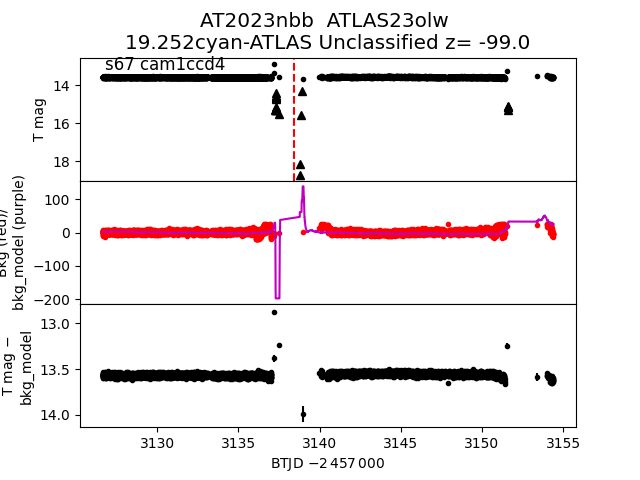
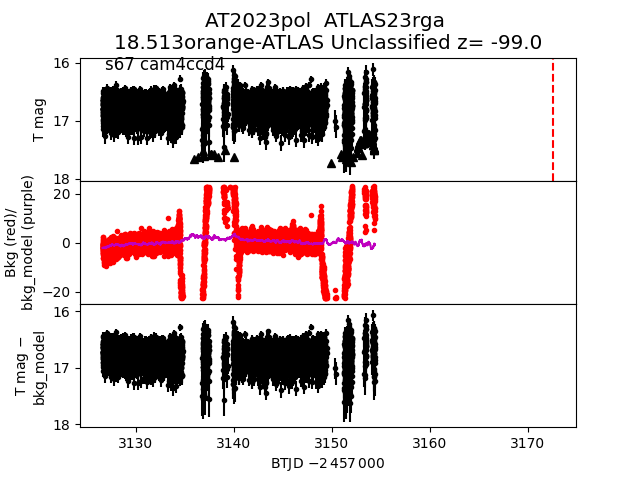
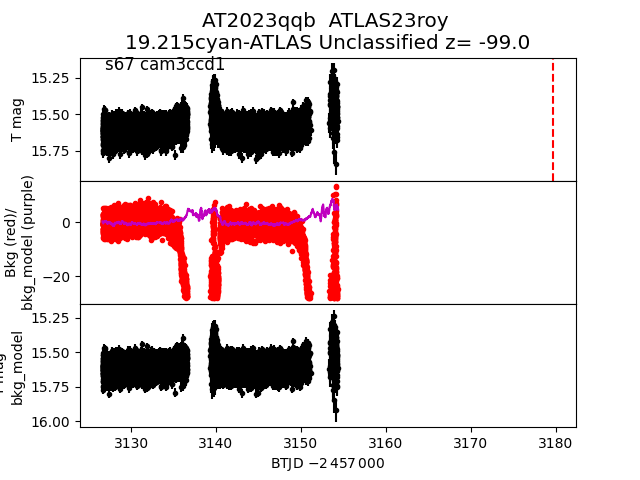
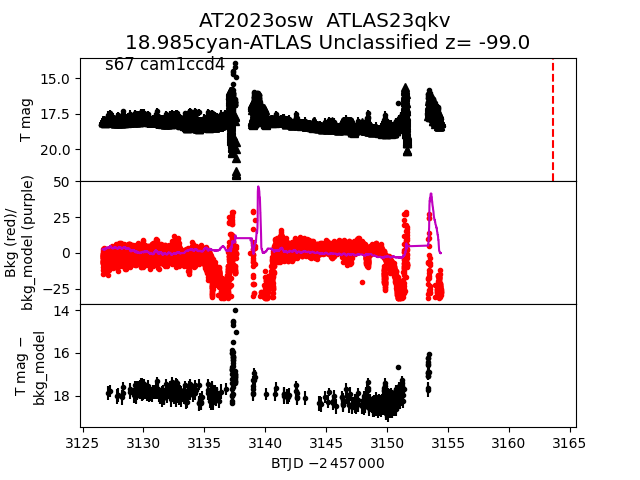
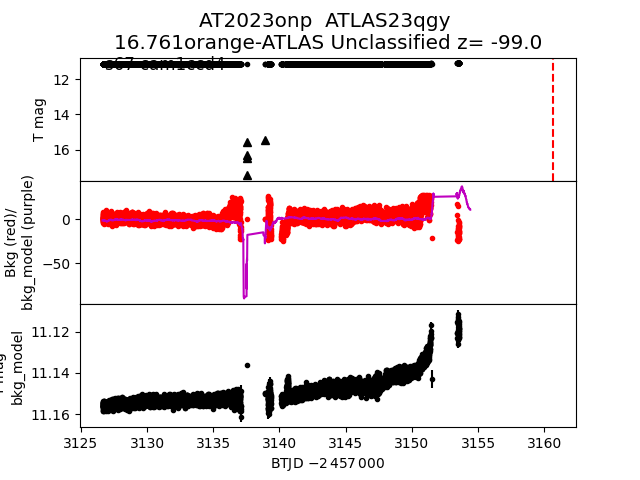
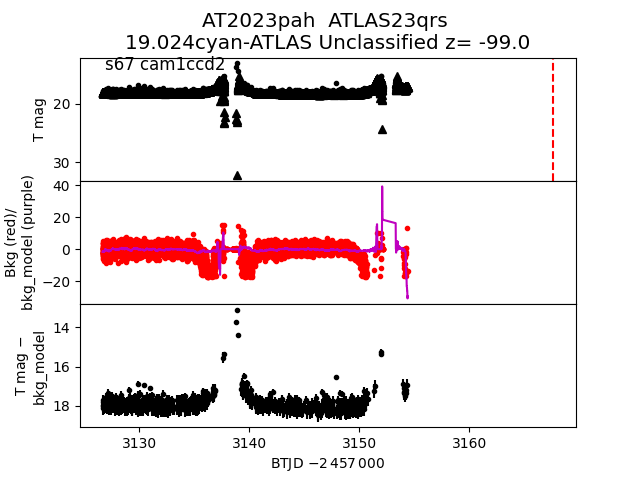
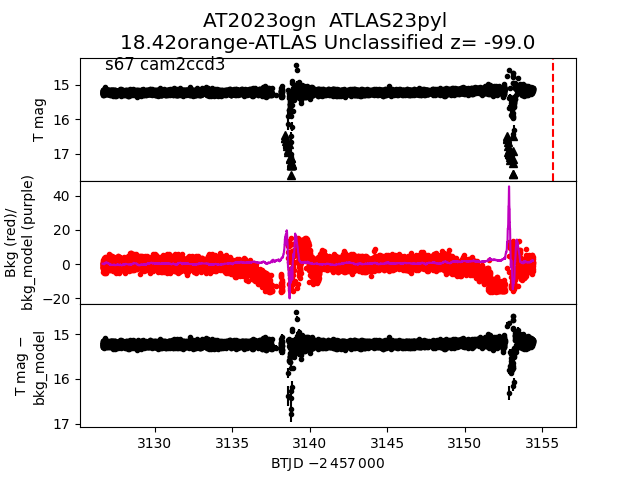
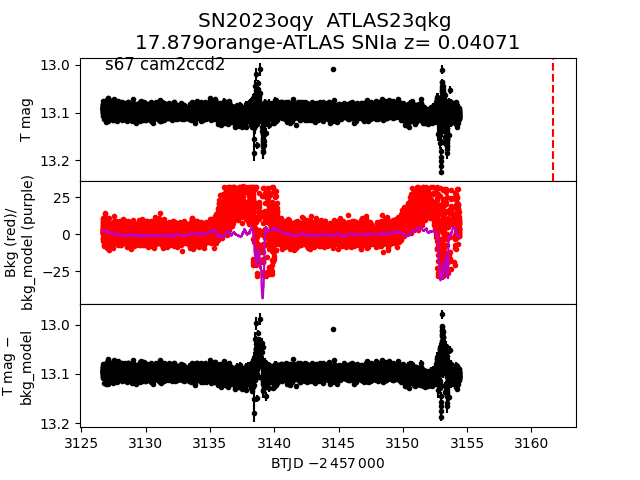
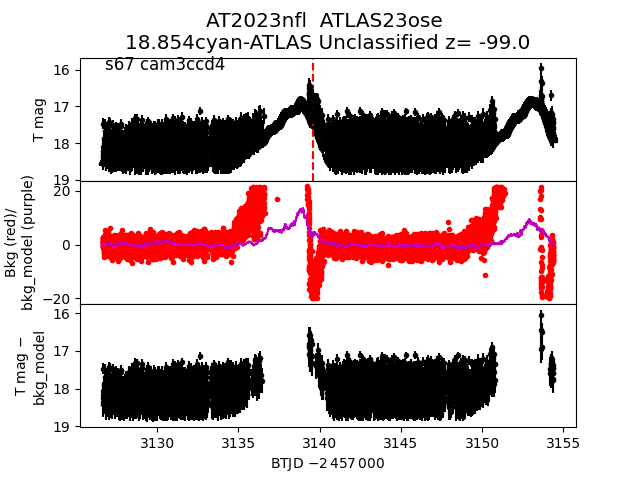
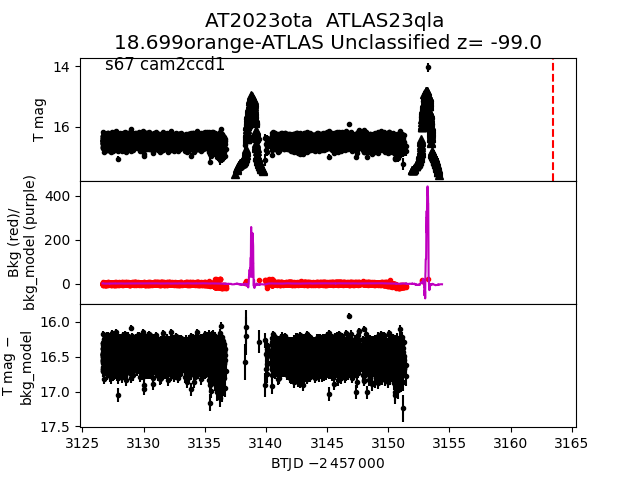
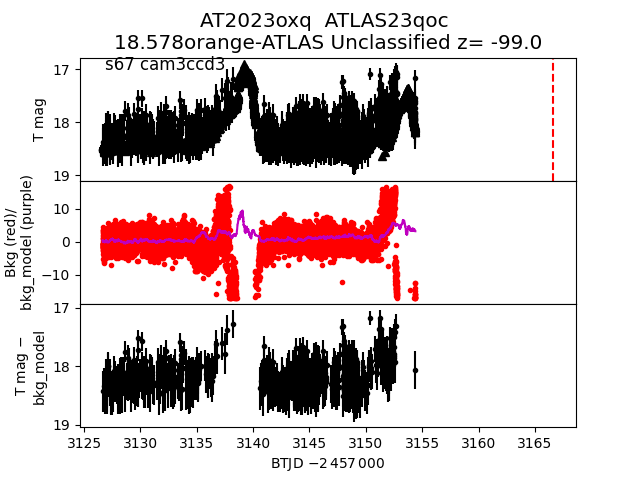
Each figure has three panels. The top panel shows the transient light curve, the middle panel shows the local background (estimated in an annulus), and the bottom panel shows a "background-model corrected" light curve. Details about the background model are in the README.
The vertical red line marks the time of discovery reported to TNS. Other useful metadata from TNS is in the figure title.
Note that the top and bottom panel are in magnitudes, while the middle panel is in differential flux units. The magnitudes are calibrated to the flux in the reference image used for image subtraction. Thus, flux from the host galaxy is included in these magnitudes.
3-sigma upper limits are plotted as triangles with no errorbars. A typical limiting magnitude is 19.6 in 30 minutes or 18.4 in 200 seconds (for low backgrounds).
The links allow you to download the light curve data as a text file.
More details in the README.
2023qov
 2023msm
 2023paf
 2023njr
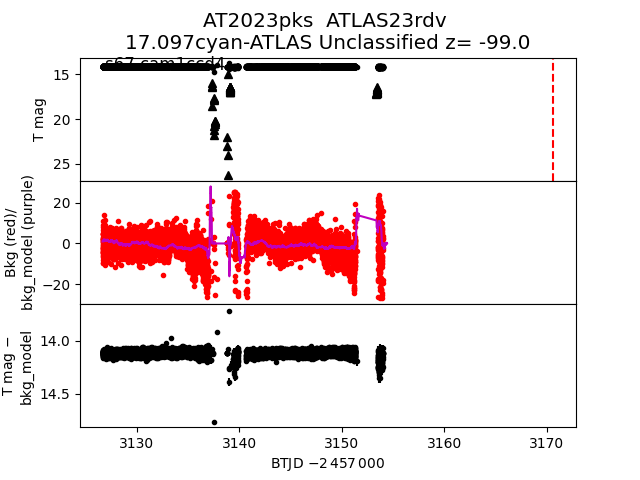
 2023pks
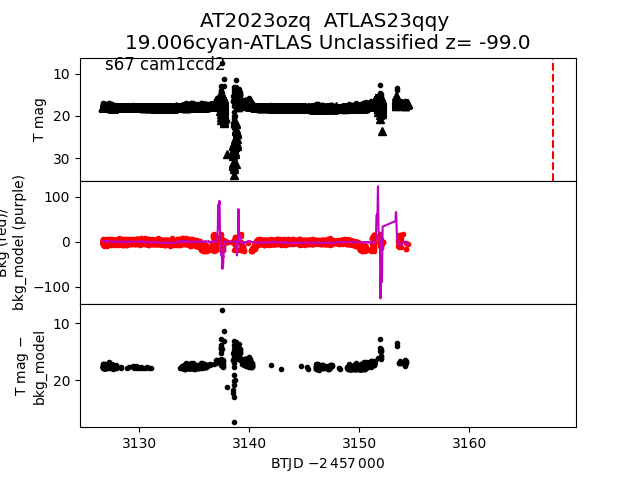
 2023ozq
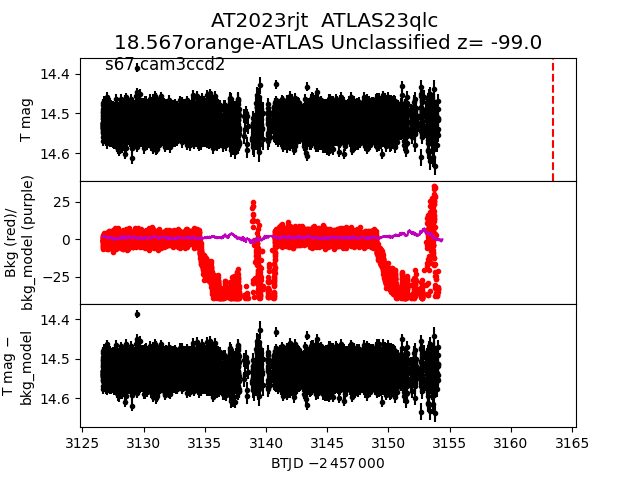
 2023rjt
 2023ogi
 2023ntd
 2023nvj
 2023owh
 2023ocg
 2023nbe
 2023oxs
 2023qpz
 2023qfr
 2023oxo
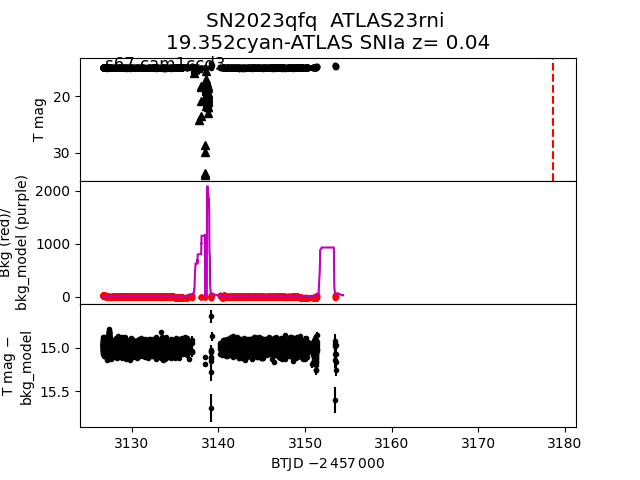
 2023qfq
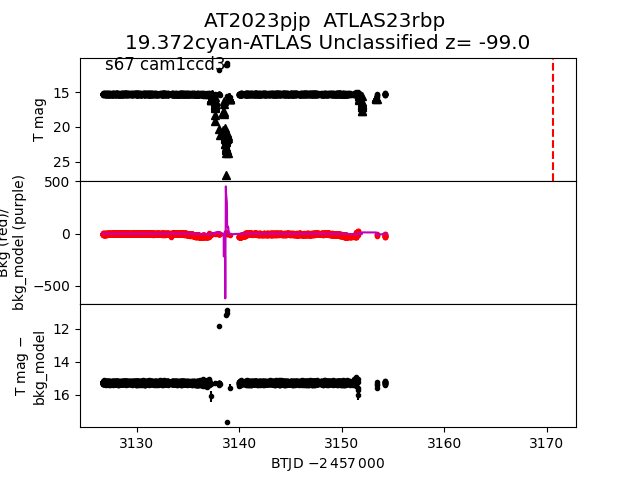
 2023pjp
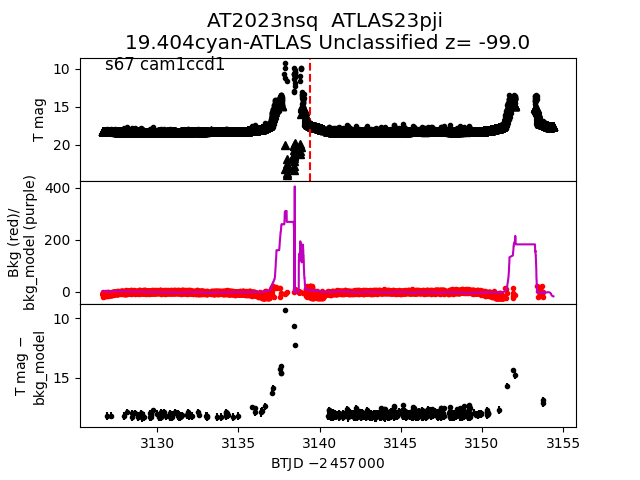
 2023nsq
 2023pjo
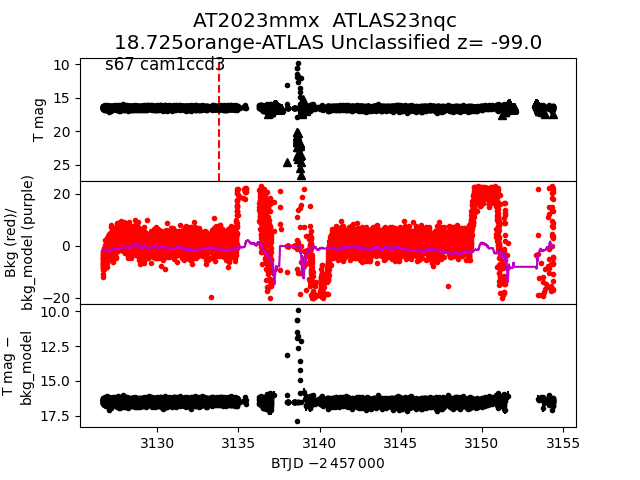
 2023mmx
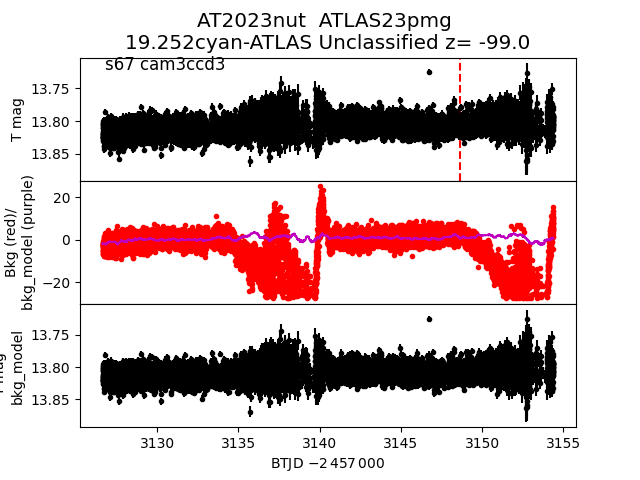
 2023nut
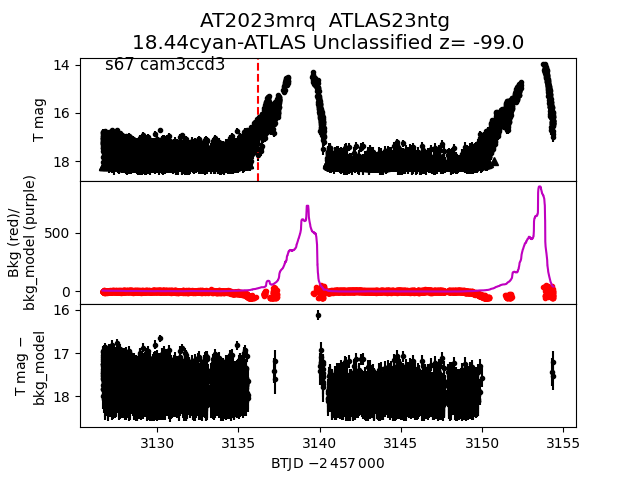
 2023mrq
 2023oqx
 2023pjy
 2023ogj
 2023qqf
 2023nbc
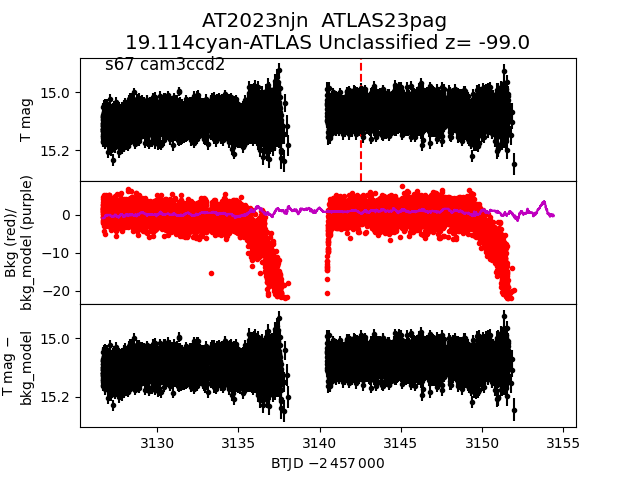
 2023njn
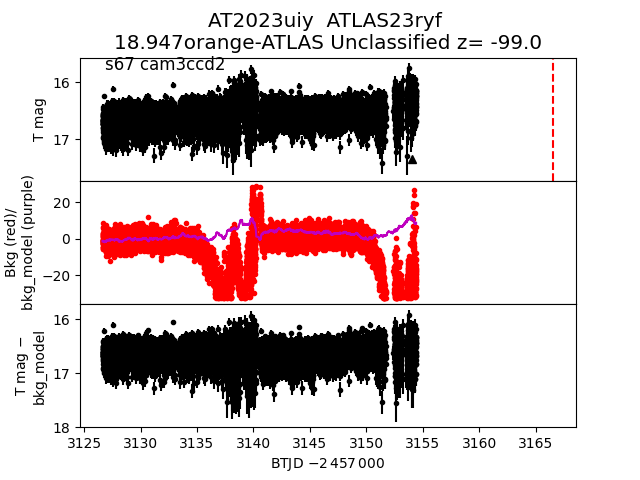
 2023uiy
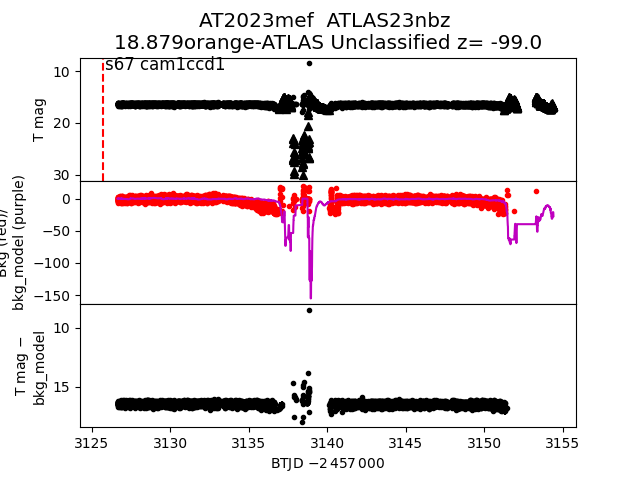
 2023mef
 2023pab
 2023nch
 2023qqh
 2023oxr
 2023oqz
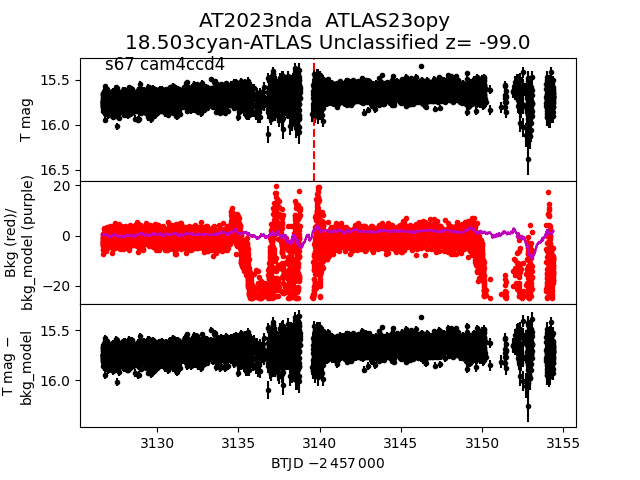
 2023nda
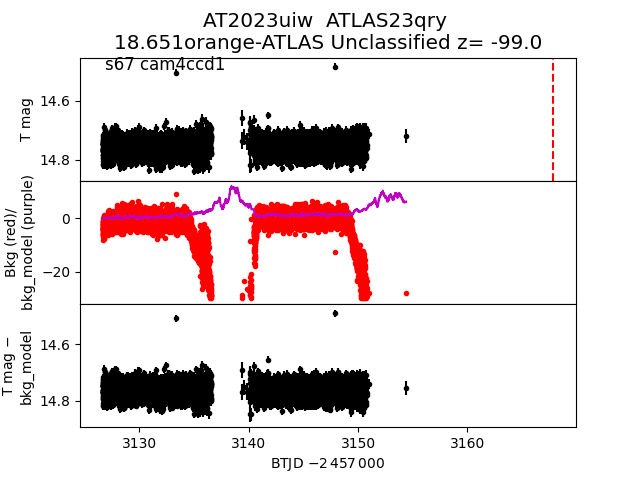
 2023uiw
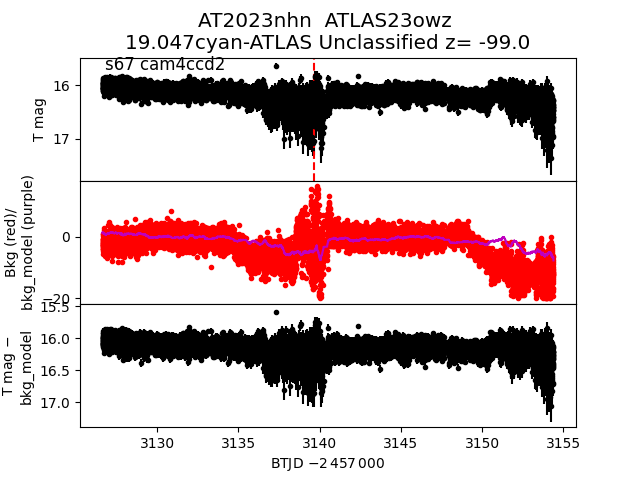
 2023nhn
 2023naj
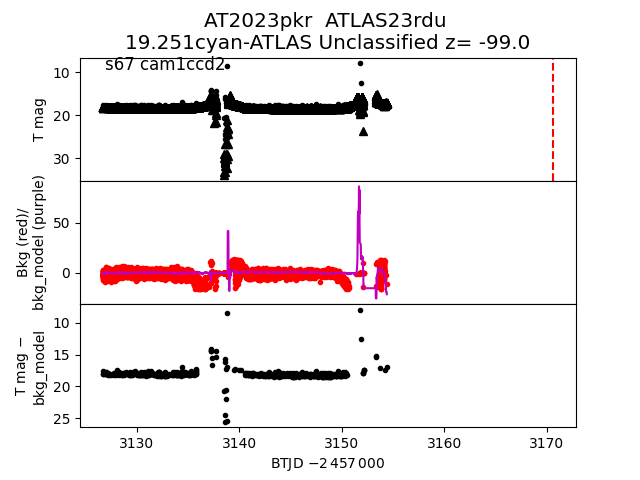
 2023pkr
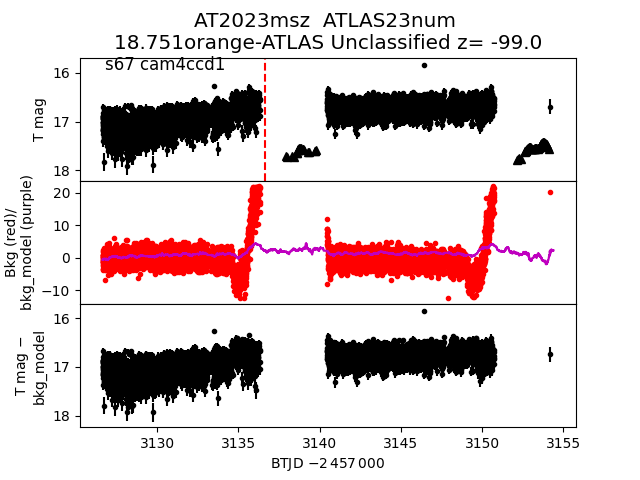
 2023msz
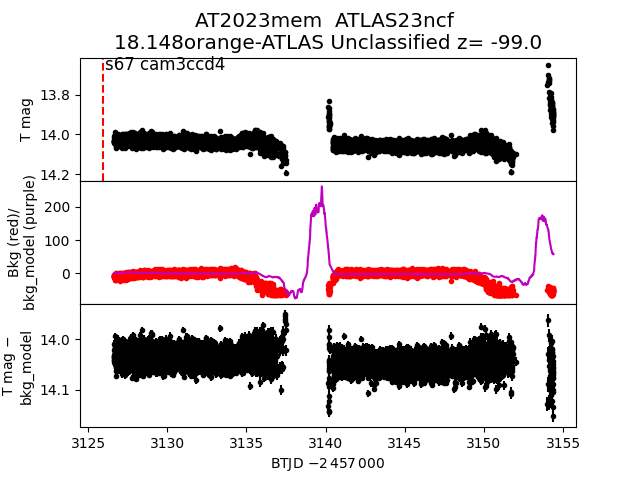
 2023mem
 2023nqx
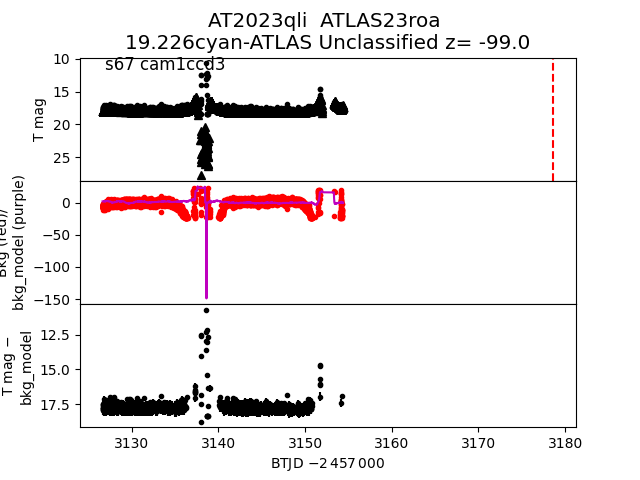
 2023qli
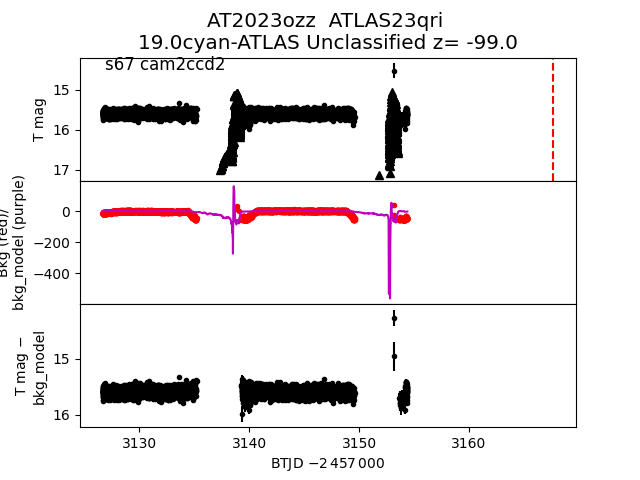
 2023ozz
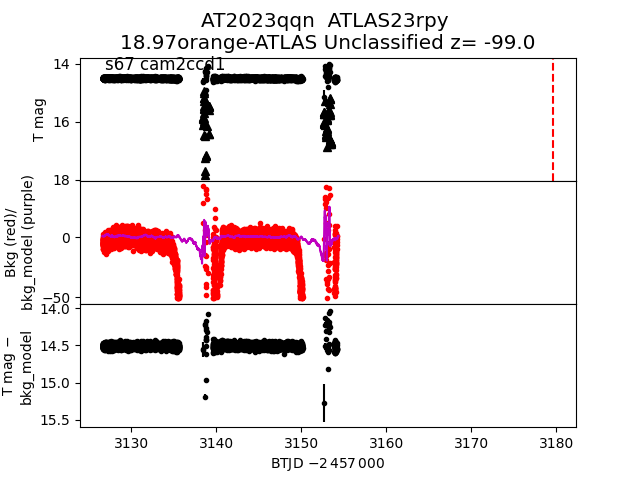
 2023qqn
 2023nbb
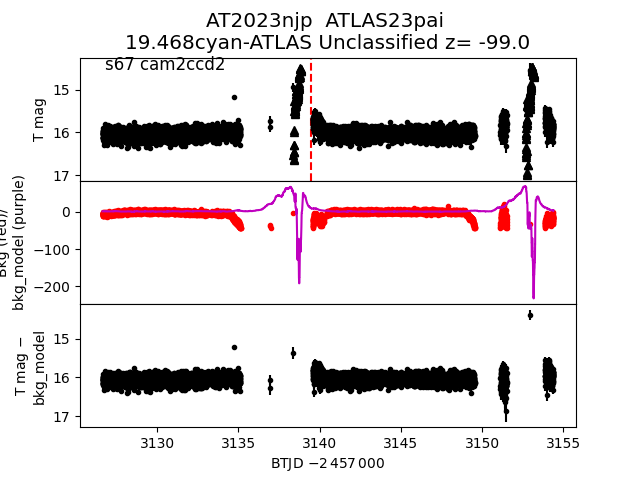
 2023njp
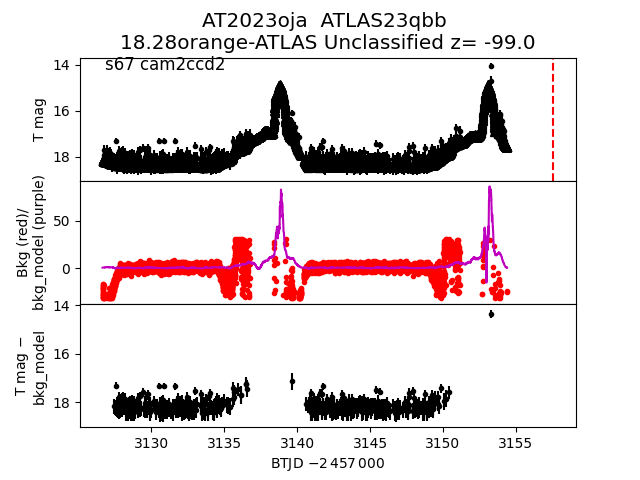
 2023oja
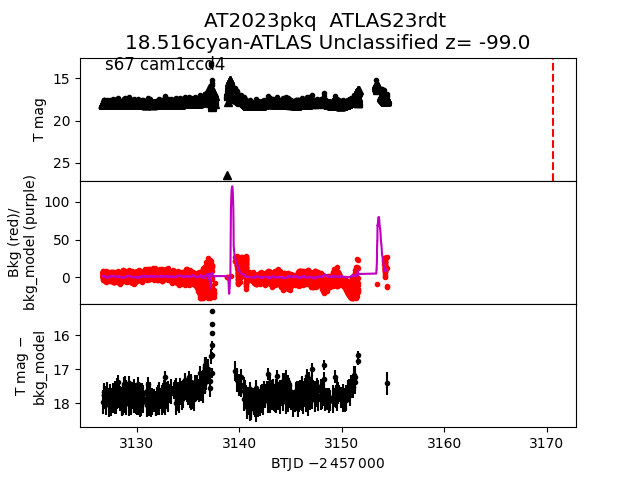
 2023pkq
 2023pol
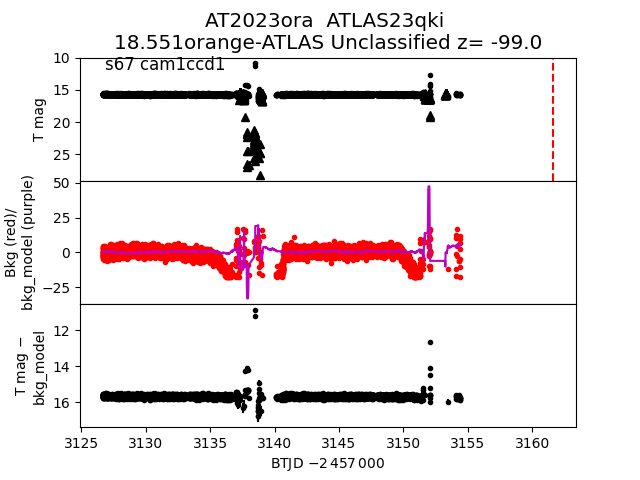
 2023ora
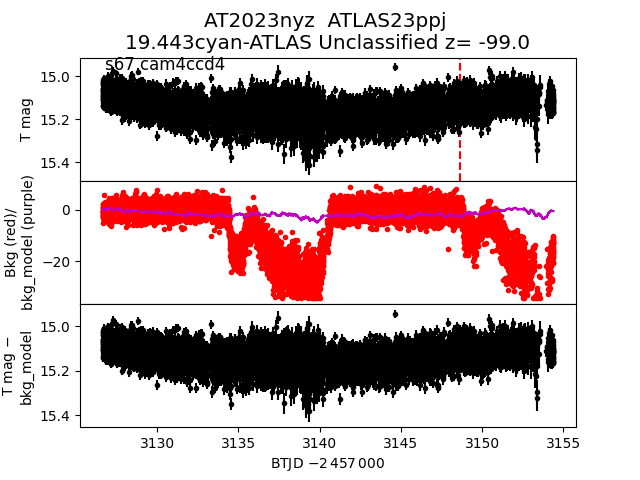
 2023nyz
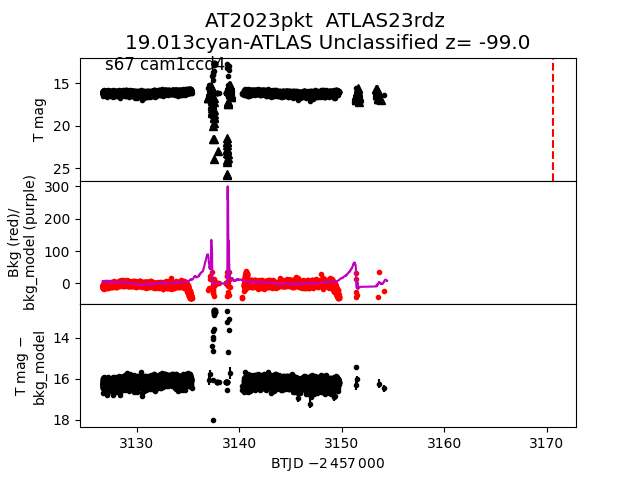
 2023pkt
 2023qqb
 2023osw
 2023onp
 2023pah
 2023ogn
 2023oqy
 2023nfl
 2023ota
 2023oxq
 2023oxn