all transients in sector64 (72 total)
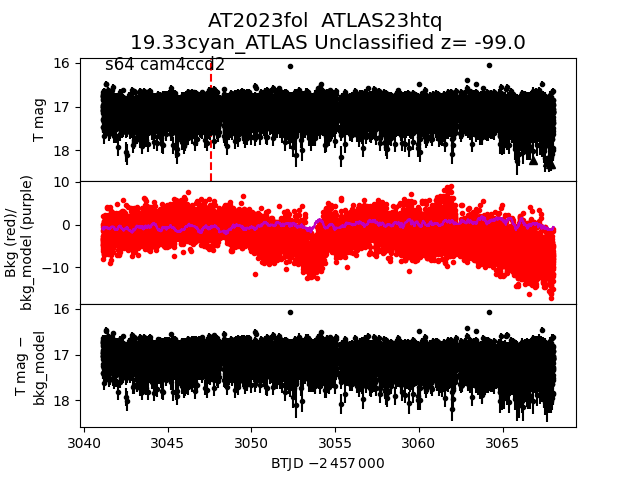
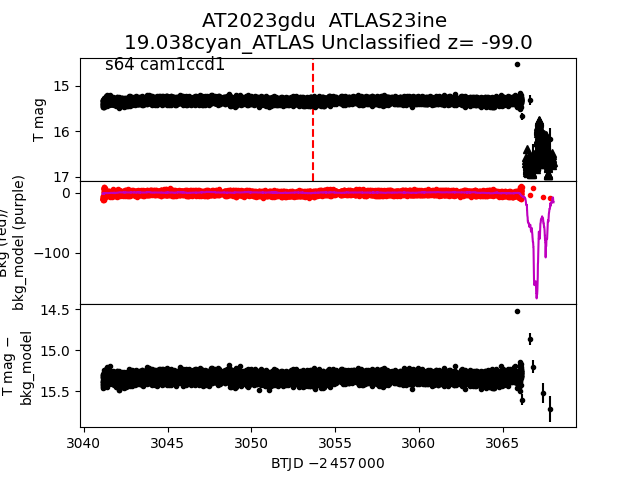
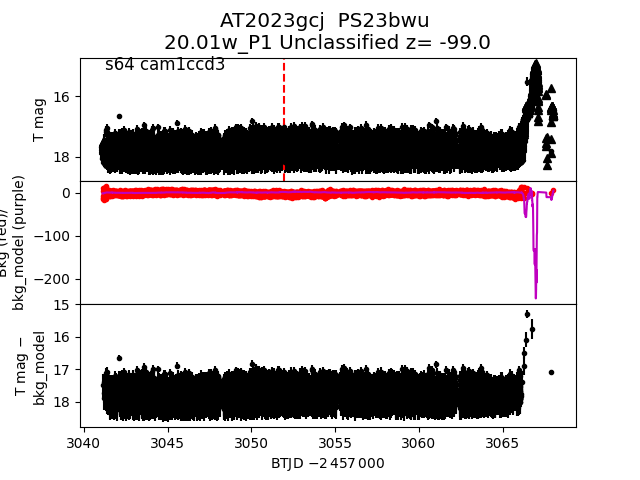
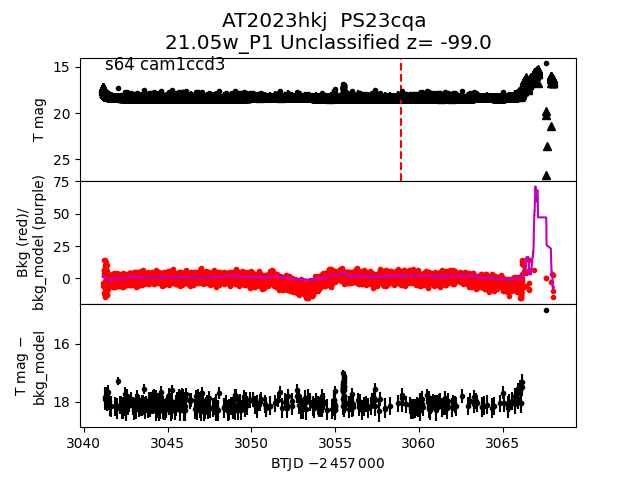
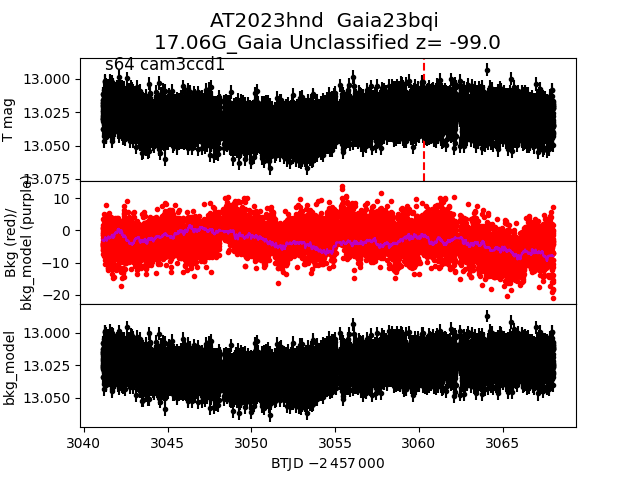
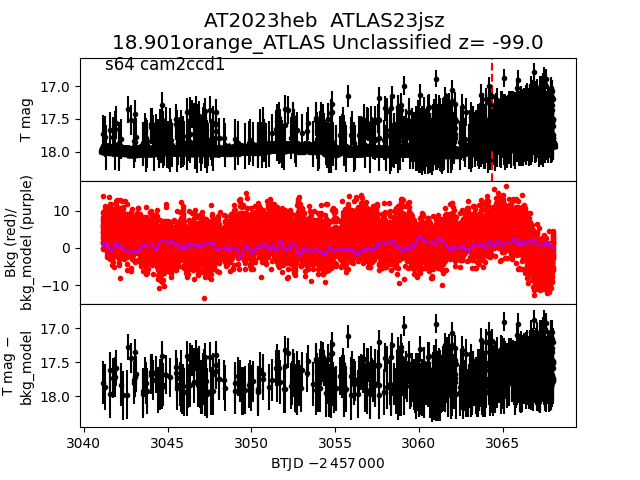
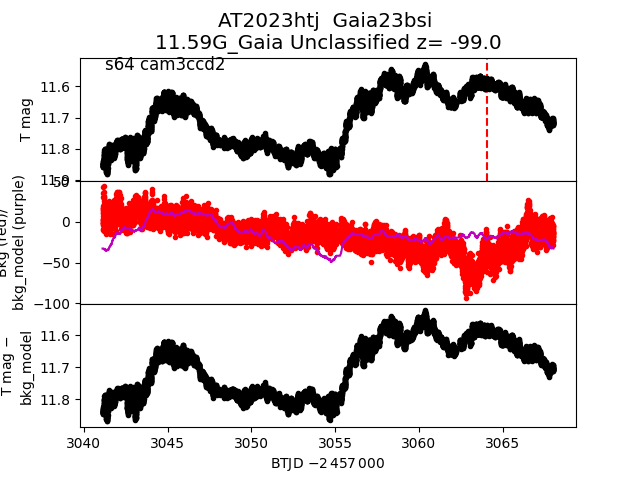
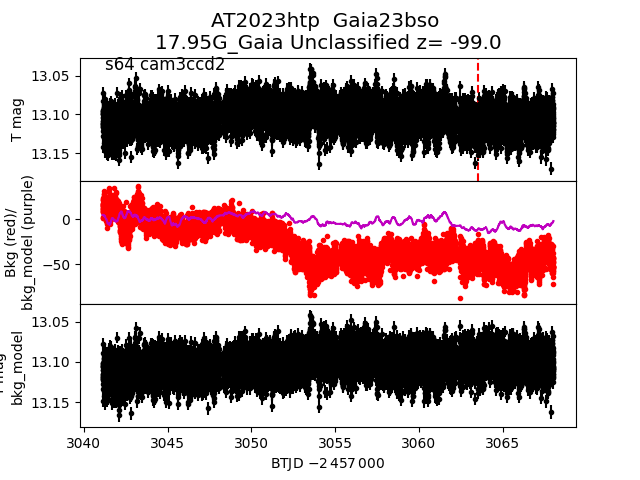
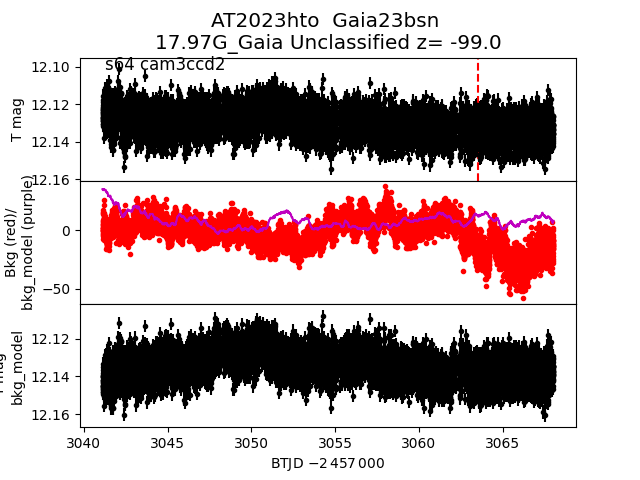
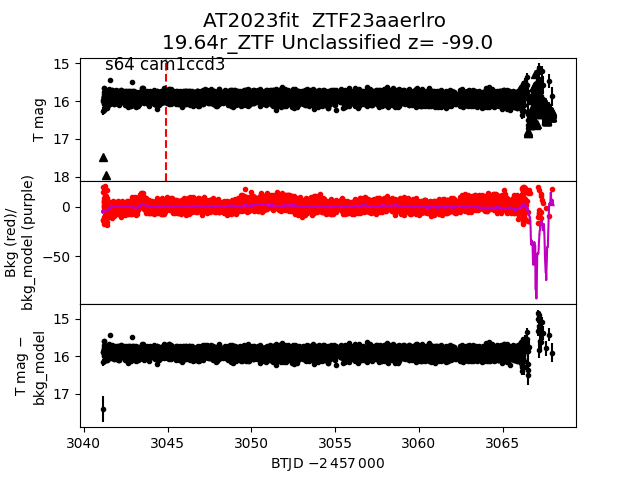
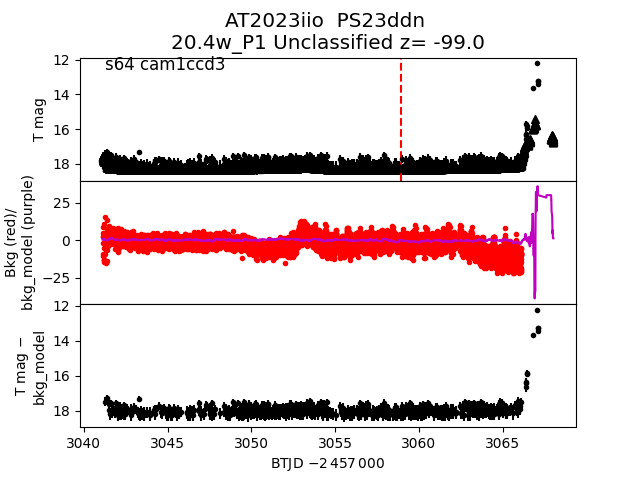
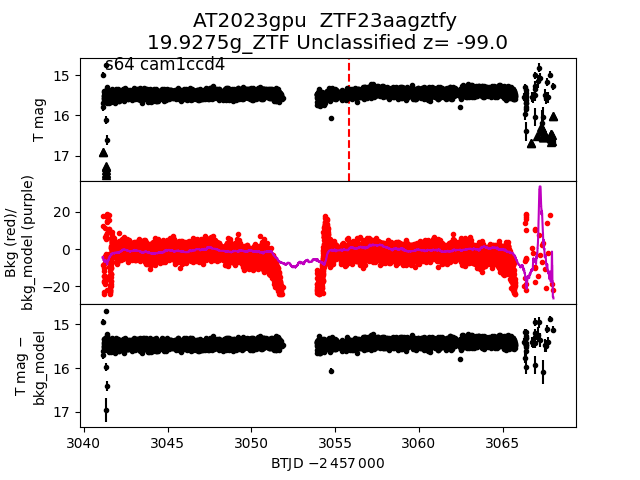
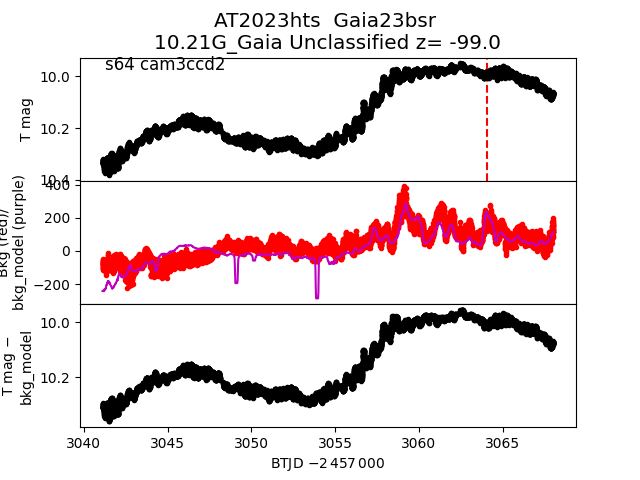
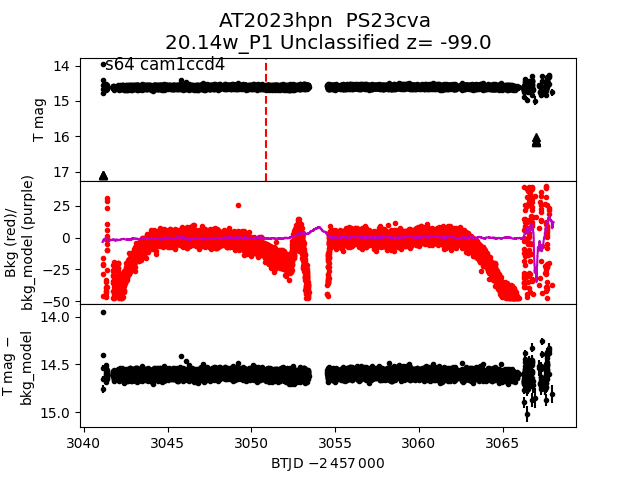
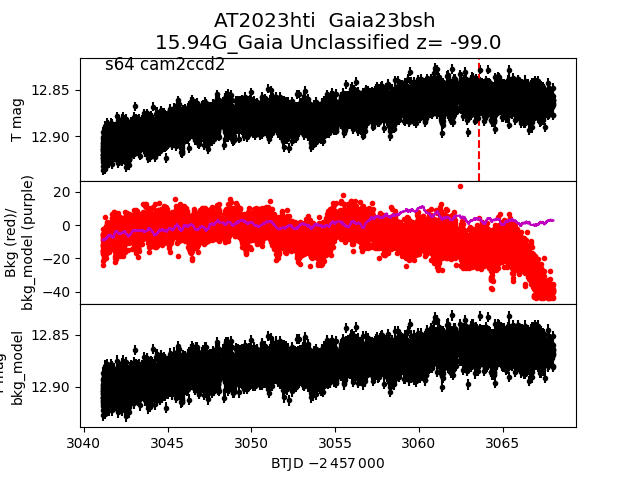
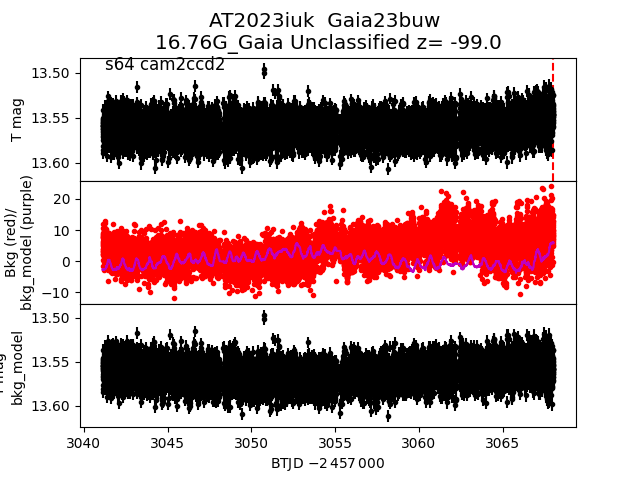
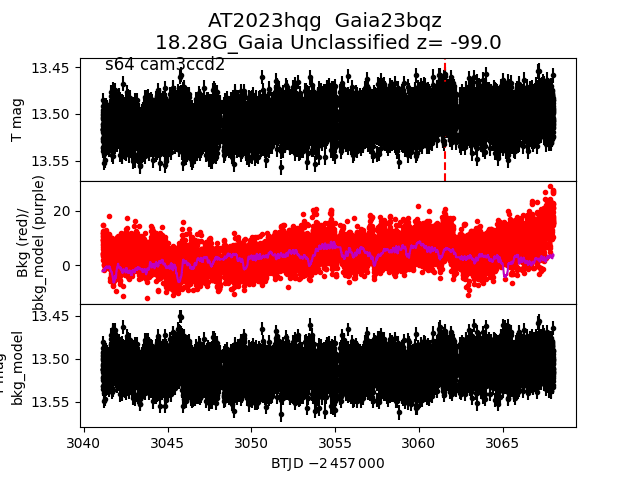
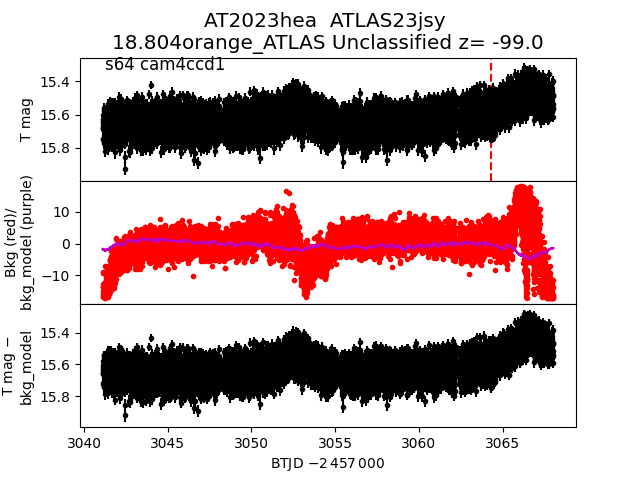
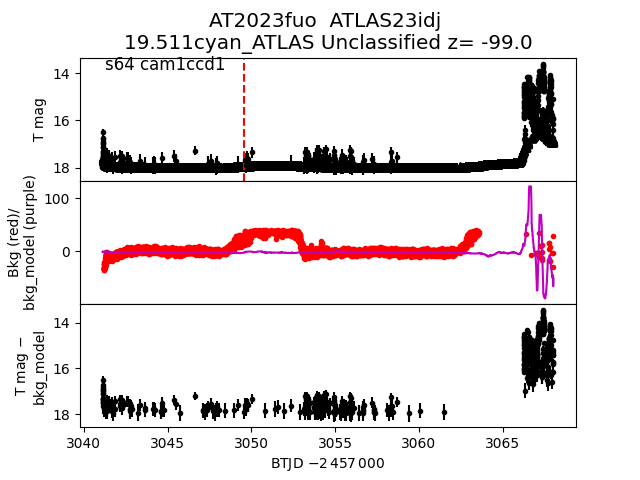
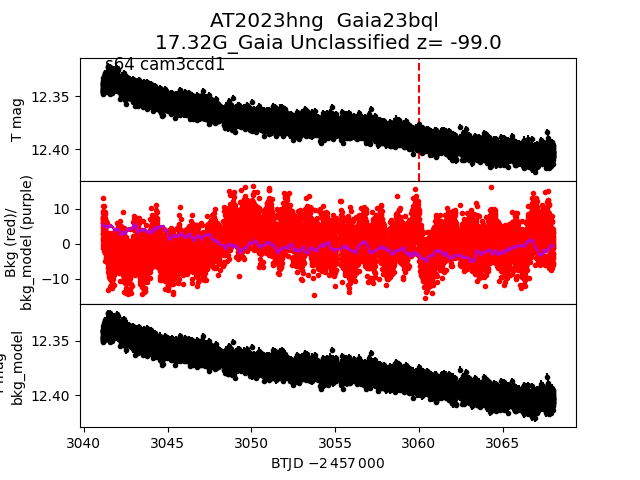
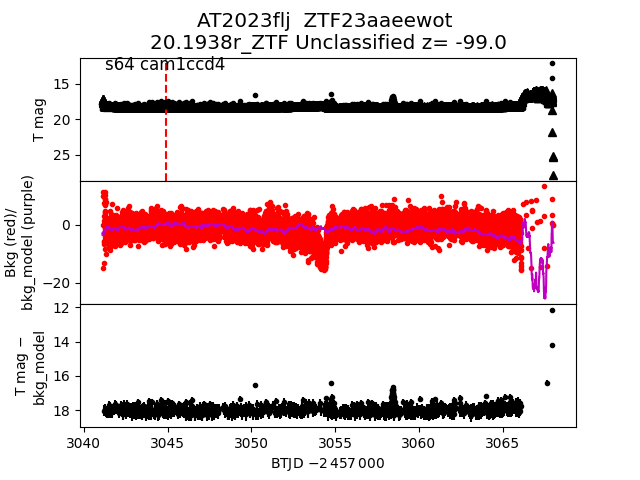
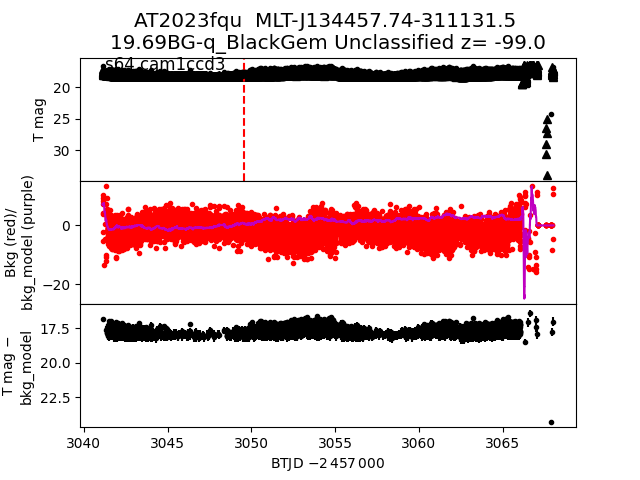
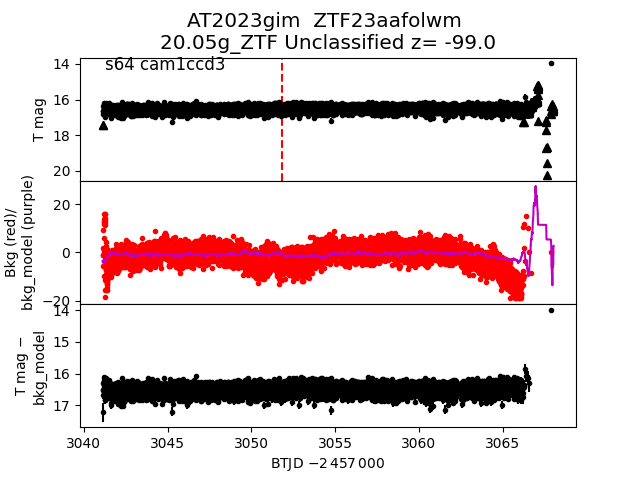
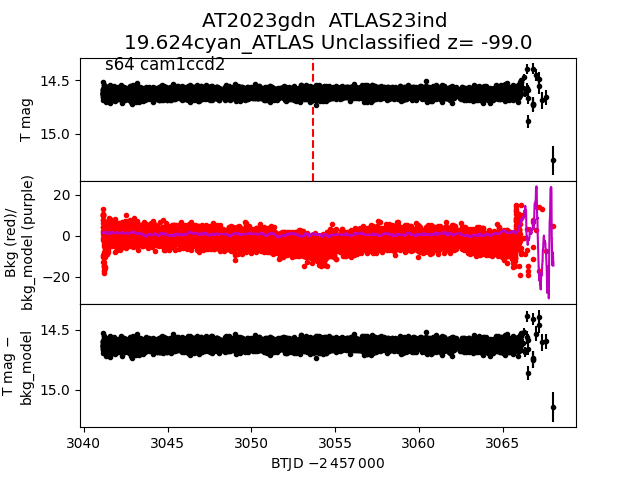
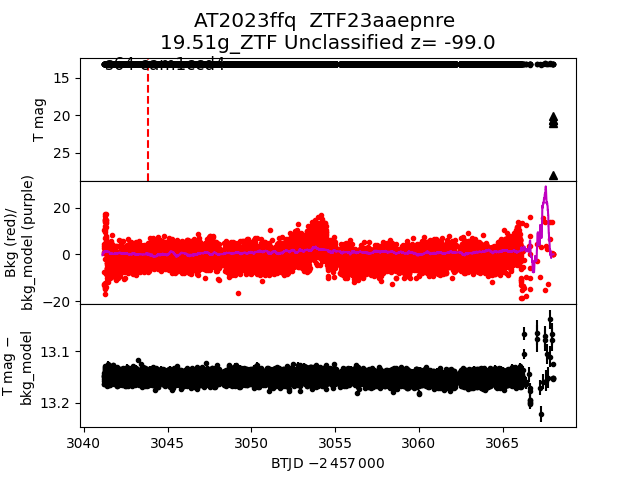
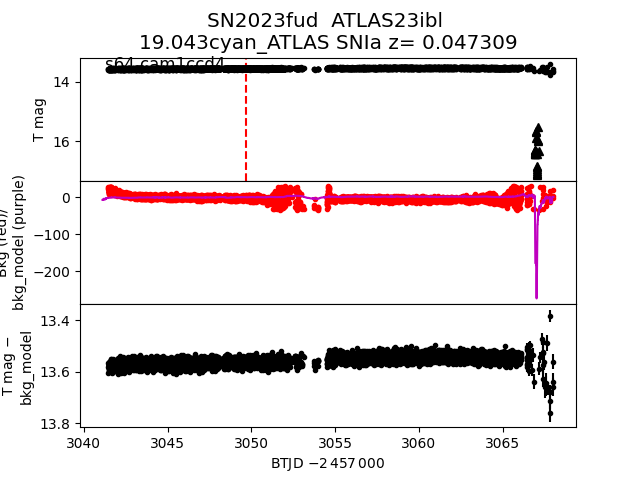
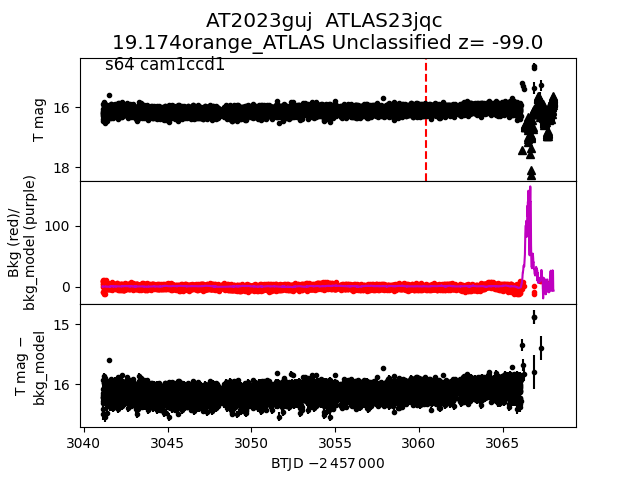
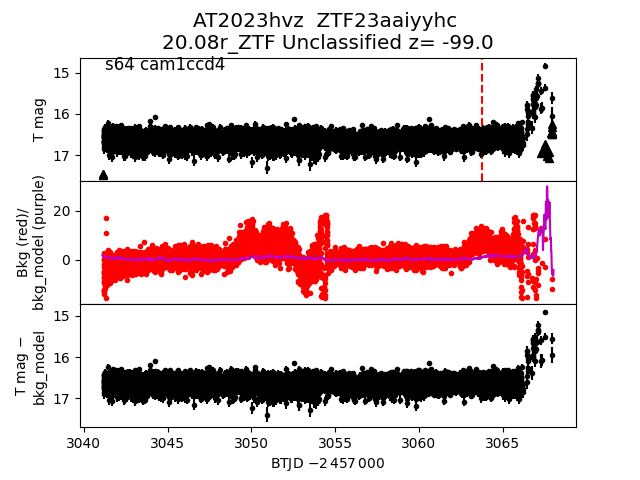
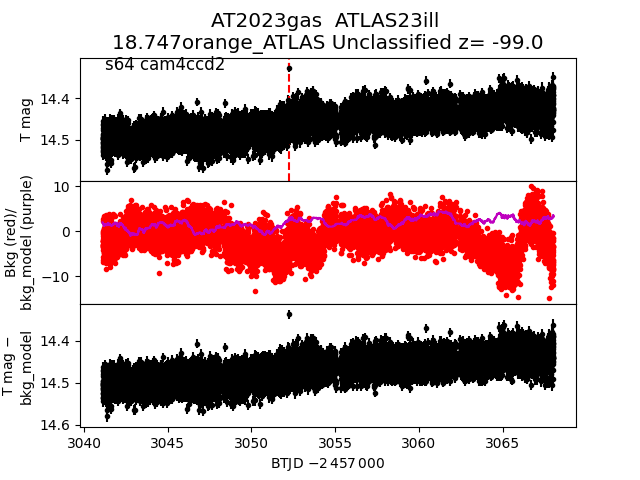
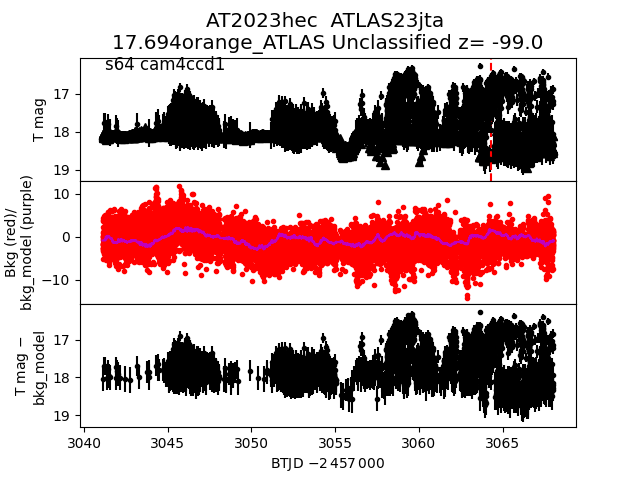
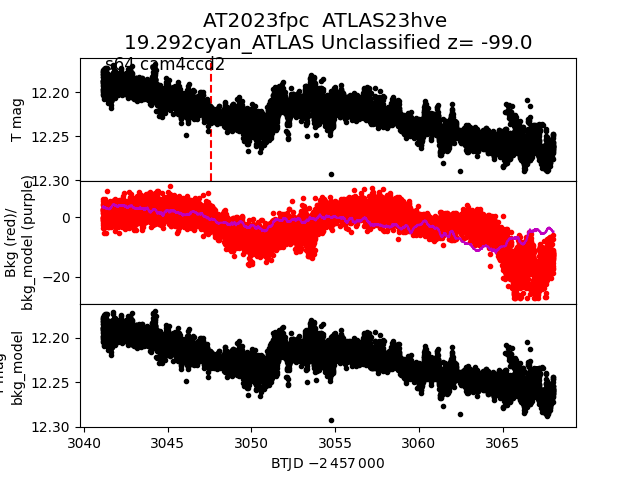
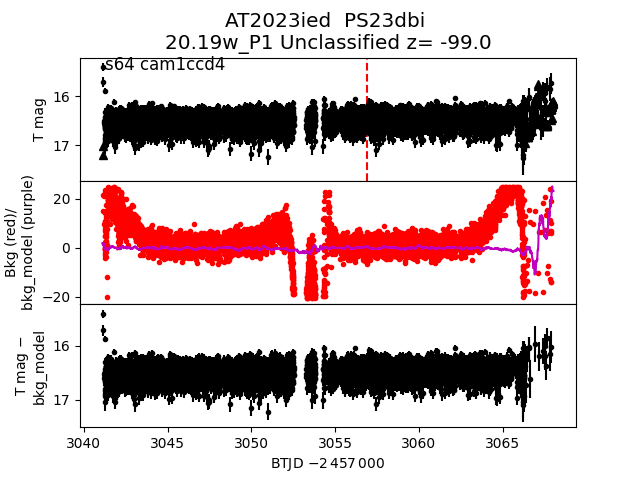
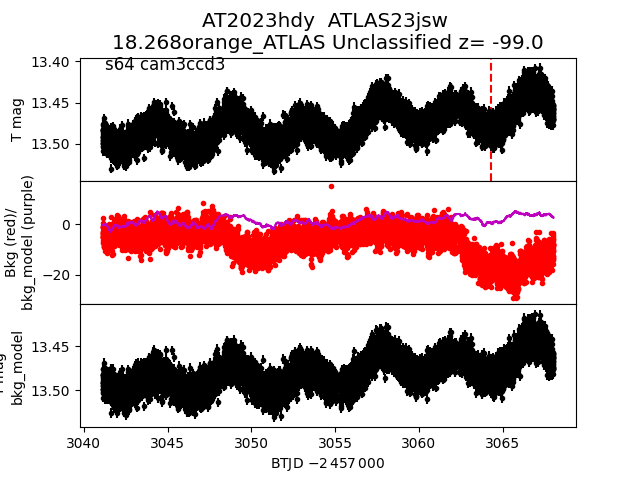
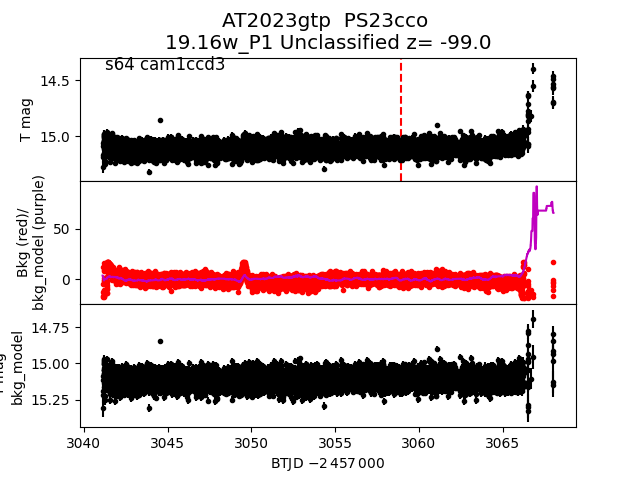
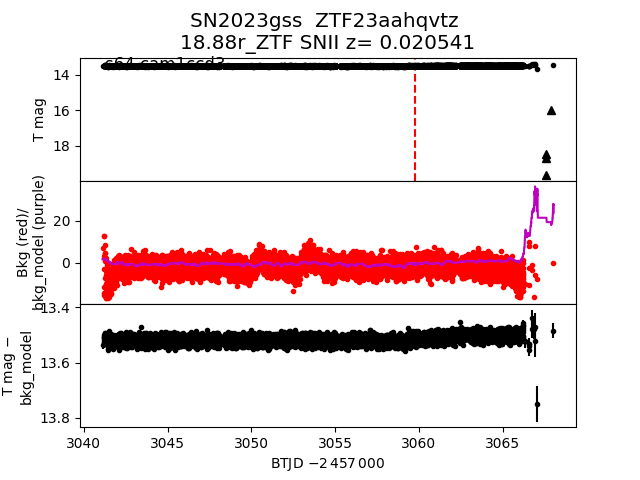
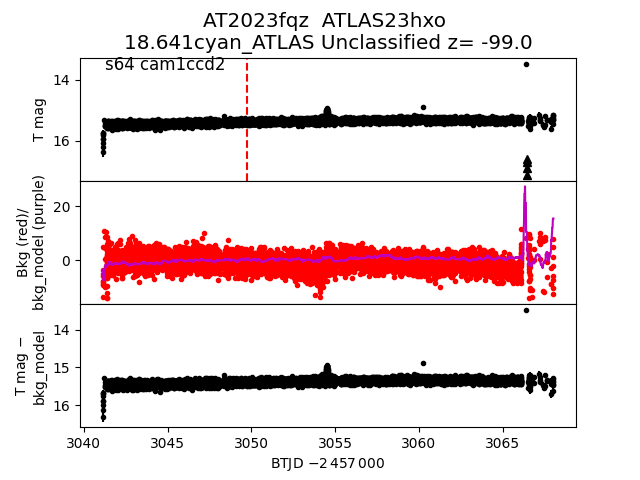
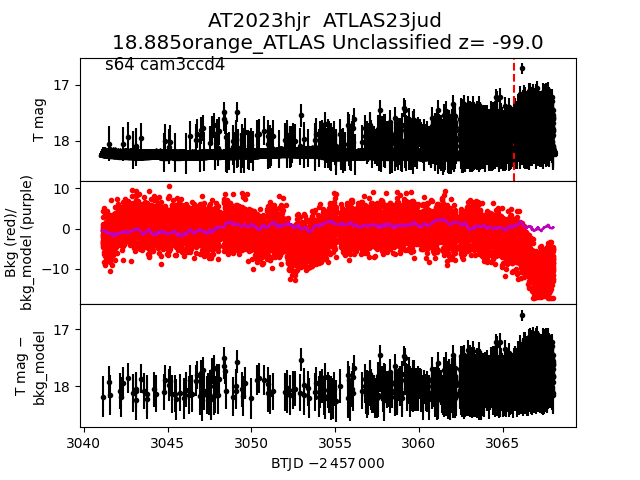
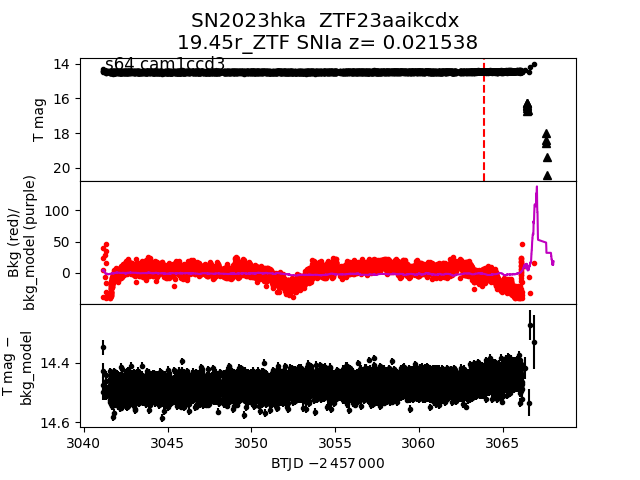
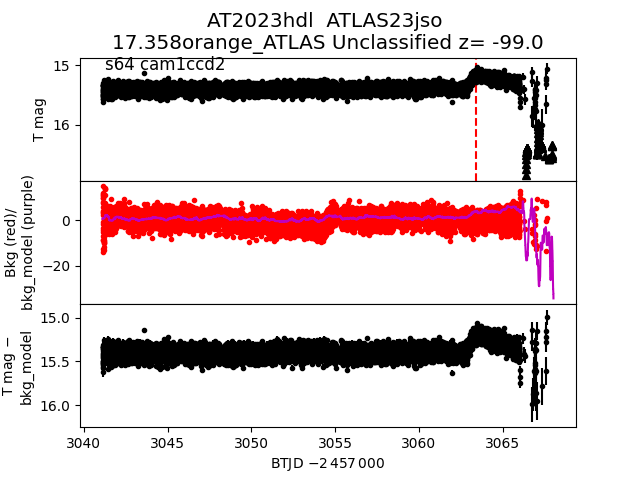
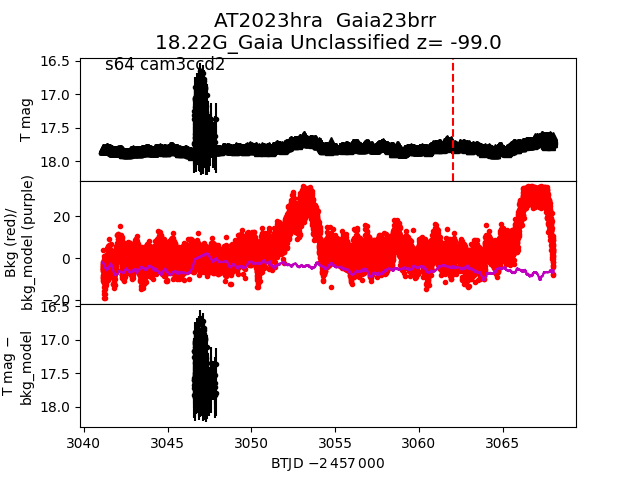
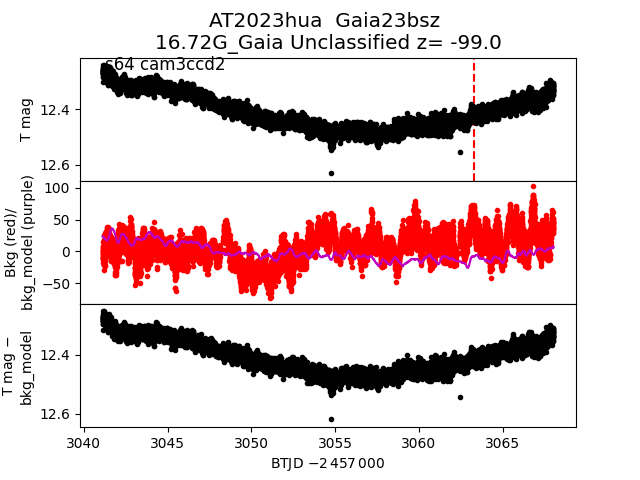
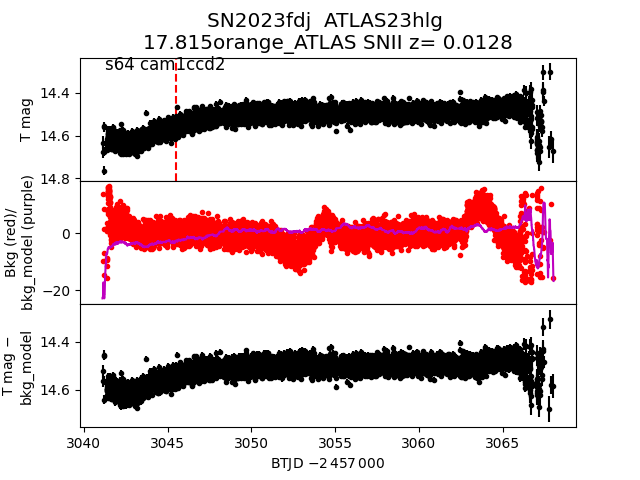
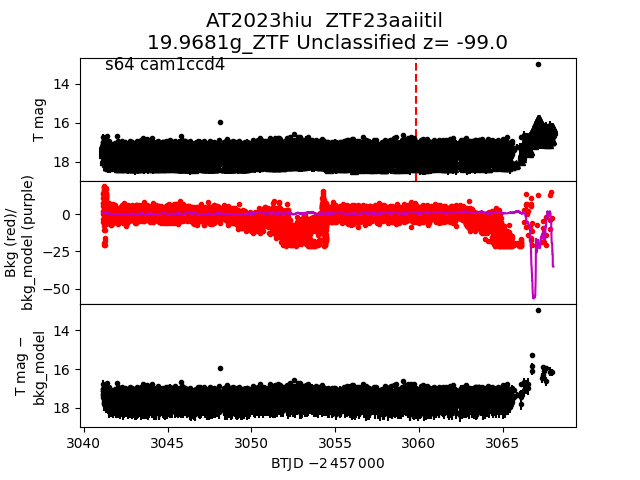
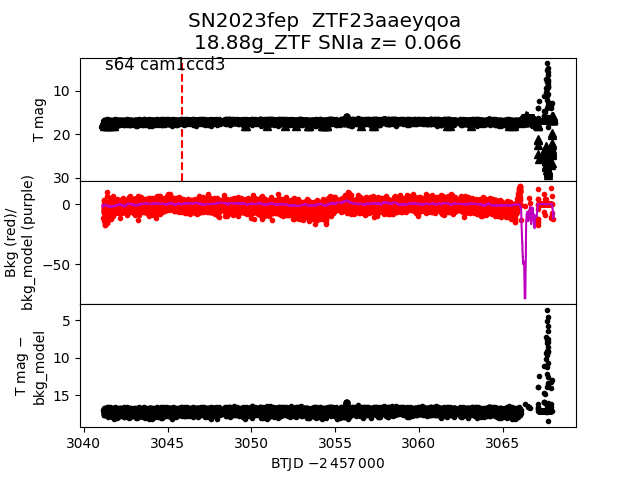
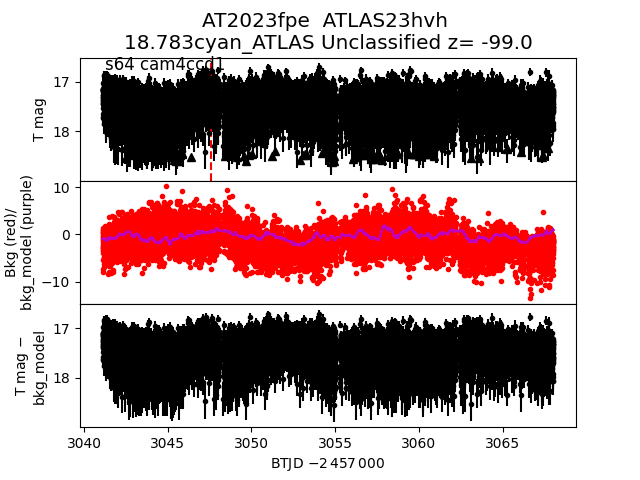
Each figure has three panels. The top panel shows the transient light curve, the middle panel shows the local background (estimated in an annulus), and the bottom panel shows a "background-model corrected" light curve. Details about the background model are in the README.
The vertical red line marks the time of discovery reported to TNS. Other useful metadata from TNS is in the figure title.
Note that the top and bottom panel are in magnitudes, while the middle panel is in differential flux units. The magnitudes are calibrated to the flux in the reference image used for image subtraction. Thus, flux from the host galaxy is included in these magnitudes.
3-sigma upper limits are plotted as triangles with no errorbars. A typical limiting magnitude is 19.6 in 30 minutes or 18.4 in 200 seconds (for low backgrounds).
The links allow you to download the light curve data as a text file.
More details in the README.
2023gdu
 2023gcj
 2023hkj
 2023hnd
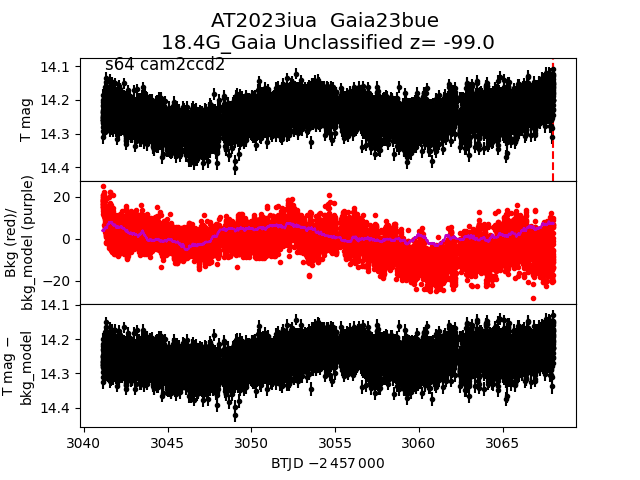
 2023iua
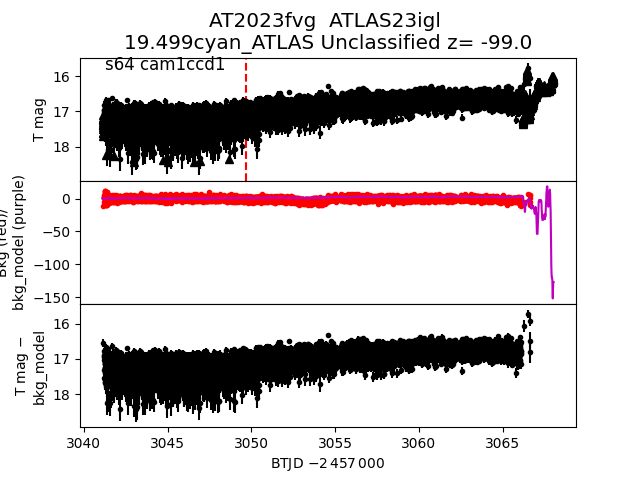
 2023fvg
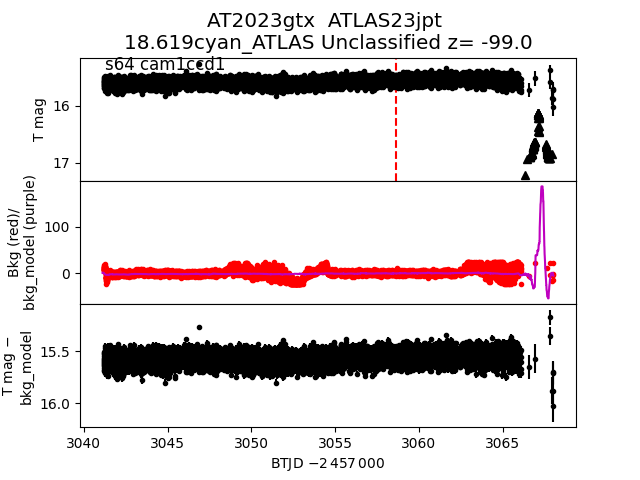
 2023gtx
 2023heb
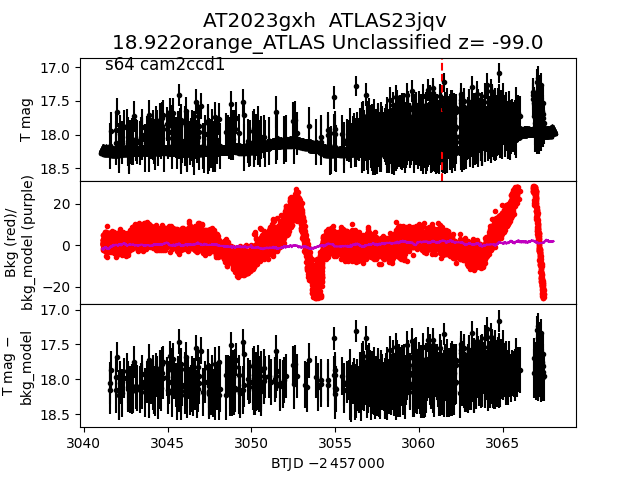
 2023gxh
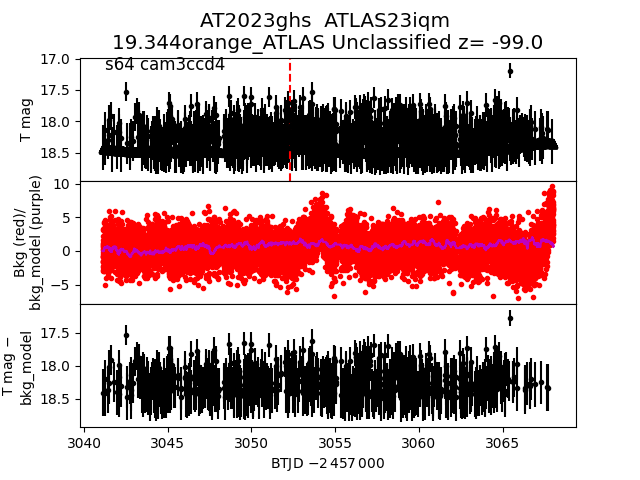
 2023ghs
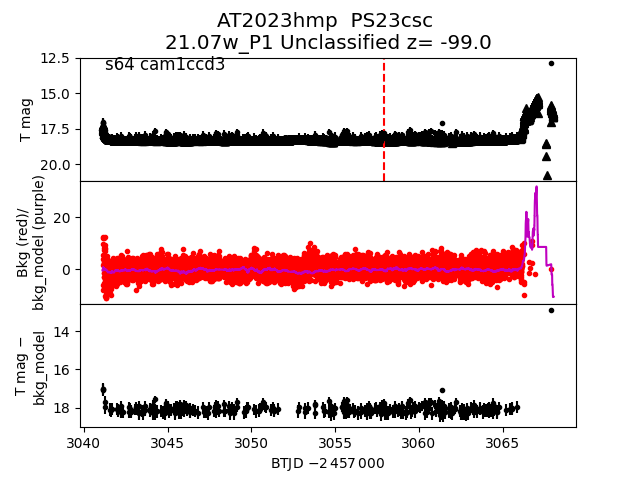
 2023hmp
 2023htj
 2023htp
 2023hto
 2023fit
 2023iio
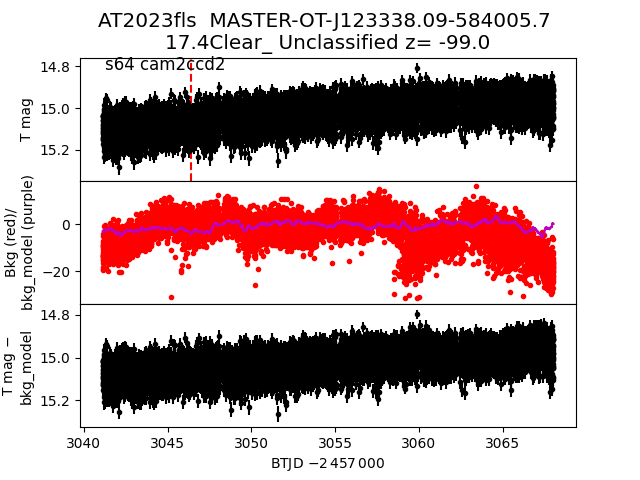
 2023fls
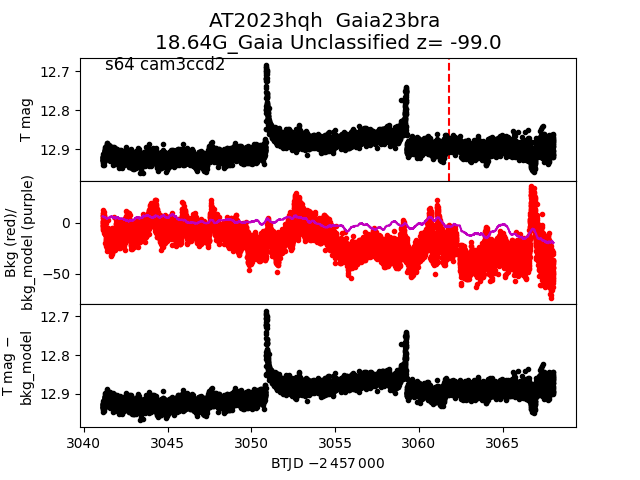
 2023hqh
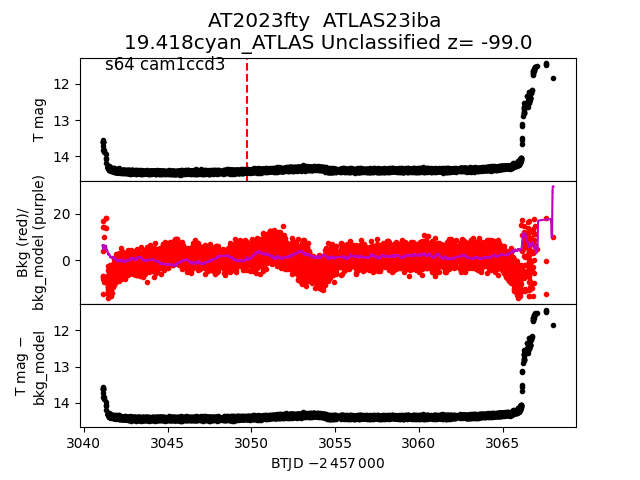
 2023fty
 2023gpu
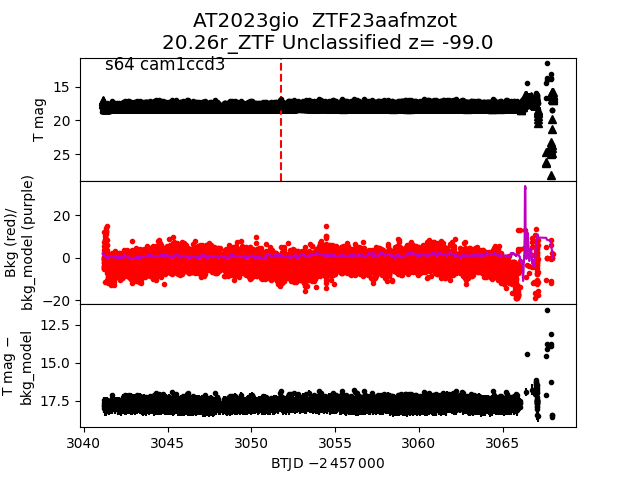
 2023gio
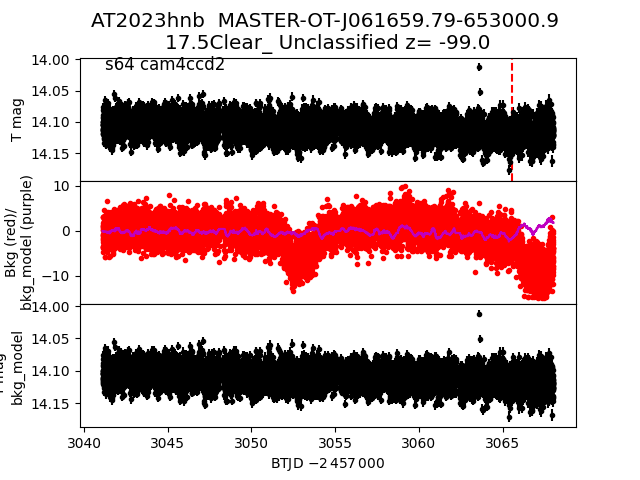
 2023hnb
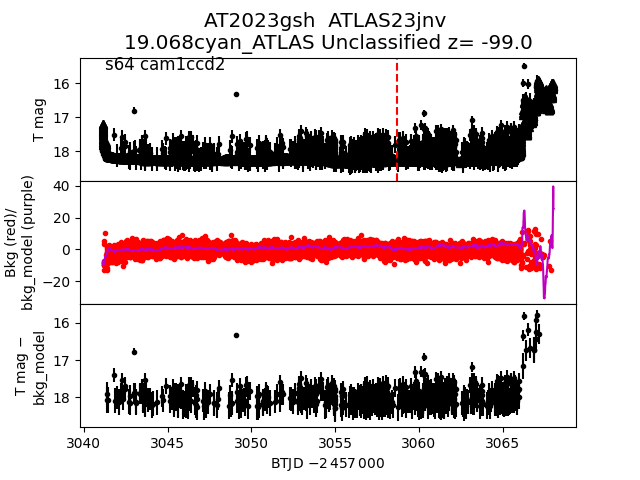
 2023gsh
 2023hts
 2023hpn
 2023hti
 2023iuk
 2023hqg
 2023hea
 2023fuo
 2023hng
 2023flj
 2023fqu
 2023gim
 2023gdn
 2023ffq
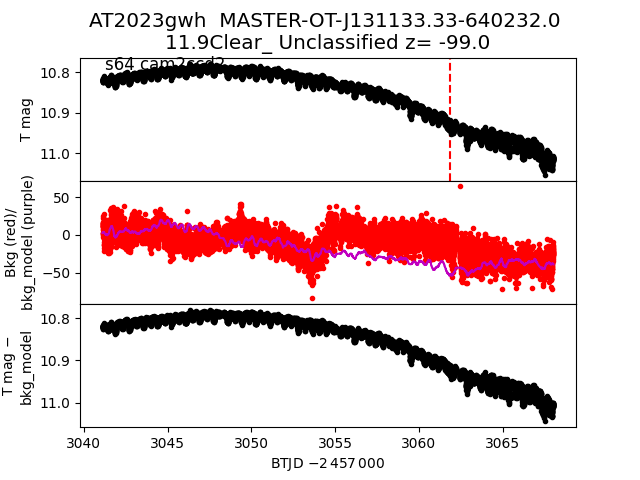
 2023gwh
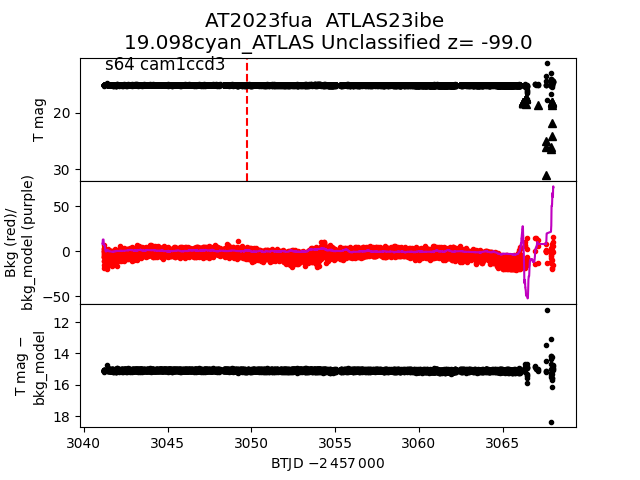
 2023fua
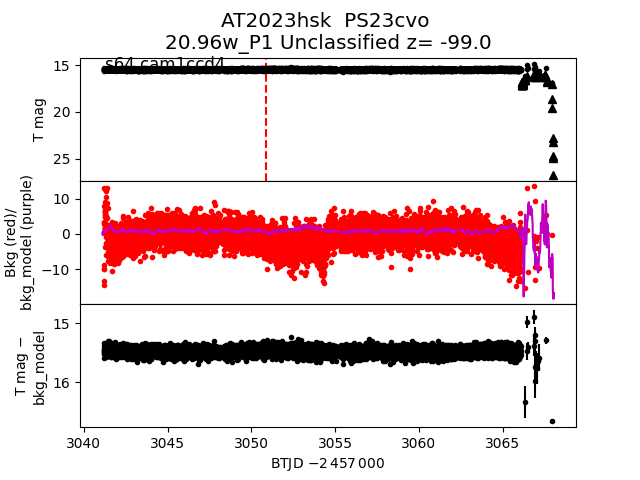
 2023hsk
 2023fud
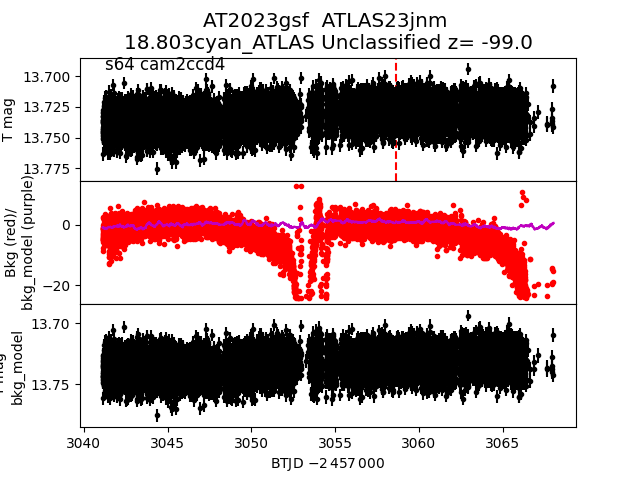
 2023gsf
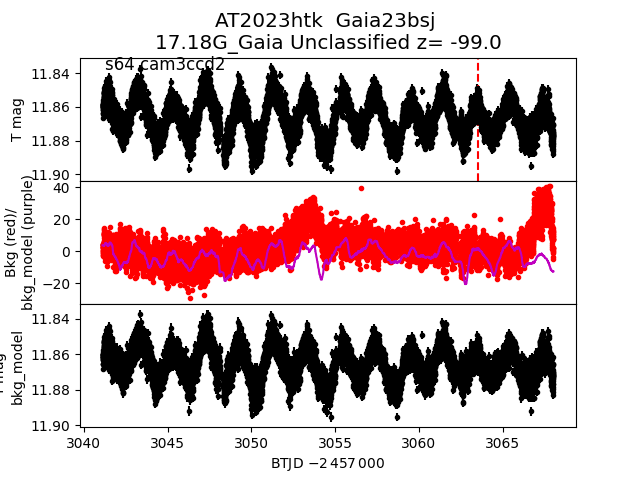
 2023htk
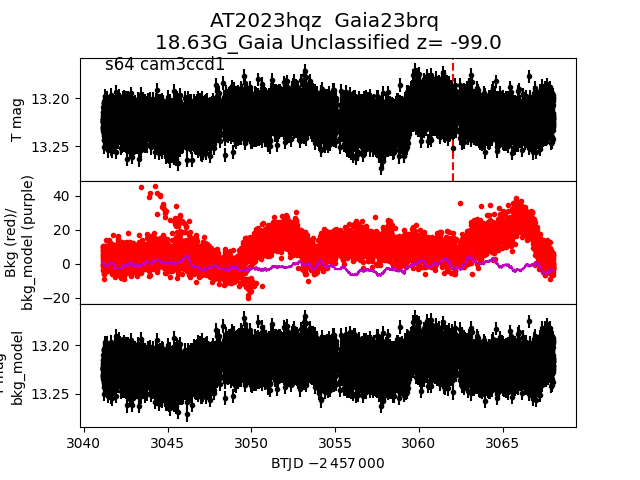
 2023hqz
 2023guj
 2023hvz
 2023gas
 2023hec
 2023fpc
 2023ied
 2023hdy
 2023gtp
 2023gss
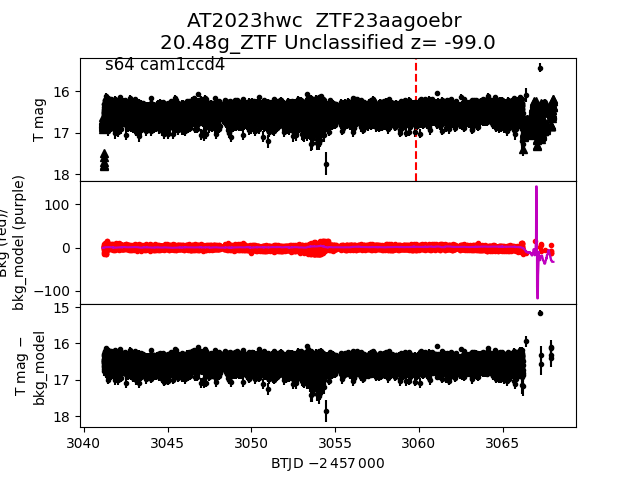
 2023hwc
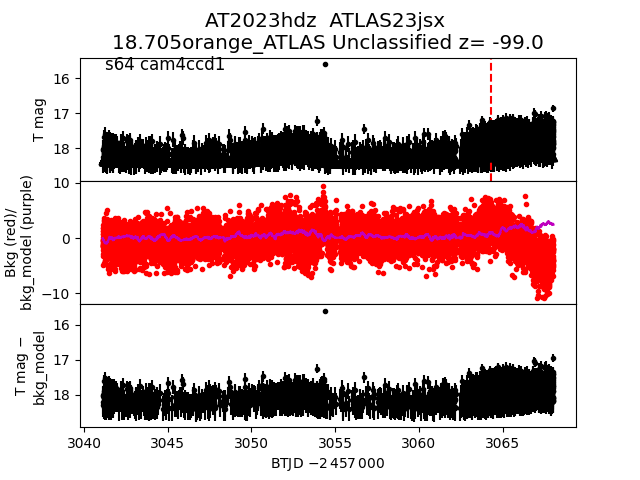
 2023hdz
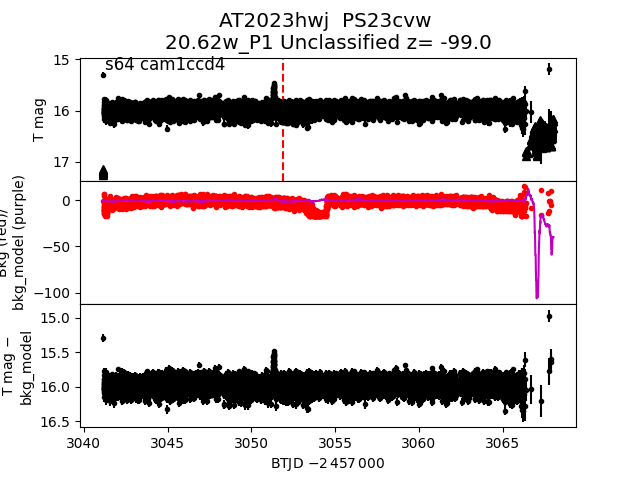
 2023hwj
 2023fqz
 2023hjr
 2023hka
 2023hdl
 2023hra
 2023hua
 2023fdj
 2023hiu
 2023fep
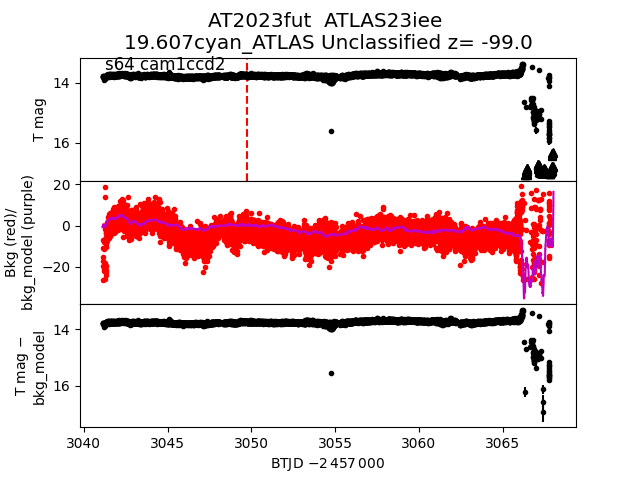
 2023fut
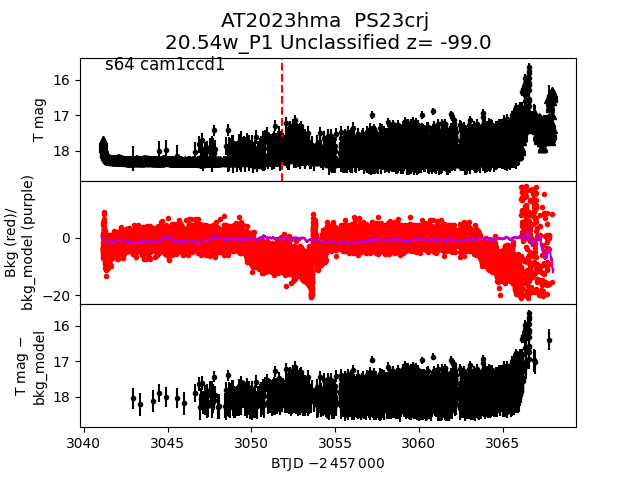
 2023hma
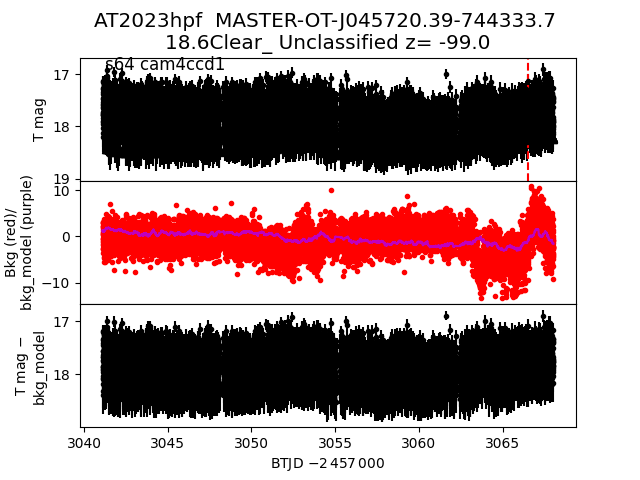
 2023hpf
 2023fpe
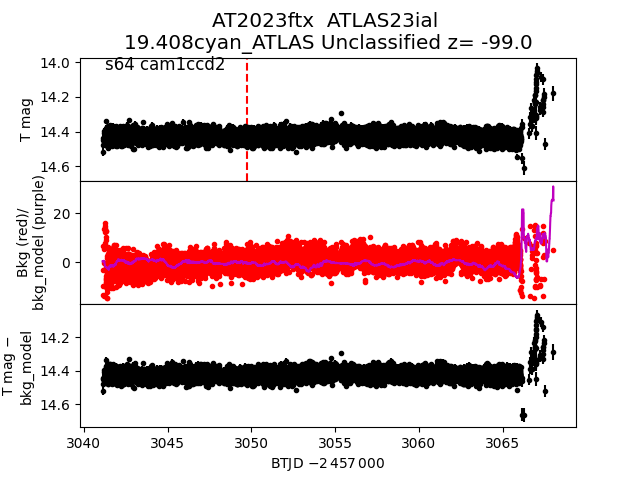
 2023ftx
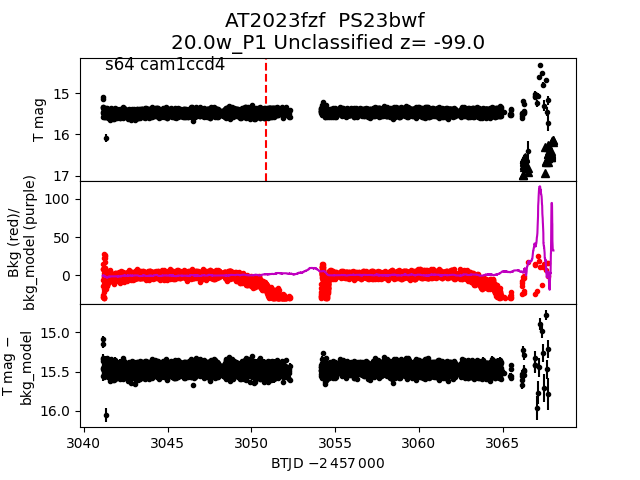
 2023fzf
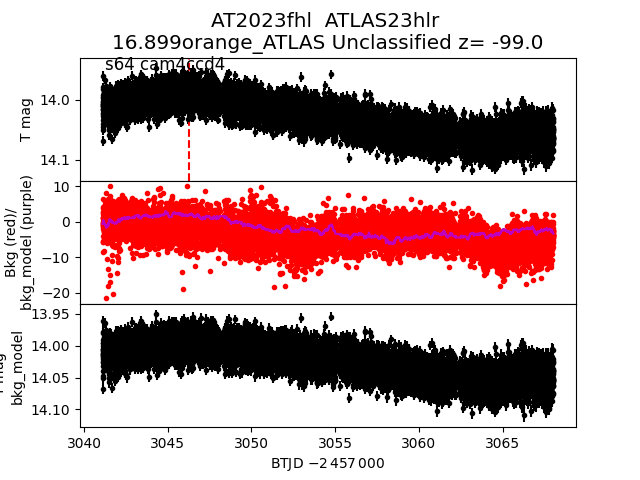
 2023fhl
 2023fol