all transients in sector63 (91 total)
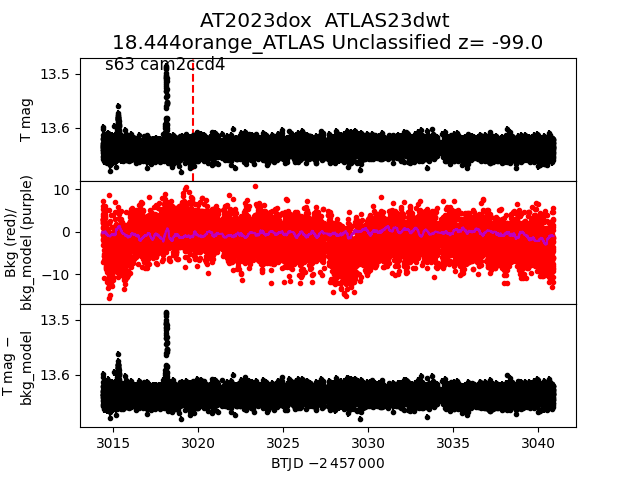
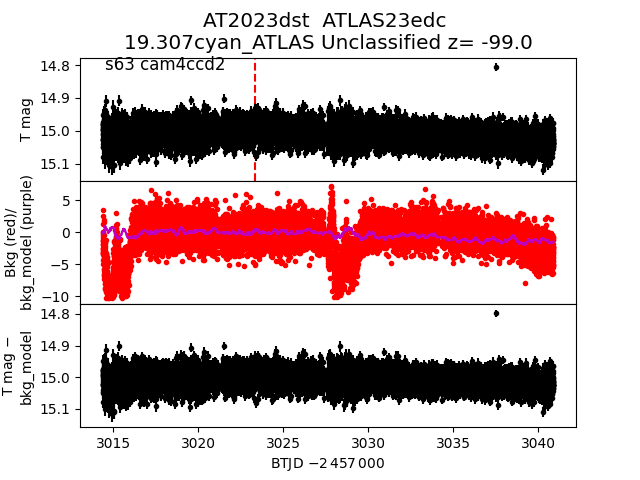
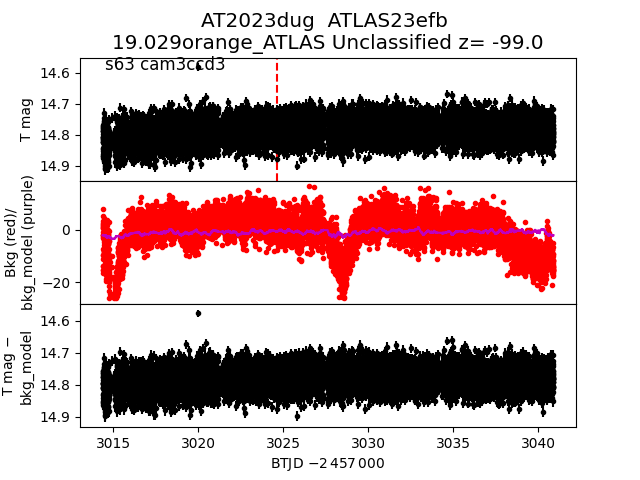
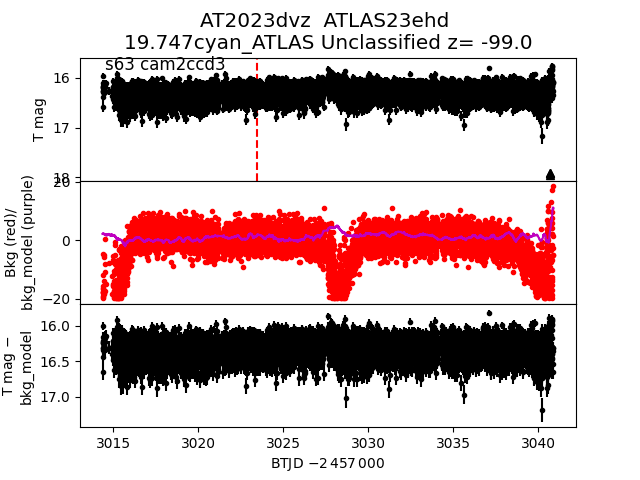
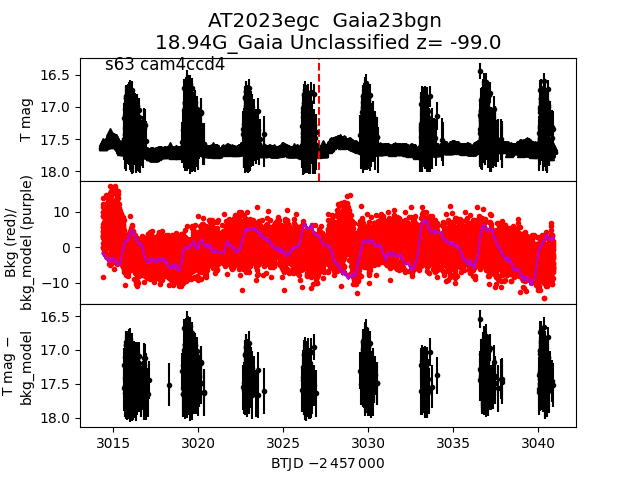
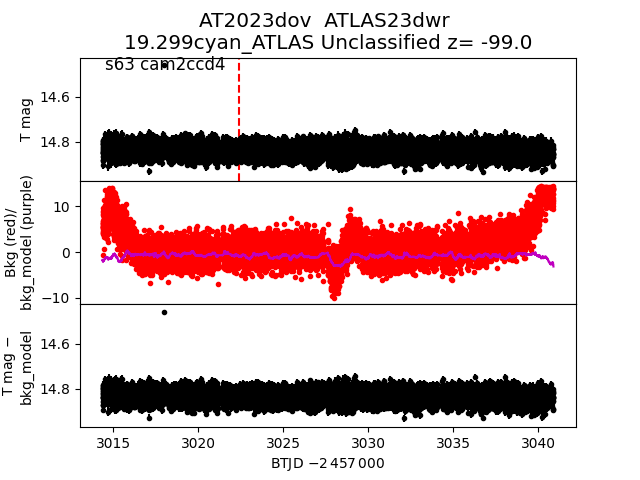
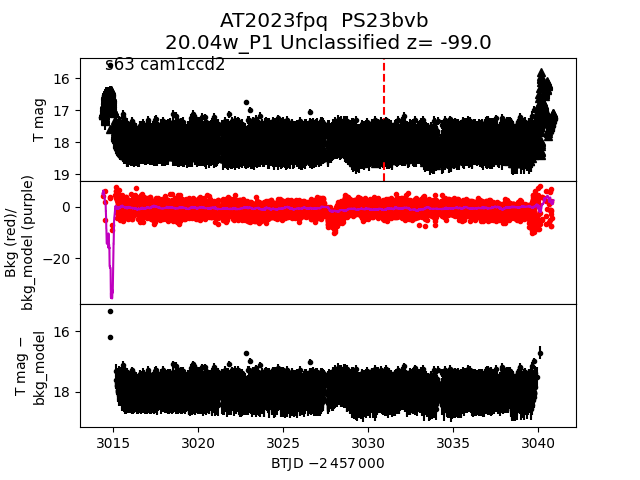
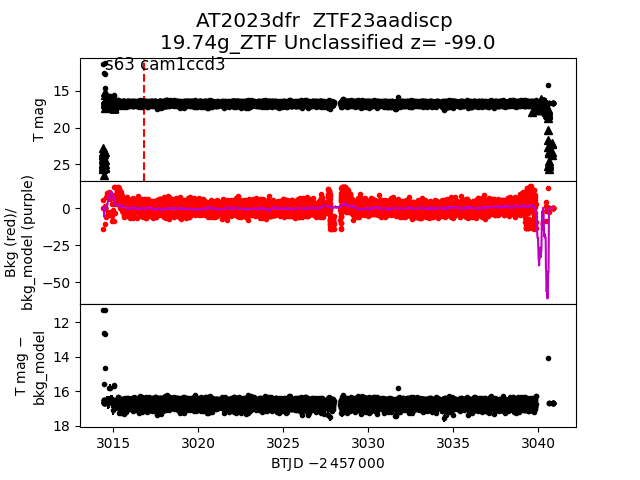
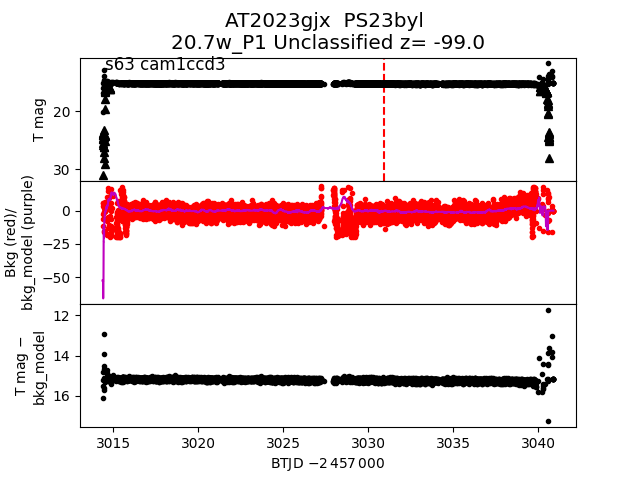
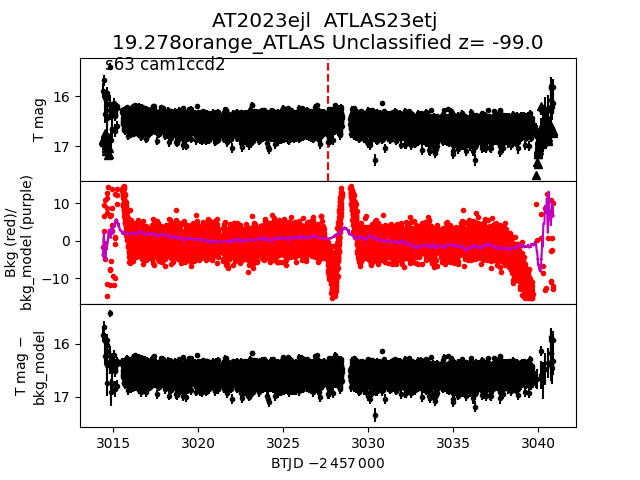
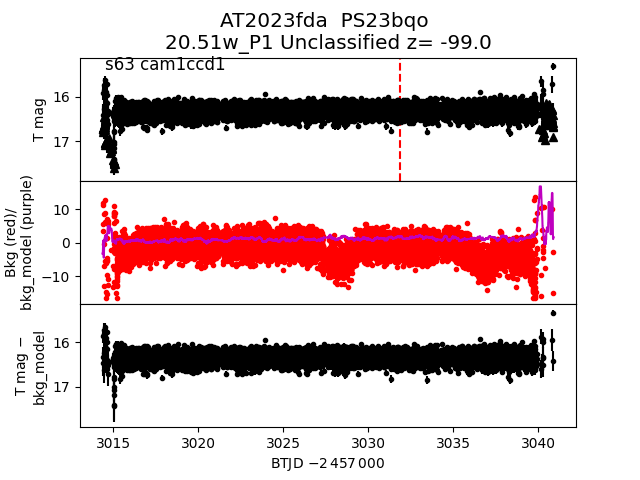
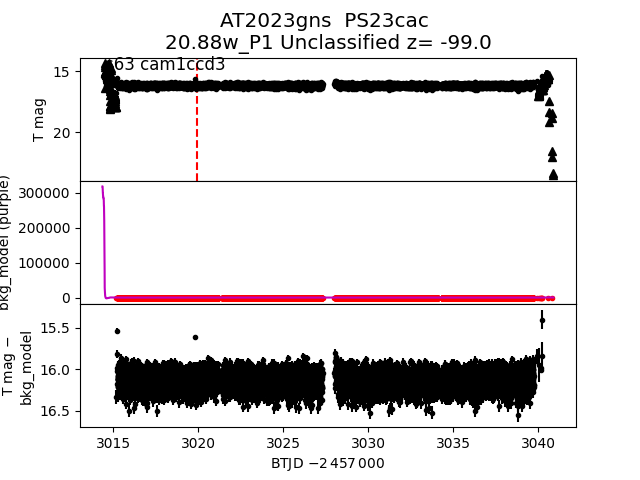
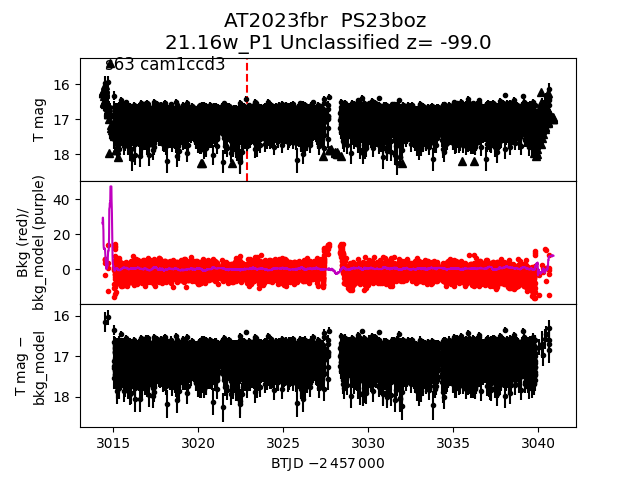
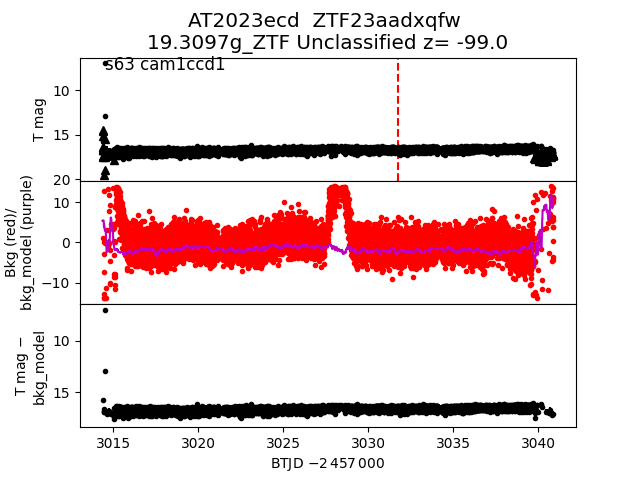
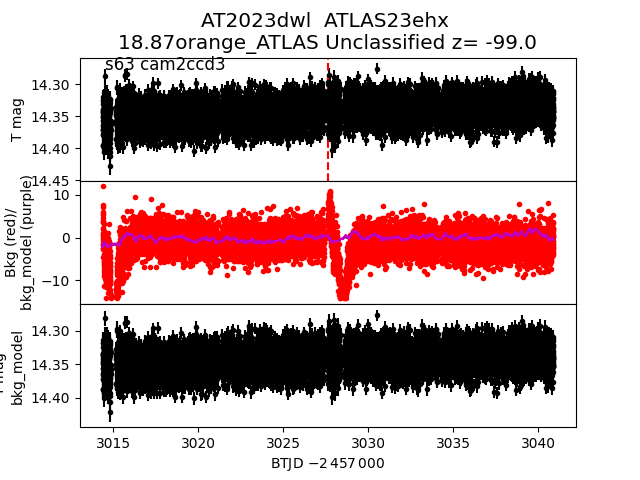
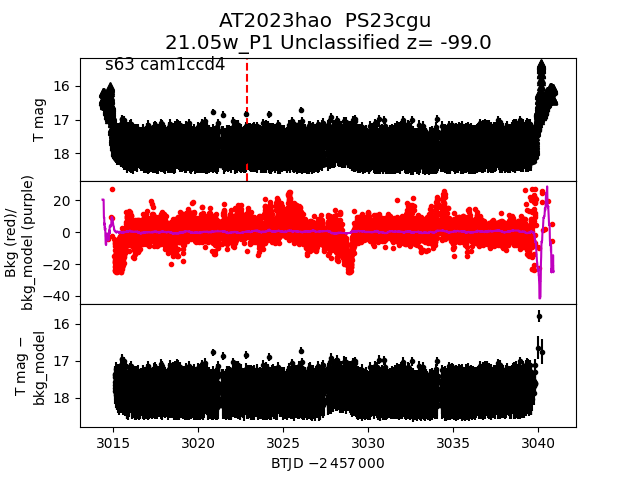
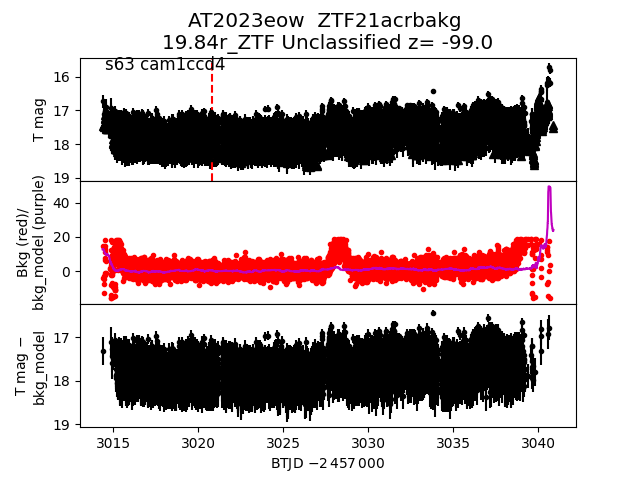
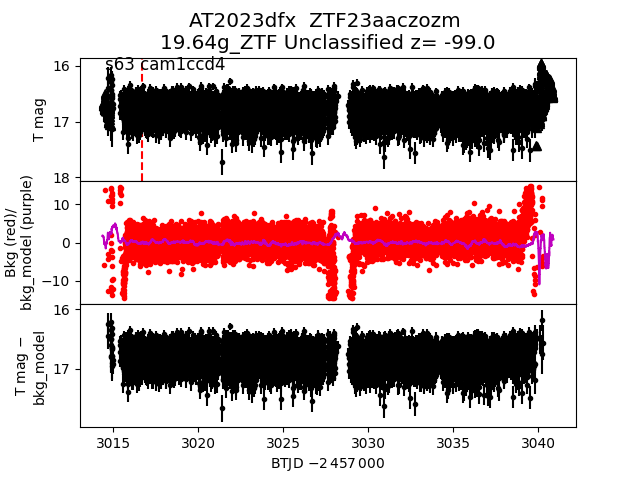
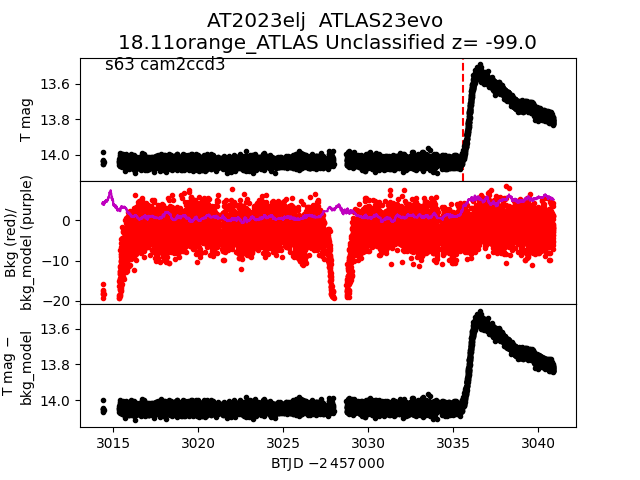
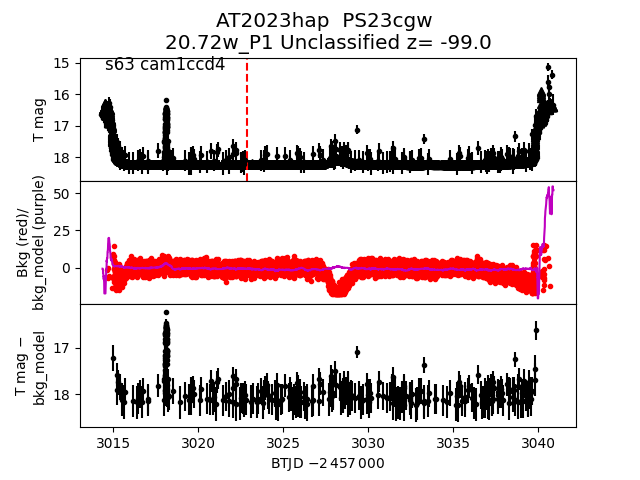
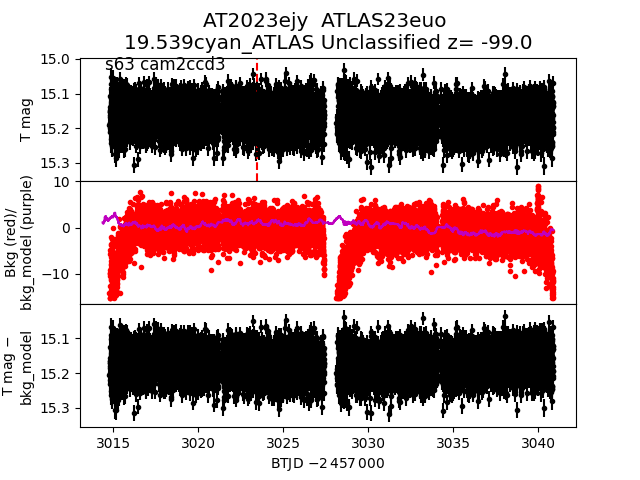
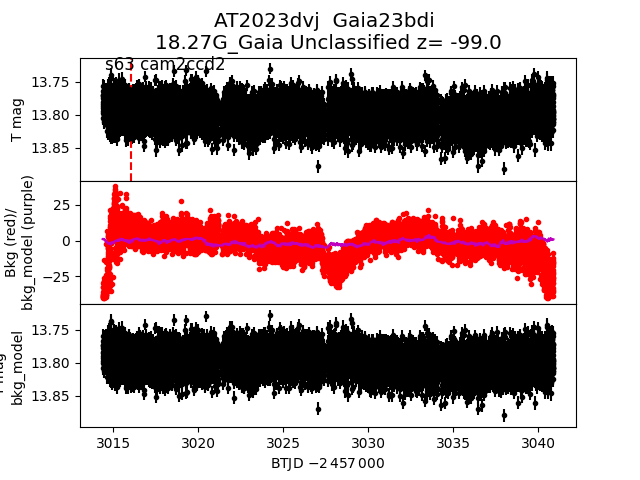
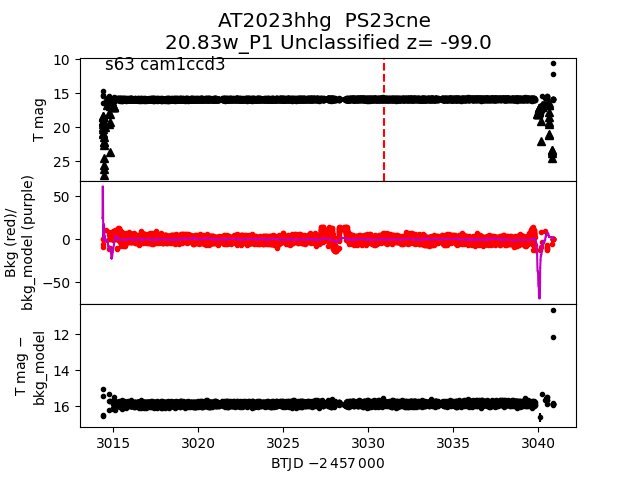
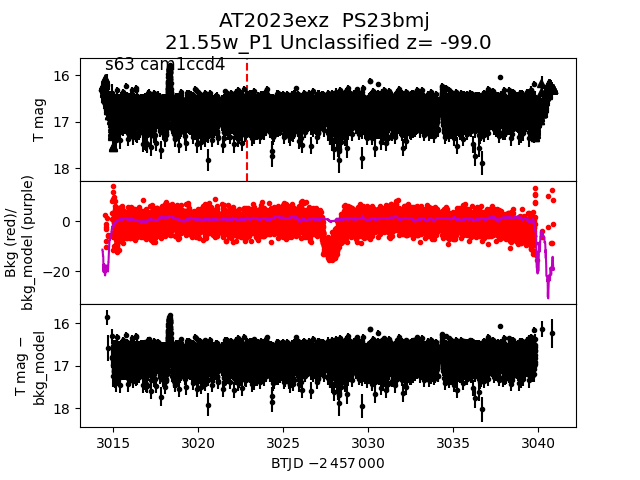
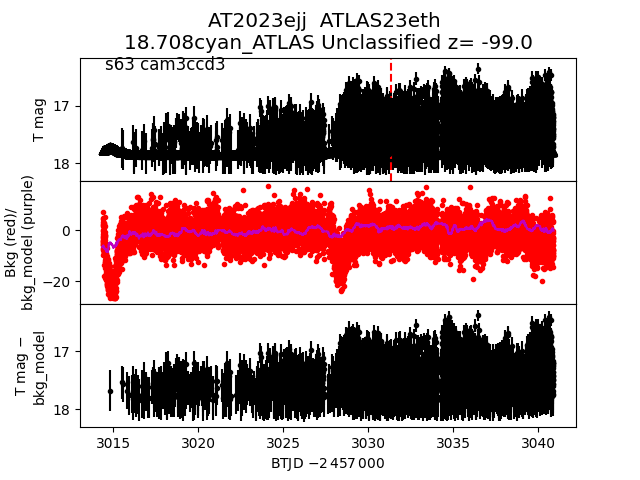
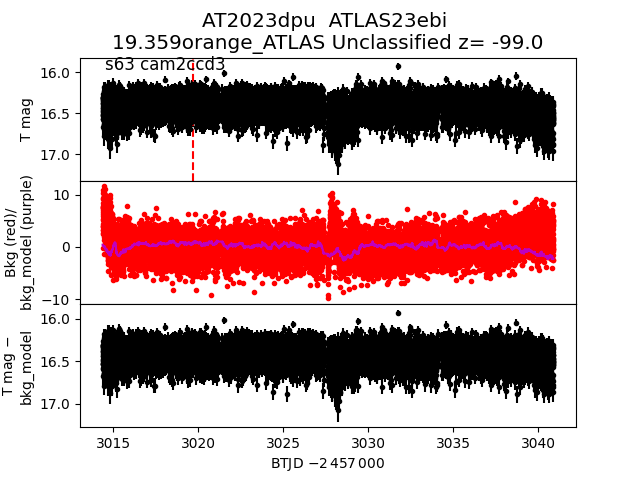
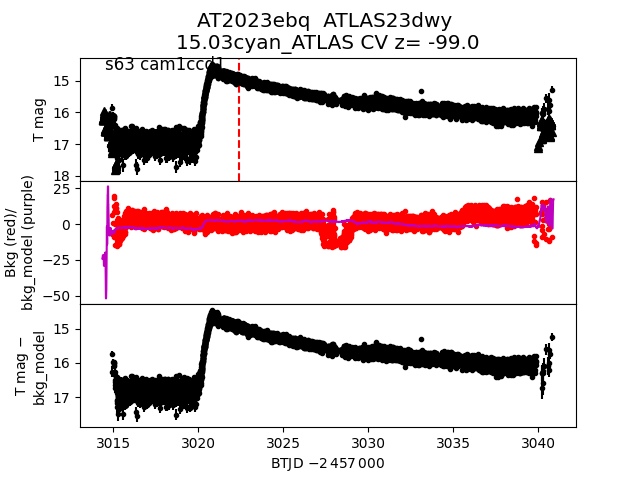
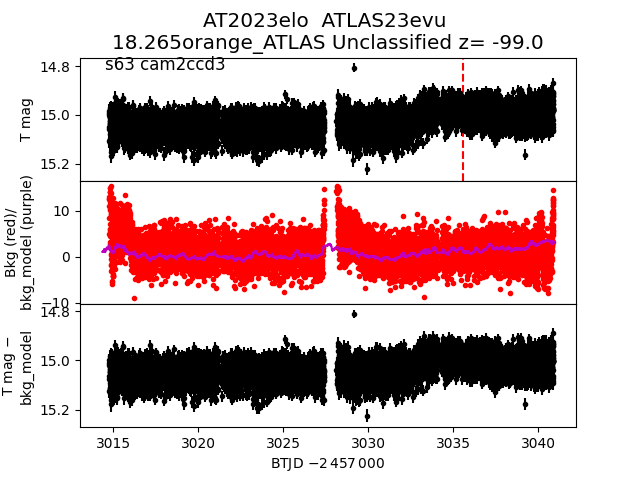
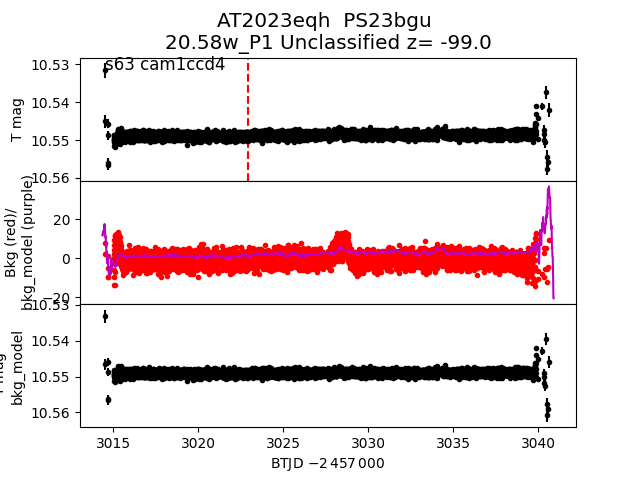
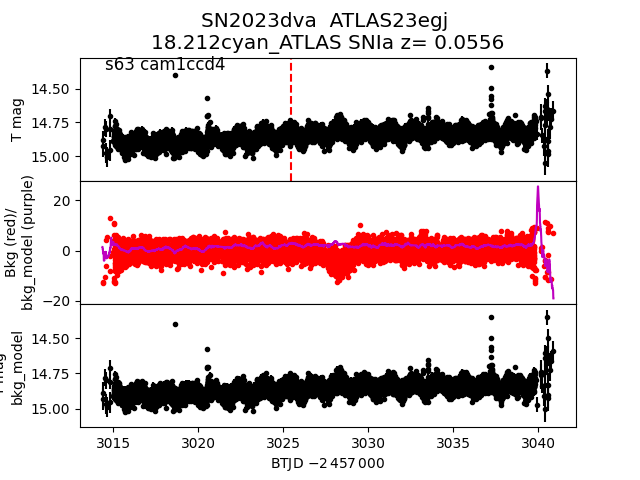
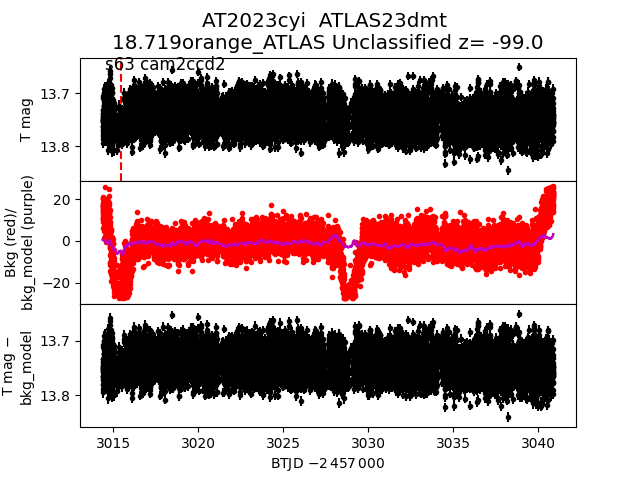
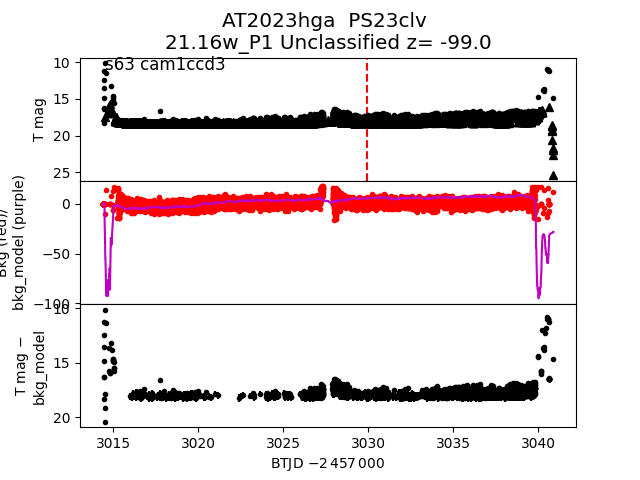
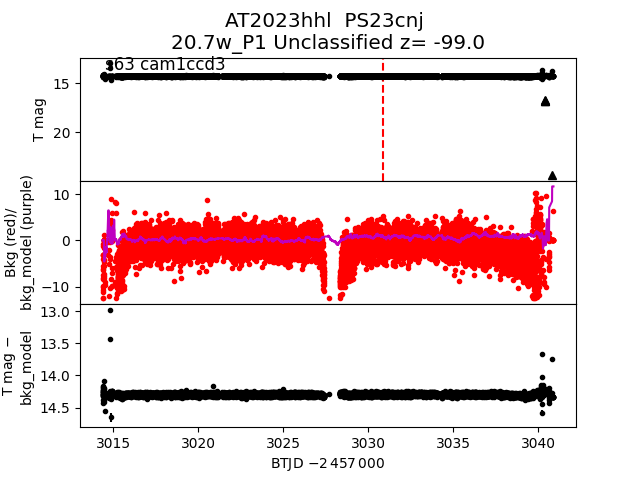
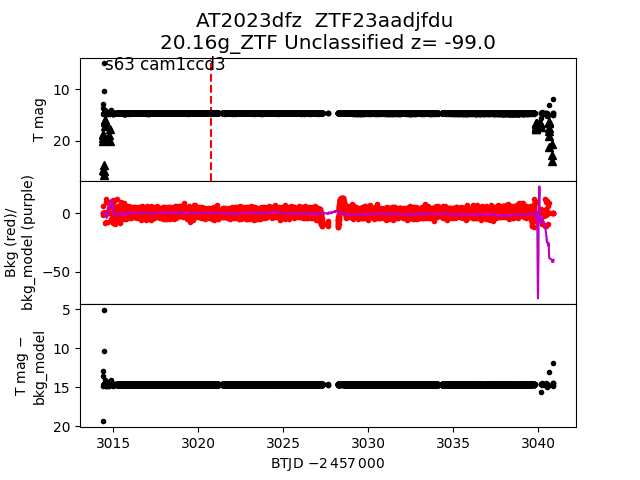
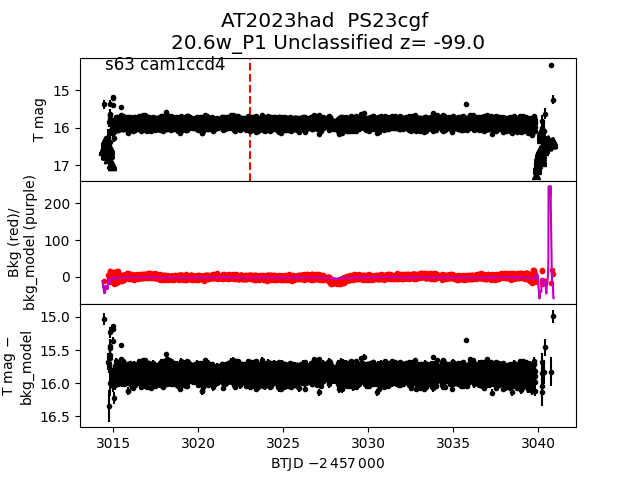
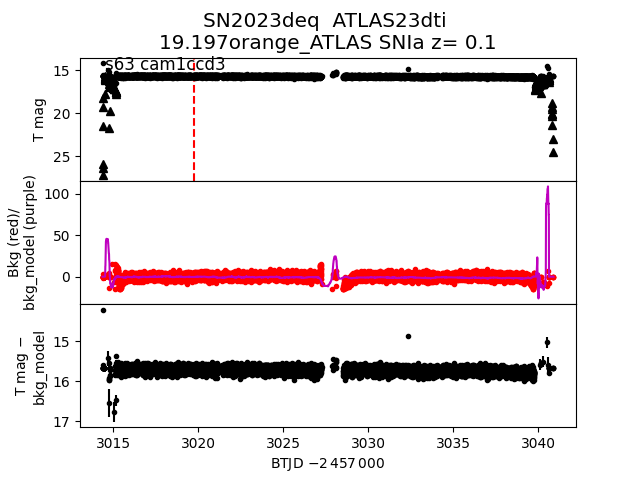
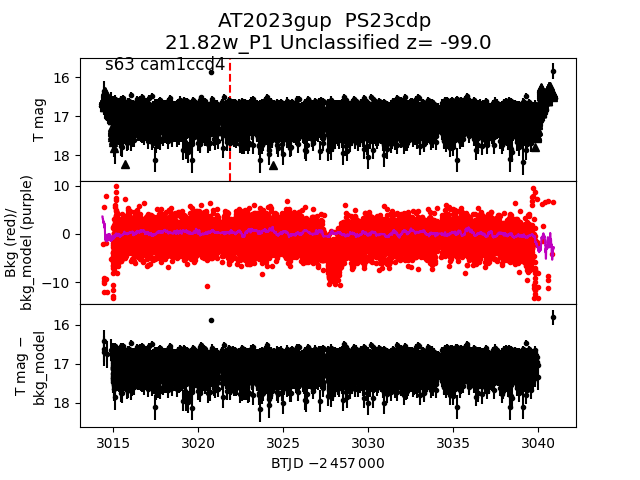
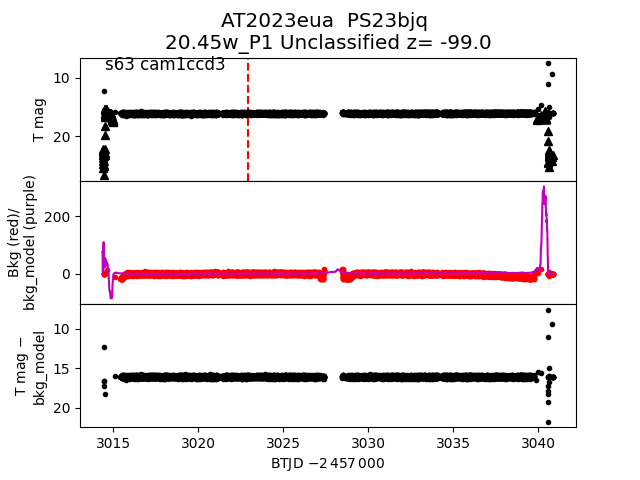
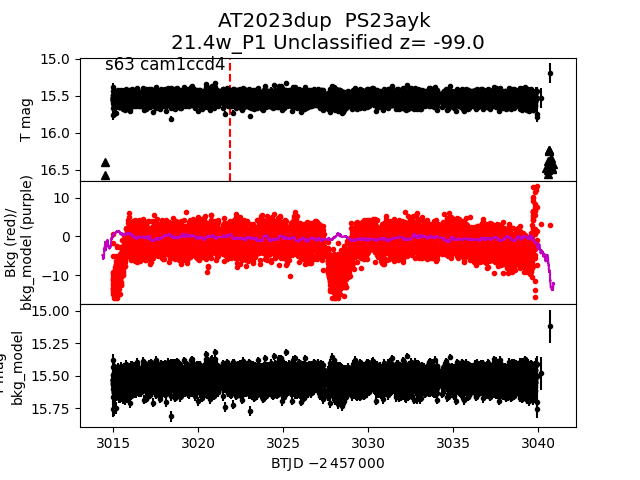
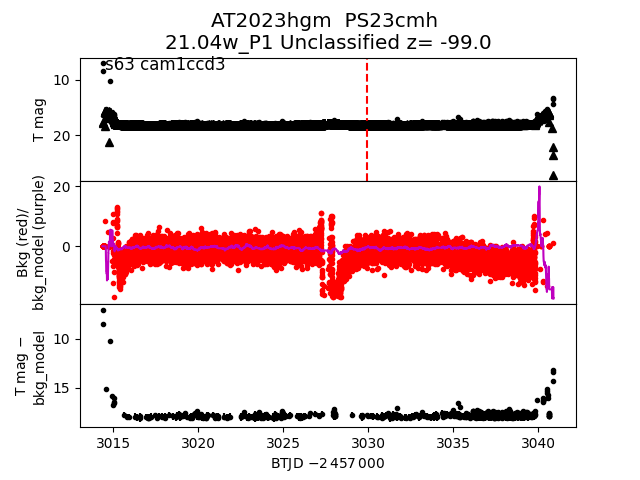
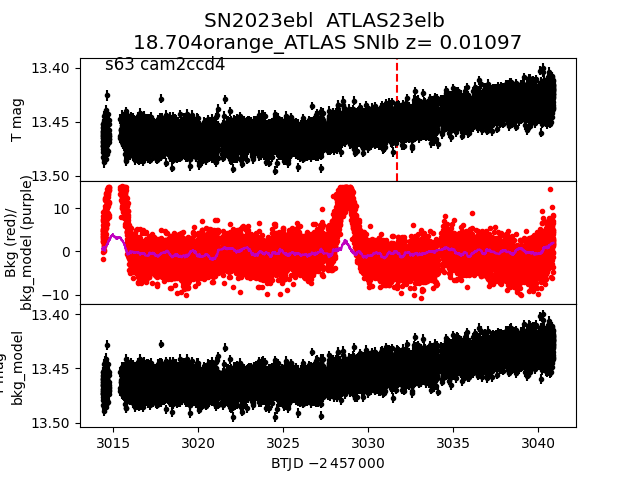
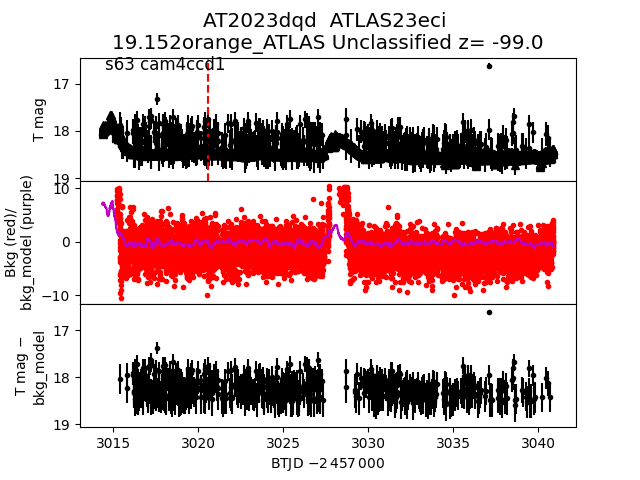
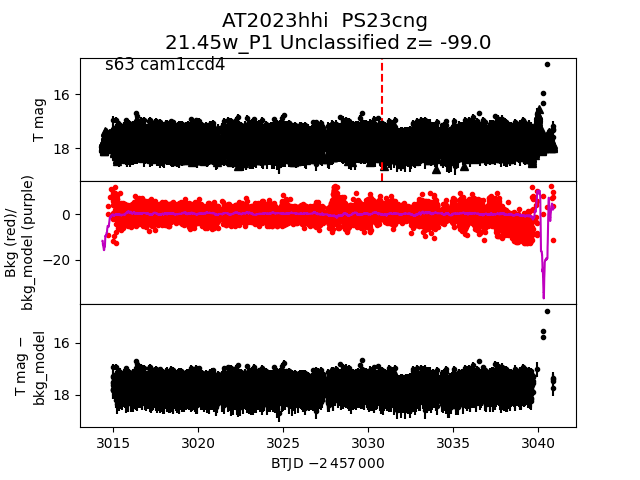
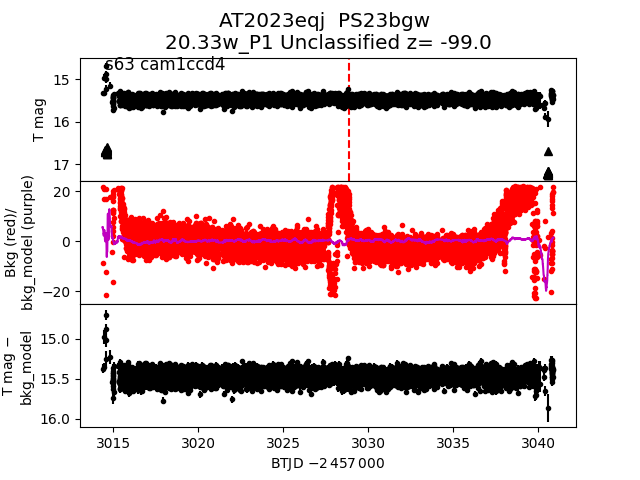
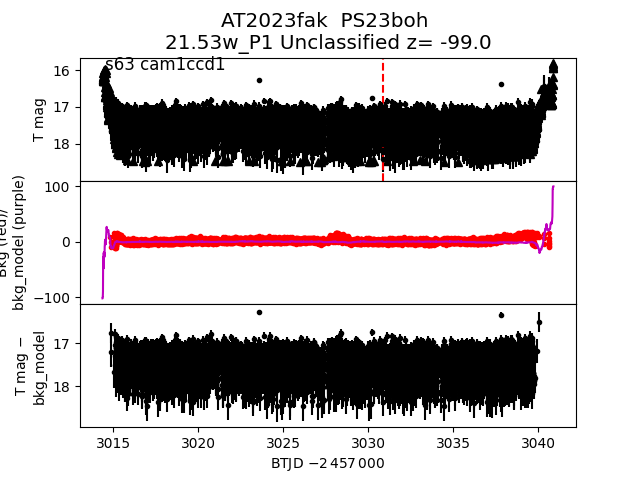
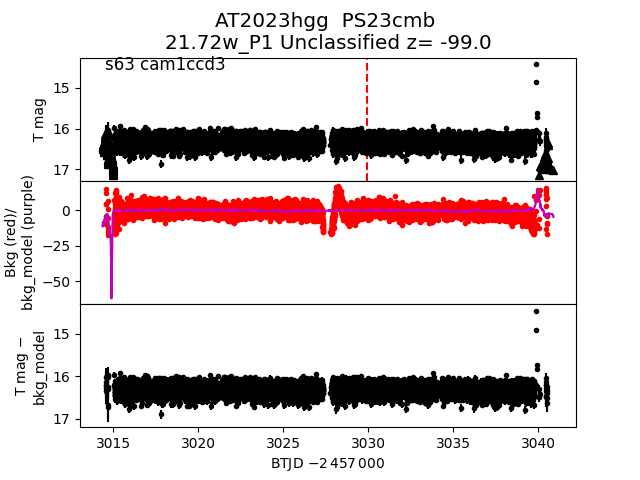
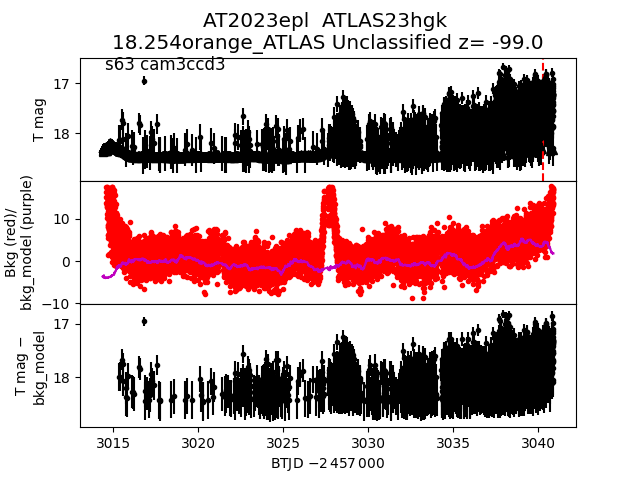
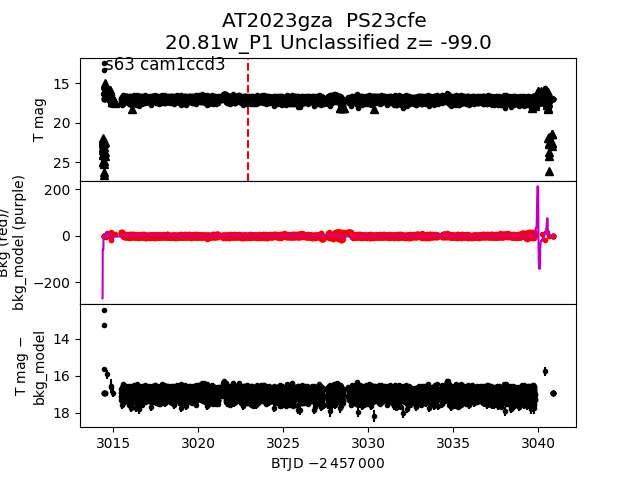
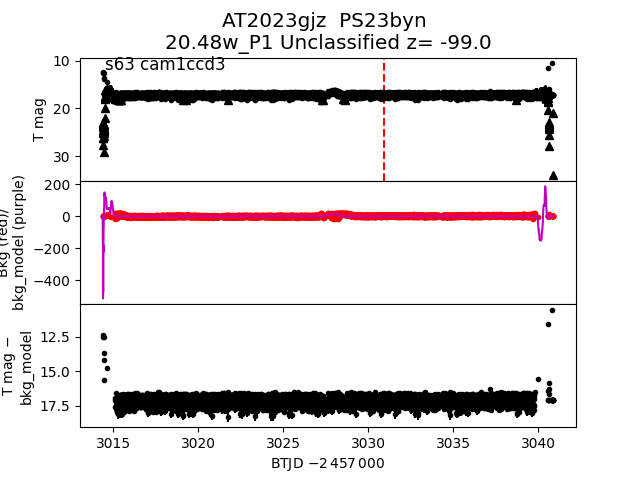
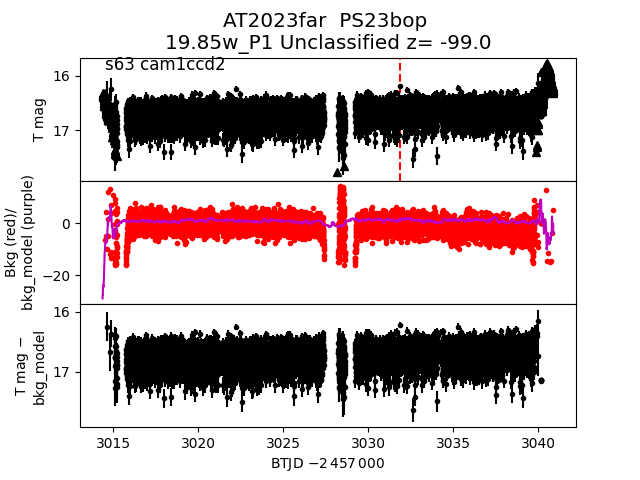
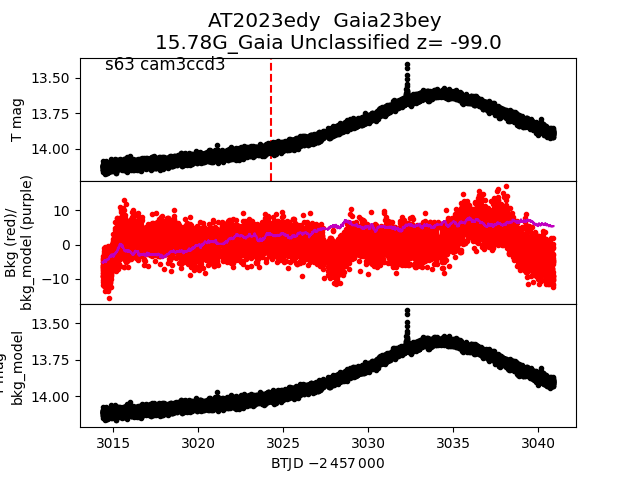
Each figure has three panels. The top panel shows the transient light curve, the middle panel shows the local background (estimated in an annulus), and the bottom panel shows a "background-model corrected" light curve. Details about the background model are in the README.
The vertical red line marks the time of discovery reported to TNS. Other useful metadata from TNS is in the figure title.
Note that the top and bottom panel are in magnitudes, while the middle panel is in differential flux units. The magnitudes are calibrated to the flux in the reference image used for image subtraction. Thus, flux from the host galaxy is included in these magnitudes.
3-sigma upper limits are plotted as triangles with no errorbars. A typical limiting magnitude is 19.6 in 30 minutes or 18.4 in 200 seconds (for low backgrounds).
The links allow you to download the light curve data as a text file.
More details in the README.
2023dst
 2023dug
 2023dvz
 2023egc
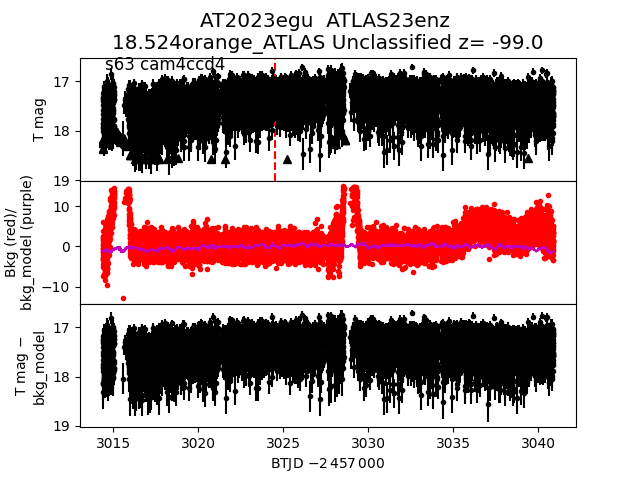
 2023egu
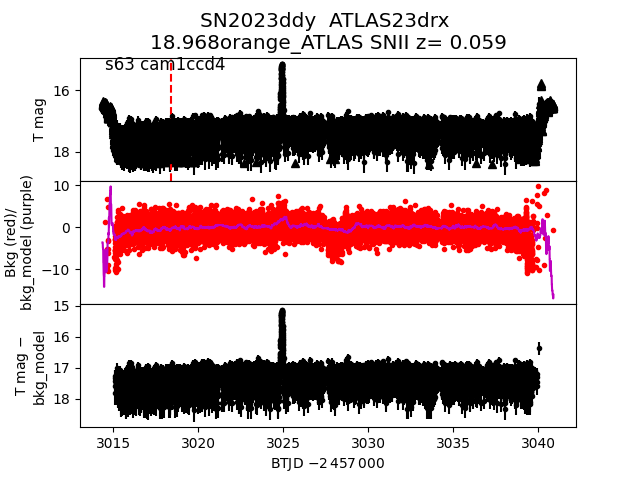
 2023ddy
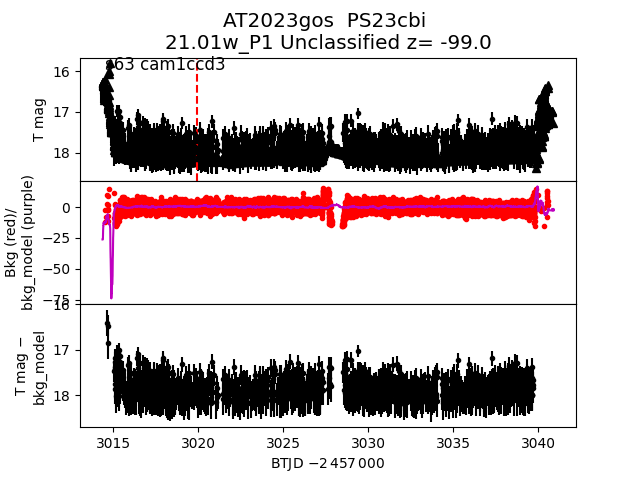
 2023gos
 2023dov
 2023fpq
 2023dfr
 2023gjx
 2023ejl
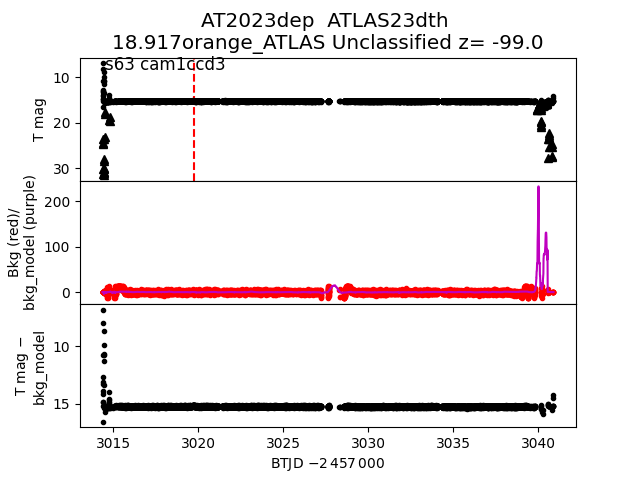
 2023dep
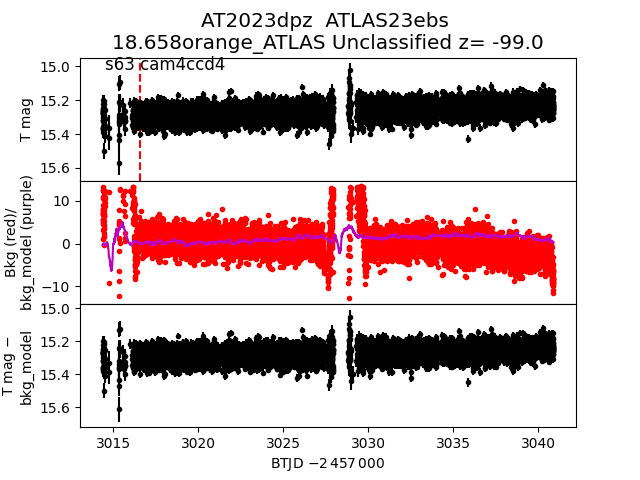
 2023dpz
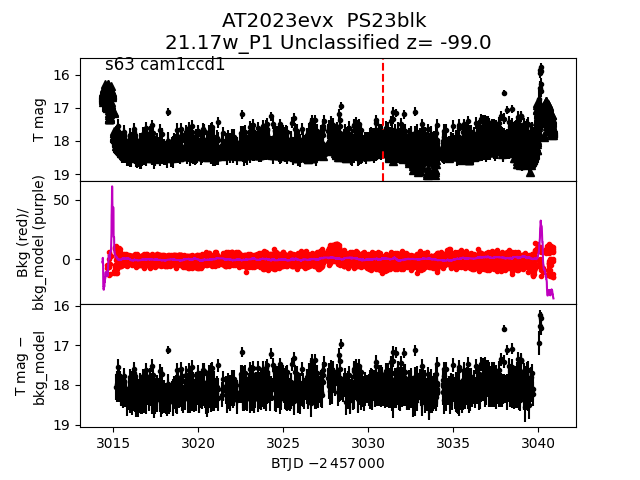
 2023evx
 2023fda
 2023gns
 2023fbr
 2023ecd
 2023dwl
 2023hao
 2023eow
 2023dfx
 2023elj
 2023hap
 2023ejy
 2023dvj
 2023hhg
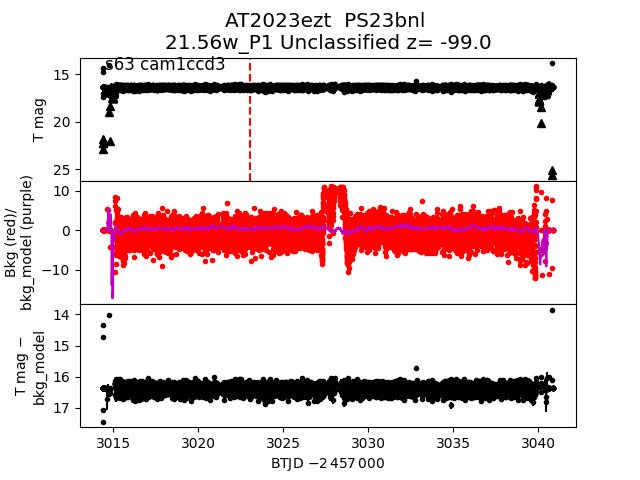
 2023ezt
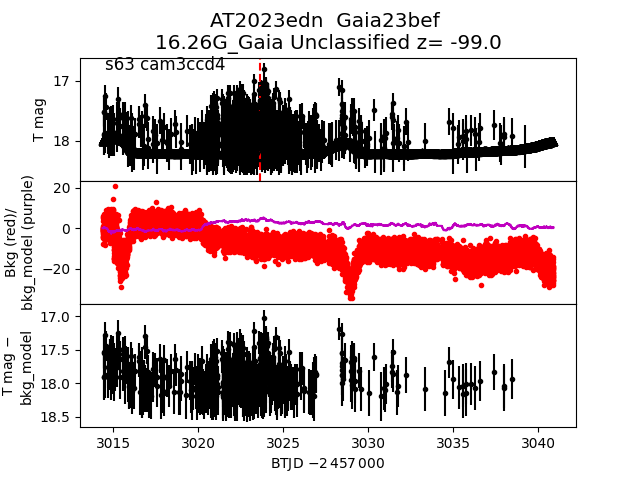
 2023edn
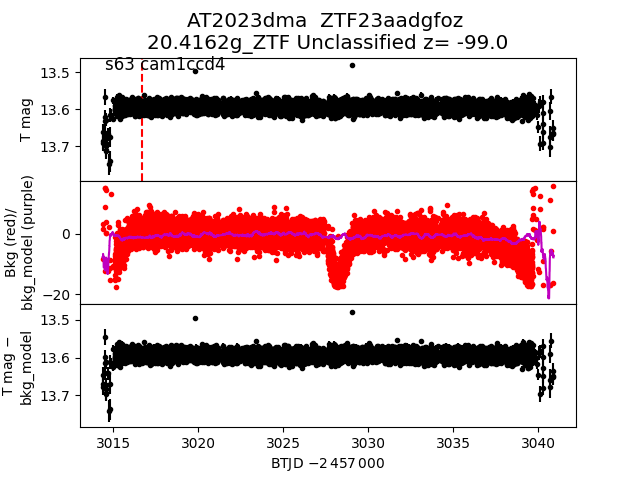
 2023dma
 2023exz
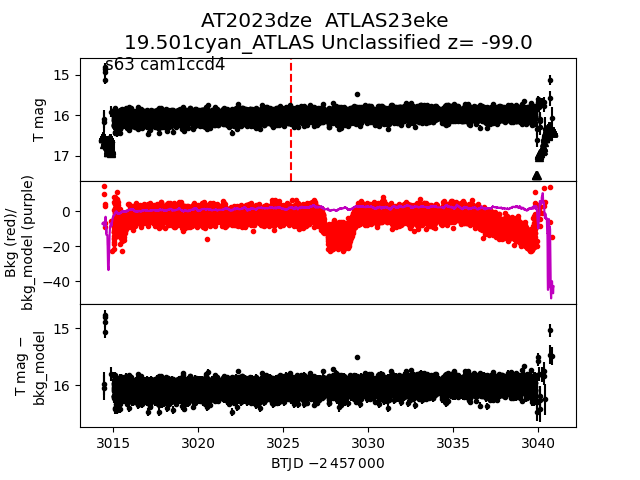
 2023dze
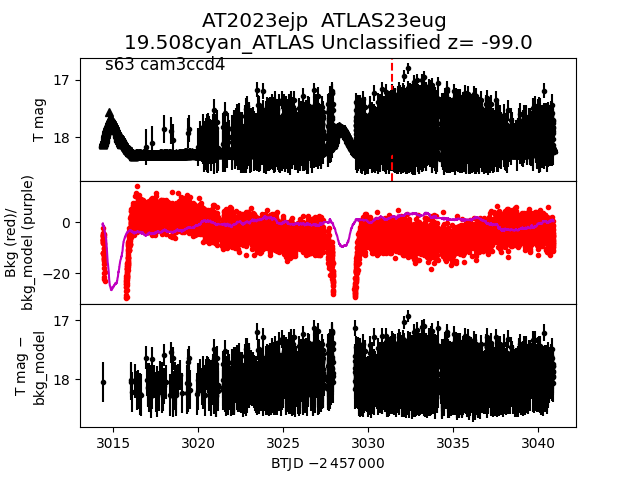
 2023ejp
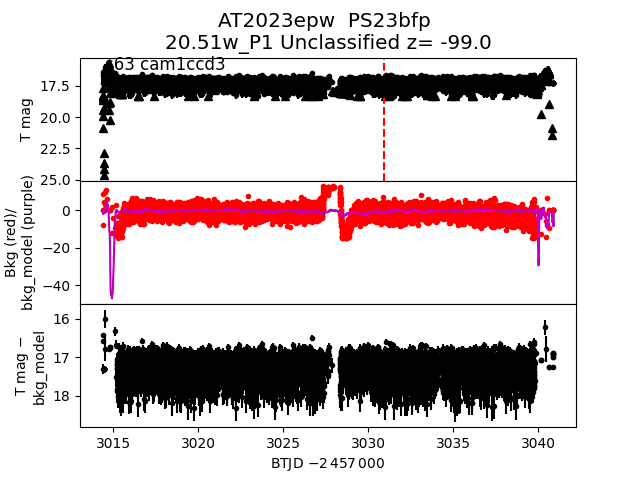
 2023epw
 2023ejj
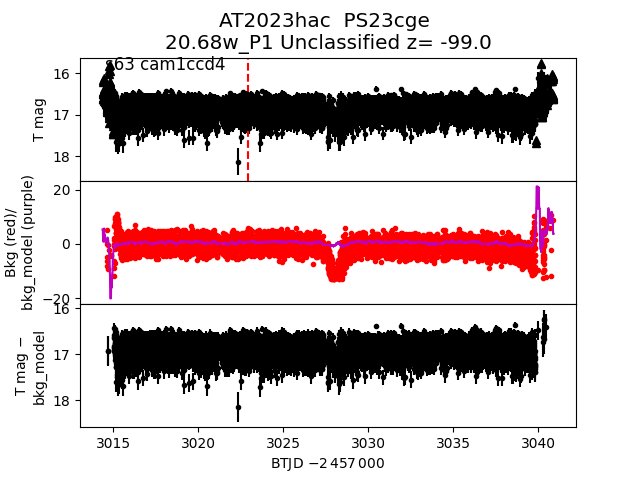
 2023hac
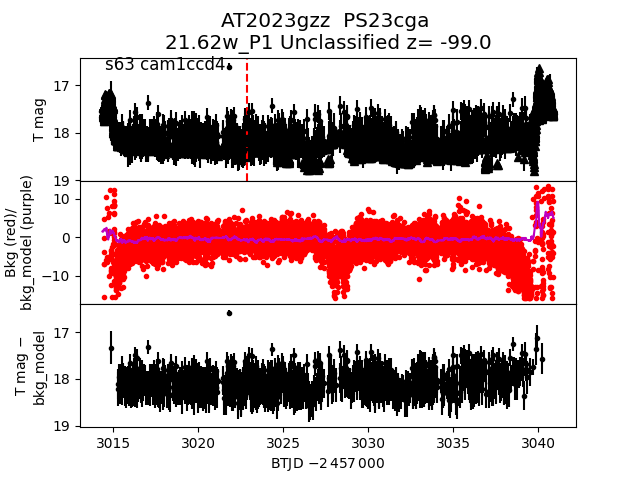
 2023gzz
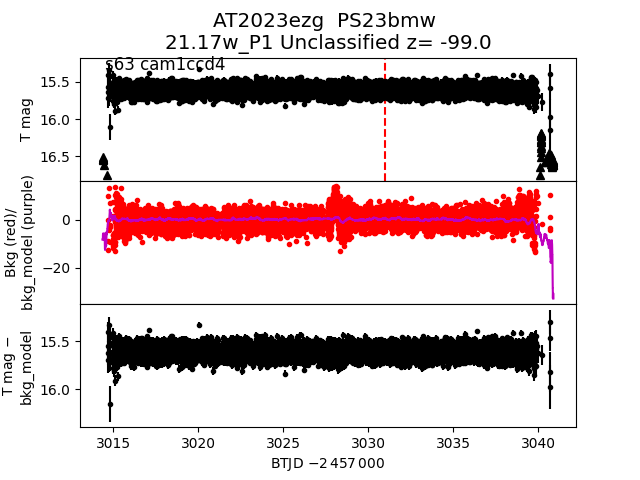
 2023ezg
 2023dpu
 2023ebq
 2023elo
 2023eqh
 2023dva
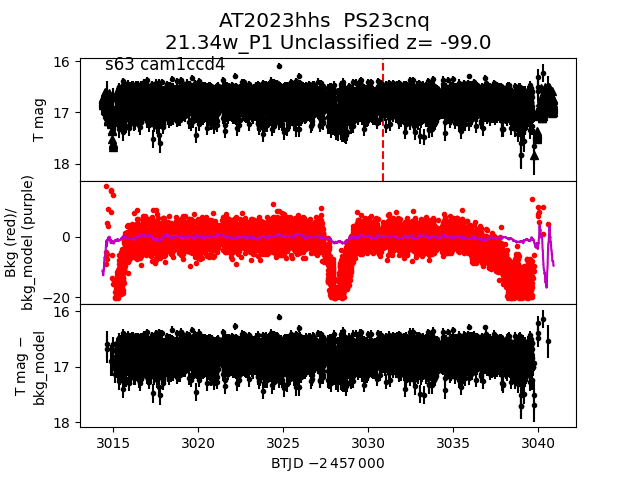
 2023hhs
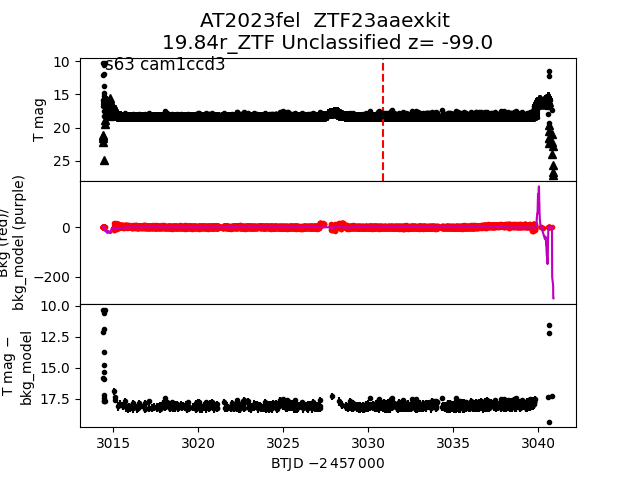
 2023fel
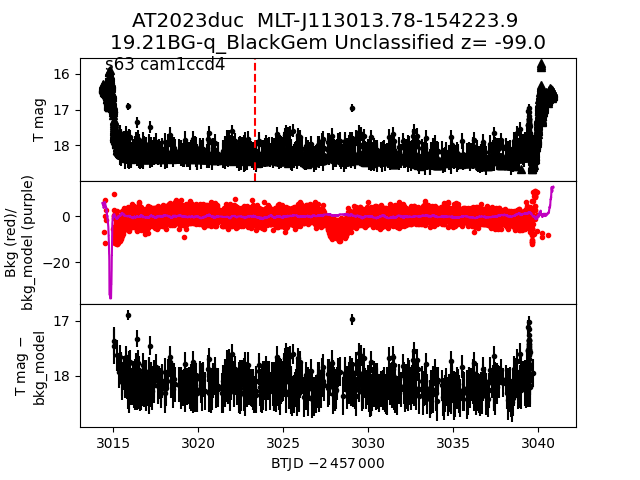
 2023duc
 2023cyi
 2023hga
 2023hhl
 2023dfz
 2023had
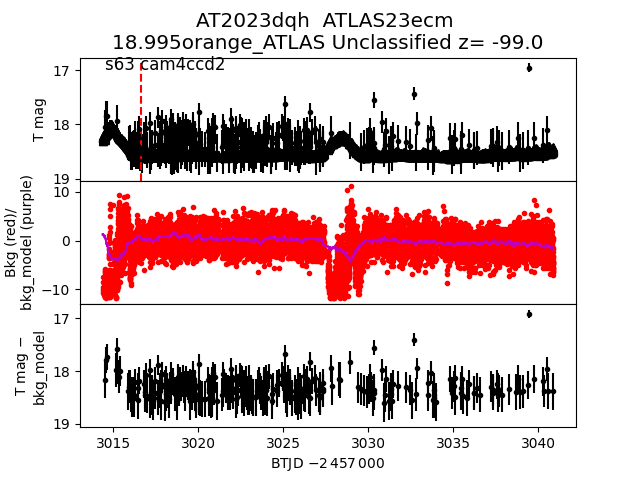
 2023dqh
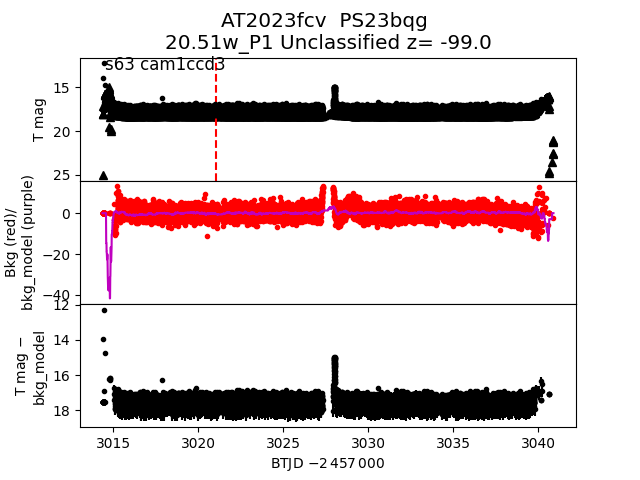
 2023fcv
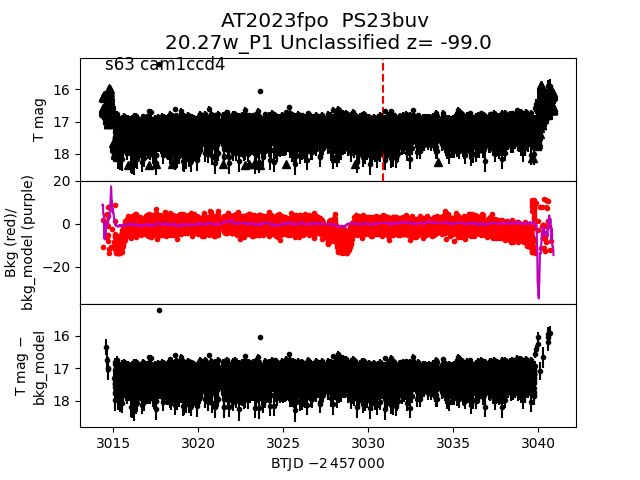
 2023fpo
 2023deq
 2023gup
 2023eua
 2023dup
 2023hgm
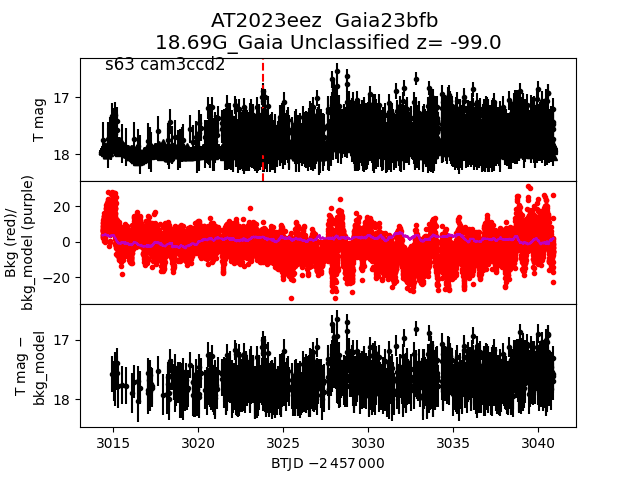
 2023eez
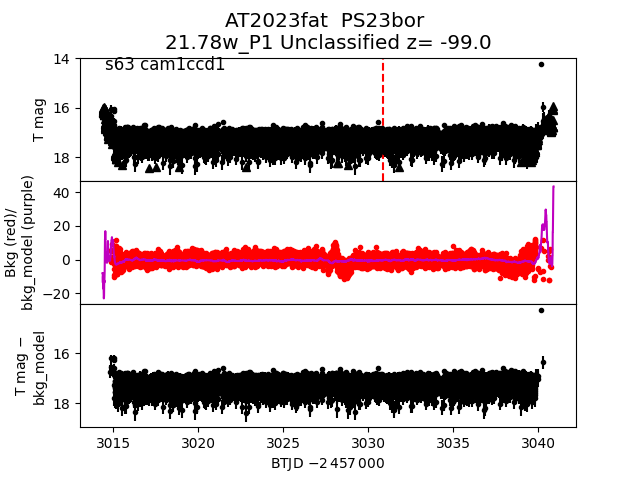
 2023fat
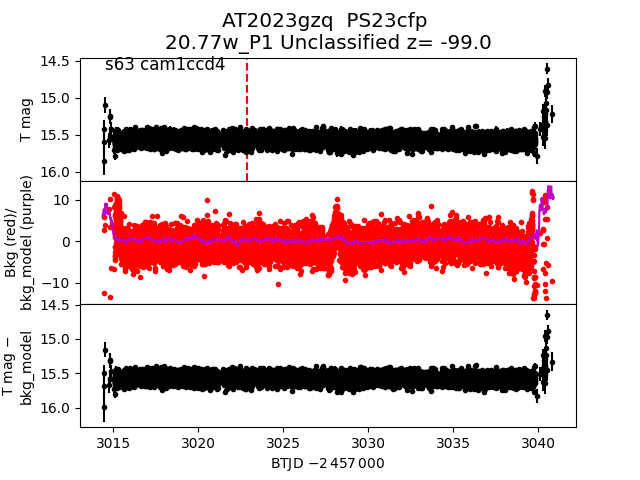
 2023gzq
 2023ebl
 2023dqd
 2023hhi
 2023eqj
 2023fak
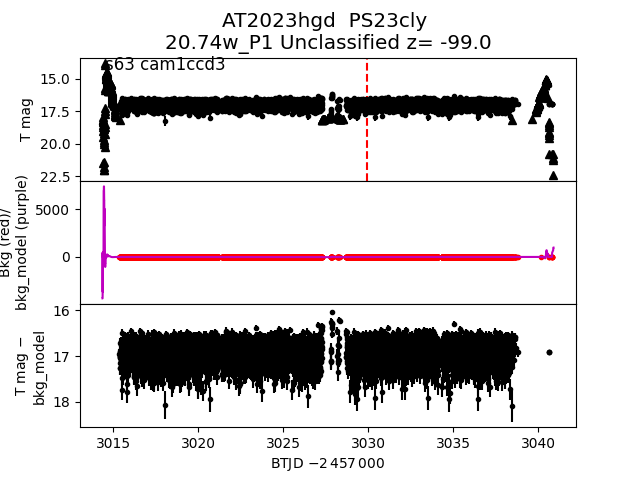
 2023hgd
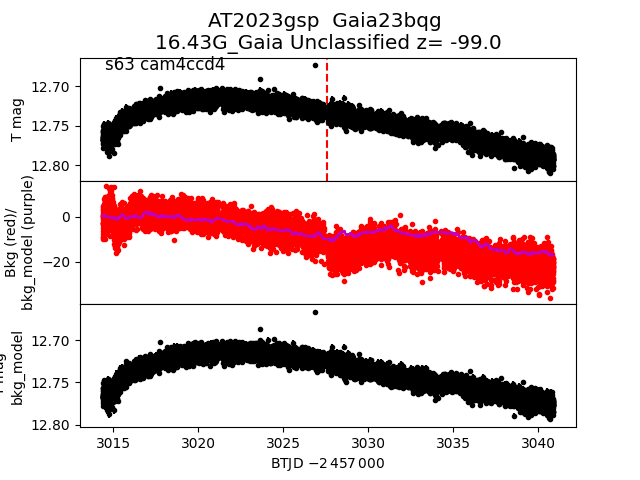
 2023gsp
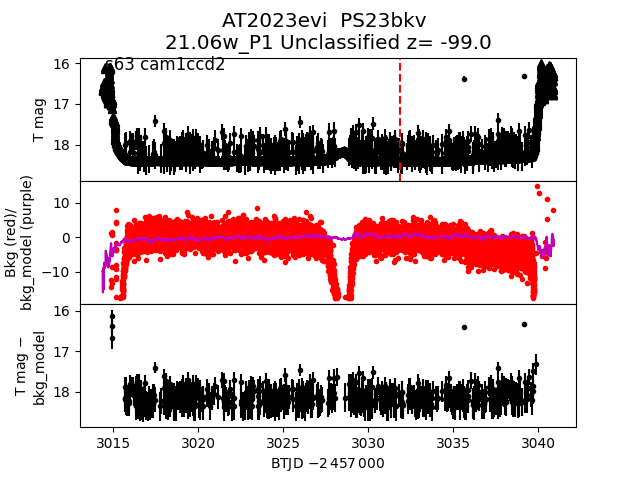
 2023evi
 2023hgg
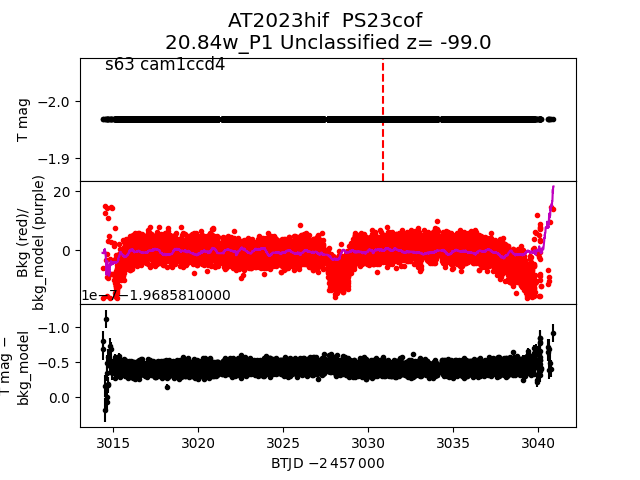
 2023hif
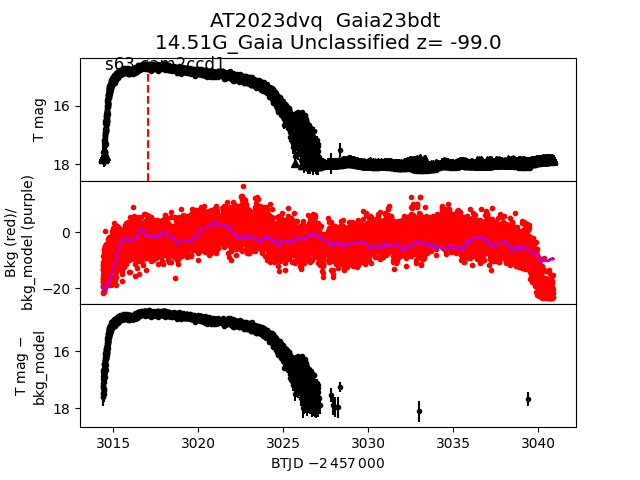
 2023dvq
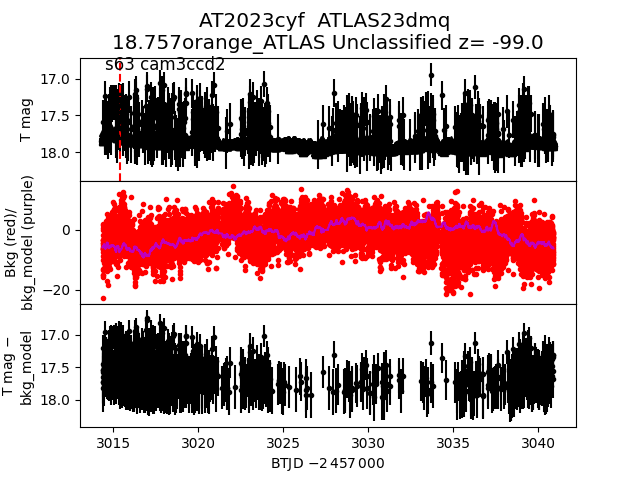
 2023cyf
 2023epl
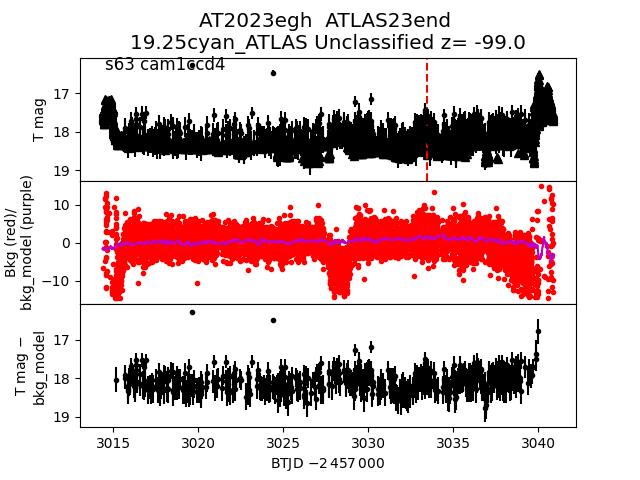
 2023egh
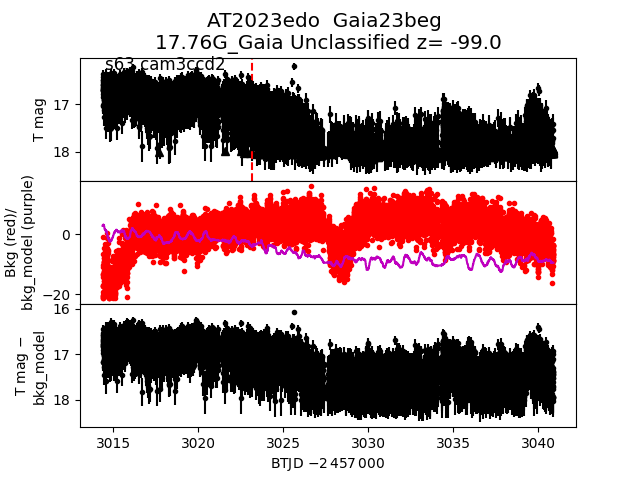
 2023edo
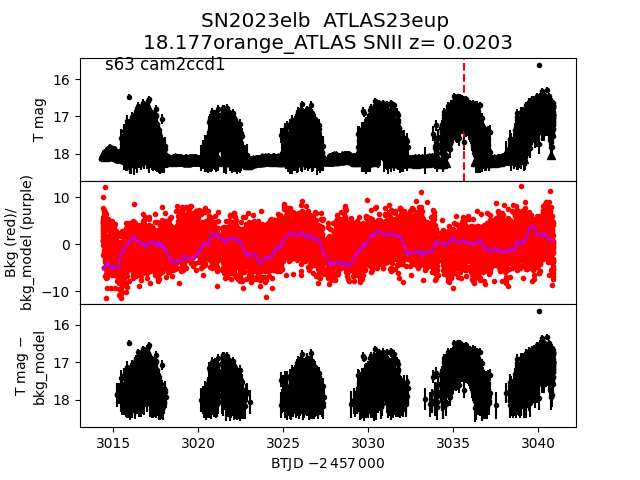
 2023elb
 2023gza
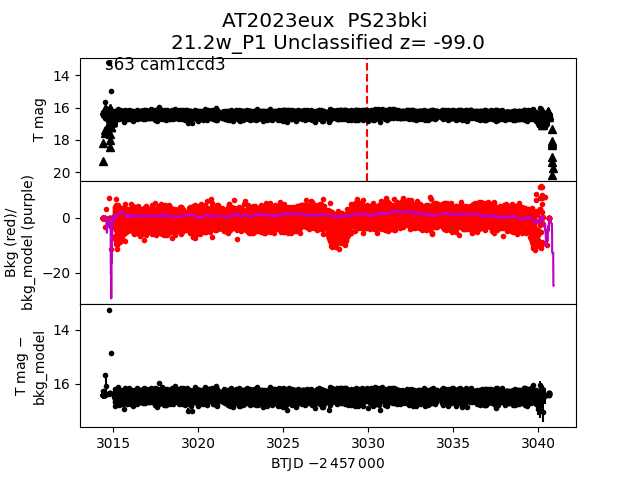
 2023eux
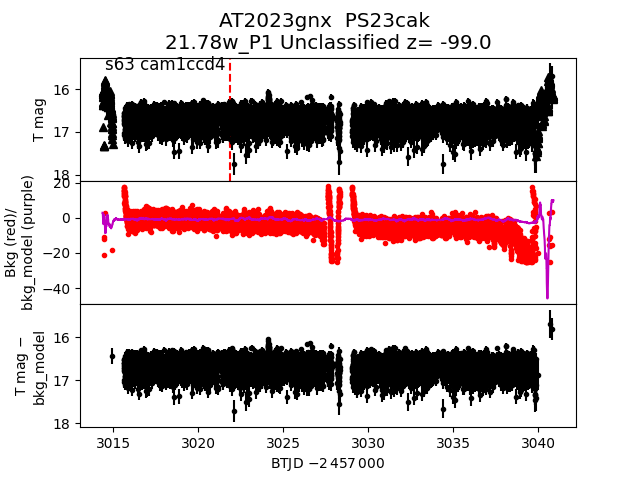
 2023gnx
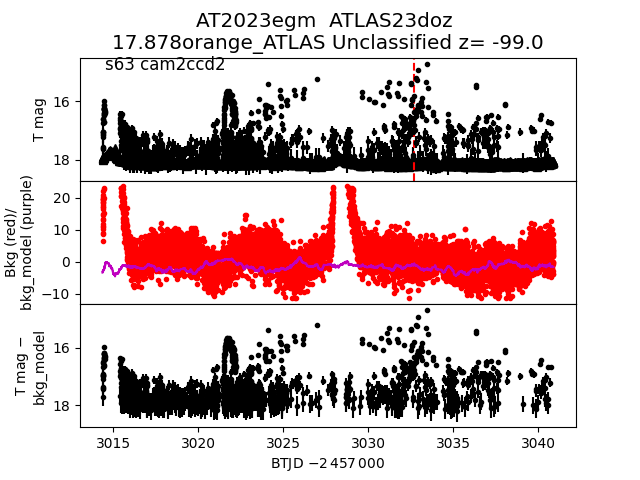
 2023egm
 2023gjz
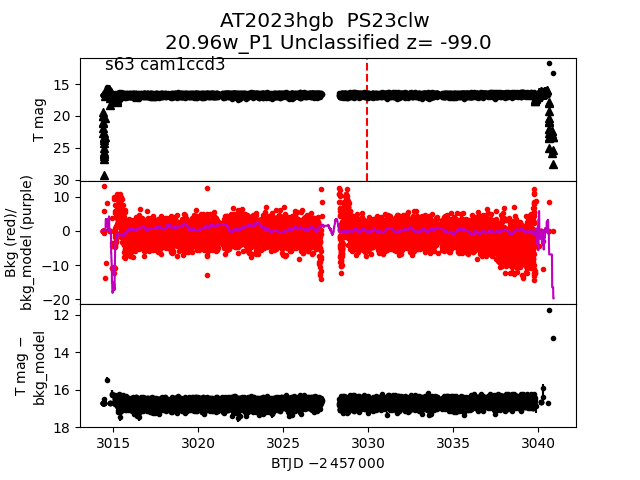
 2023hgb
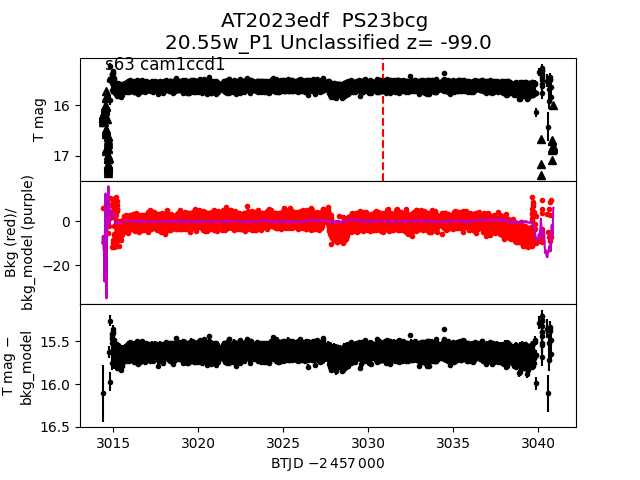
 2023edf
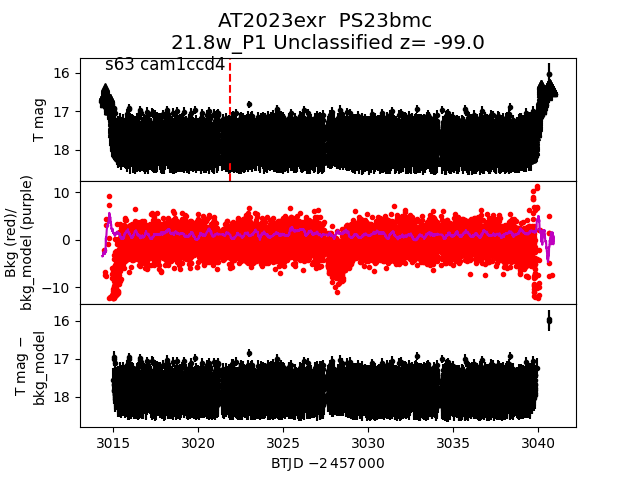
 2023exr
 2023far
 2023edy
 2023dpq
 2023dox