all transients in sector62 (48 total)
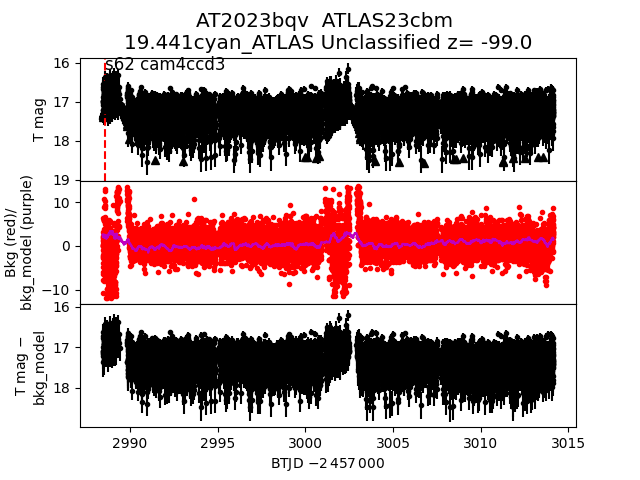
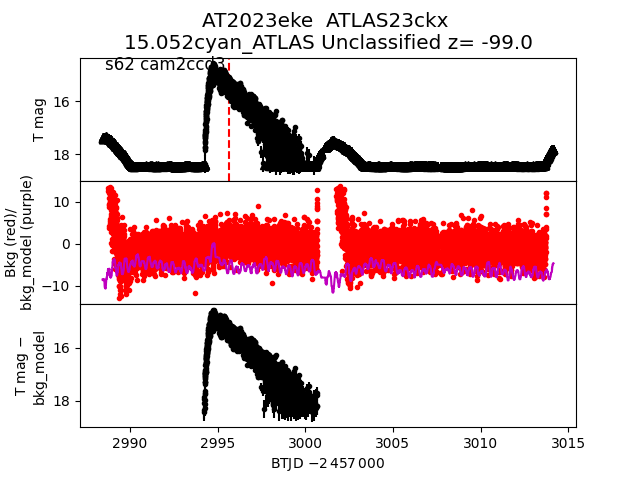
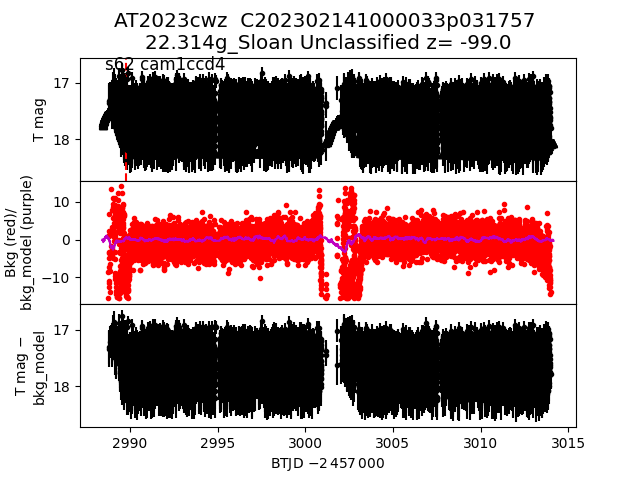
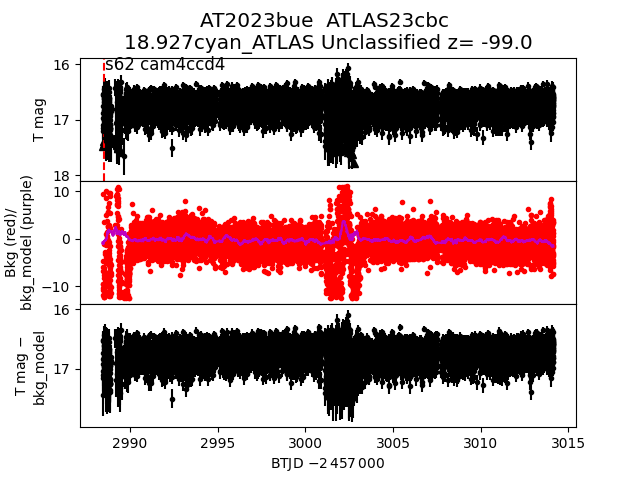
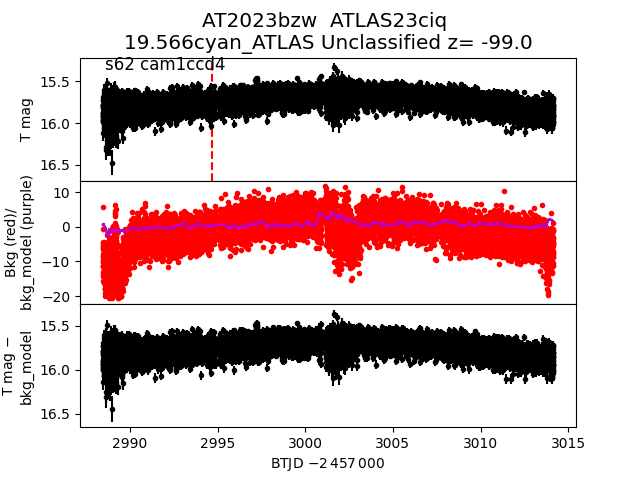
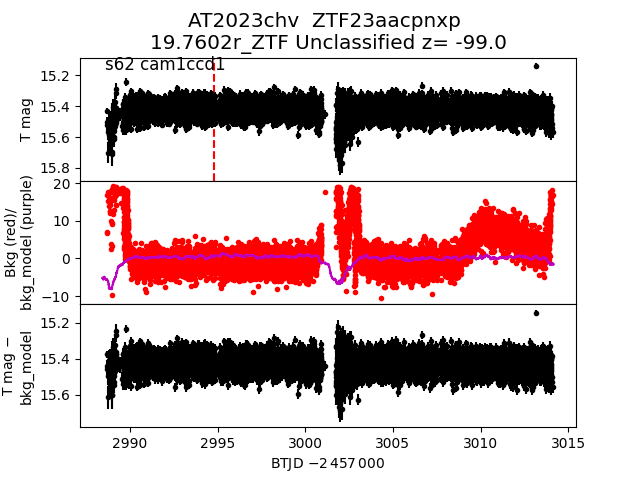
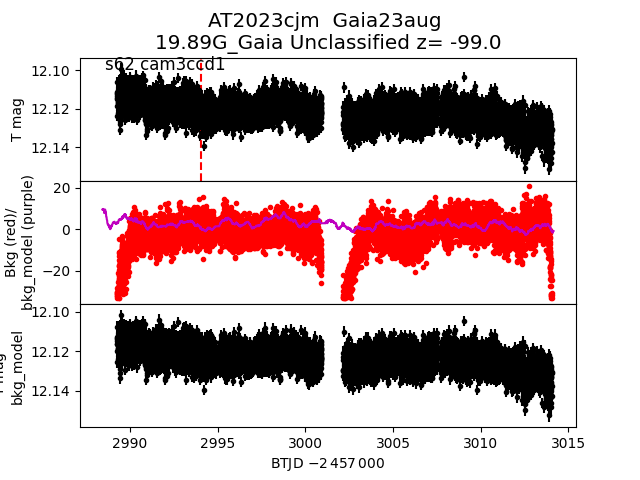
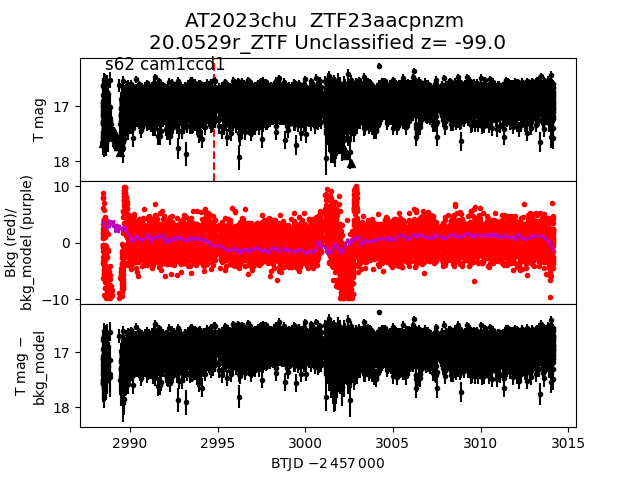
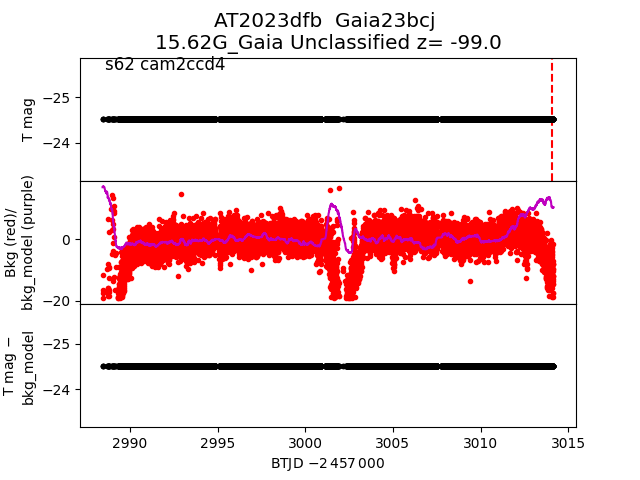
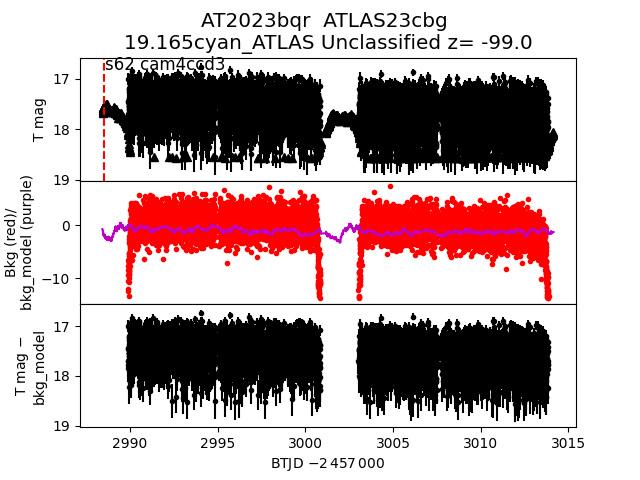
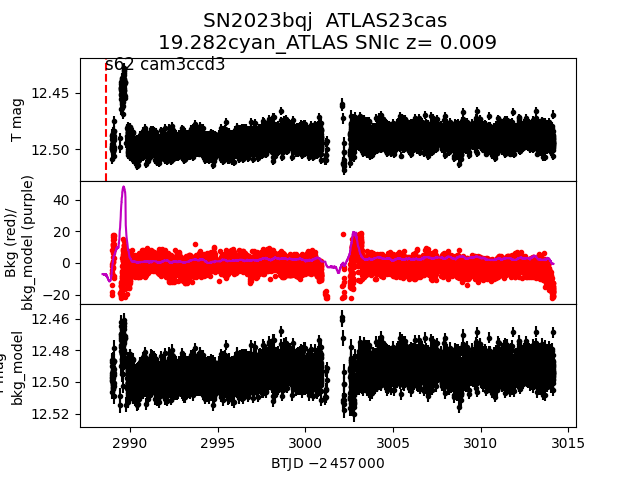
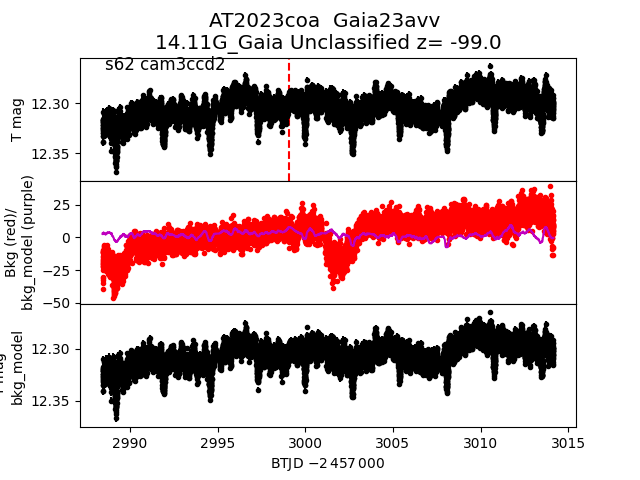
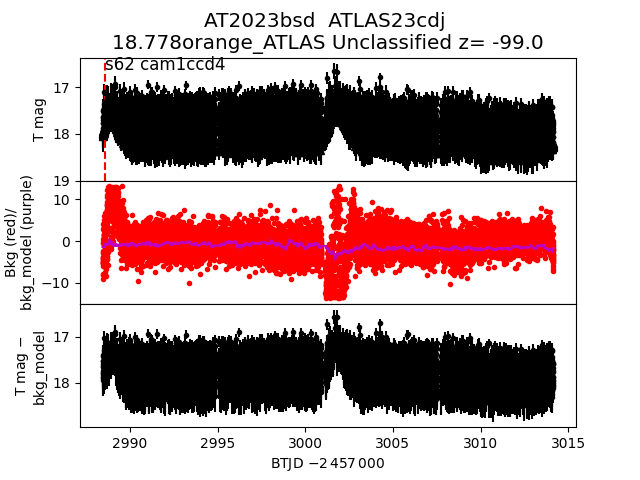
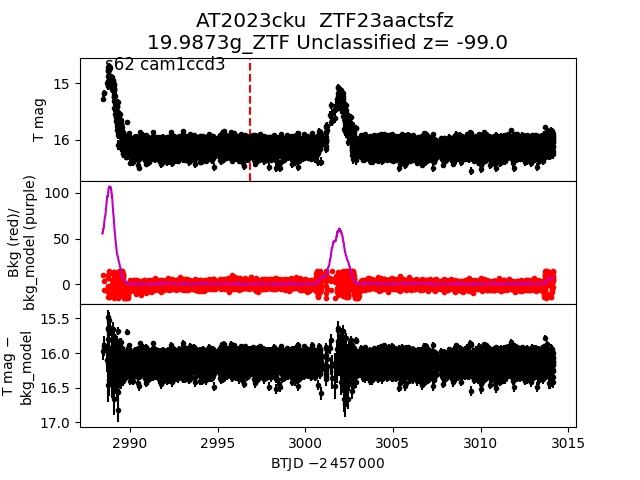
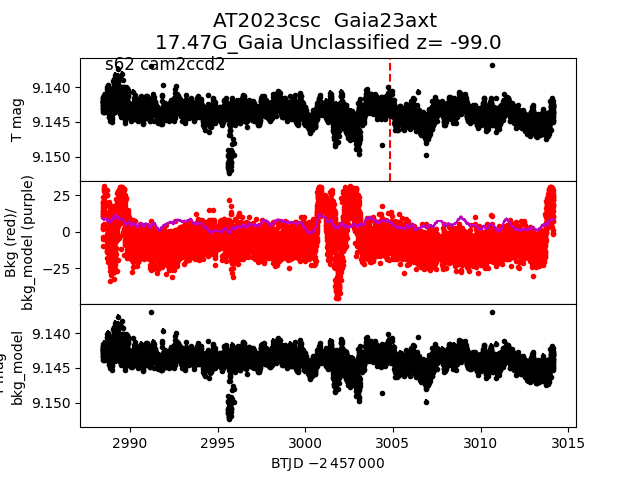
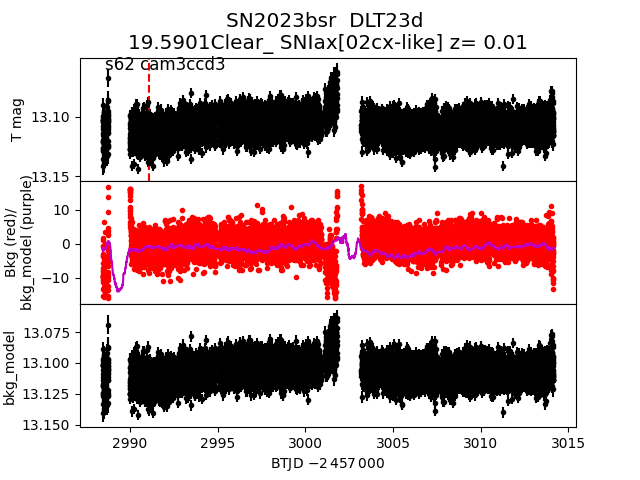
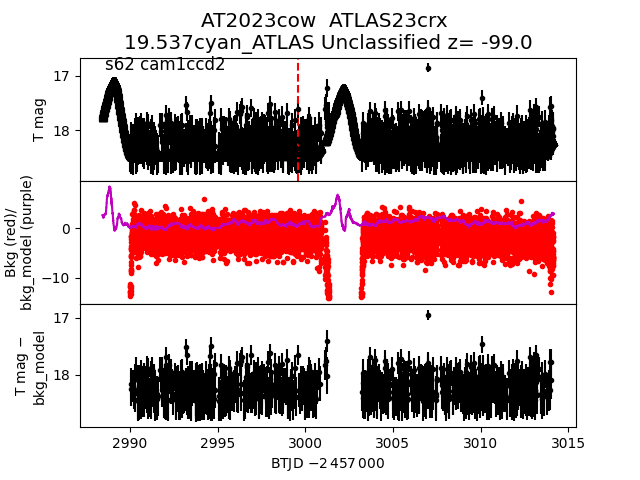
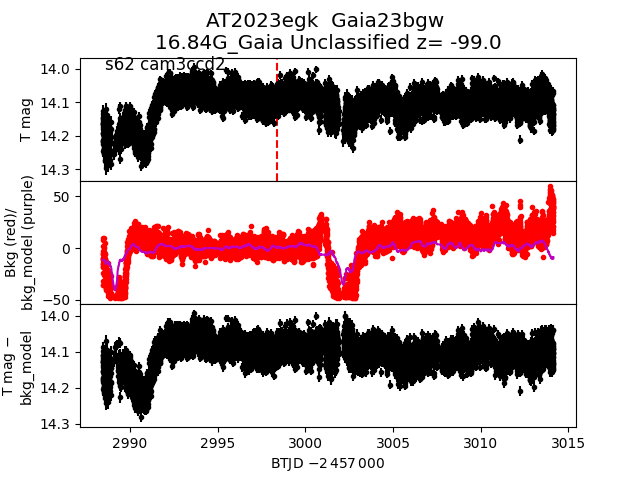
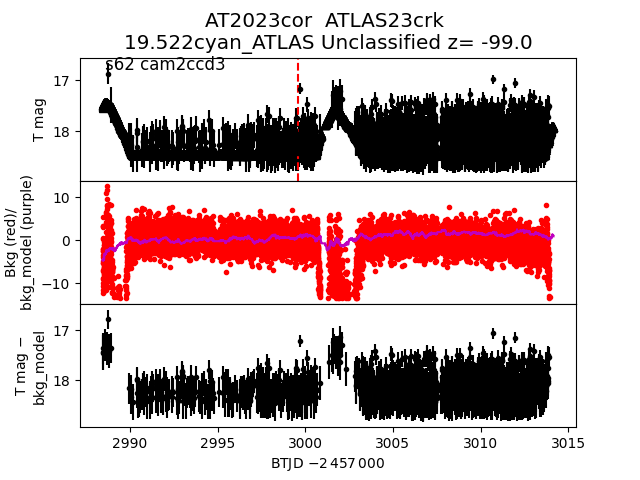
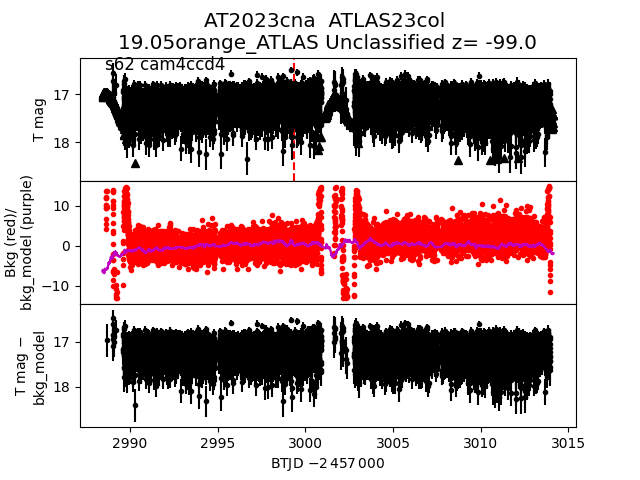
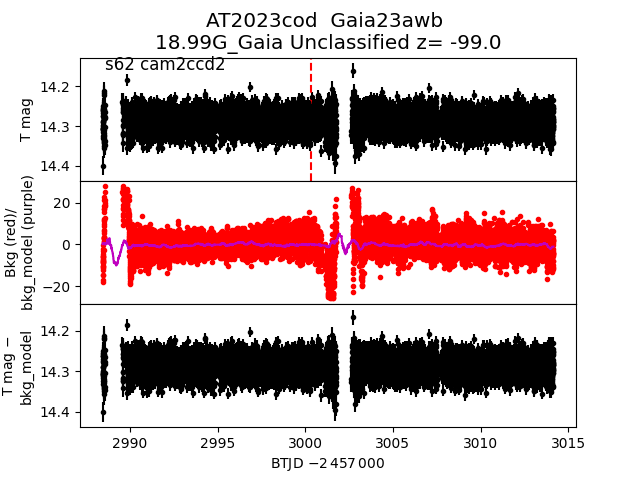
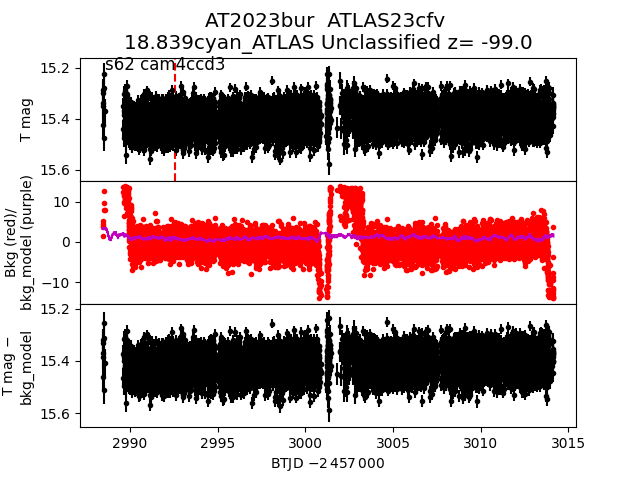
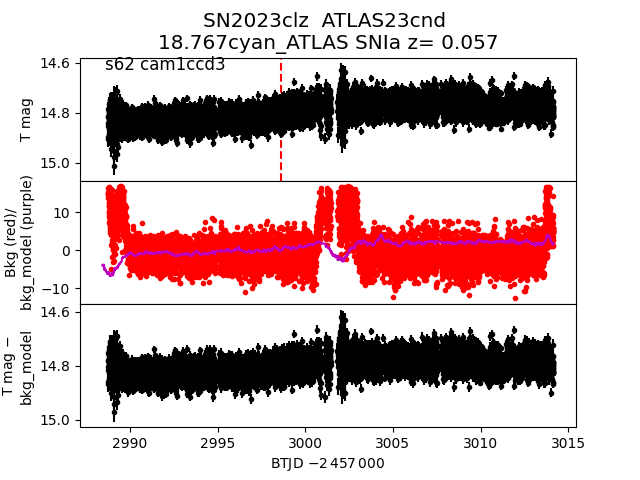
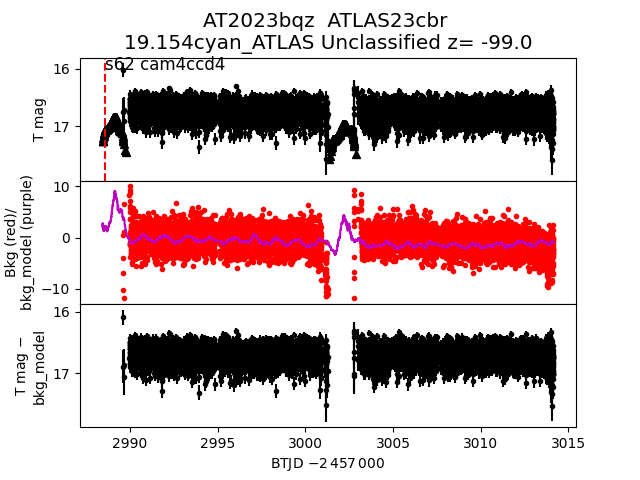
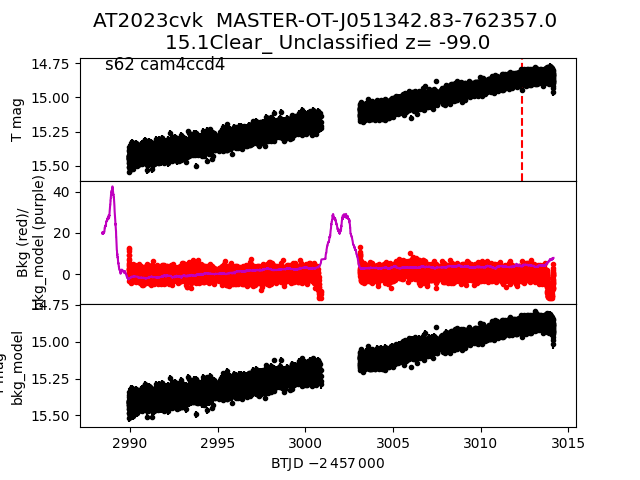
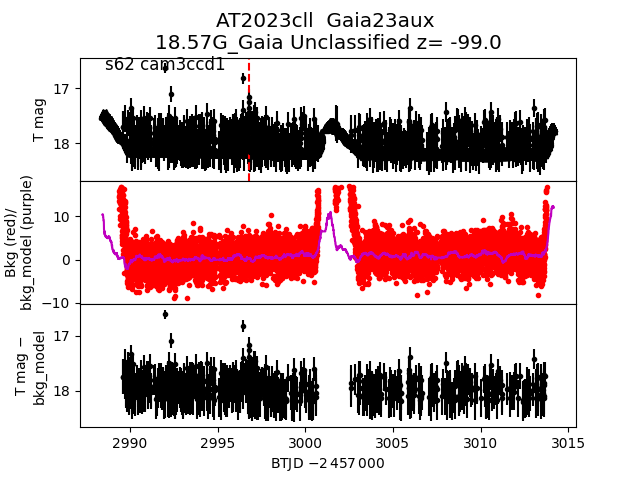
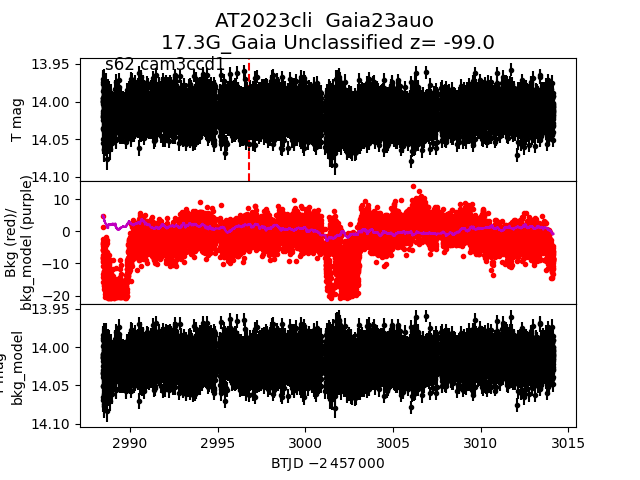
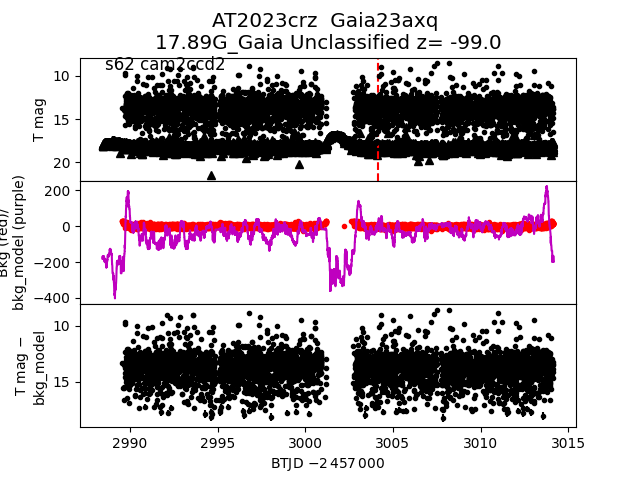
Each figure has three panels. The top panel shows the transient light curve, the middle panel shows the local background (estimated in an annulus), and the bottom panel shows a "background-model corrected" light curve. Details about the background model are in the README.
The vertical red line marks the time of discovery reported to TNS. Other useful metadata from TNS is in the figure title.
Note that the top and bottom panel are in magnitudes, while the middle panel is in differential flux units. The magnitudes are calibrated to the flux in the reference image used for image subtraction. Thus, flux from the host galaxy is included in these magnitudes.
3-sigma upper limits are plotted as triangles with no errorbars. A typical limiting magnitude is 19.6 in 30 minutes or 18.4 in 200 seconds (for low backgrounds).
The links allow you to download the light curve data as a text file.
More details in the README.
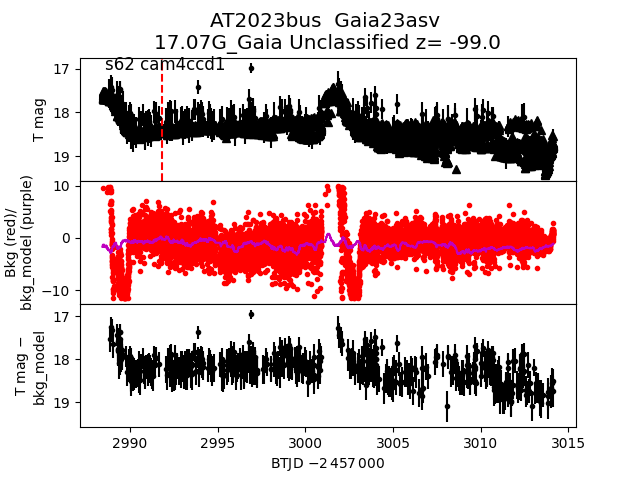
2023bus
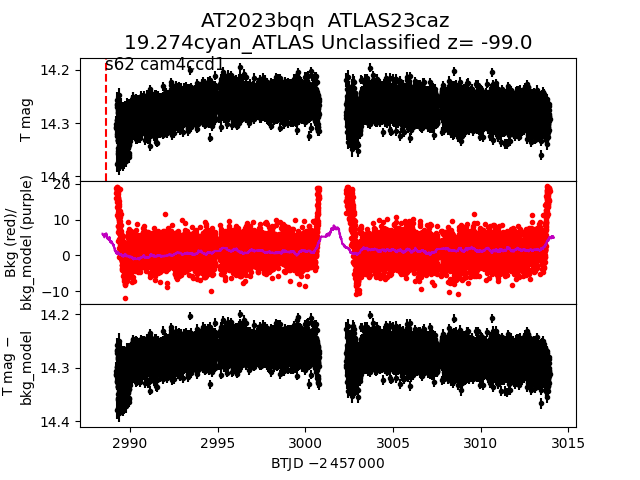
 2023bqn
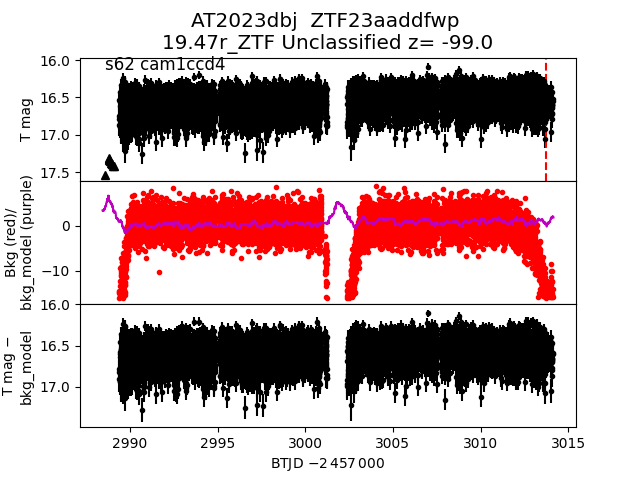
 2023dbj
 2023eke
 2023cwz
 2023bue
 2023bzw
 2023chv
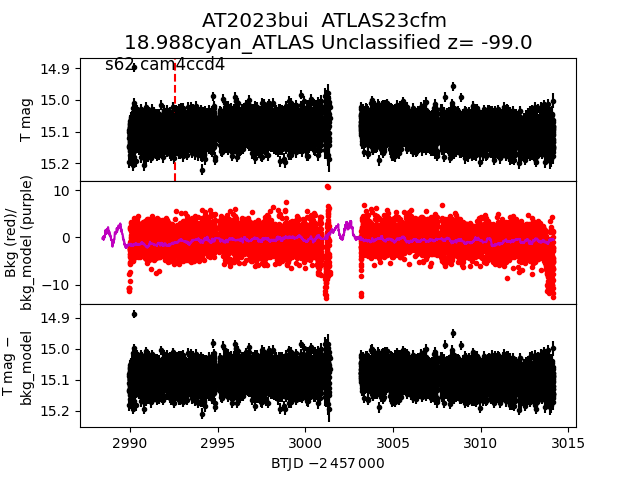
 2023bui
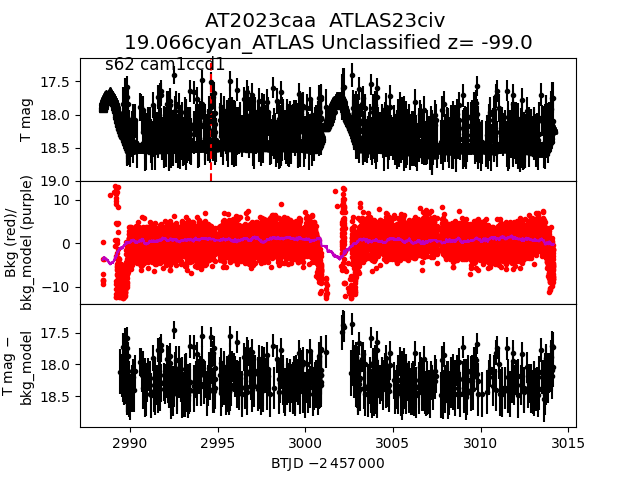
 2023caa
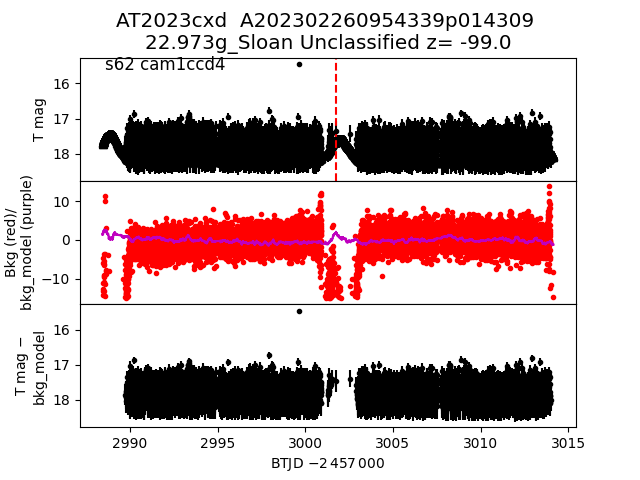
 2023cxd
 2023cjm
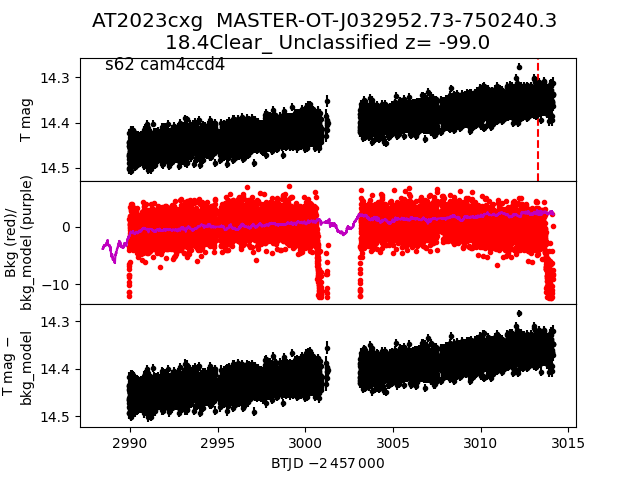
 2023cxg
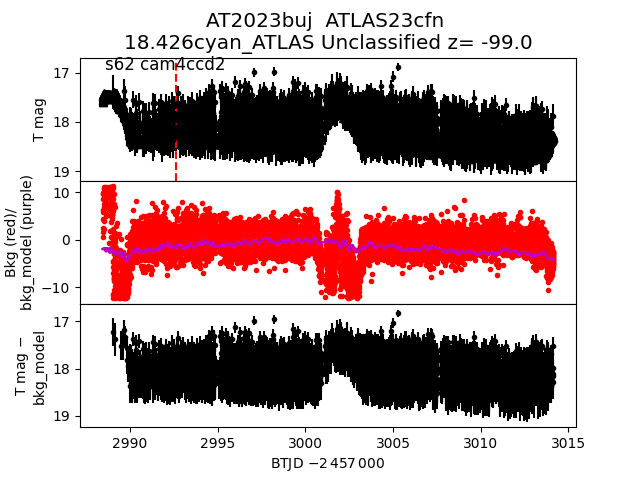
 2023buj
 2023cum
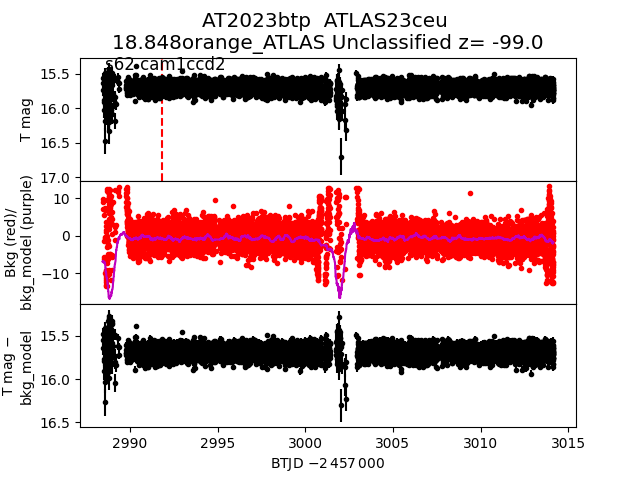
 2023btp
 2023chu
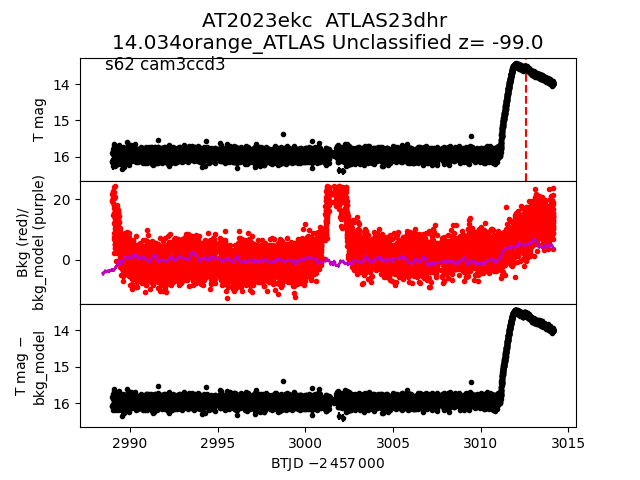
 2023ekc
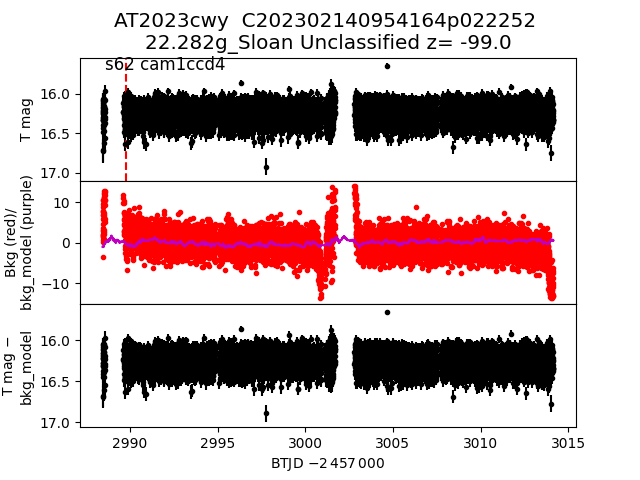
 2023cwy
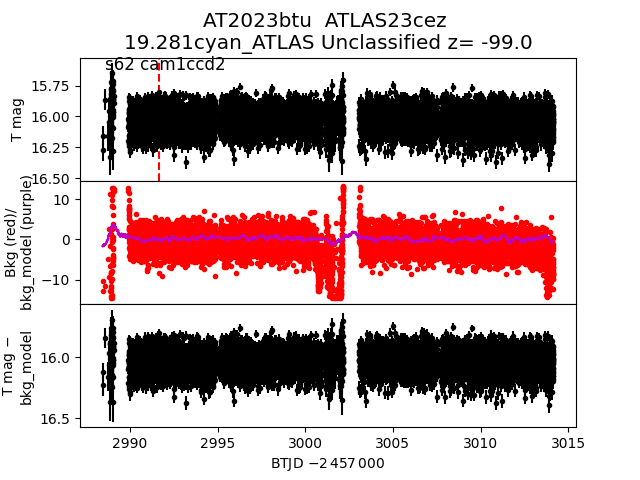
 2023btu
 2023dfb
 2023bqr
 2023bqj
 2023coa
 2023bsd
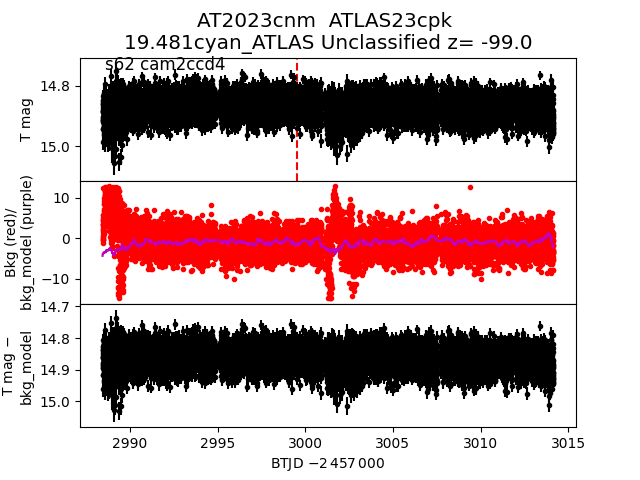
 2023cnm
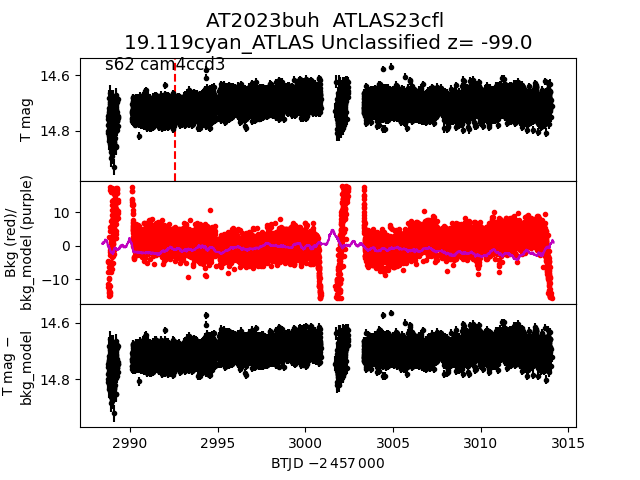
 2023buh
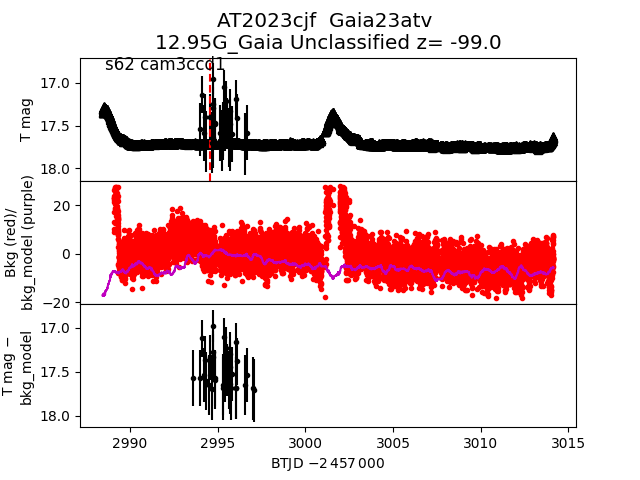
 2023cjf
 2023cku
 2023csc
 2023bsr
 2023cow
 2023egk
 2023cor
 2023cna
 2023cod
 2023bur
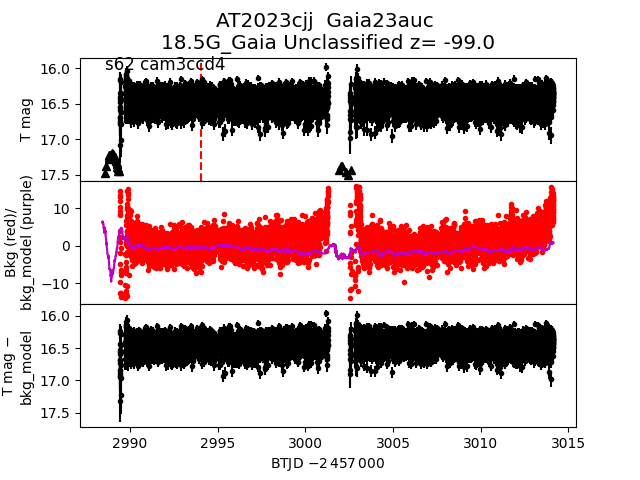
 2023cjj
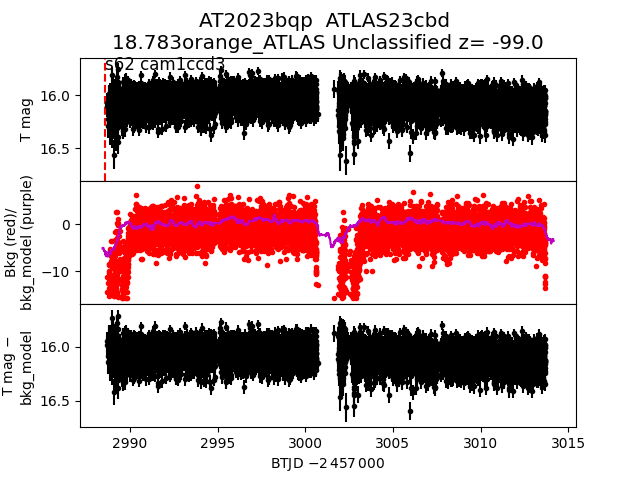
 2023bqp
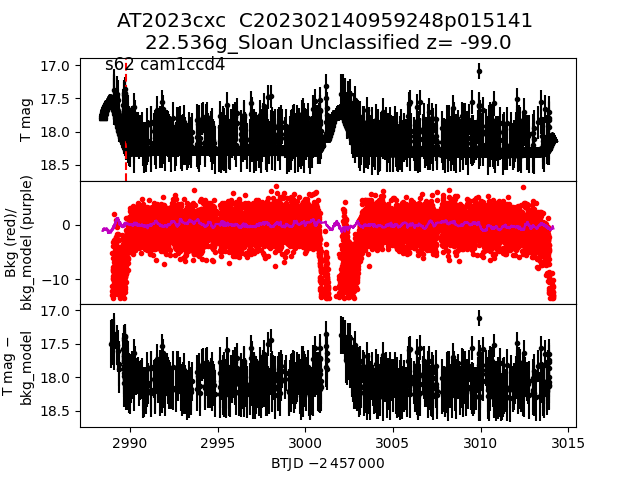
 2023cxc
 2023clz
 2023bqz
 2023cvk
 2023cll
 2023bux
 2023cli
 2023crz
 2023bqv