all transients in sector61 (77 total)
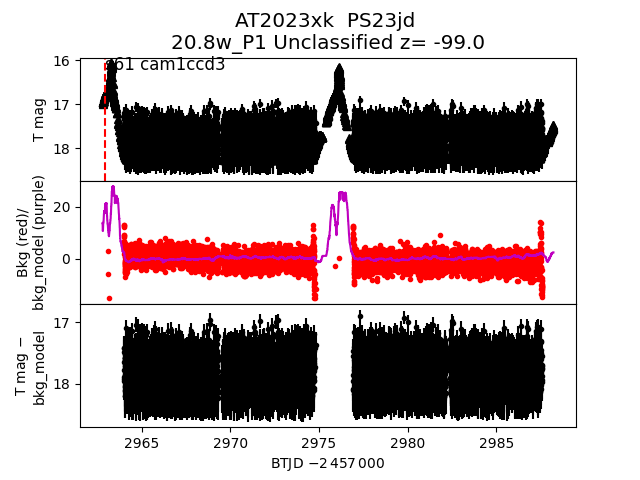
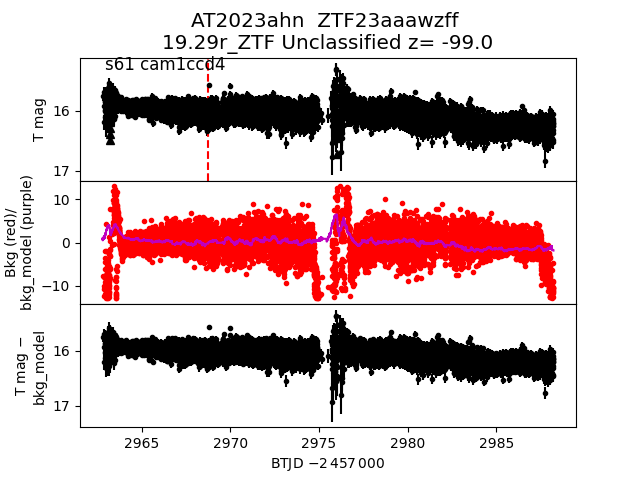
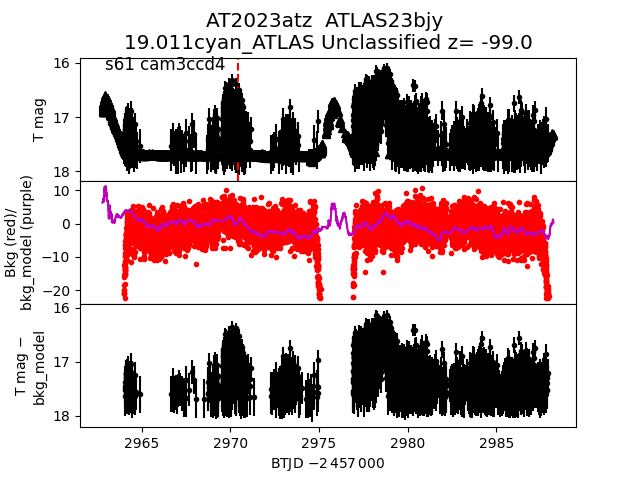
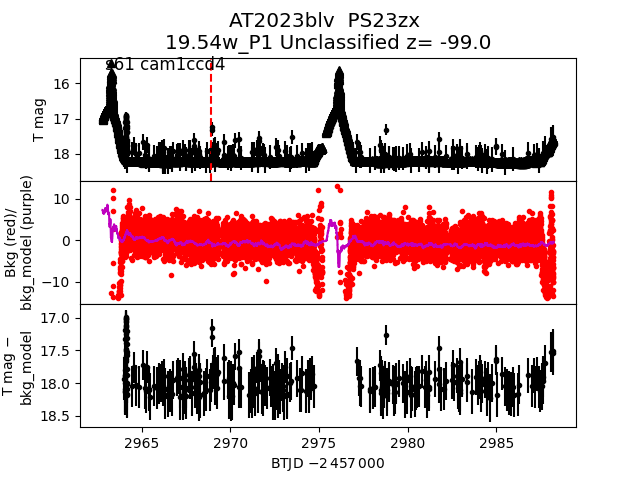
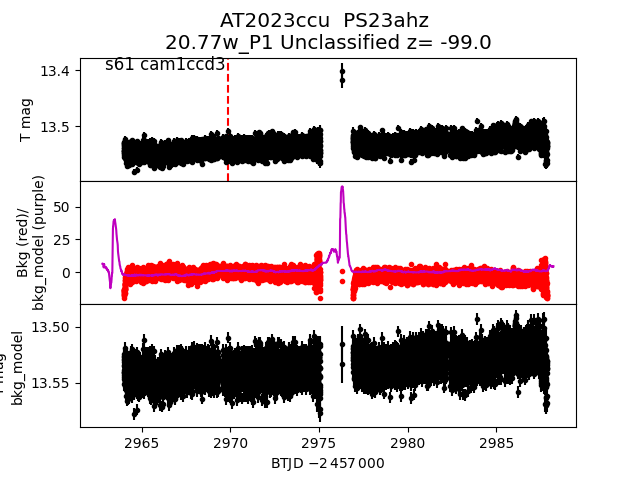
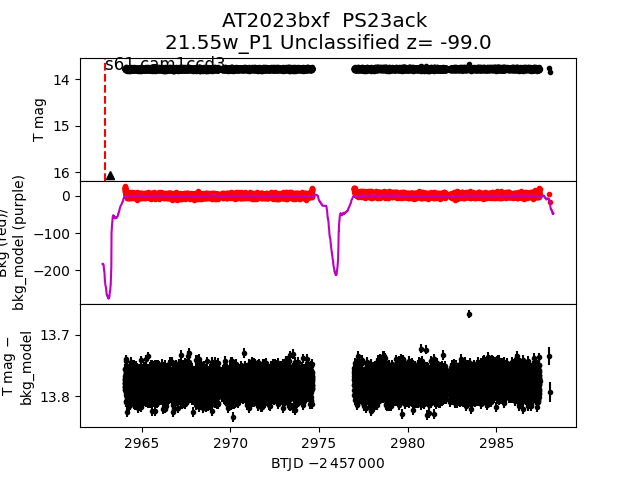
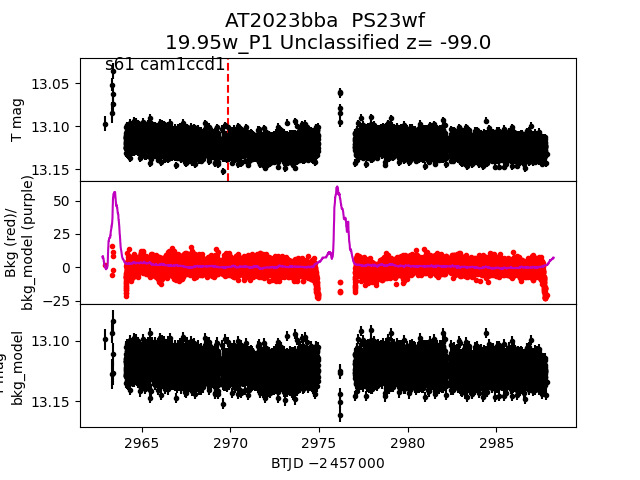
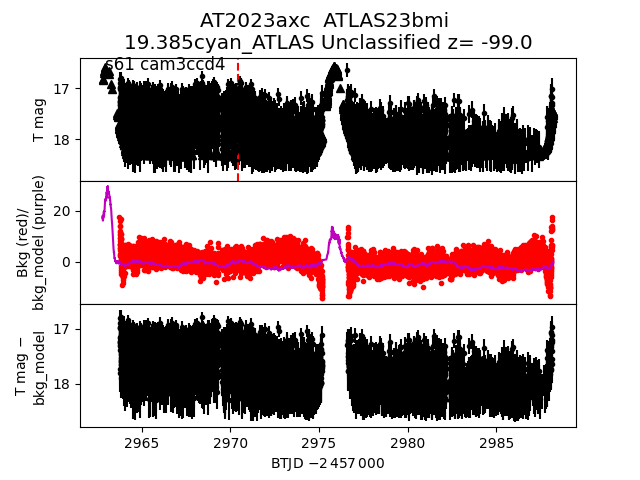
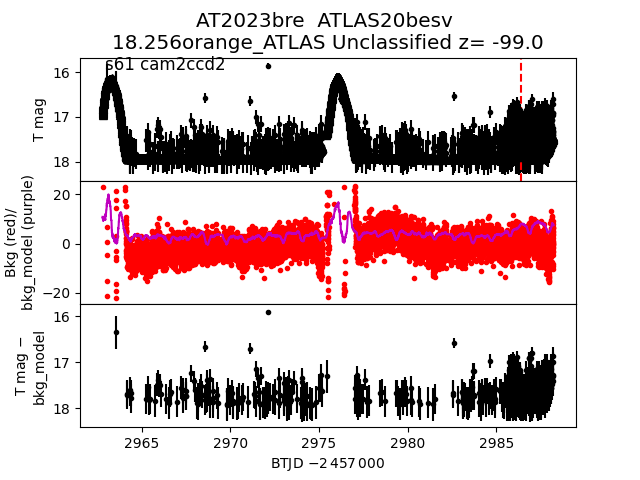
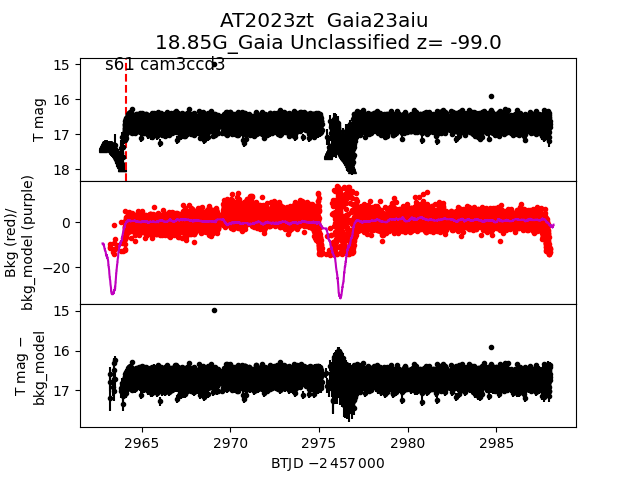
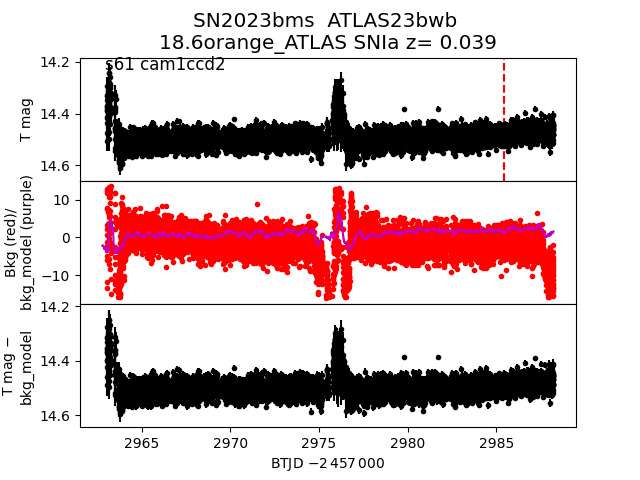
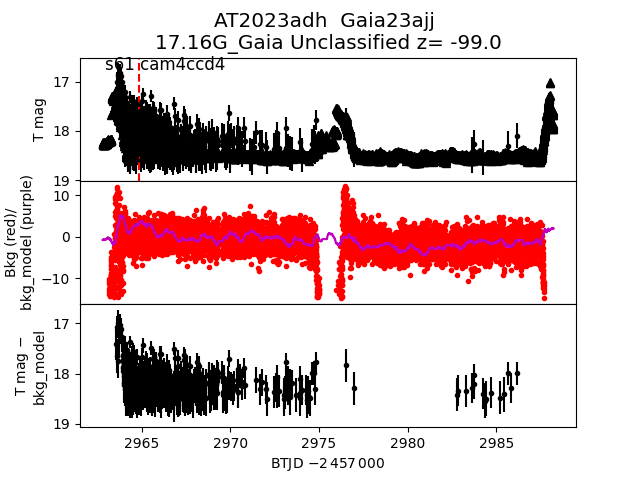
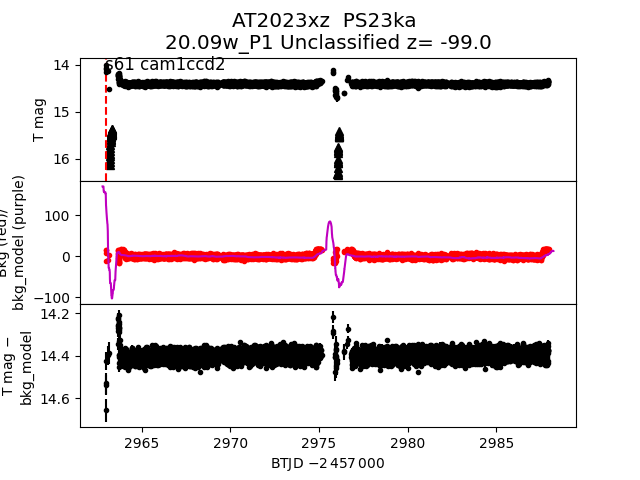
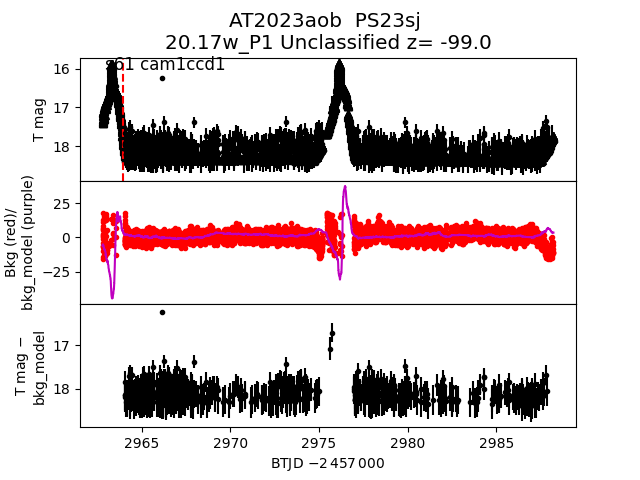
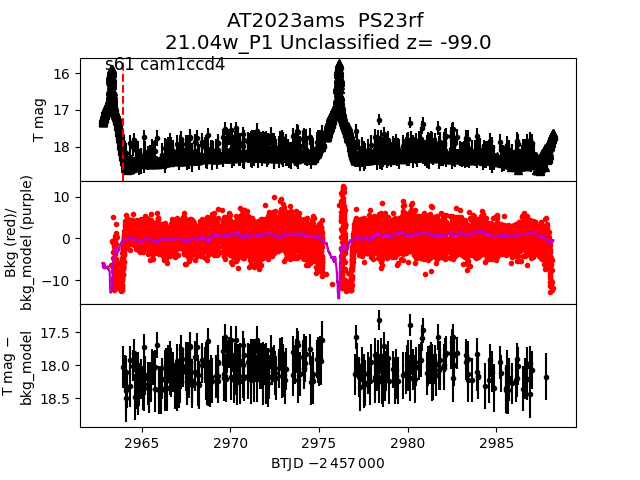
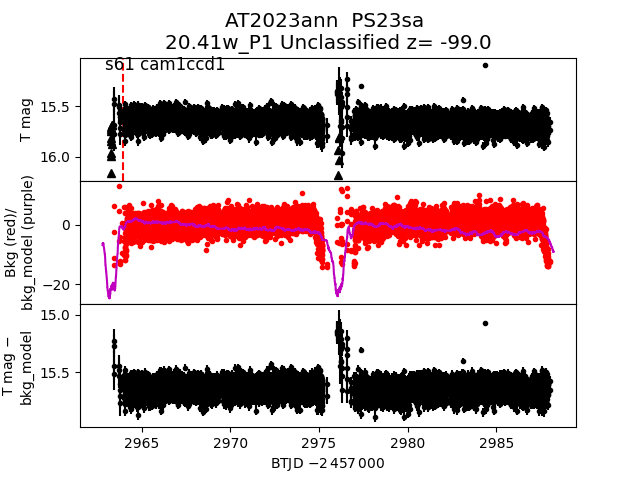
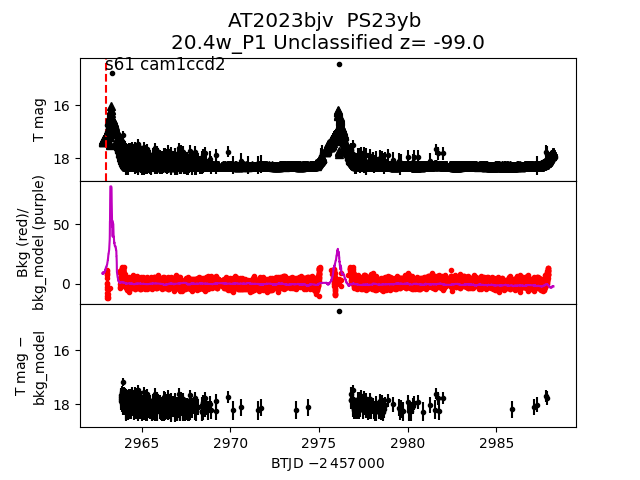
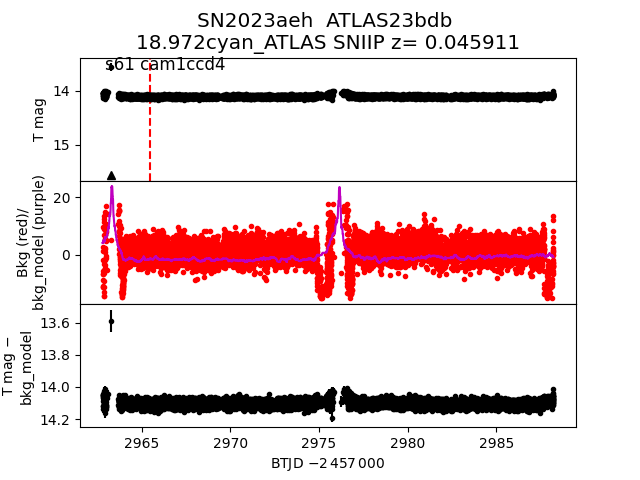
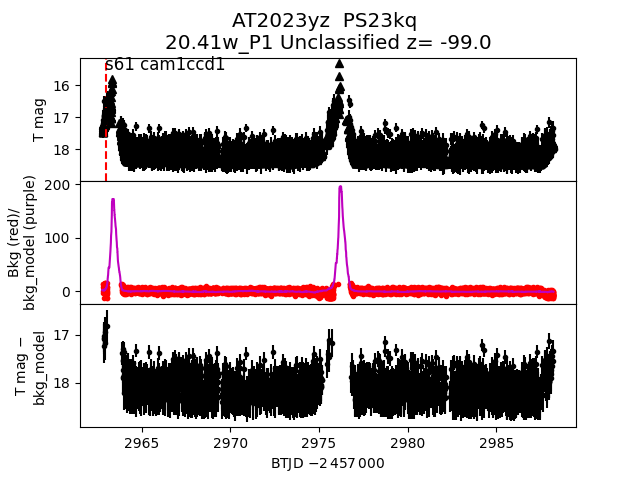
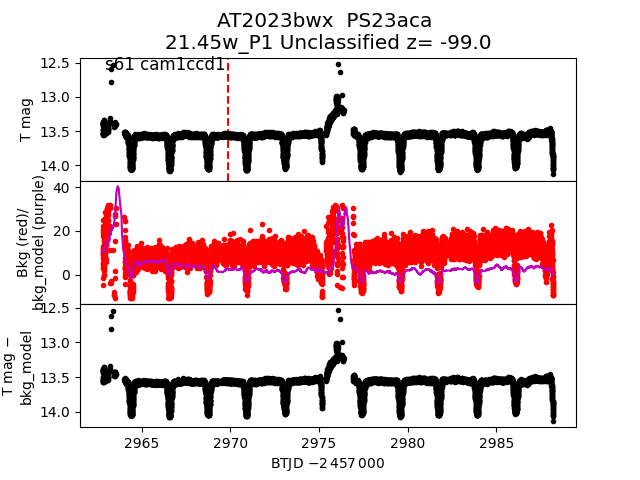
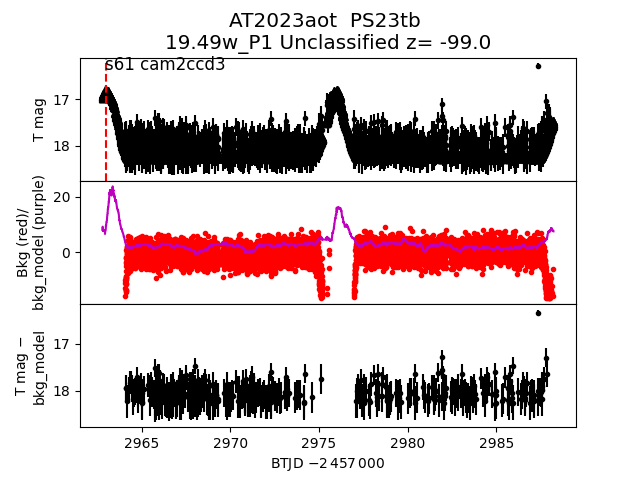
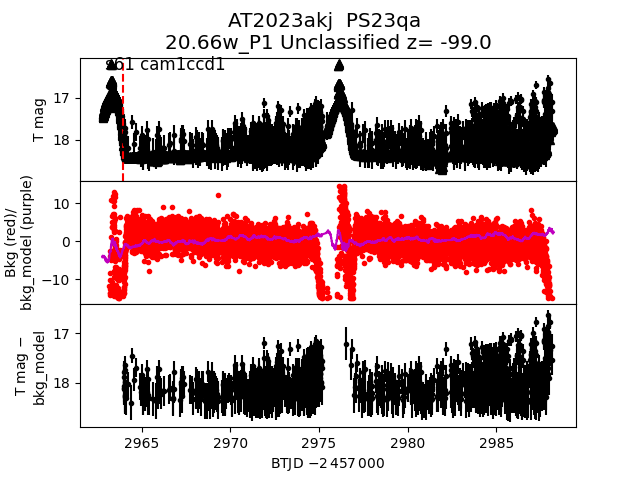
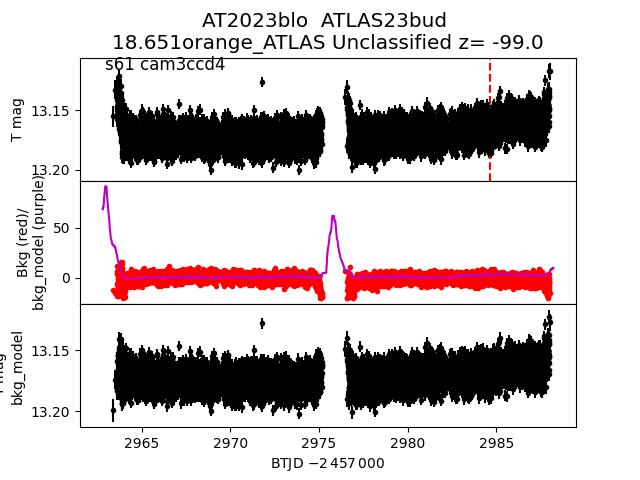
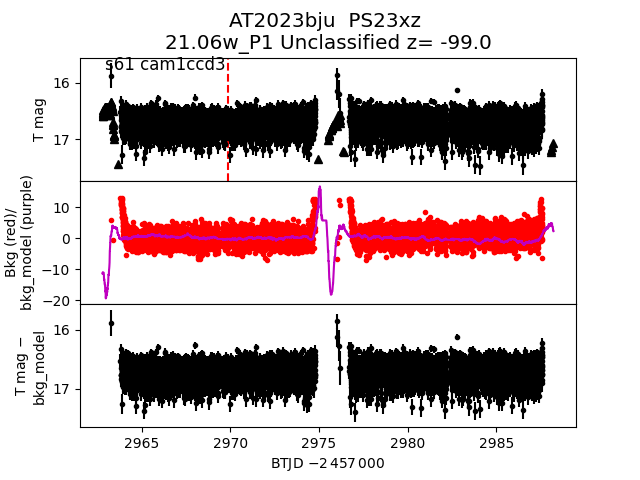
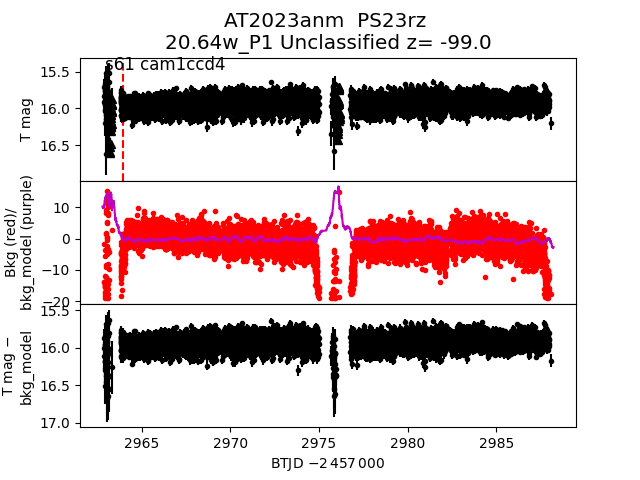
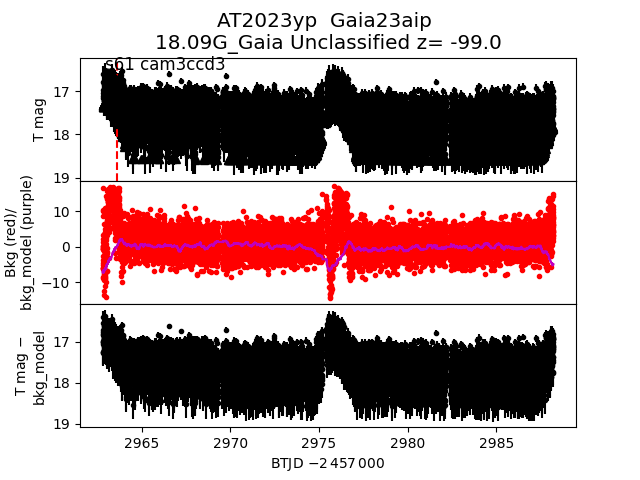
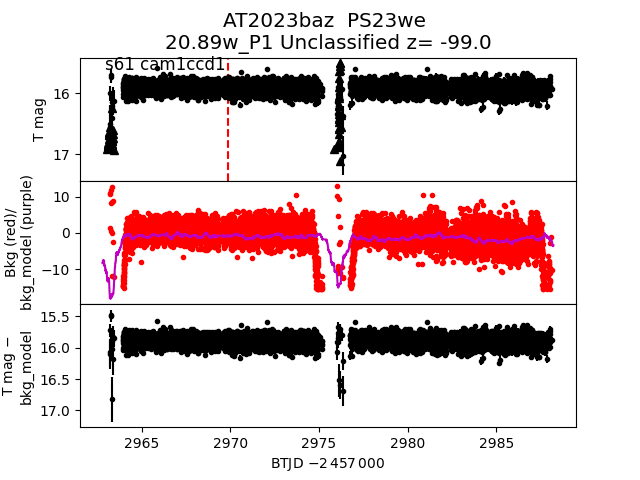
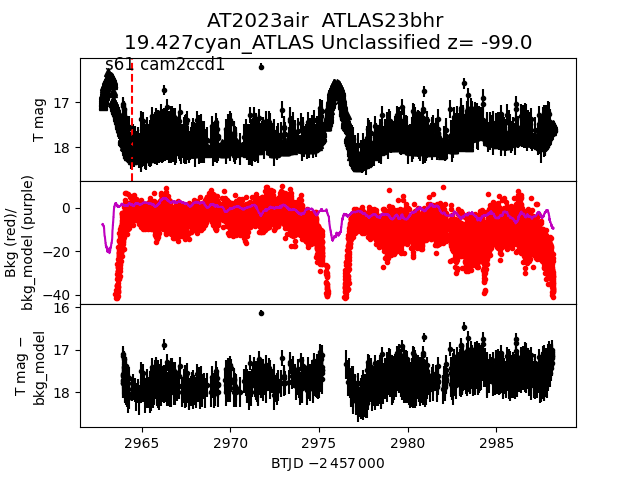
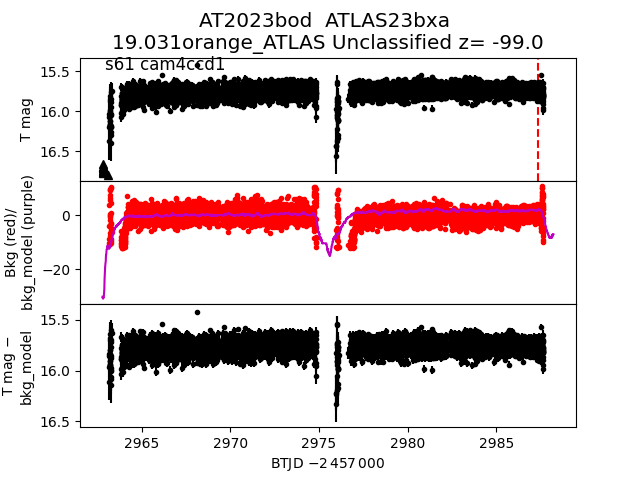
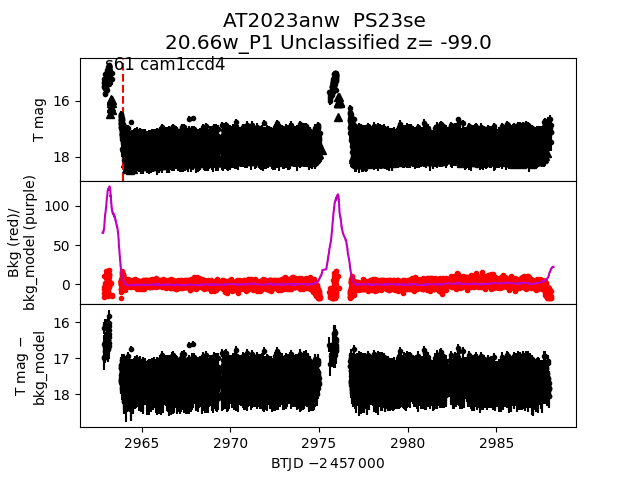
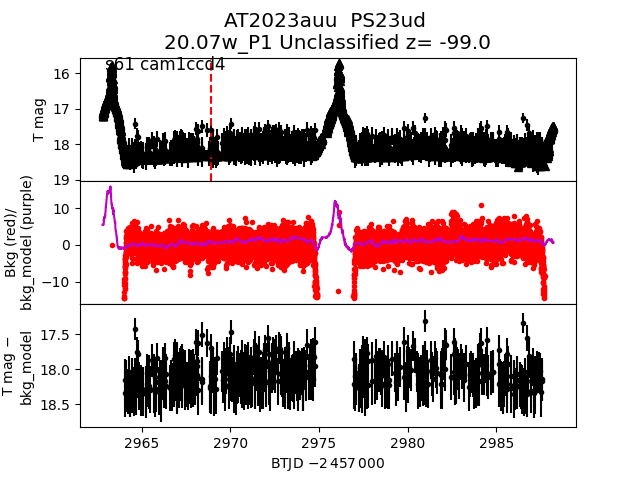
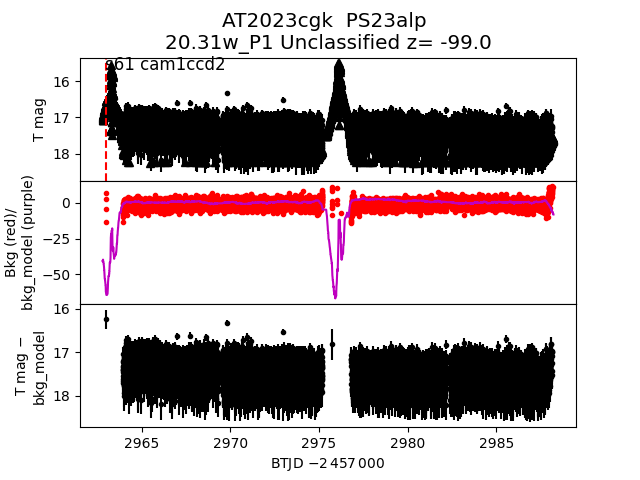
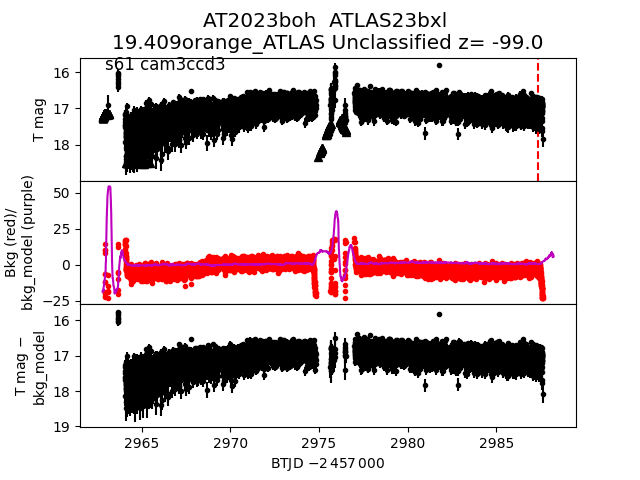
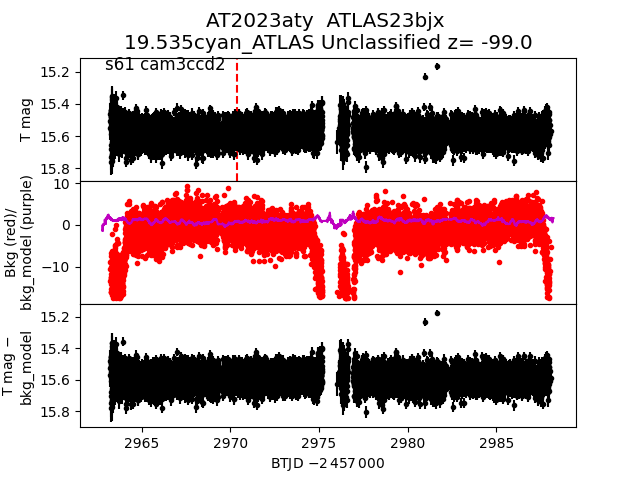
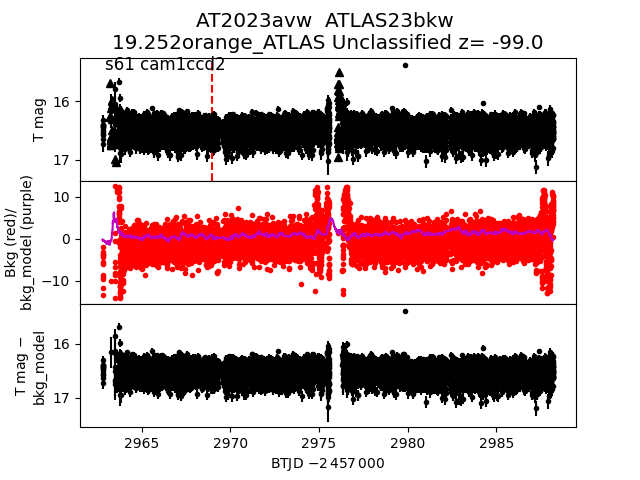
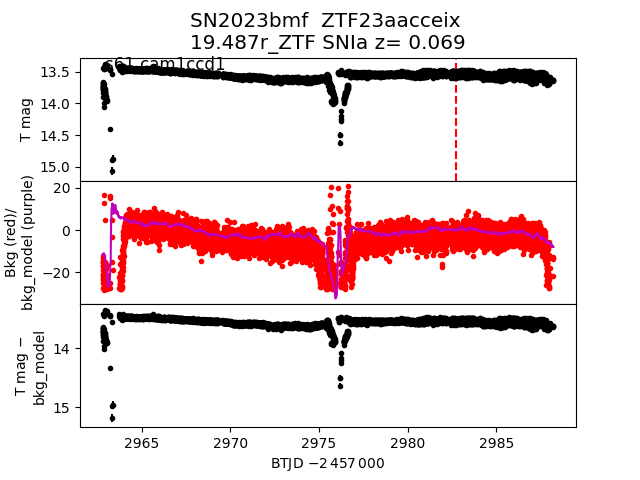
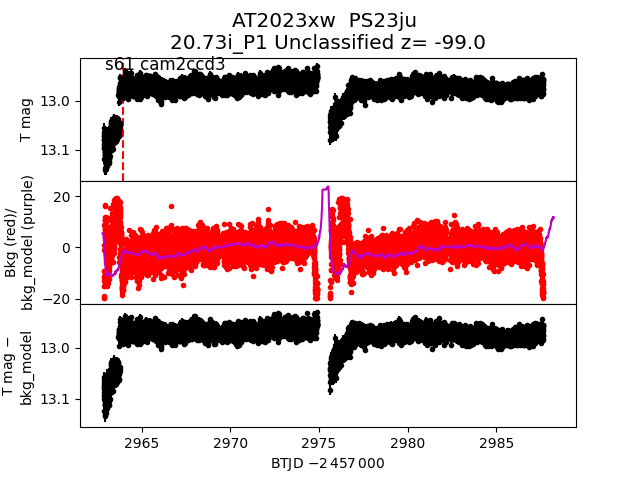
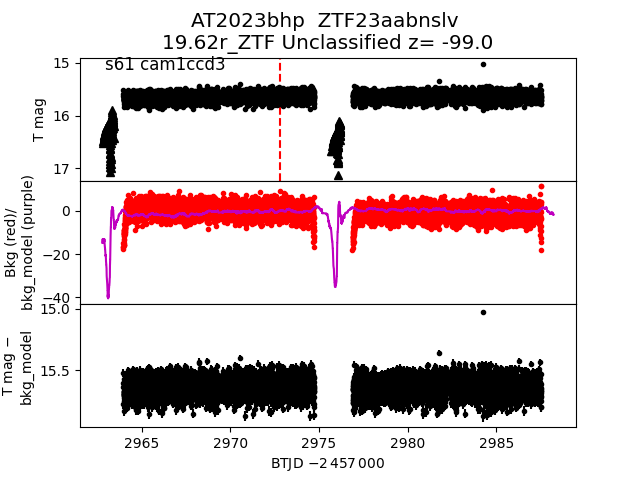
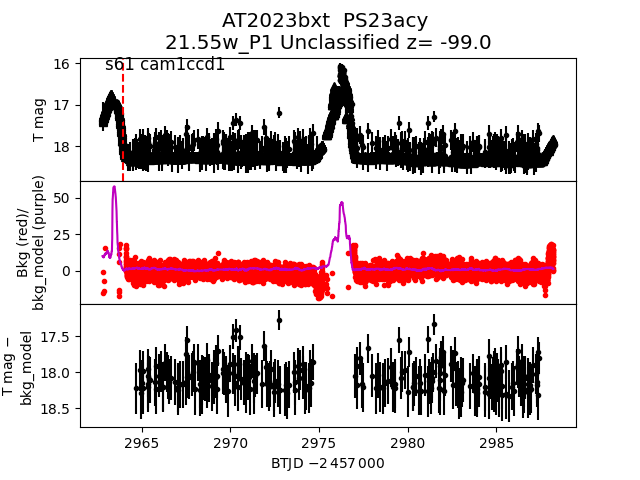
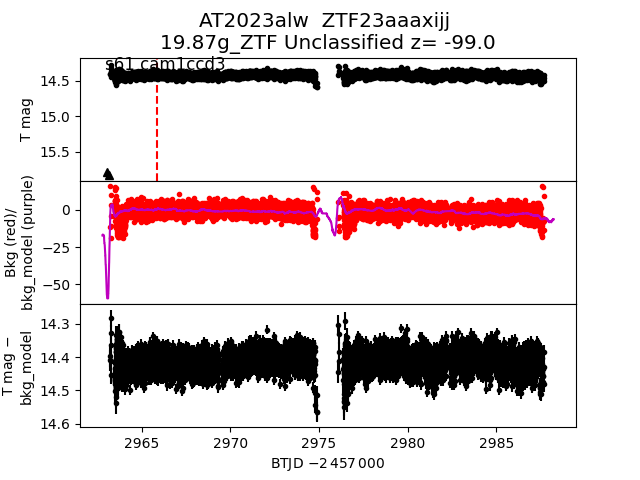
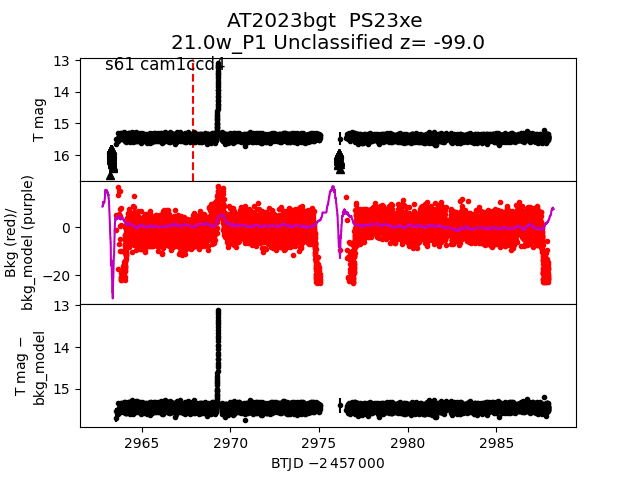
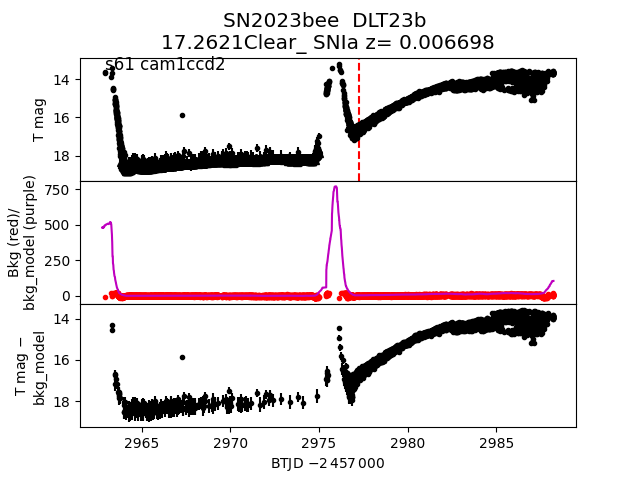
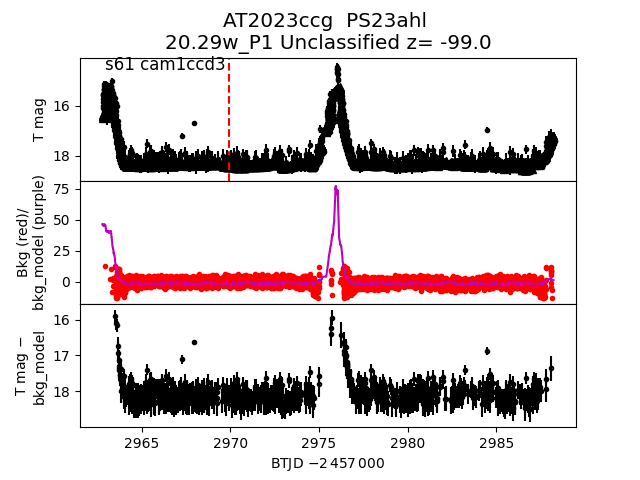
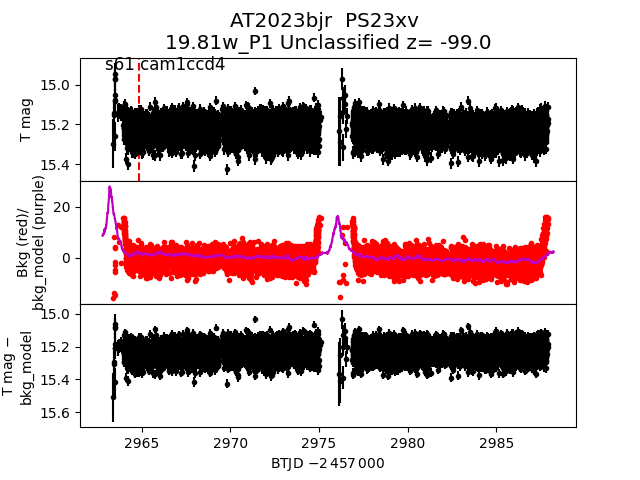
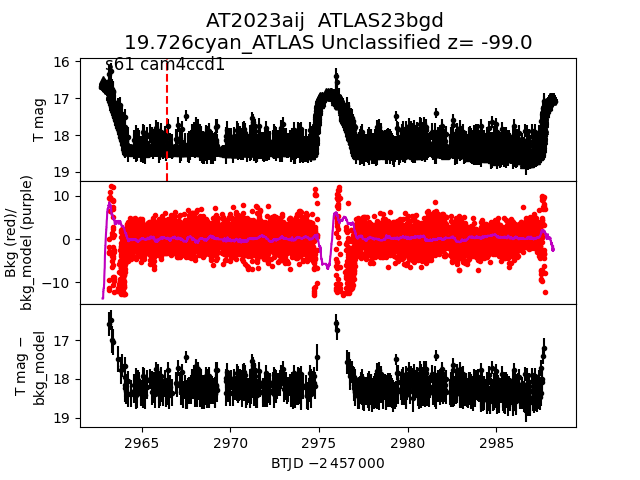
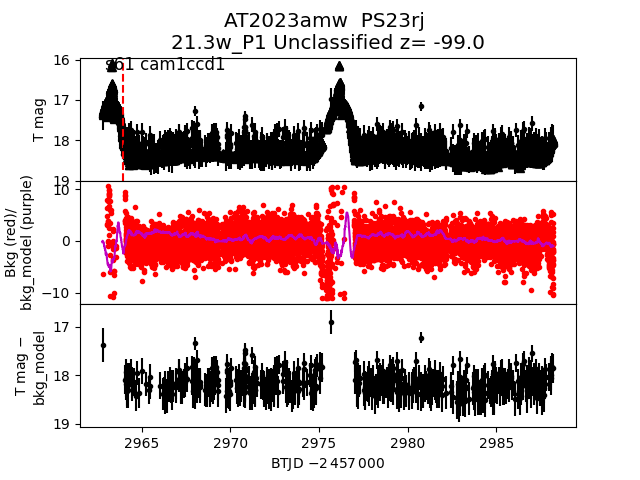
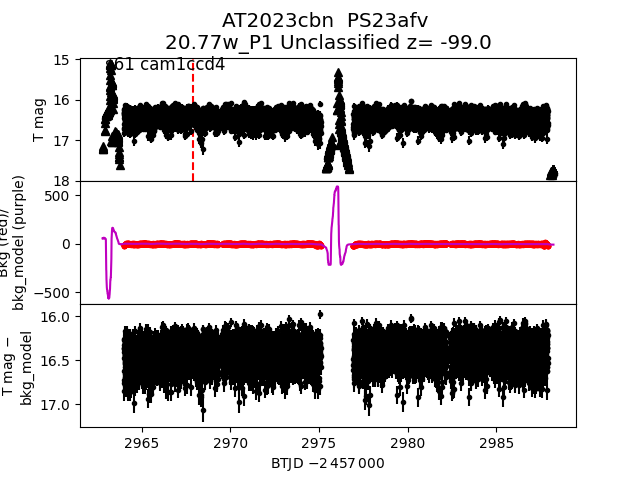
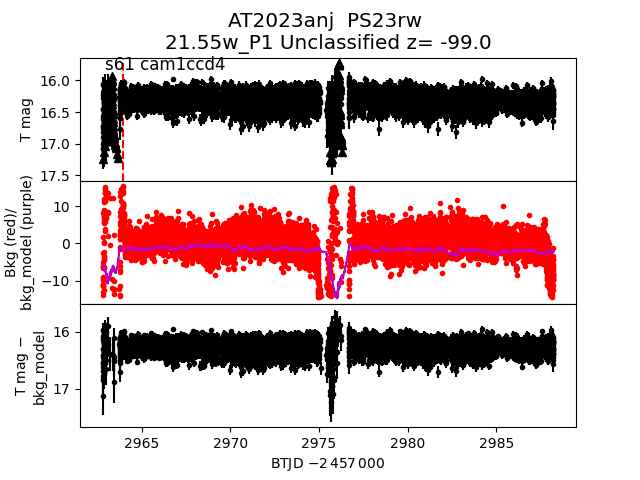
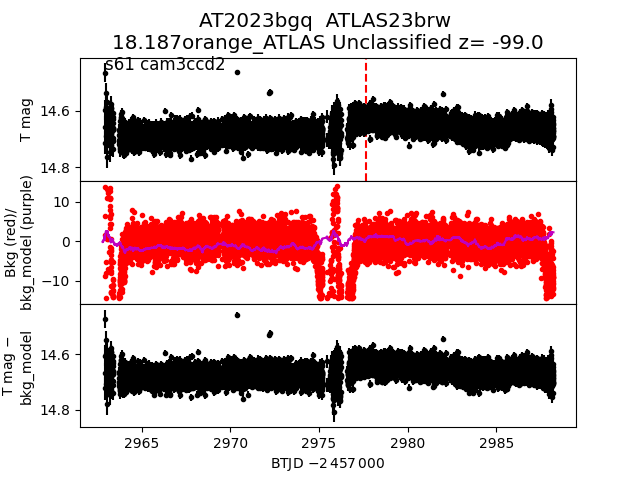
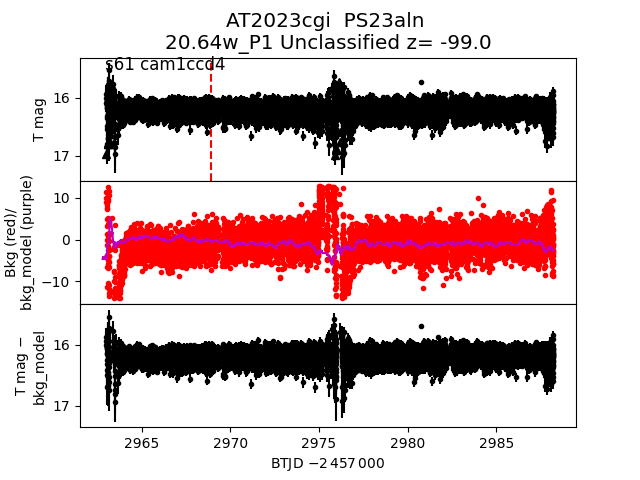
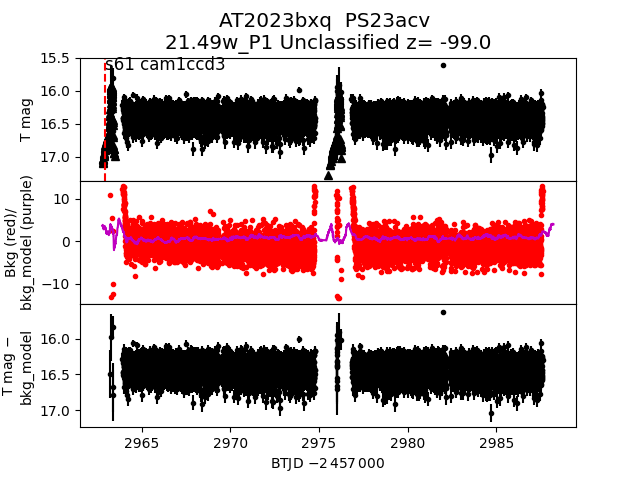
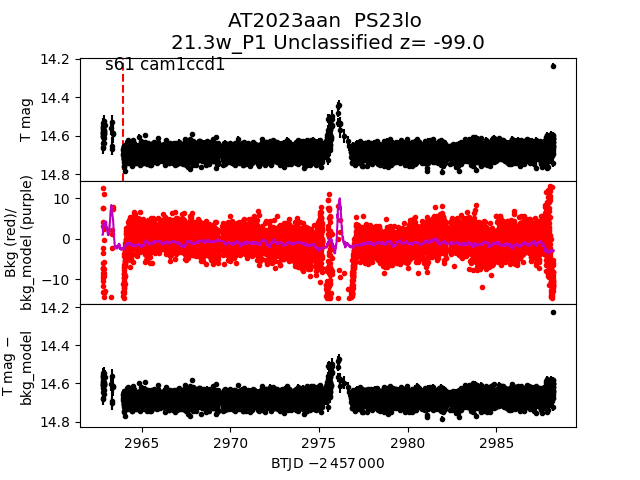
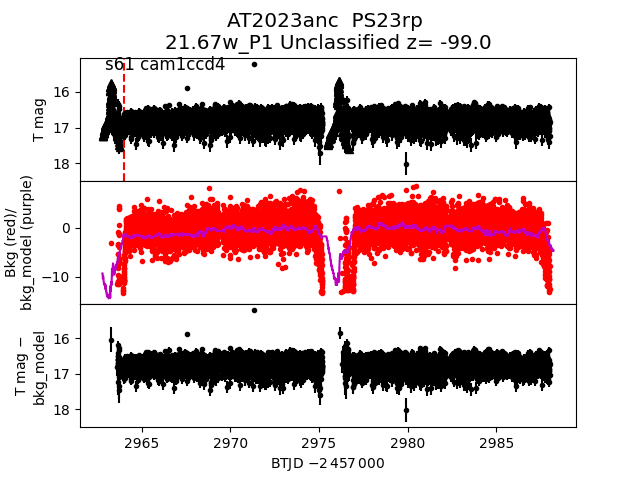
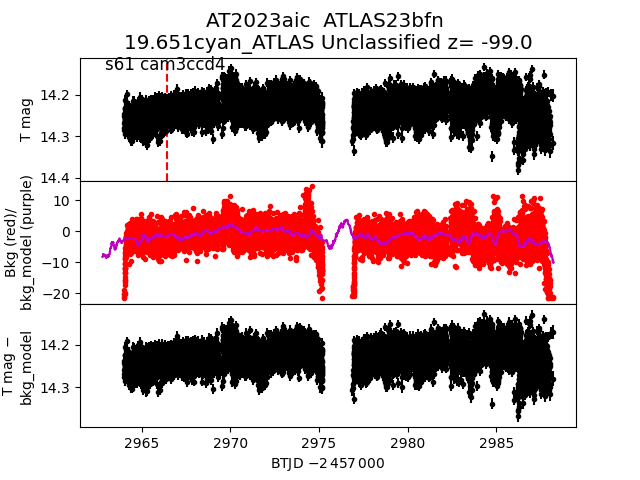
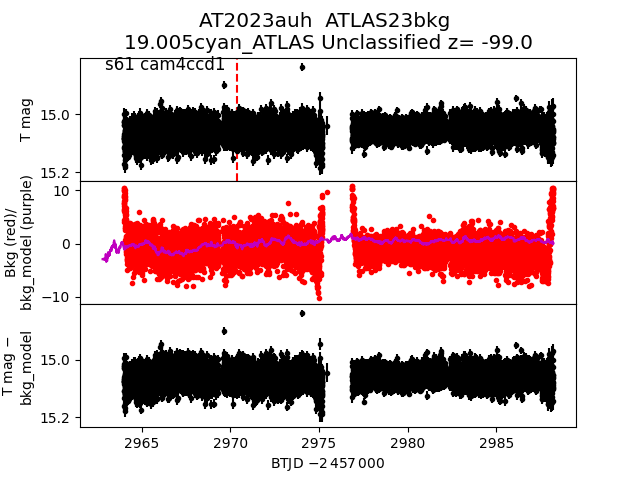
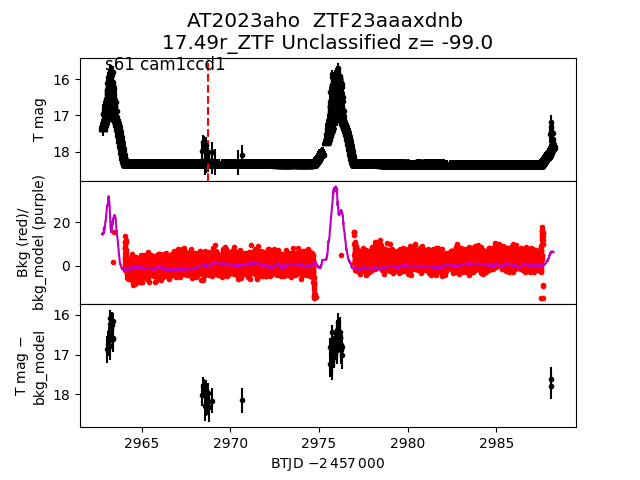
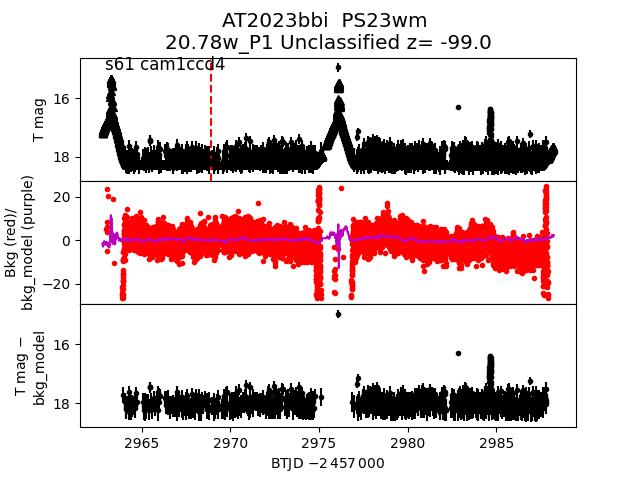
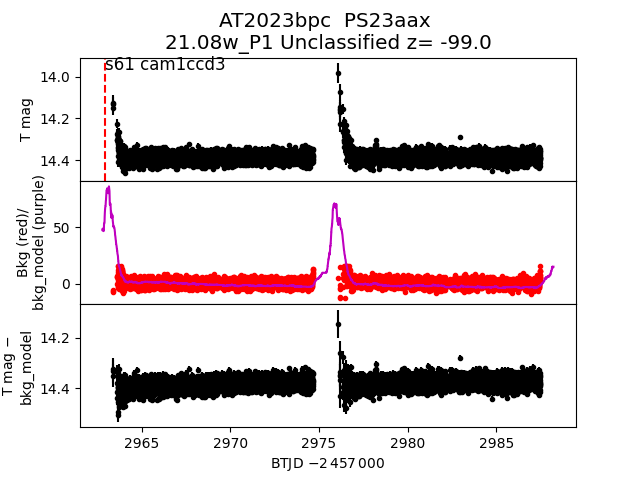
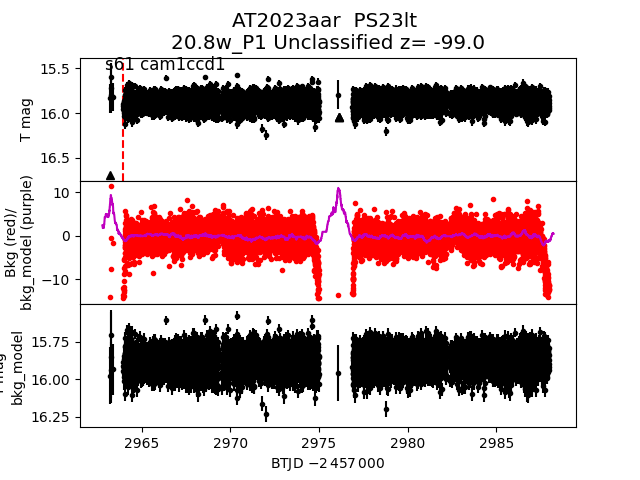
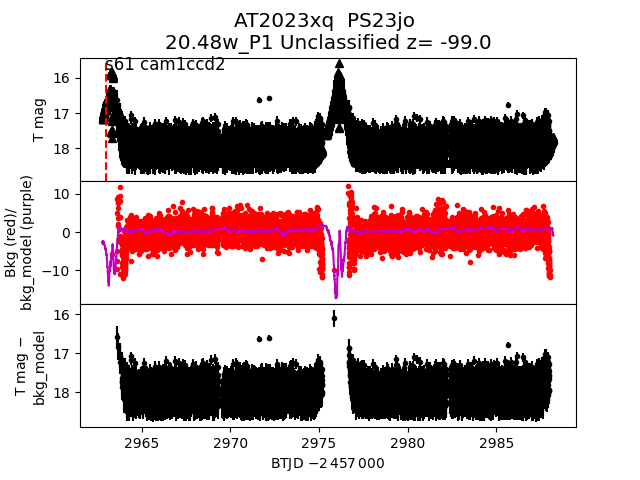
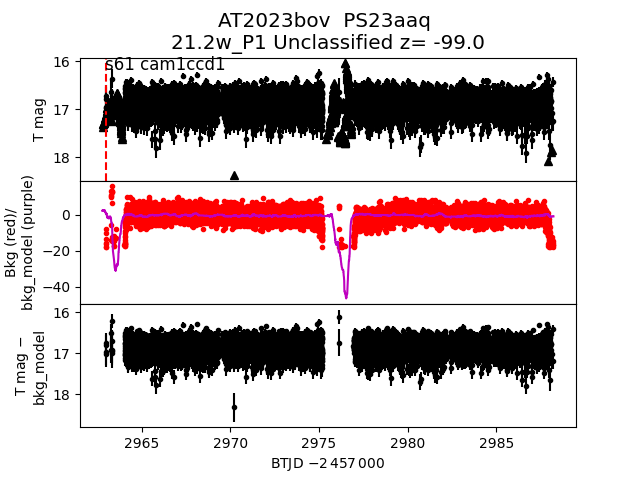
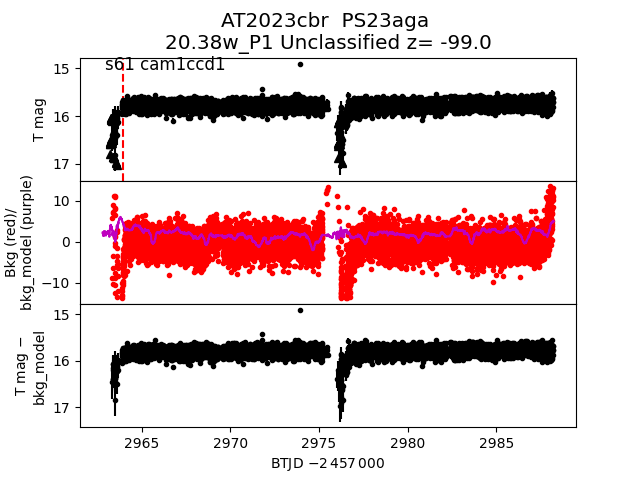
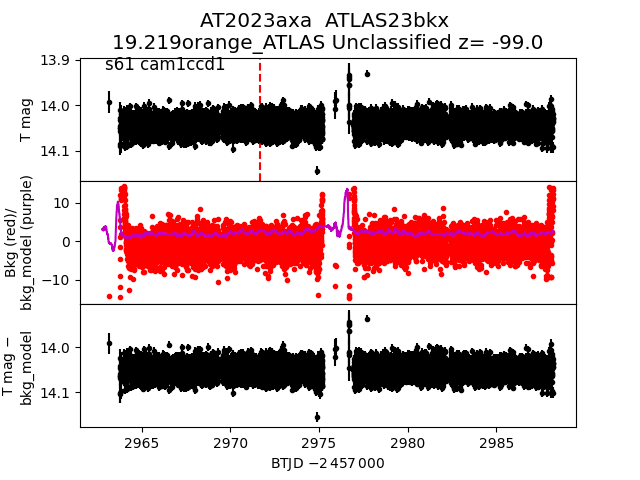
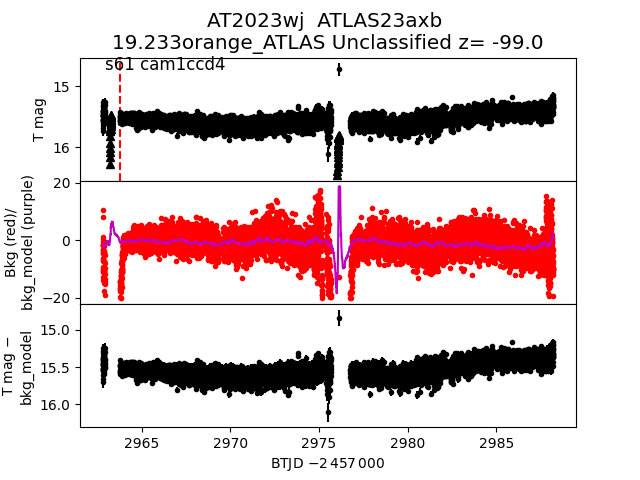
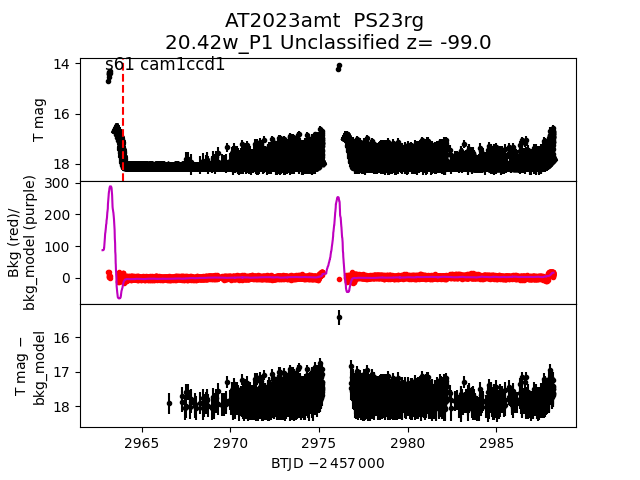
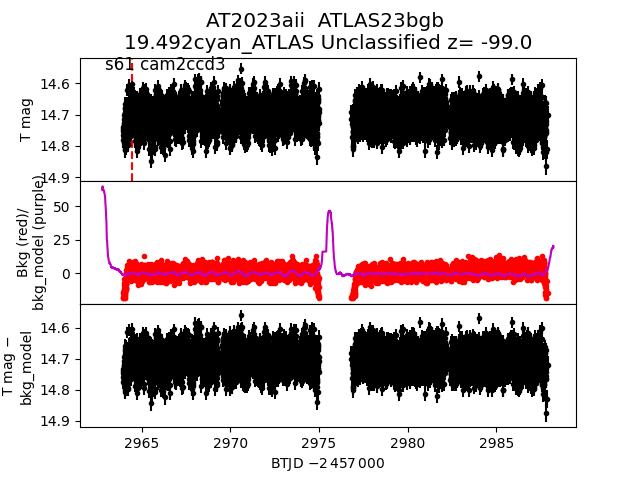
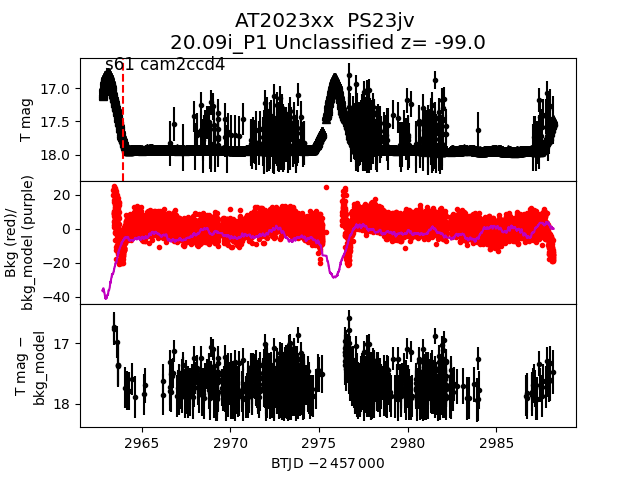
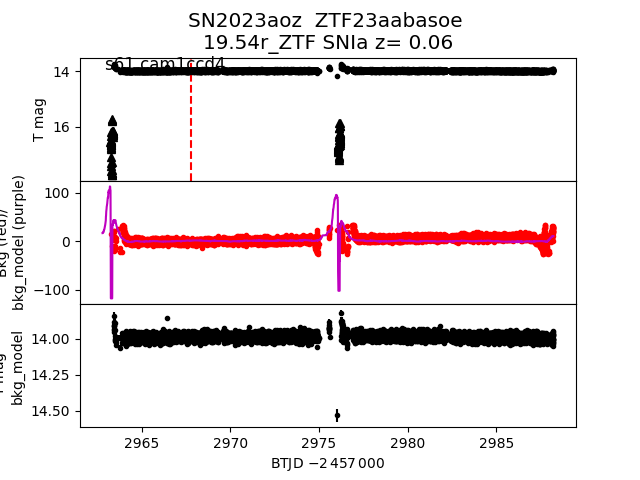
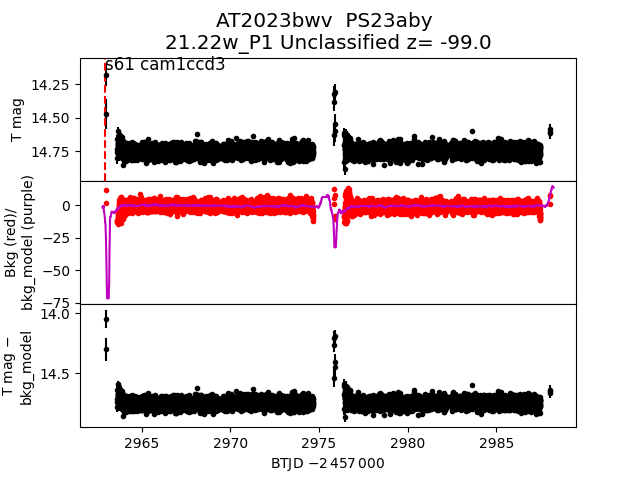
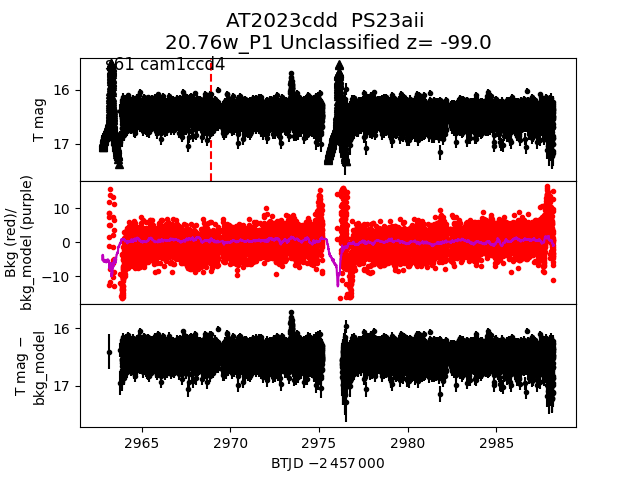
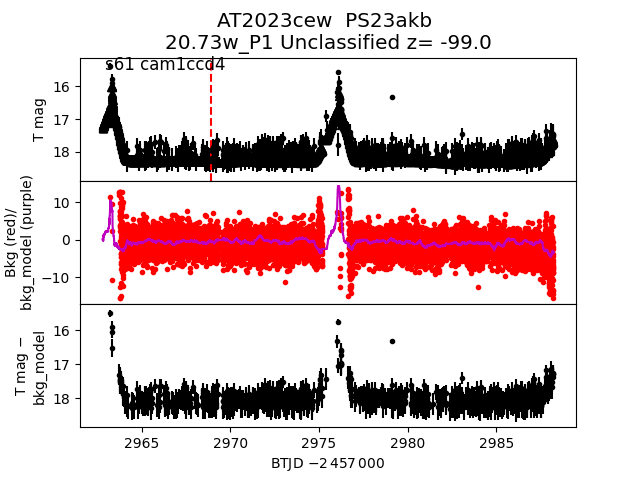
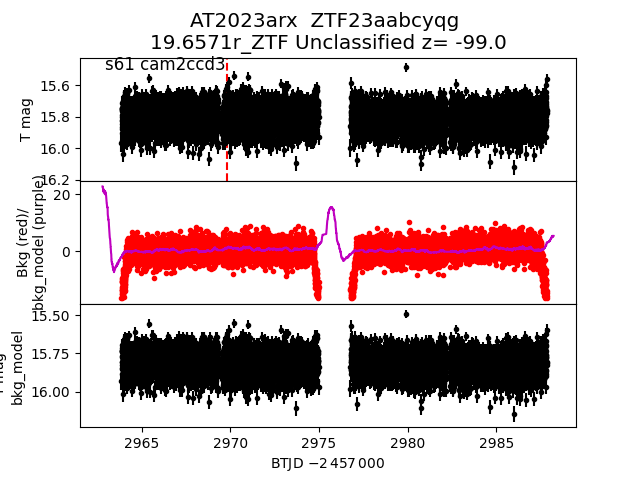
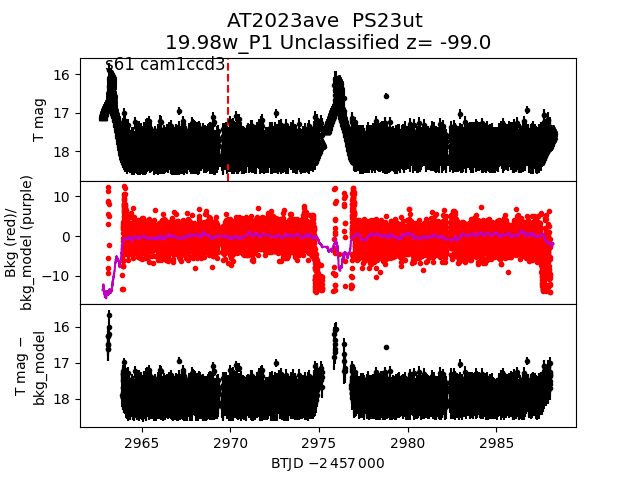
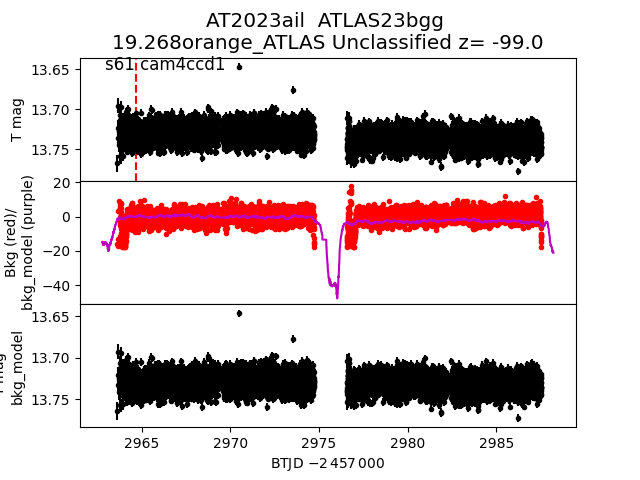
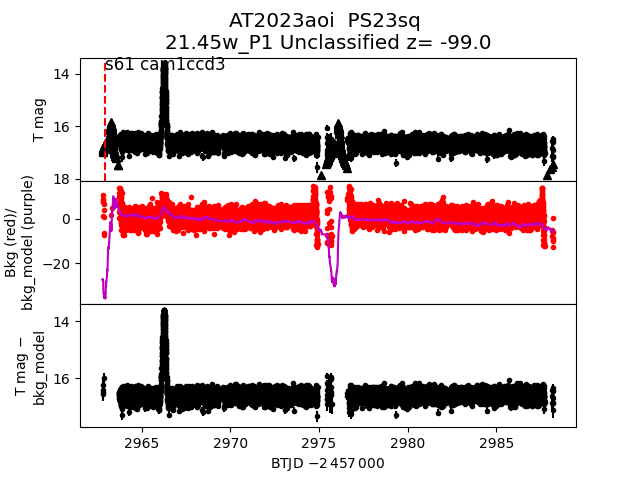
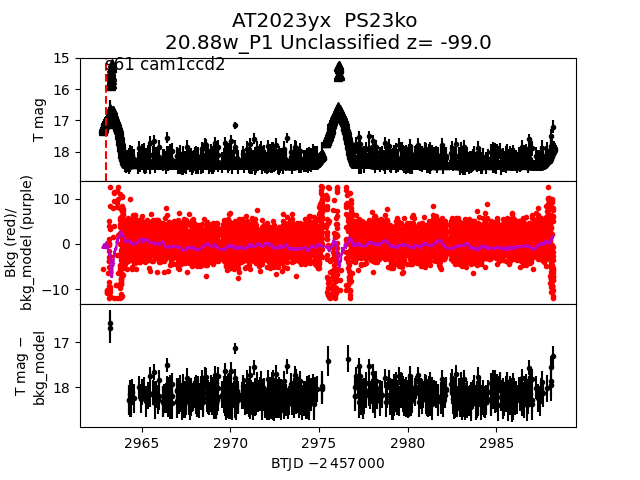
Each figure has three panels. The top panel shows the transient light curve, the middle panel shows the local background (estimated in an annulus), and the bottom panel shows a "background-model corrected" light curve. Details about the background model are in the README.
The vertical red line marks the time of discovery reported to TNS. Other useful metadata from TNS is in the figure title.
Note that the top and bottom panel are in magnitudes, while the middle panel is in differential flux units. The magnitudes are calibrated to the flux in the reference image used for image subtraction. Thus, flux from the host galaxy is included in these magnitudes.
3-sigma upper limits are plotted as triangles with no errorbars. A typical limiting magnitude is 19.6 in 30 minutes or 18.4 in 200 seconds (for low backgrounds).
The links allow you to download the light curve data as a text file.
More details in the README.
2023ahn
 2023atz
 2023blv
 2023ccu
 2023bxf
 2023bba
 2023axc
 2023bre
 2023zt
 2023bms
 2023adh
 2023xz
 2023aob
 2023ams
 2023ann
 2023bjv
 2023aeh
 2023yz
 2023bwx
 2023aot
 2023akj
 2023blo
 2023bju
 2023anm
 2023yp
 2023baz
 2023bys
 2023air
 2023bod
 2023anw
 2023auu
 2023cgk
 2023boh
 2023aty
 2023avw
 2023bmf
 2023xw
 2023bhp
 2023bxt
 2023alw
 2023bgt
 2023bee
 2023ccg
 2023bjr
 2023aij
 2023amw
 2023cbn
 2023anj
 2023bgq
 2023cgi
 2023bxq
 2023aan
 2023anc
 2023aic
 2023auh
 2023aho
 2023bbi
 2023bpc
 2023aar
 2023xq
 2023bov
 2023cbr
 2023axa
 2023wj
 2023amt
 2023aii
 2023xx
 2023aoz
 2023bwv
 2023cdd
 2023cew
 2023arx
 2023ave
 2023ail
 2023aoi
 2023yx
 2023xk