all transients in sector60 (42 total)
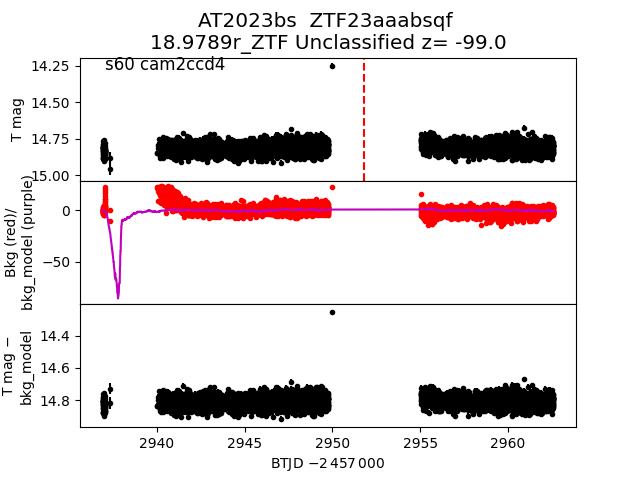
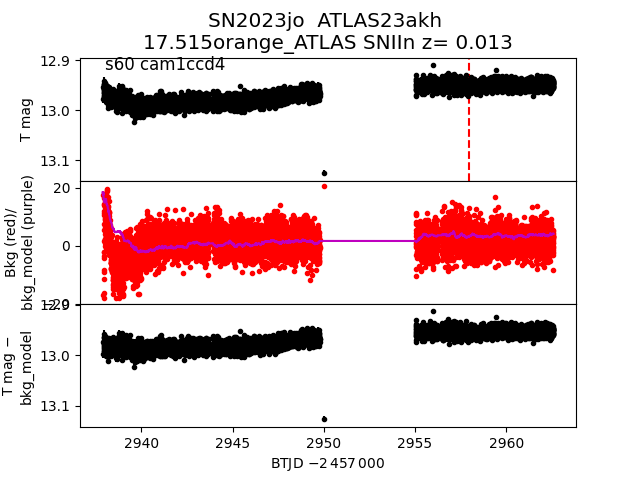
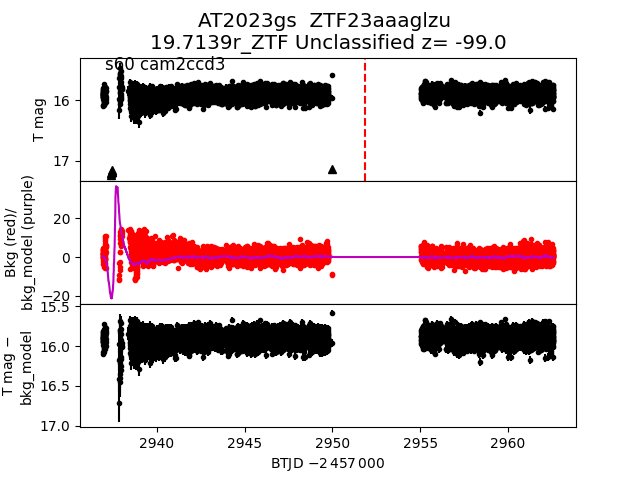
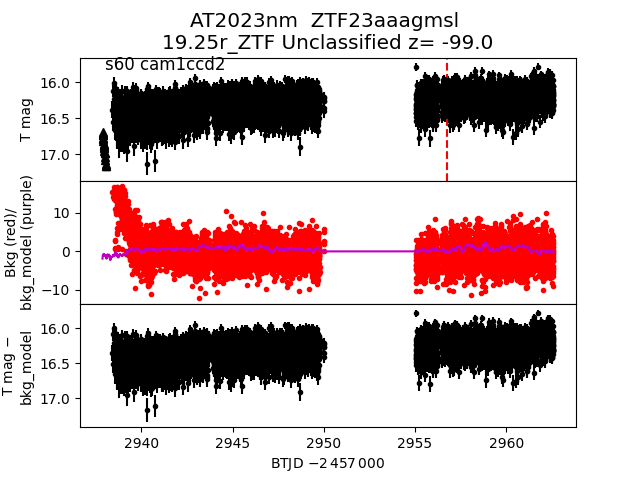
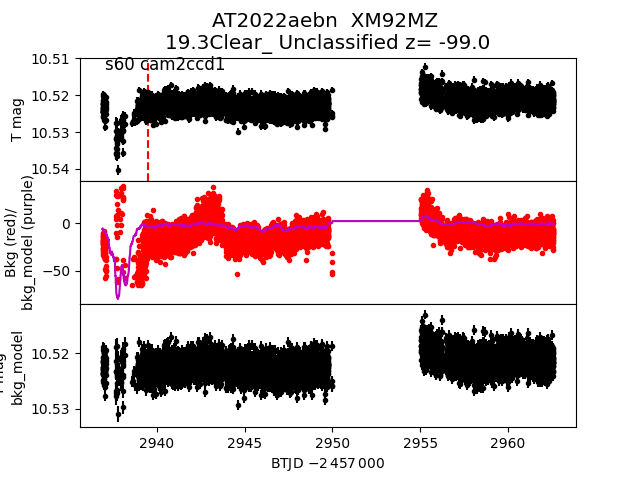
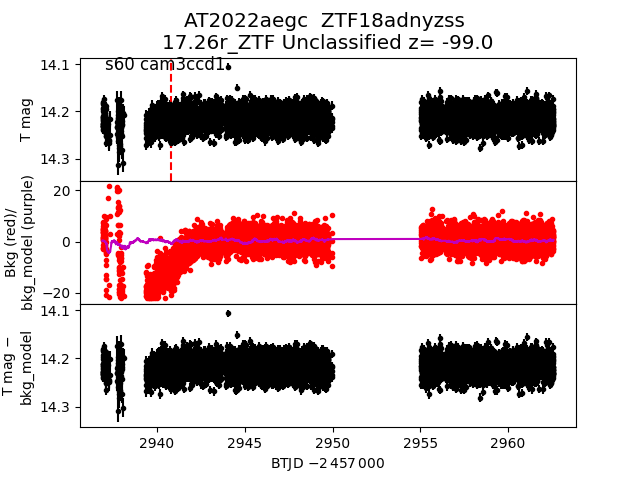
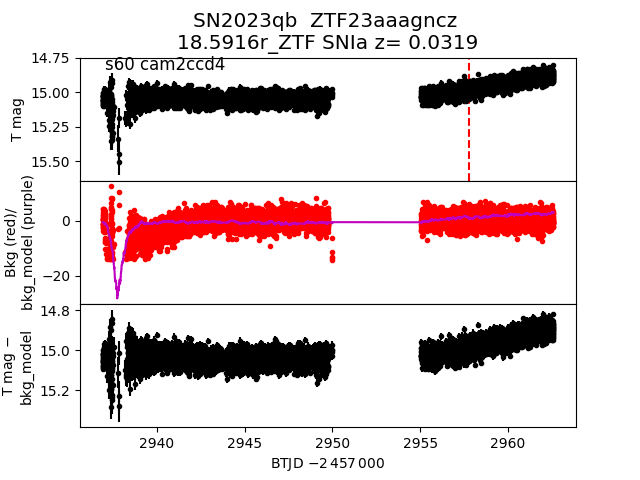
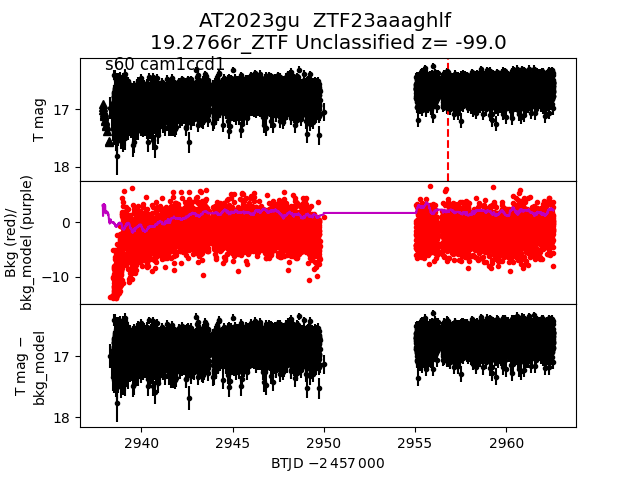
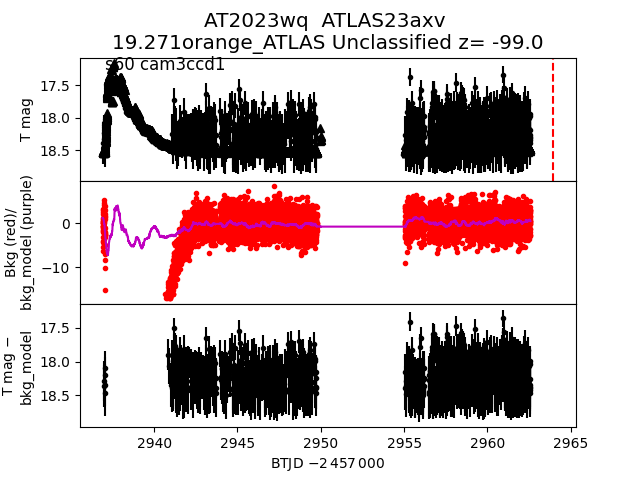
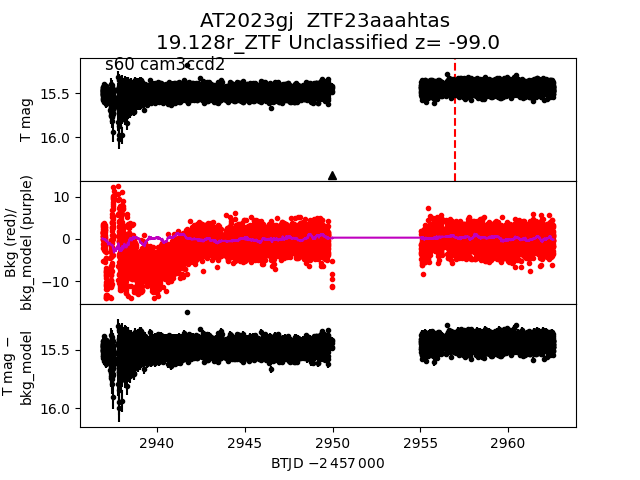
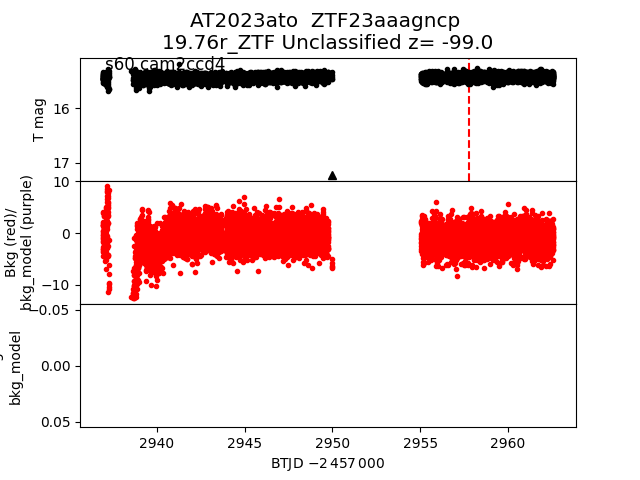
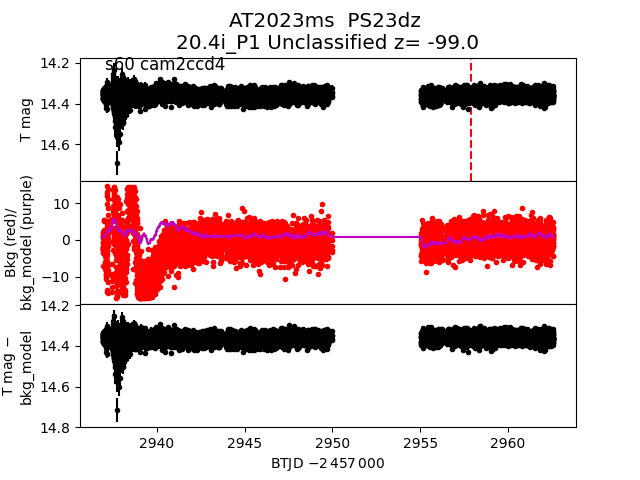
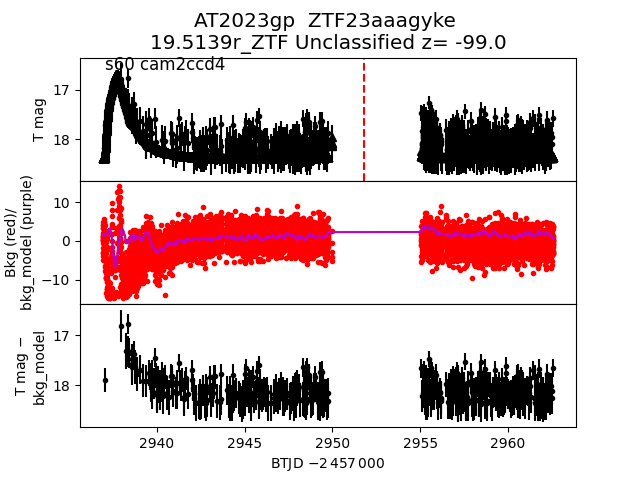
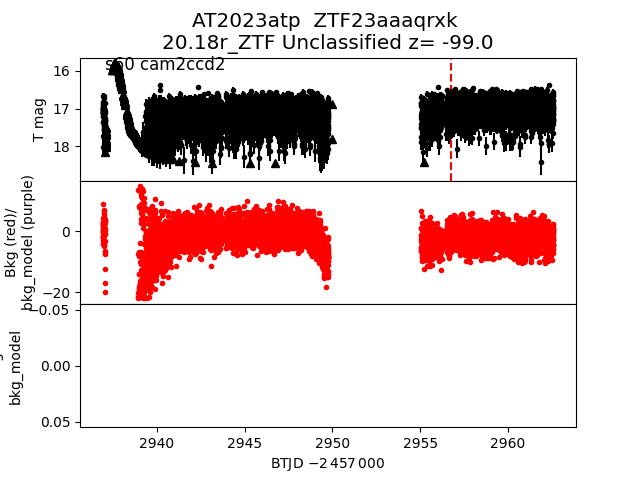
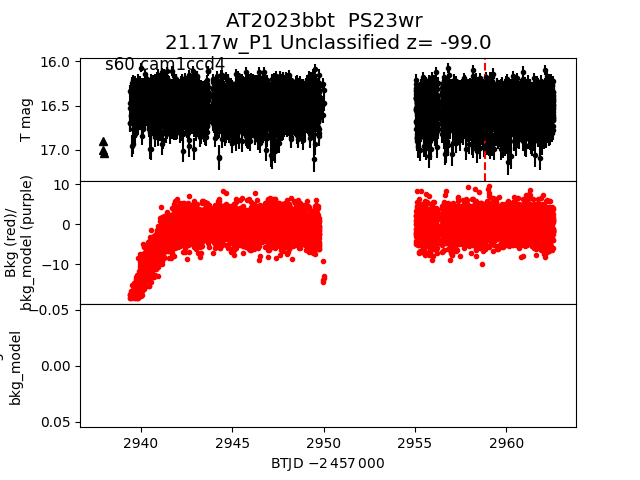
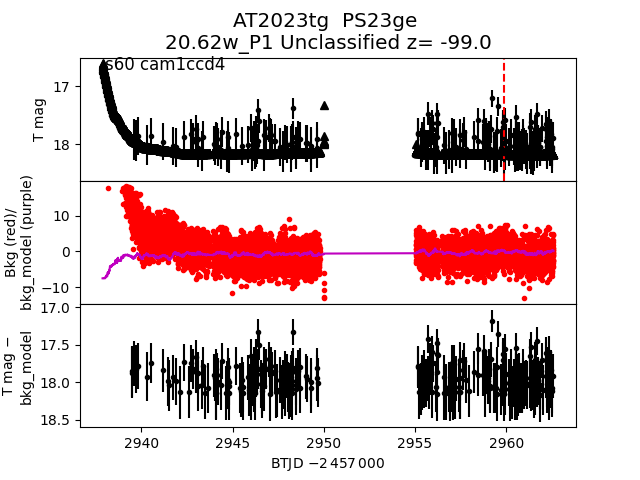
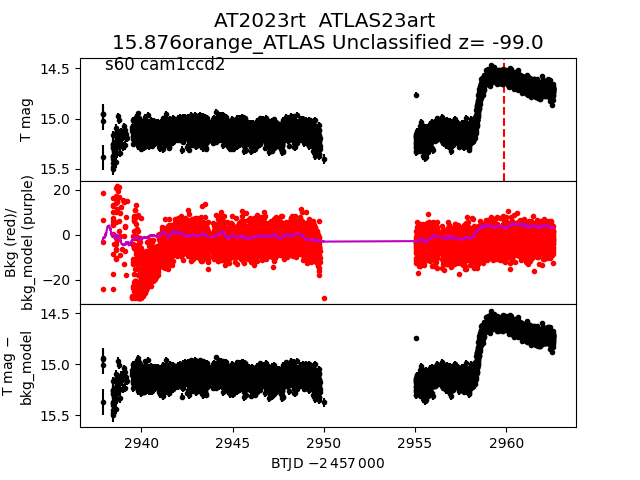
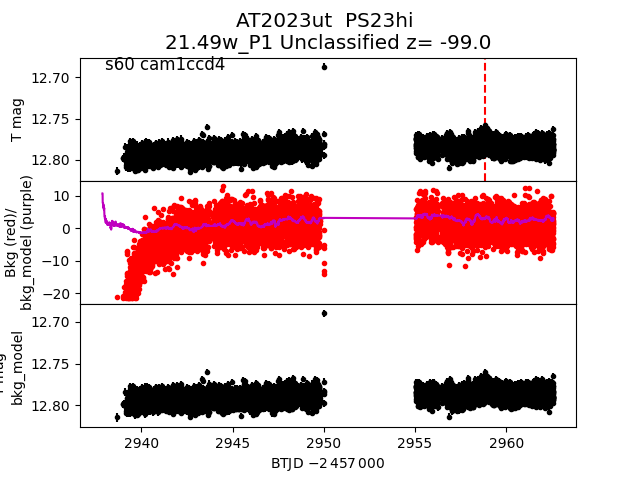
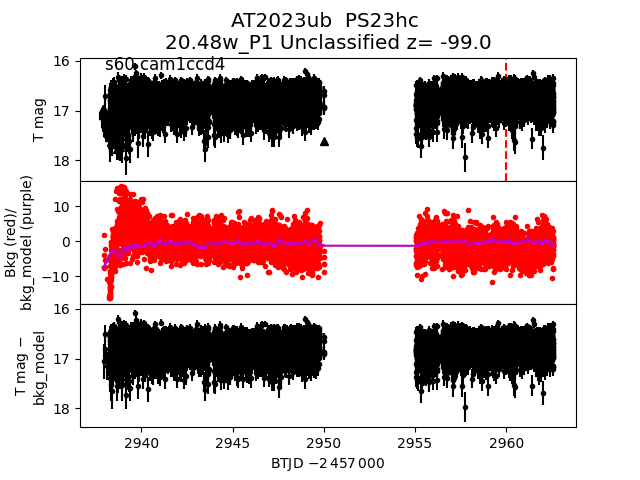
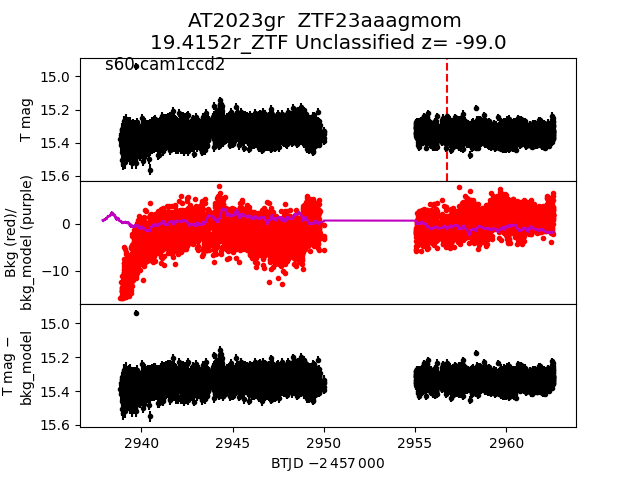
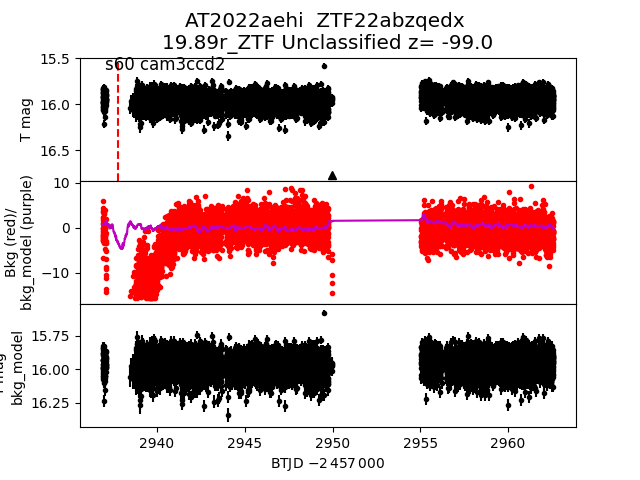
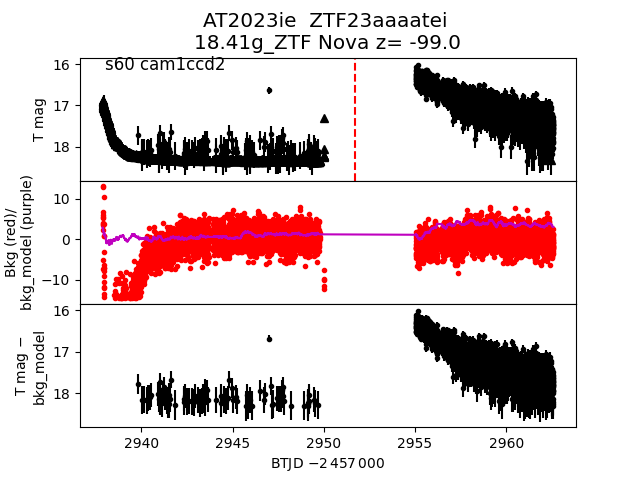
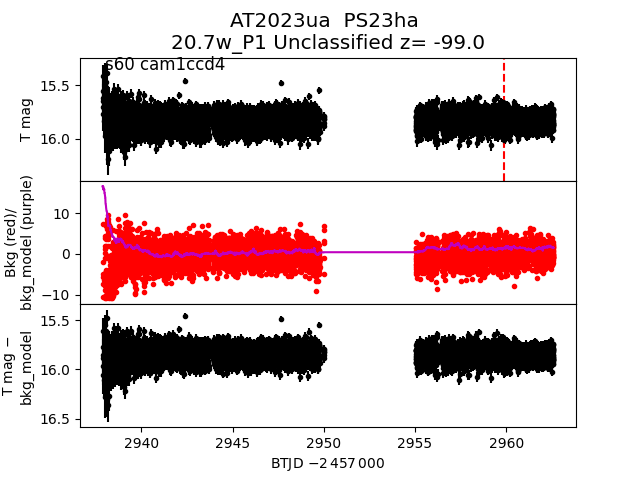
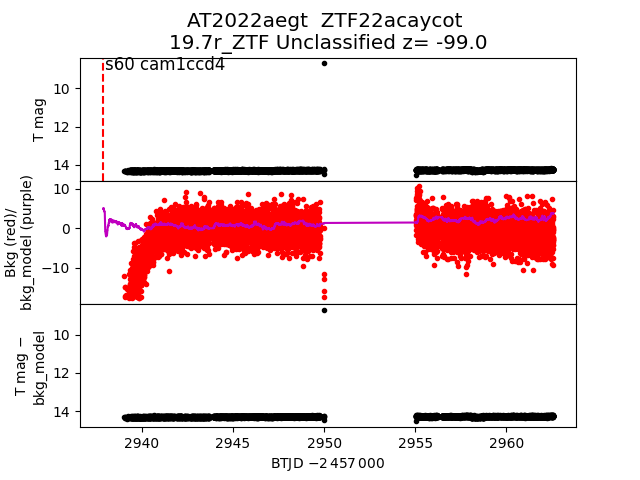
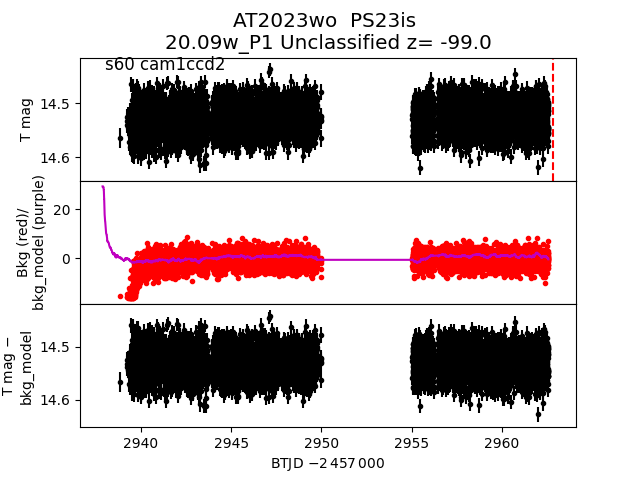
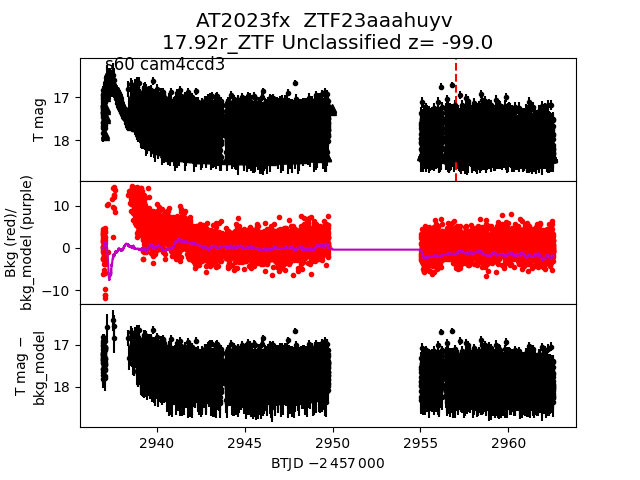
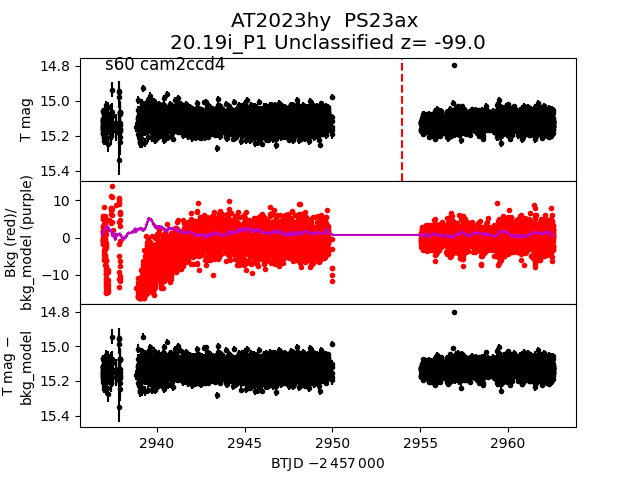
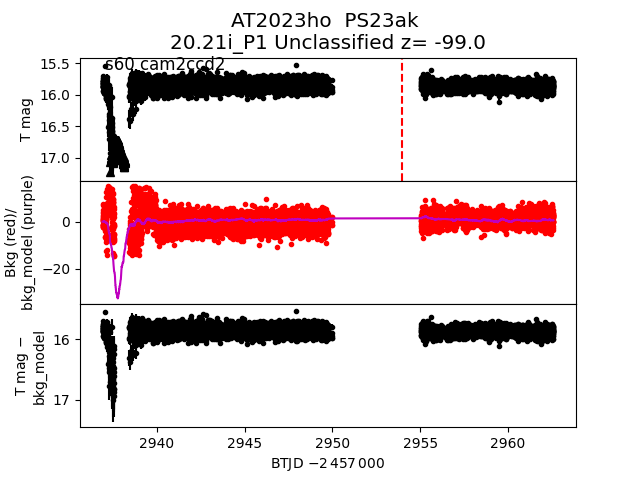
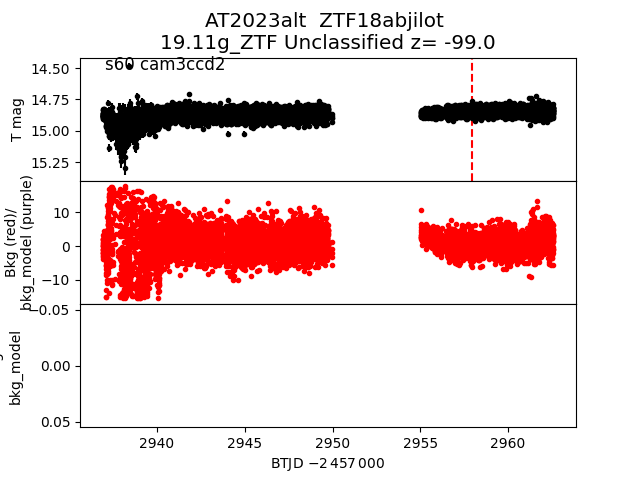
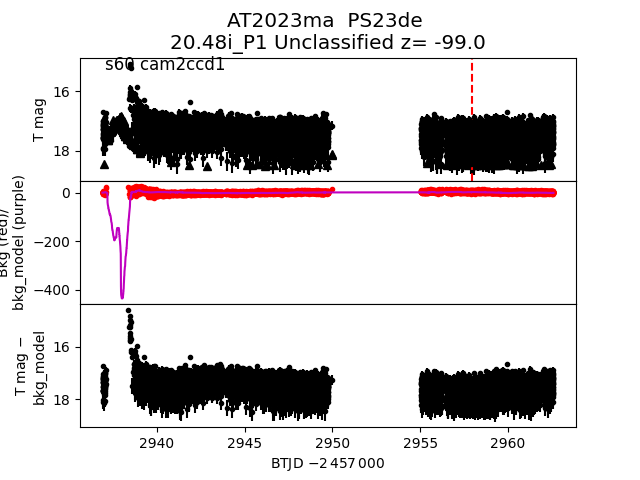
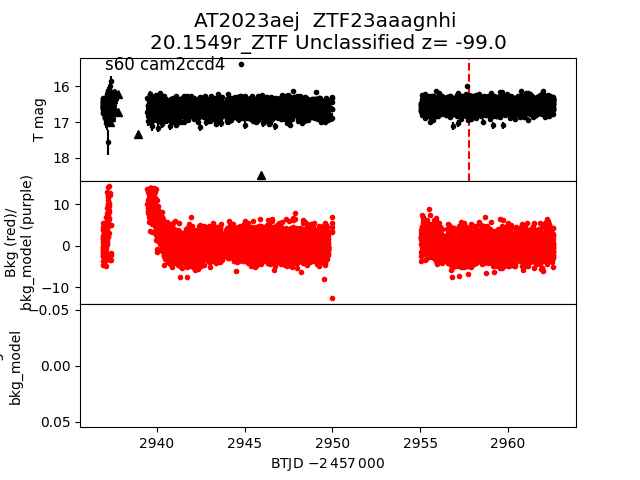
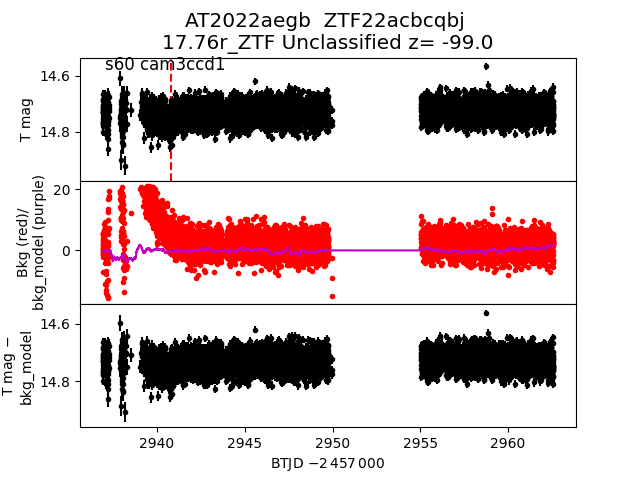
Each figure has three panels. The top panel shows the transient light curve, the middle panel shows the local background (estimated in an annulus), and the bottom panel shows a "background-model corrected" light curve. Details about the background model are in the README.
The vertical red line marks the time of discovery reported to TNS. Other useful metadata from TNS is in the figure title.
Note that the top and bottom panel are in magnitudes, while the middle panel is in differential flux units. The magnitudes are calibrated to the flux in the reference image used for image subtraction. Thus, flux from the host galaxy is included in these magnitudes.
3-sigma upper limits are plotted as triangles with no errorbars. A typical limiting magnitude is 19.6 in 30 minutes or 18.4 in 200 seconds (for low backgrounds).
The links allow you to download the light curve data as a text file.
More details in the README.
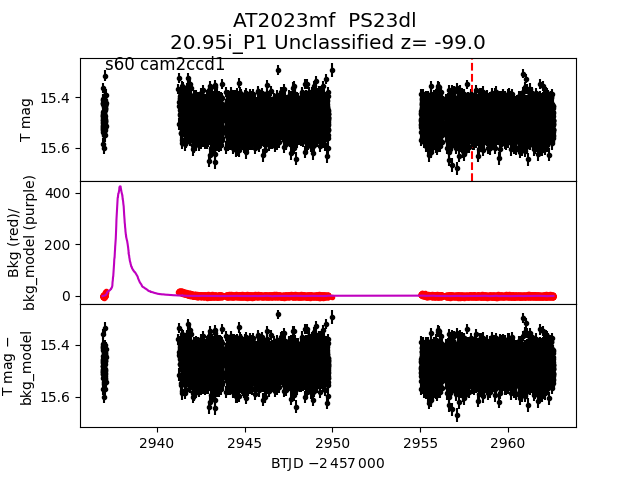
2023mf
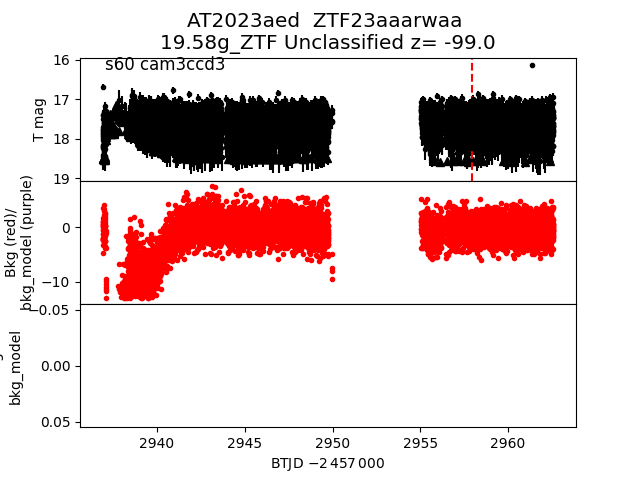
 2023aed
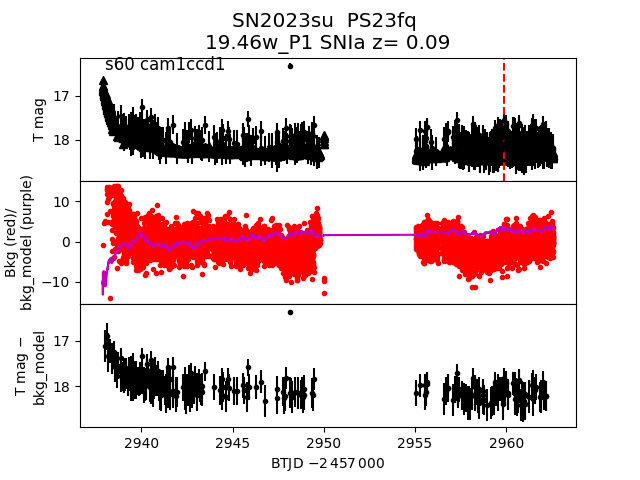
 2023su
 2023jo
 2023gs
 2023nm
 2022aebn
 2022aegc
 2023qb
 2023gu
 2023wq
 2023gj
 2023ato
 2023ms
 2023gp
 2023atp
 2023bbt
 2023tg
 2023rt
 2023ut
 2023ub
 2023gr
 2022aehi
 2023ie
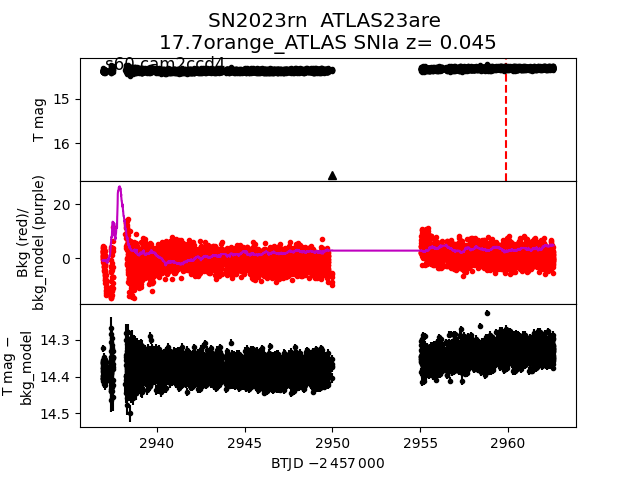
 2023rn
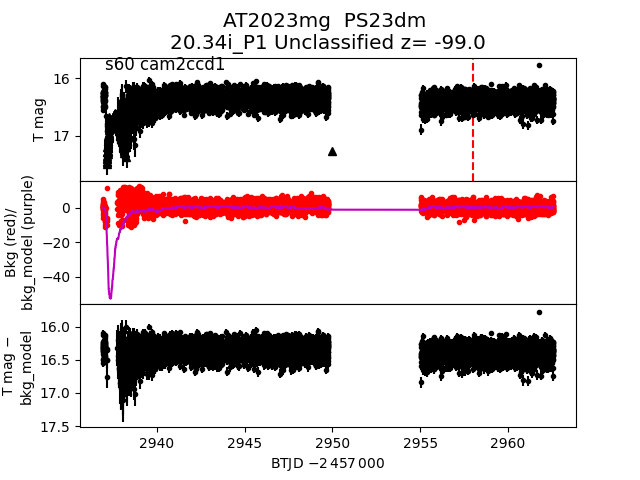
 2023mg
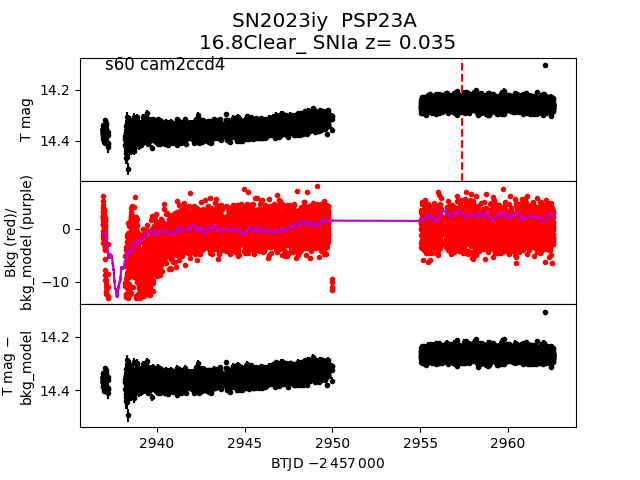
 2023iy
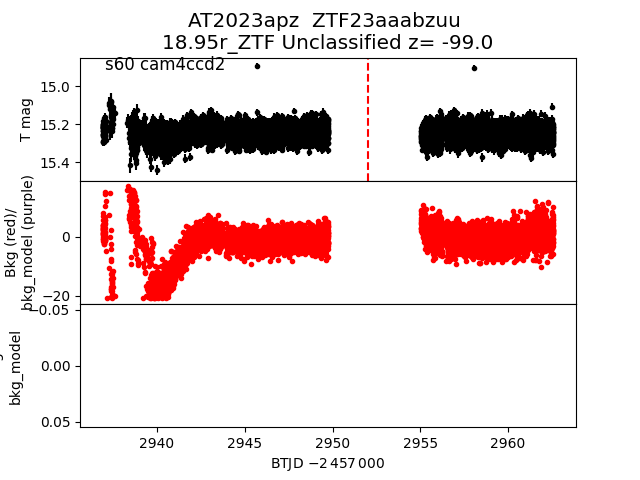
 2023apz
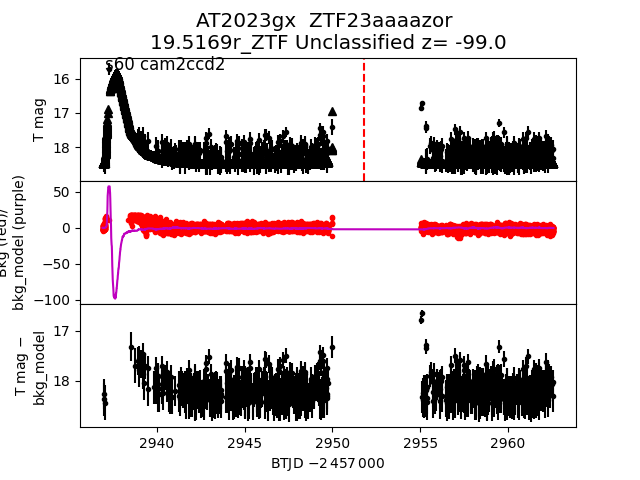
 2023gx
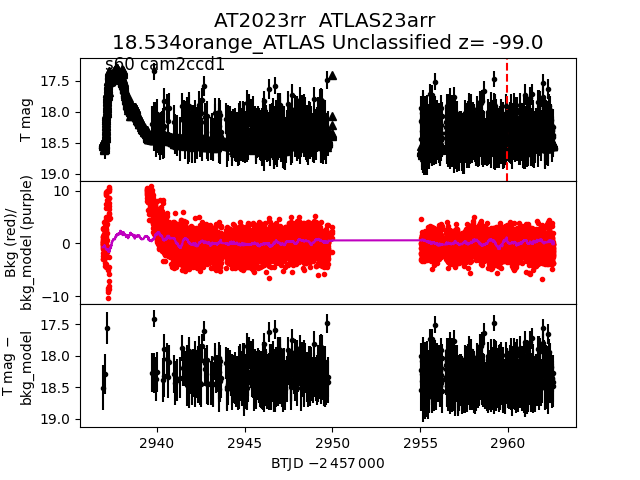
 2023rr
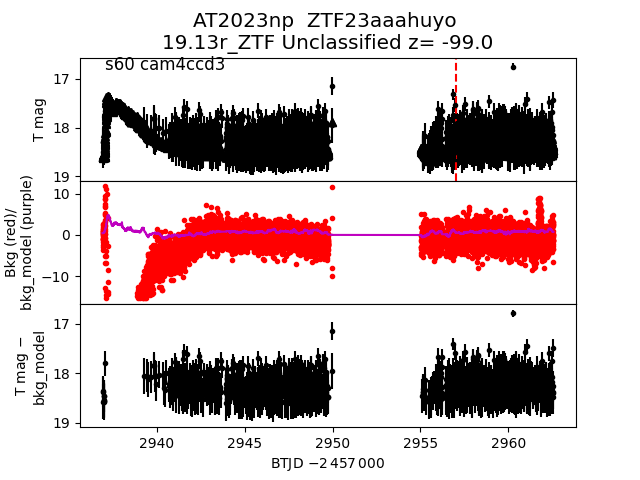
 2023np
 2023ua
 2022aegt
 2023wo
 2023fx
 2023hy
 2023ho
 2023alt
 2023ma
 2023aej
 2022aegb
 2023bs