all transients in sector58 (57 total)
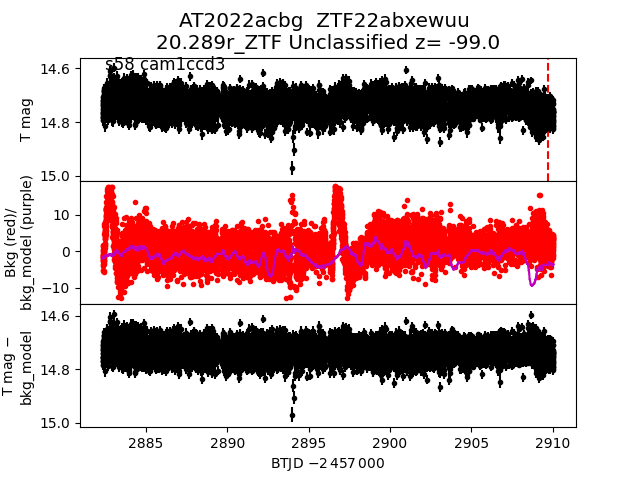
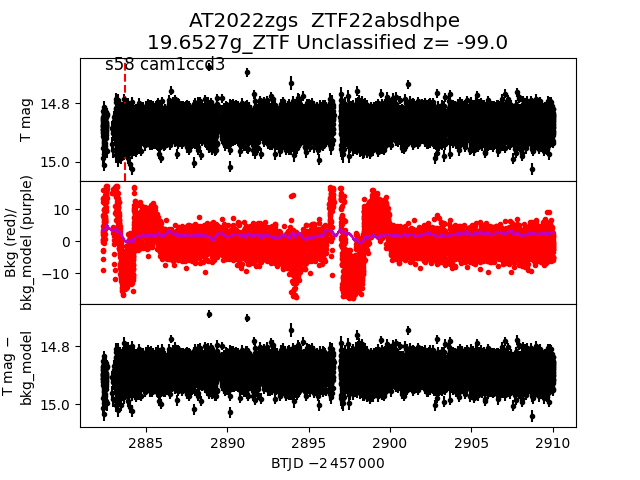
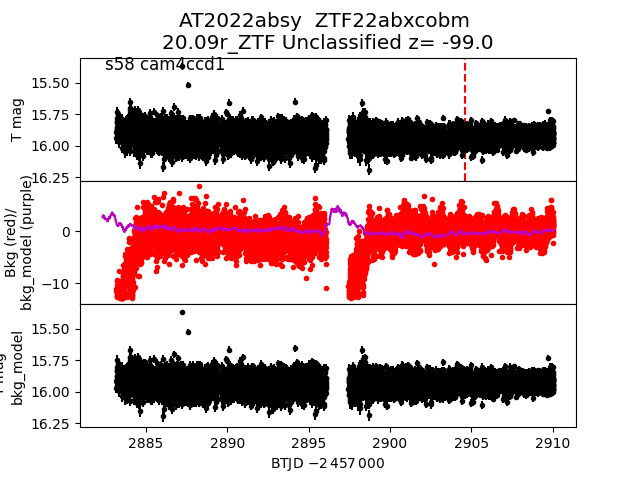
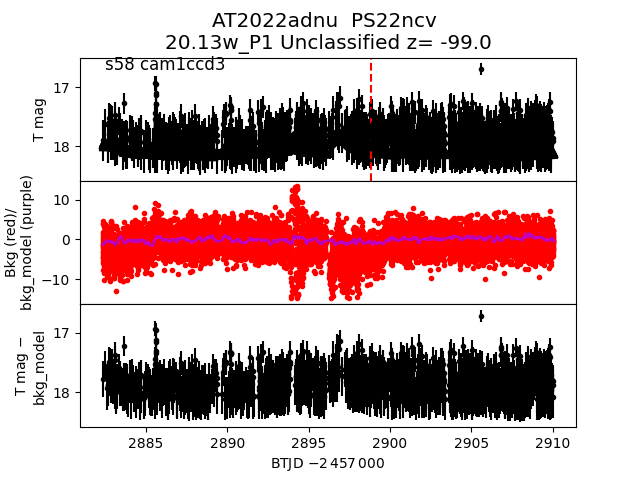
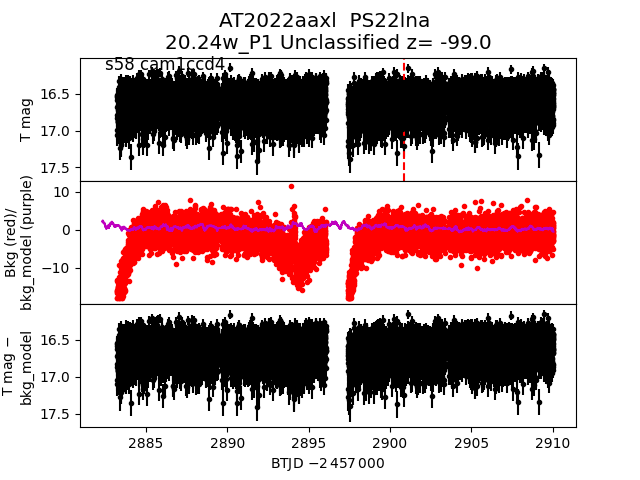
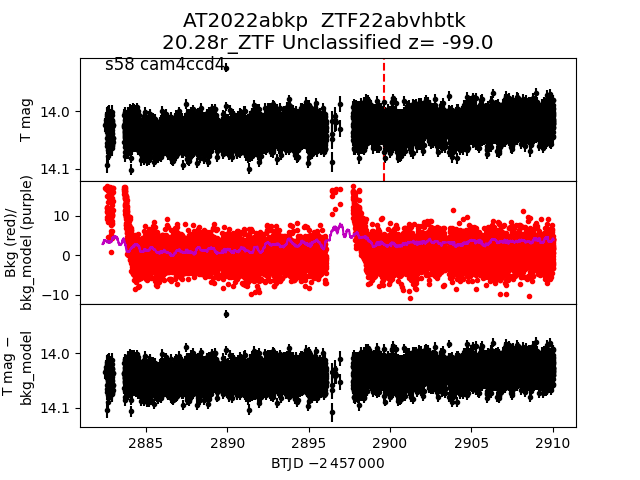
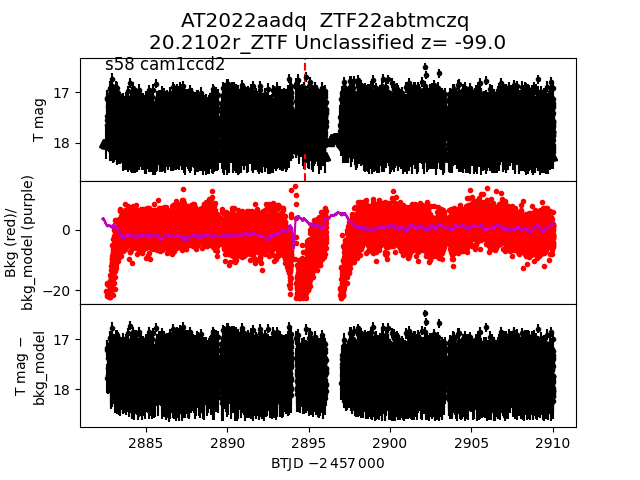
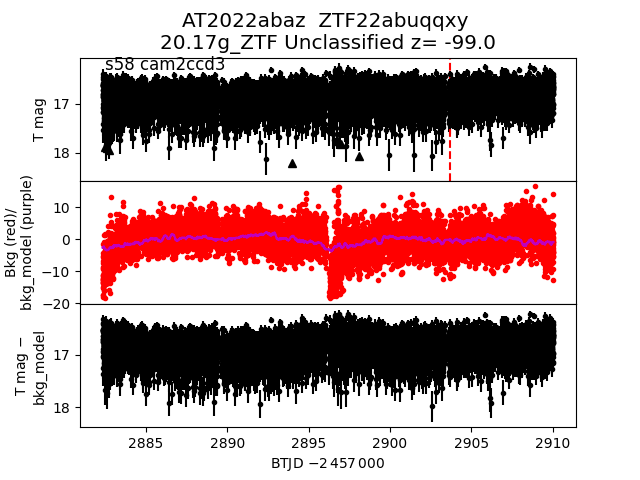
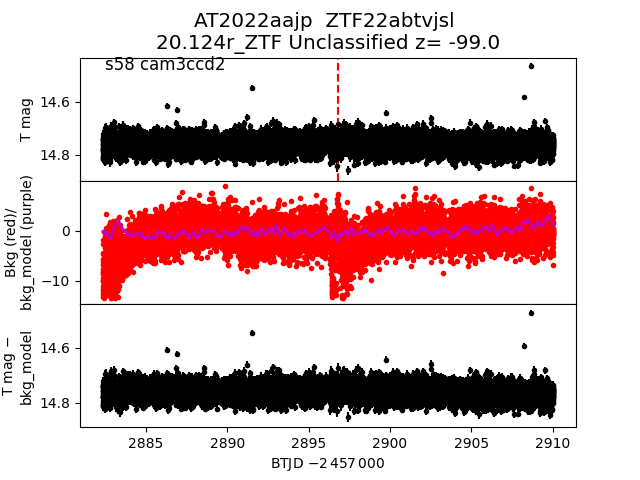
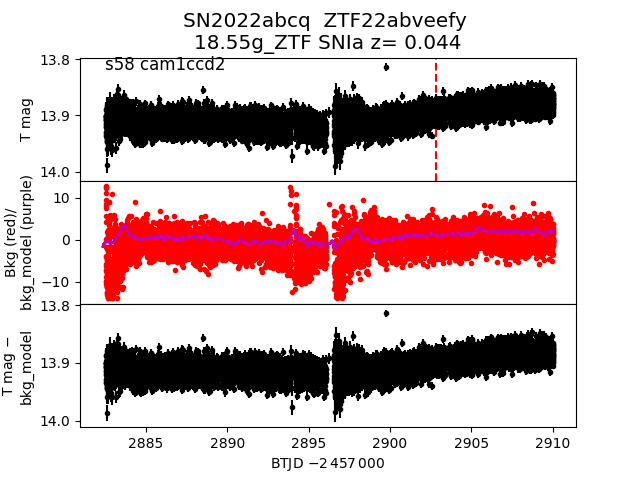
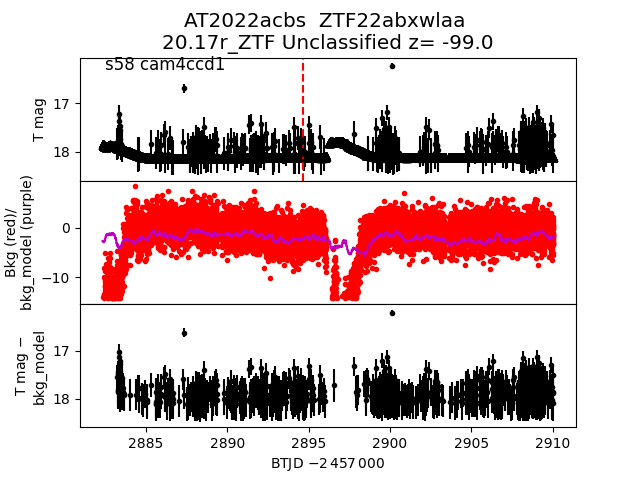
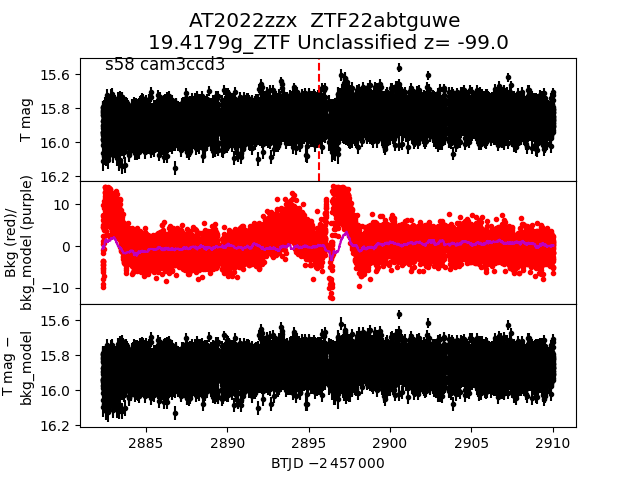
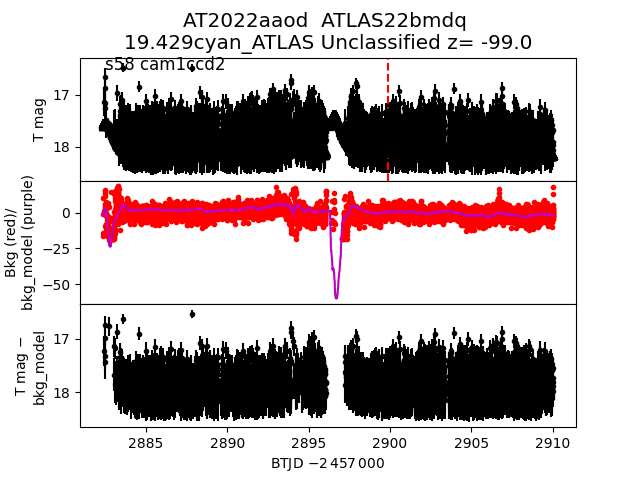
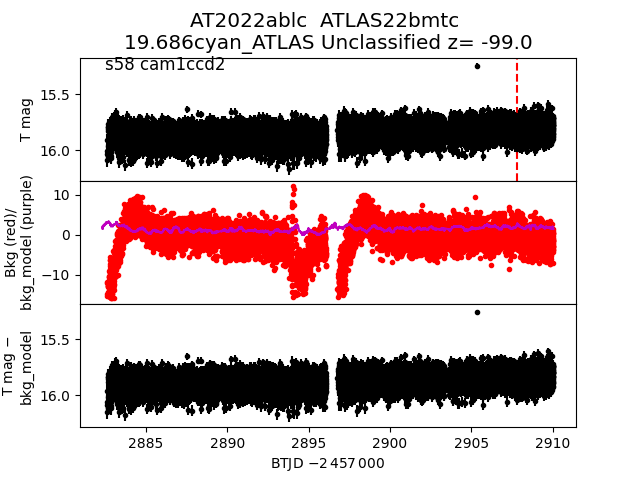
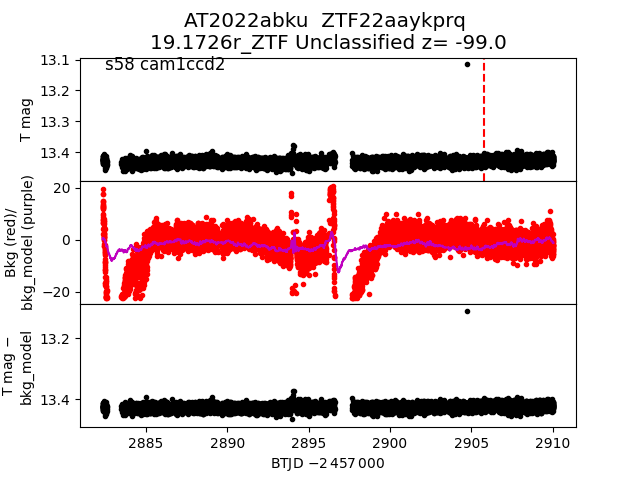
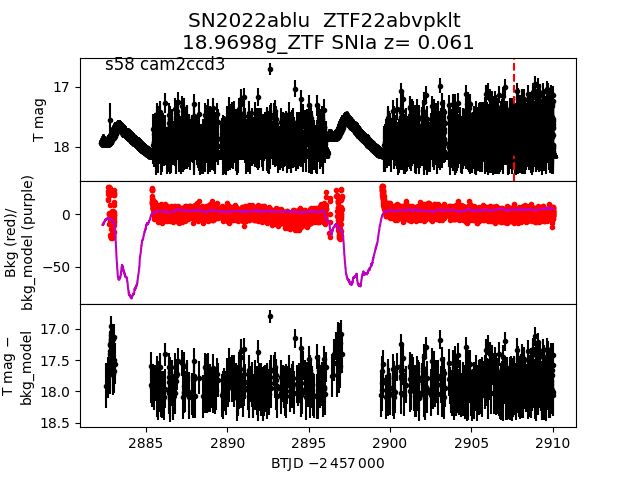
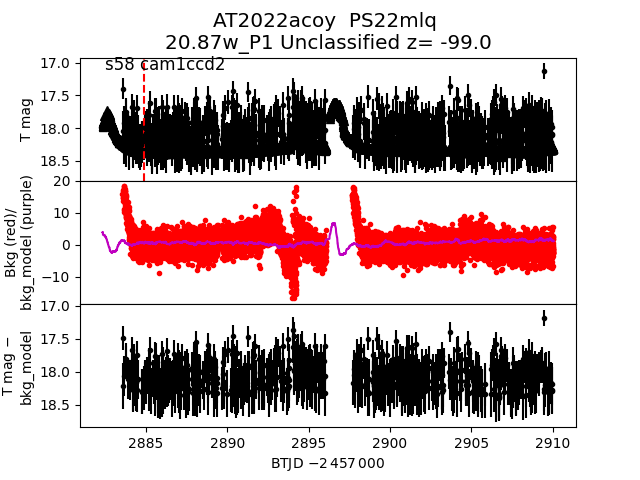
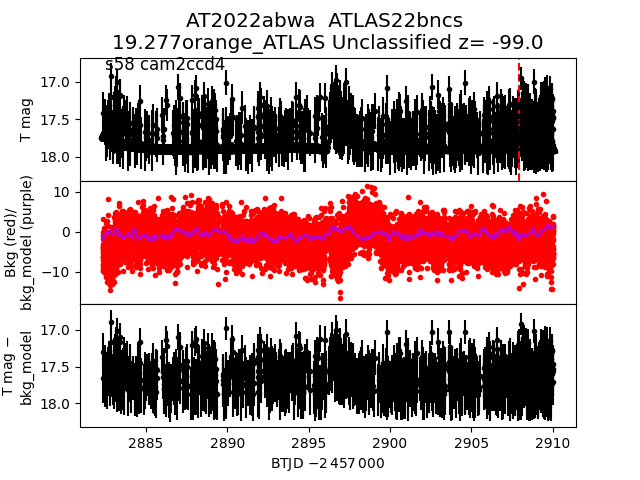
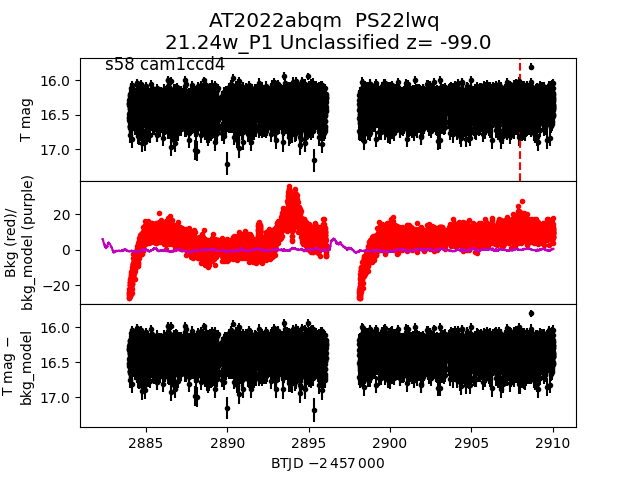
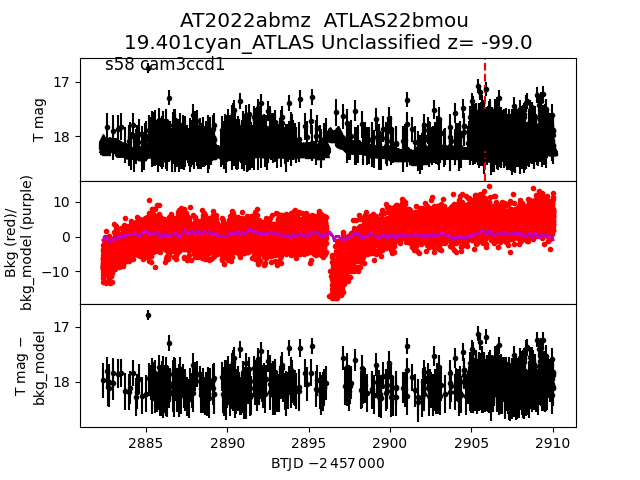
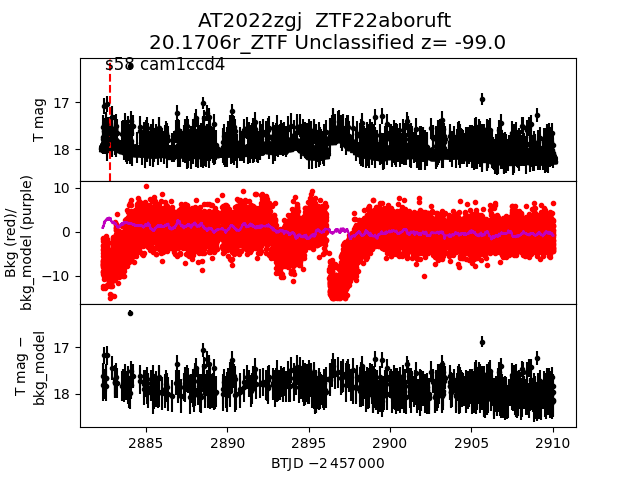
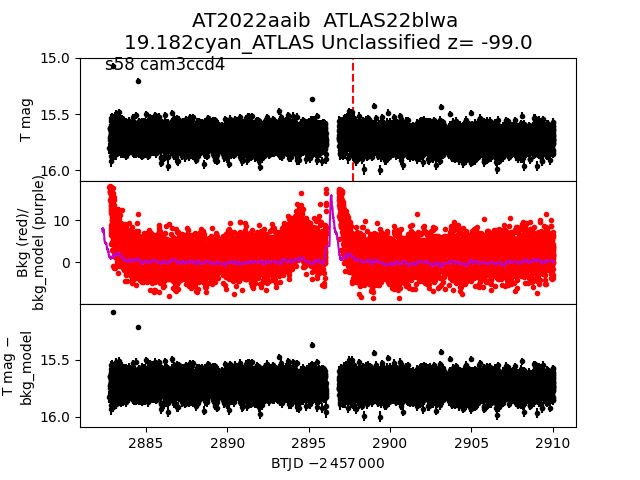
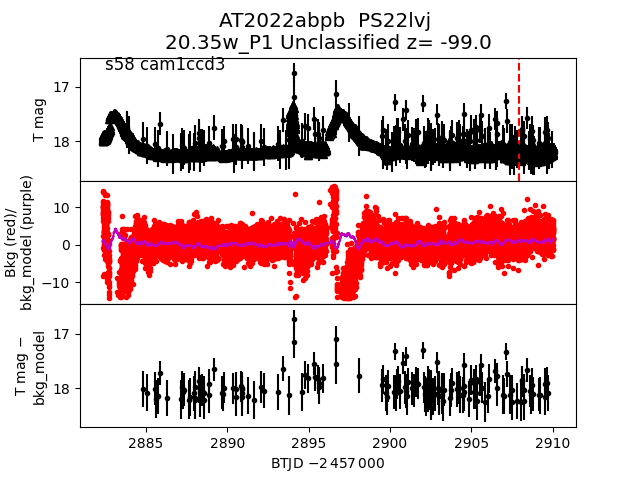
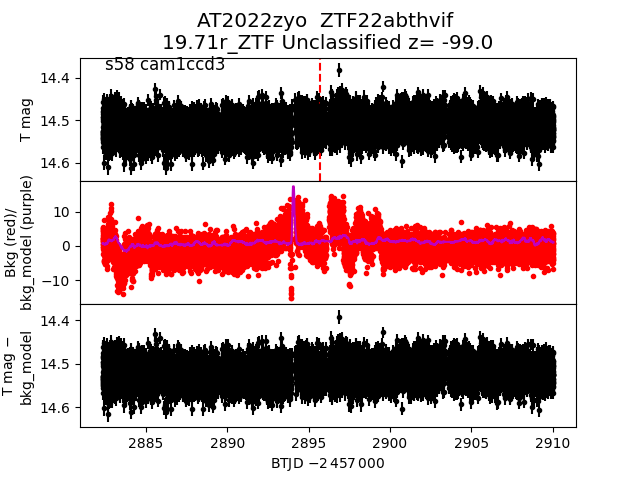
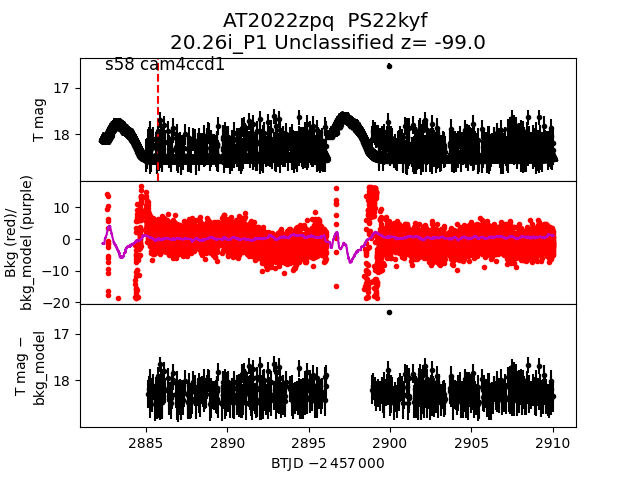
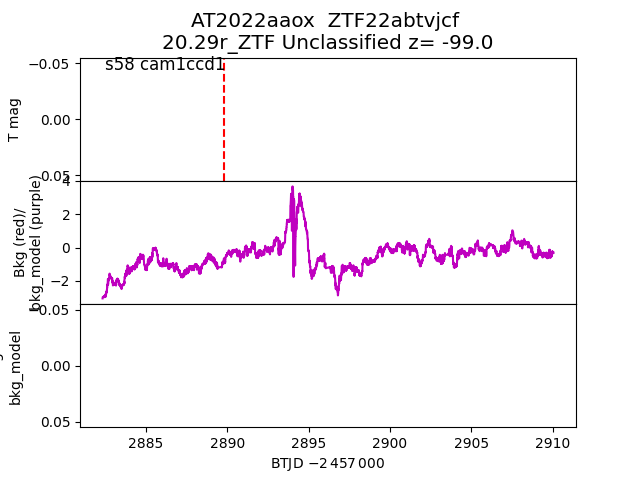
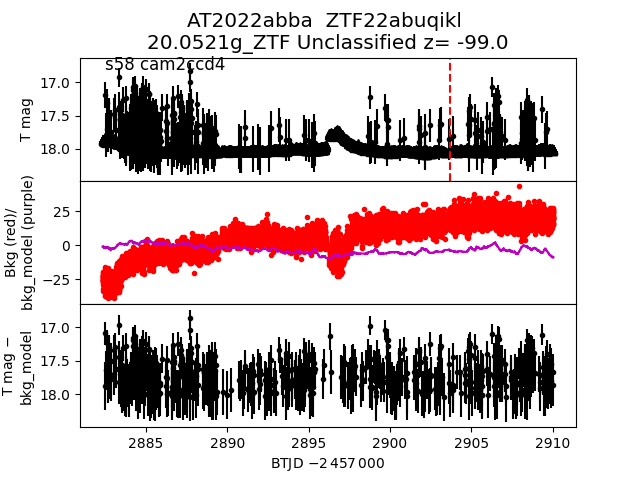
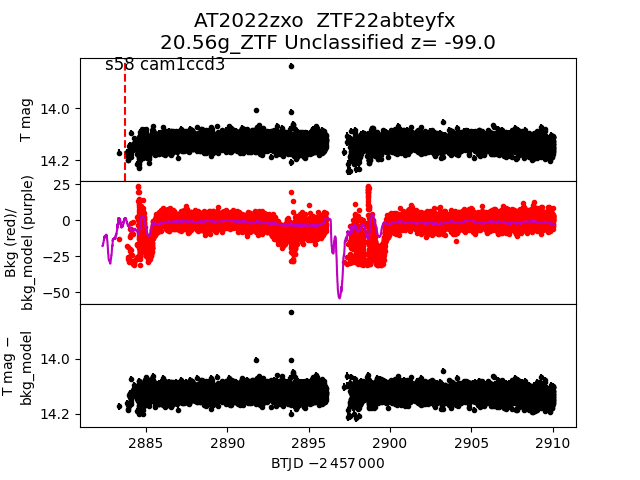
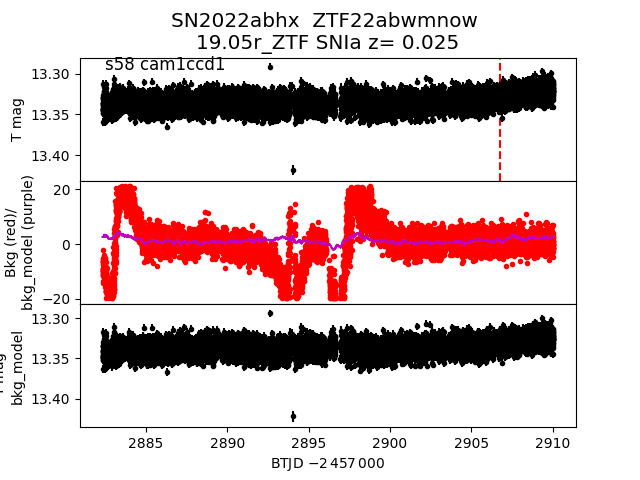
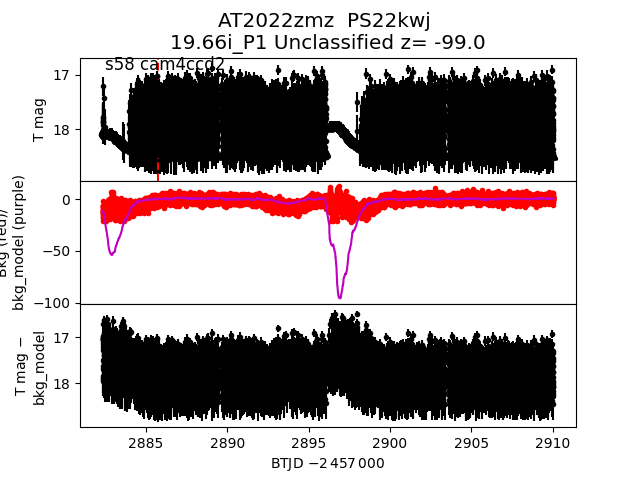
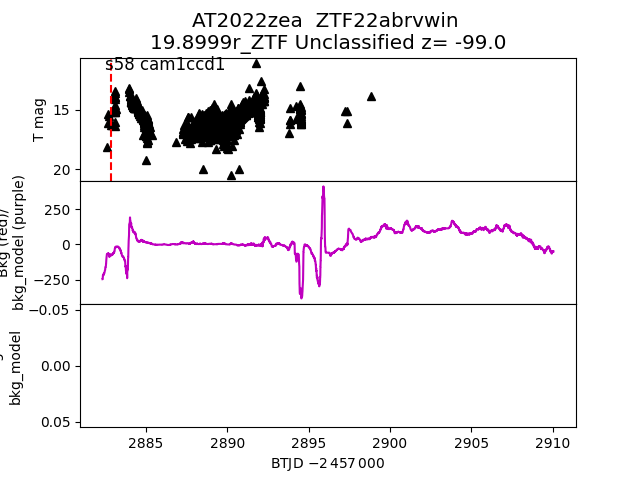
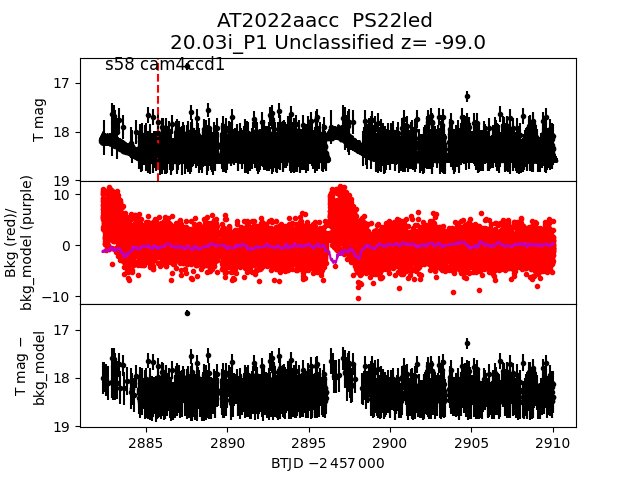
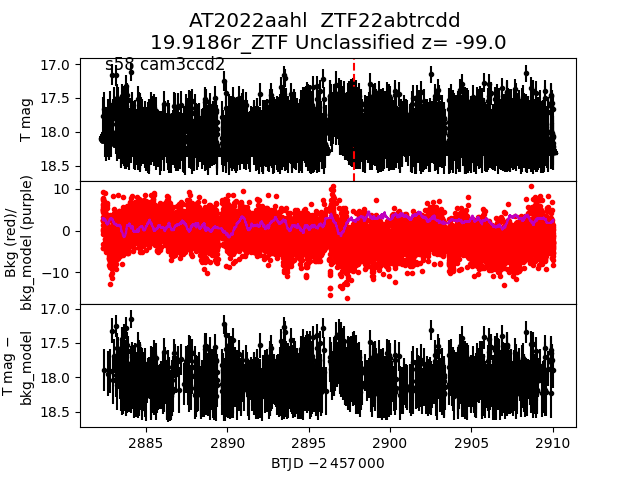
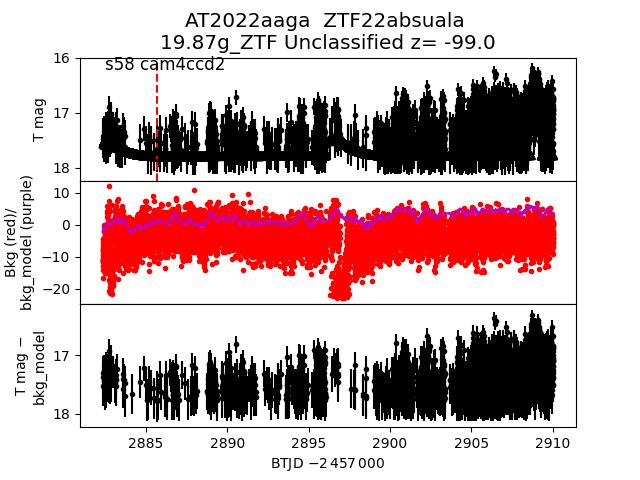
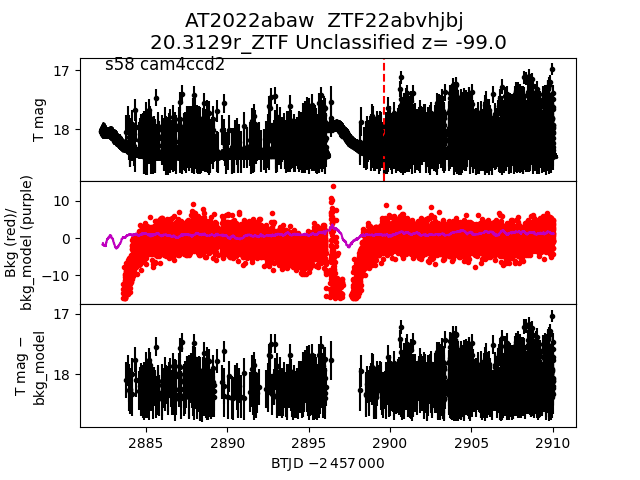
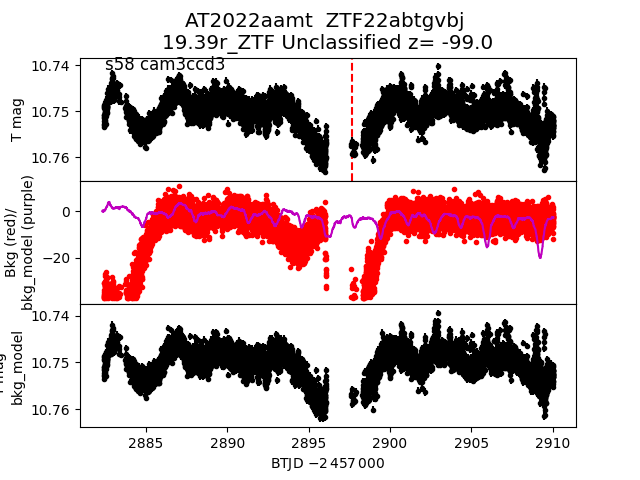
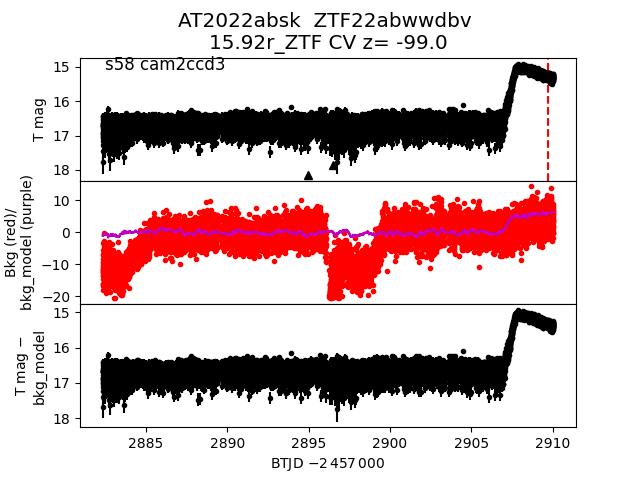
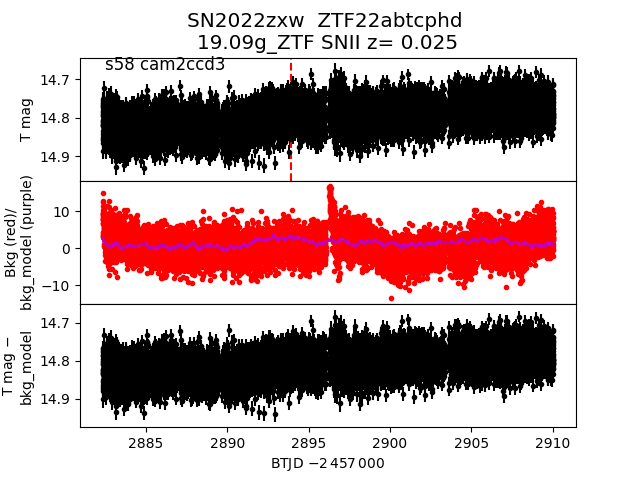
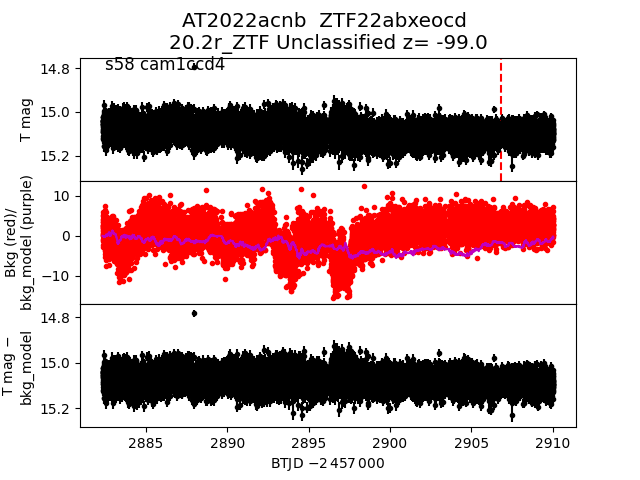
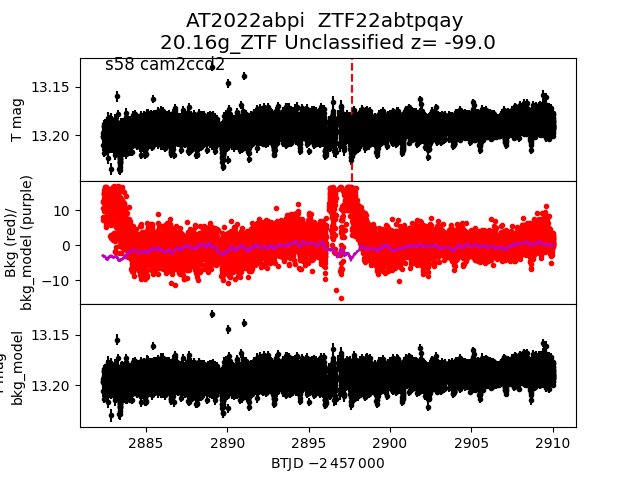
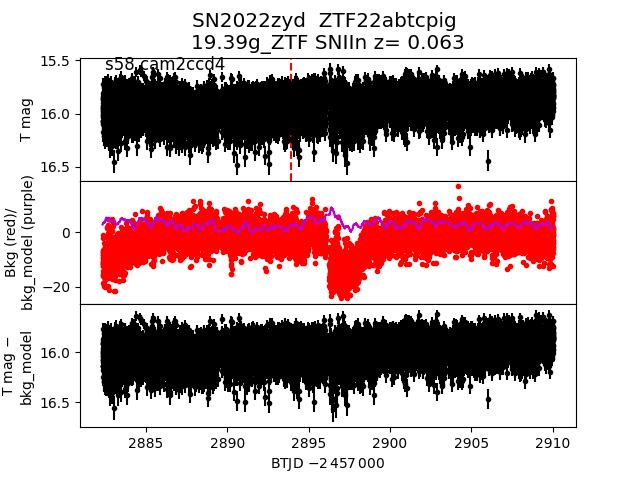
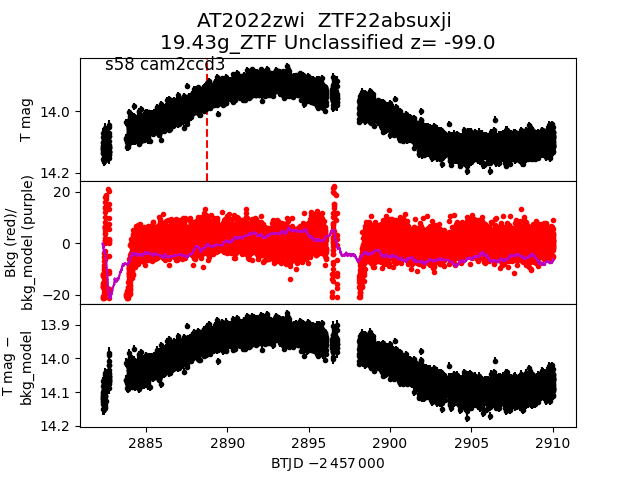
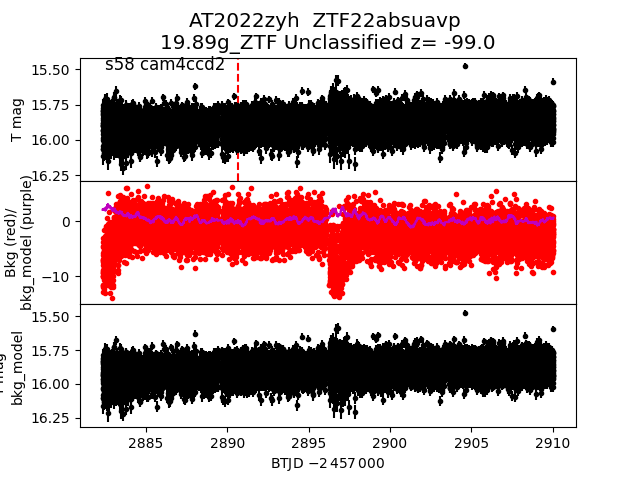
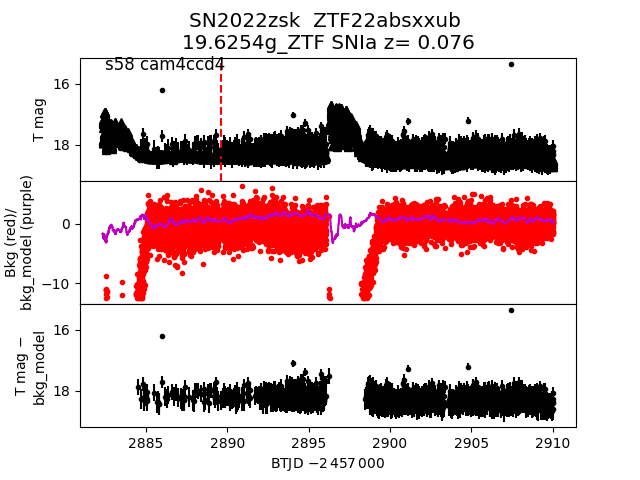
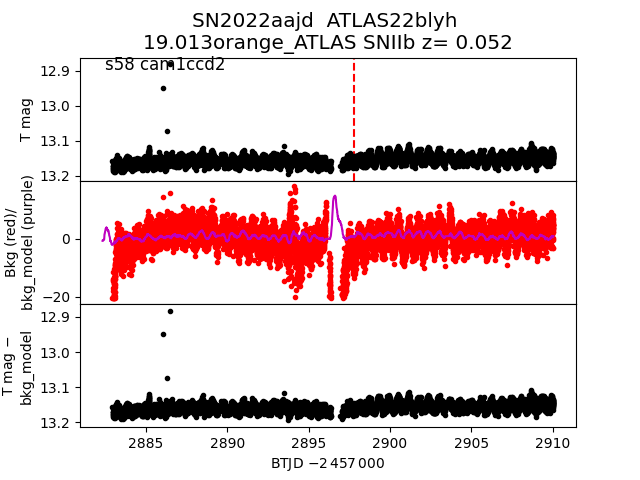
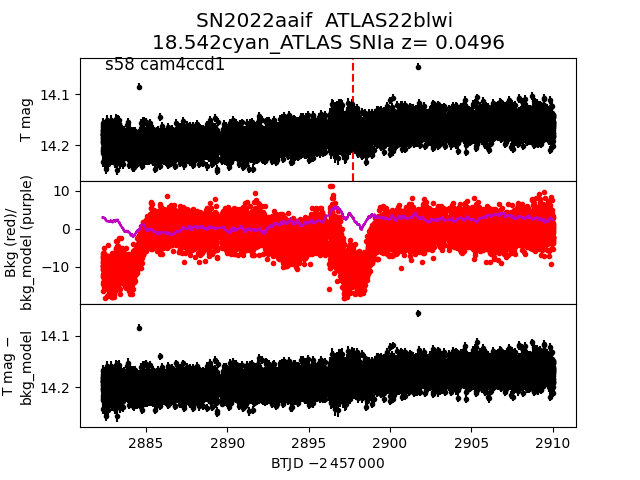
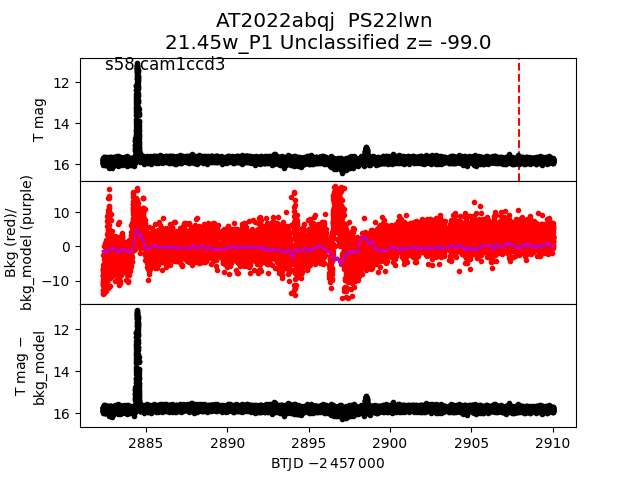
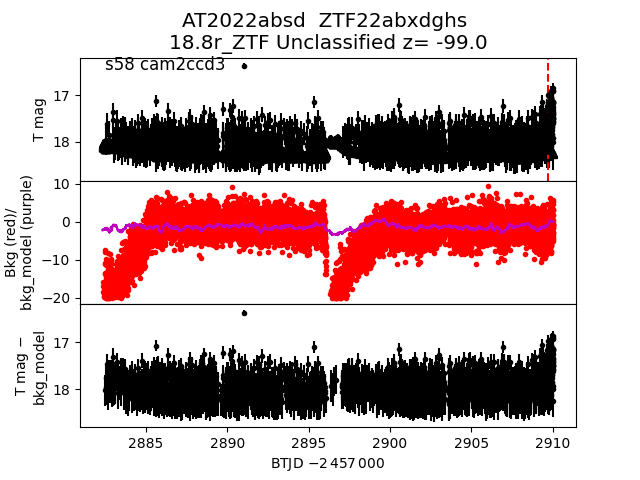
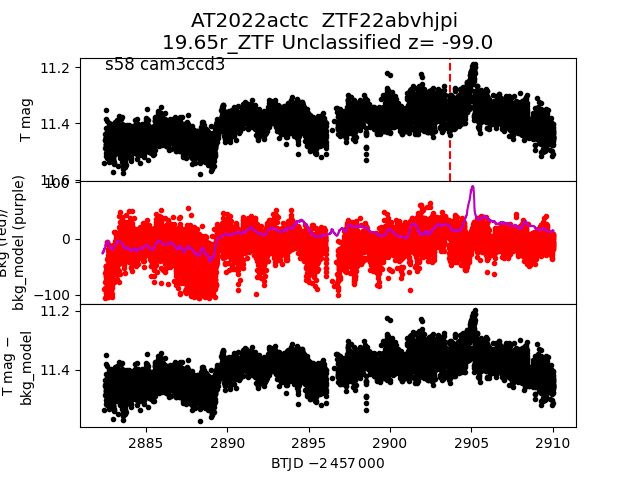
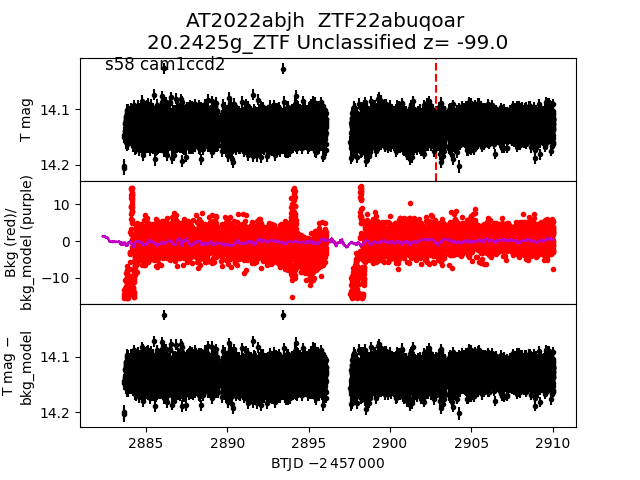
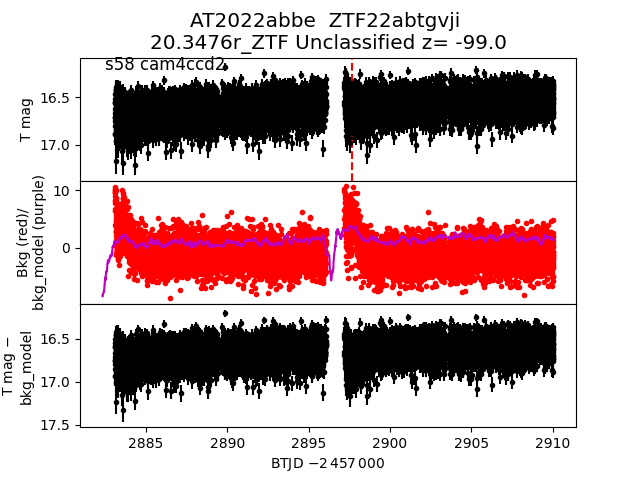
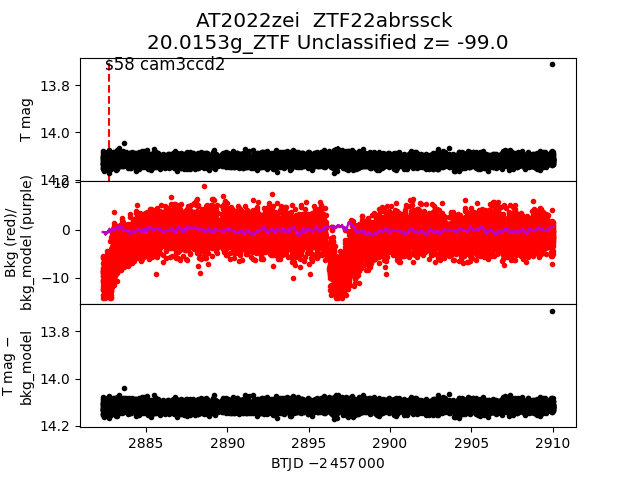
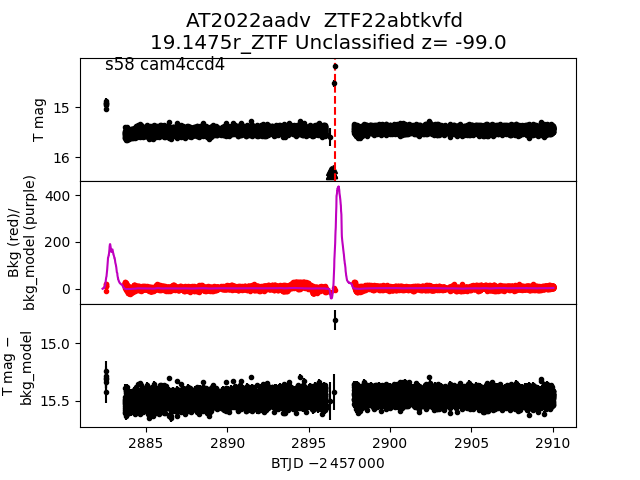
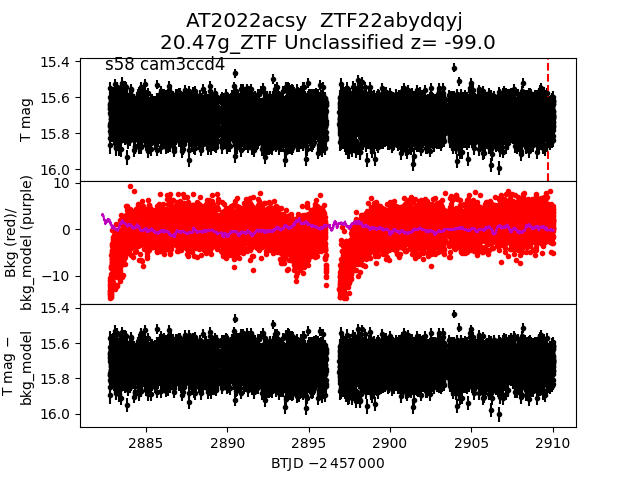
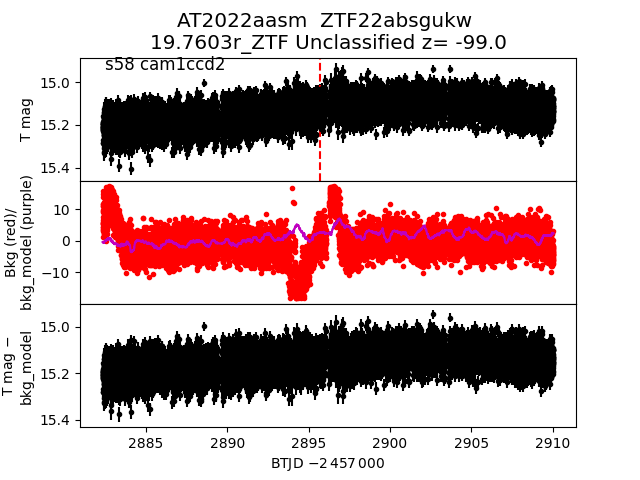
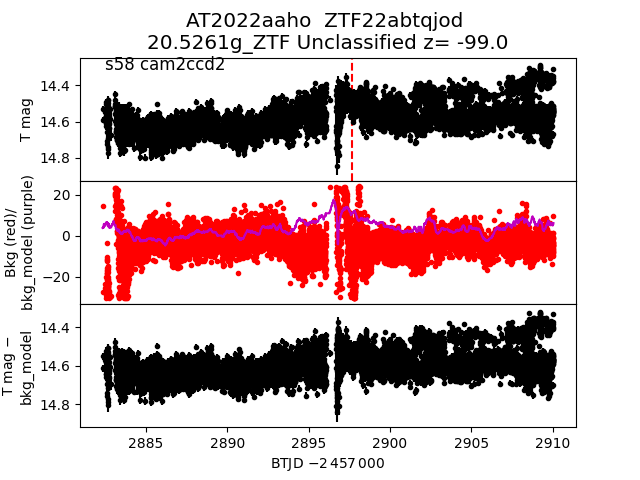
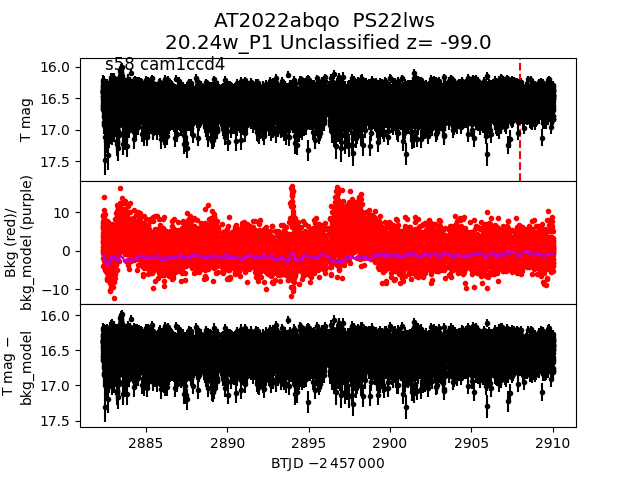
Each figure has three panels. The top panel shows the transient light curve, the middle panel shows the local background (estimated in an annulus), and the bottom panel shows a "background-model corrected" light curve. Details about the background model are in the README.
The vertical red line marks the time of discovery reported to TNS. Other useful metadata from TNS is in the figure title.
Note that the top and bottom panel are in magnitudes, while the middle panel is in differential flux units. The magnitudes are calibrated to the flux in the reference image used for image subtraction. Thus, flux from the host galaxy is included in these magnitudes.
3-sigma upper limits are plotted as triangles with no errorbars. A typical limiting magnitude is 19.6 in 30 minutes or 18.4 in 200 seconds (for low backgrounds).
The links allow you to download the light curve data as a text file.
More details in the README.
2022zgs
 2022absy
 2022adnu
 2022aaxl
 2022abkp
 2022aadq
 2022abaz
 2022aajp
 2022abcq
 2022acbs
 2022zzx
 2022aaod
 2022ablc
 2022abku
 2022ablu
 2022acoy
 2022abwa
 2022abqm
 2022abmz
 2022zgj
 2022aaib
 2022abpb
 2022zyo
 2022zpq
 2022aaox
 2022abba
 2022zxo
 2022abhx
 2022zmz
 2022zea
 2022aacc
 2022aahl
 2022aaga
 2022abaw
 2022aamt
 2022absk
 2022zxw
 2022acnb
 2022abpi
 2022zyd
 2022zwi
 2022zyh
 2022zsk
 2022aajd
 2022aaif
 2022abqj
 2022absd
 2022actc
 2022abjh
 2022abbe
 2022zei
 2022aadv
 2022acsy
 2022aasm
 2022aaho
 2022abqo
 2022acbg