all transients in sector57 (120 total)
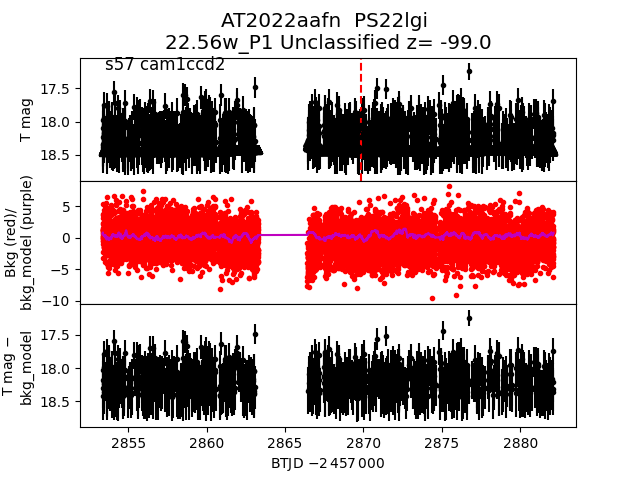
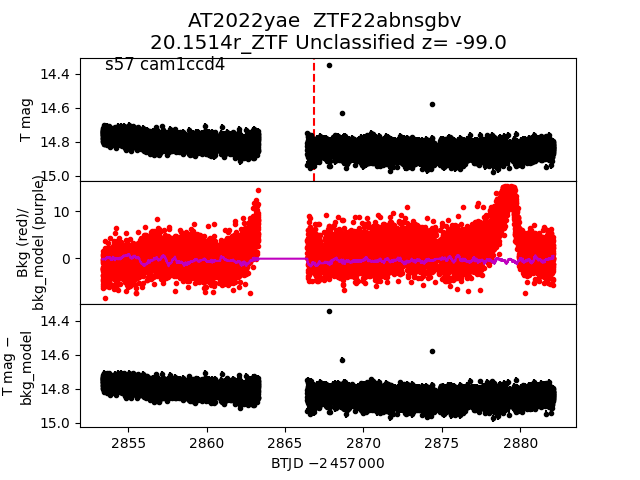
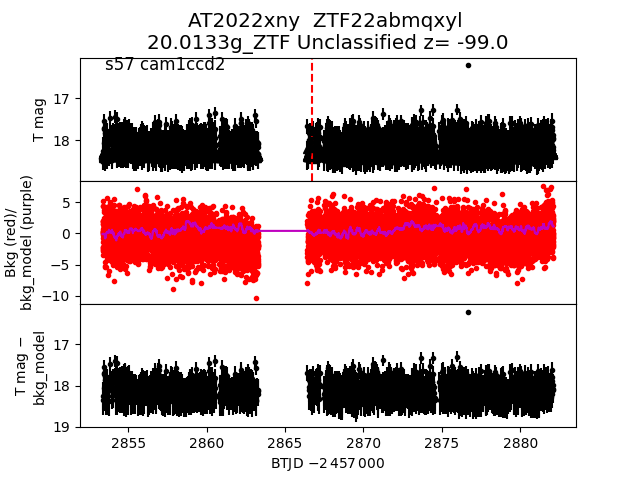
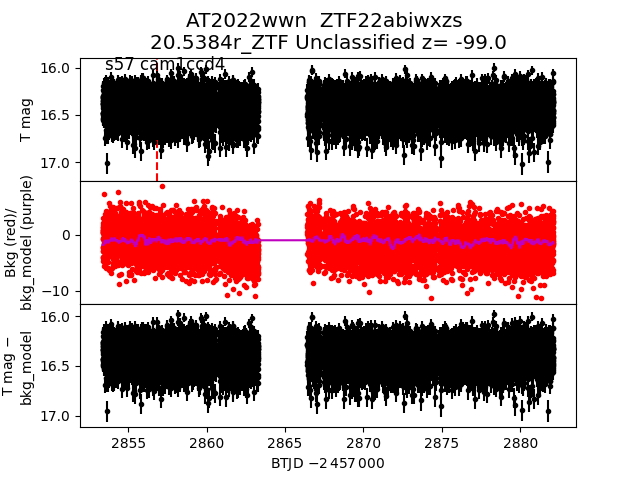
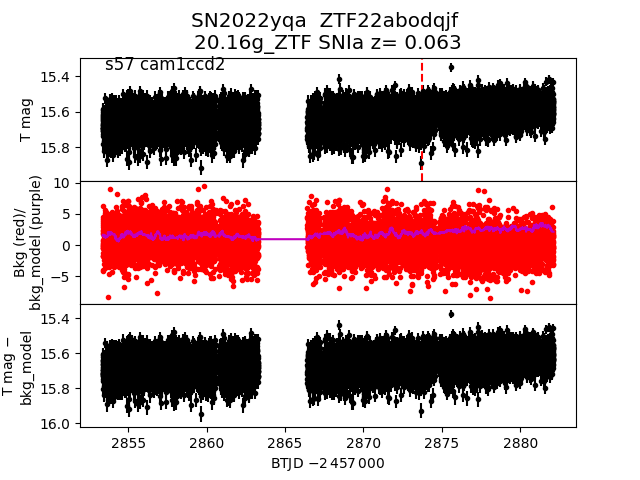
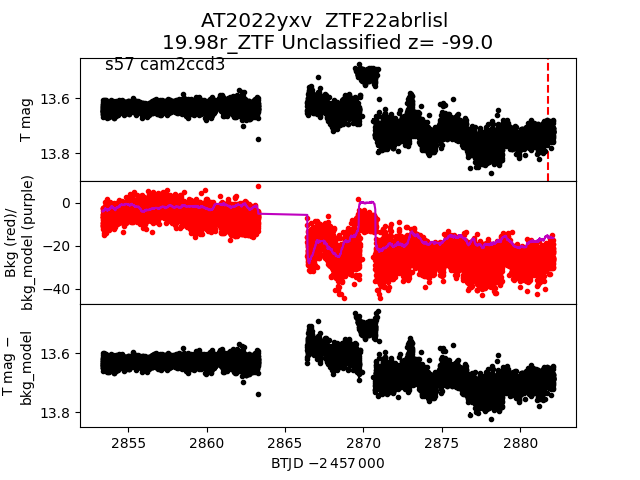
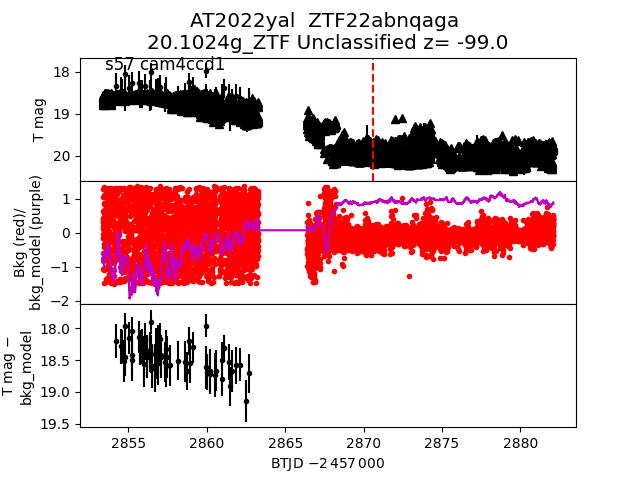
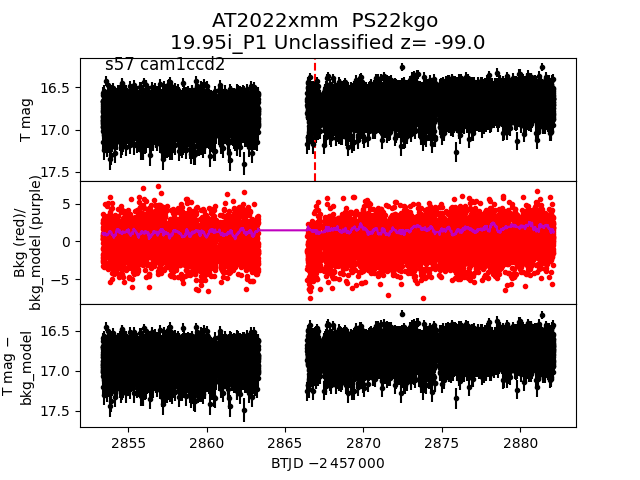
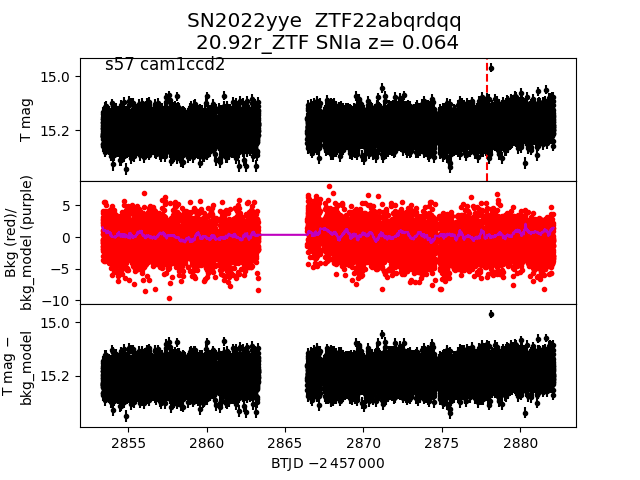
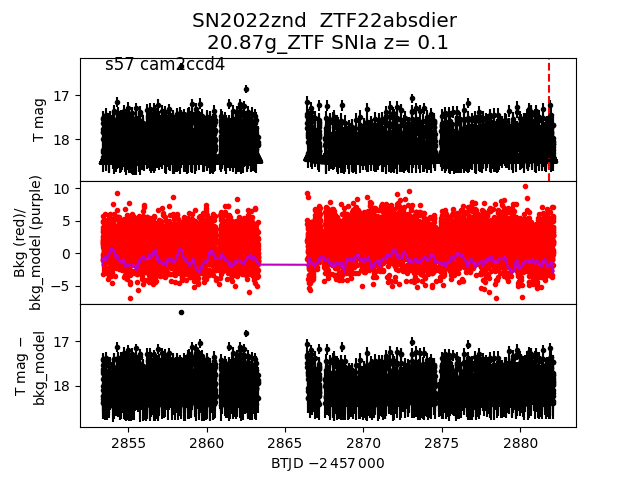
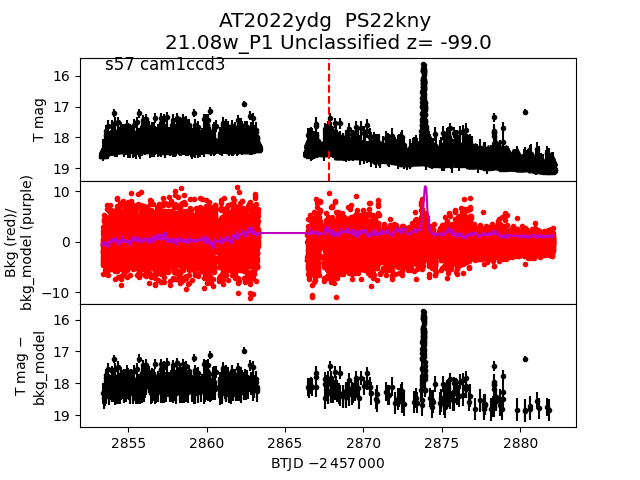
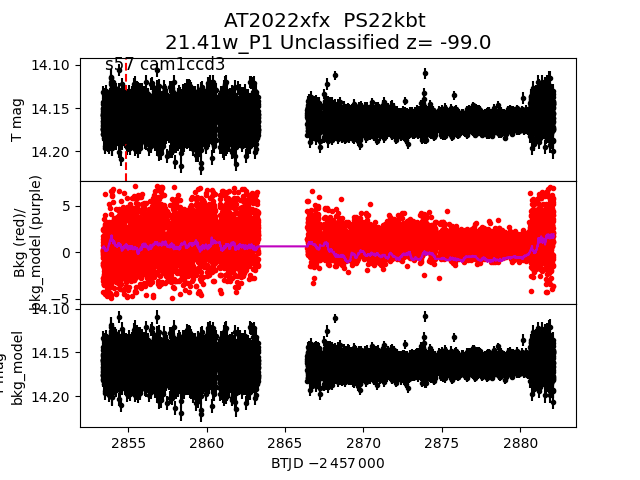
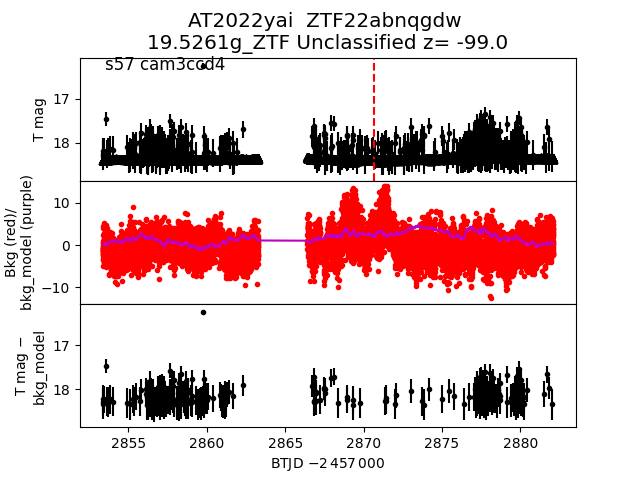
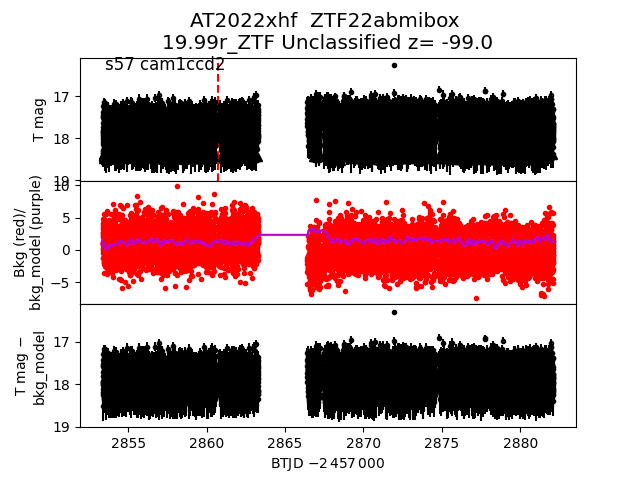
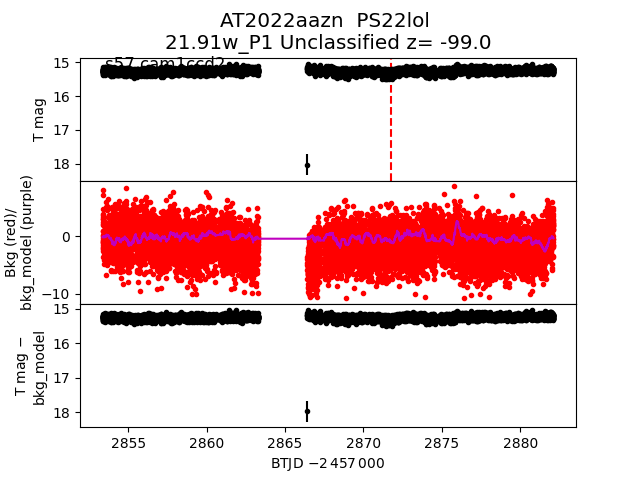
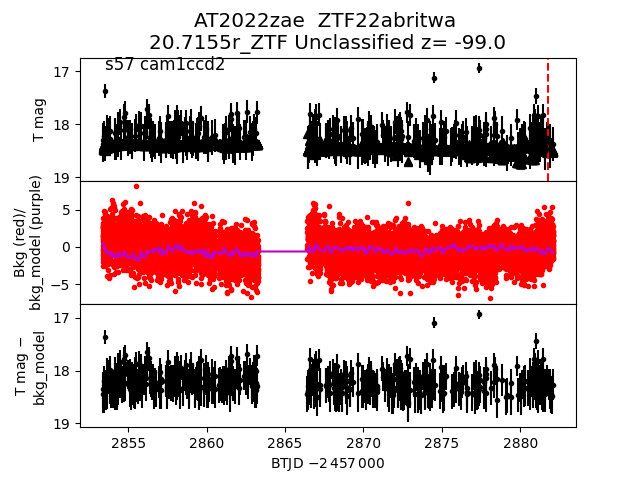
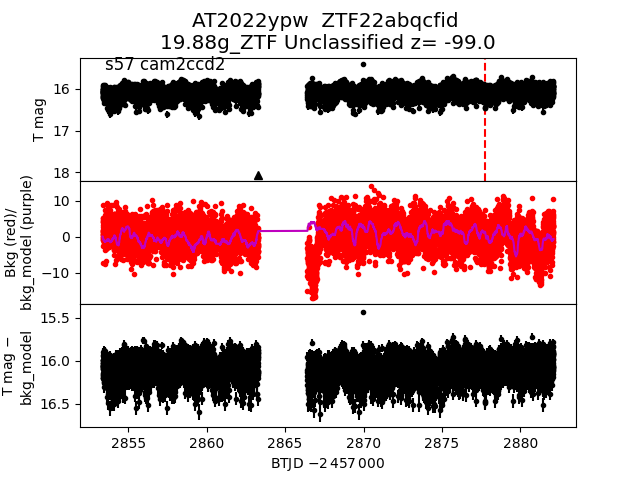
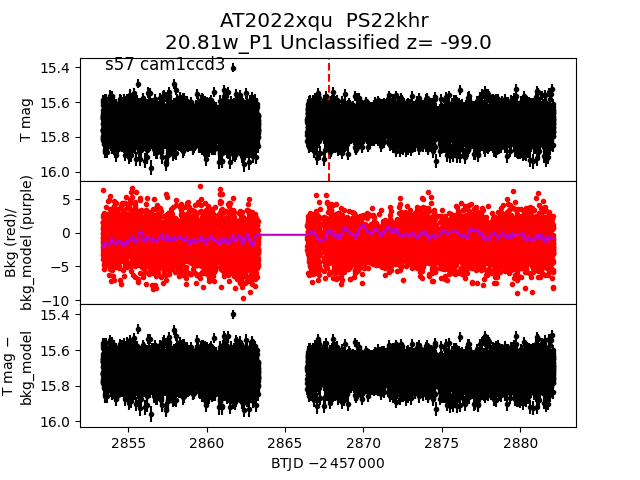
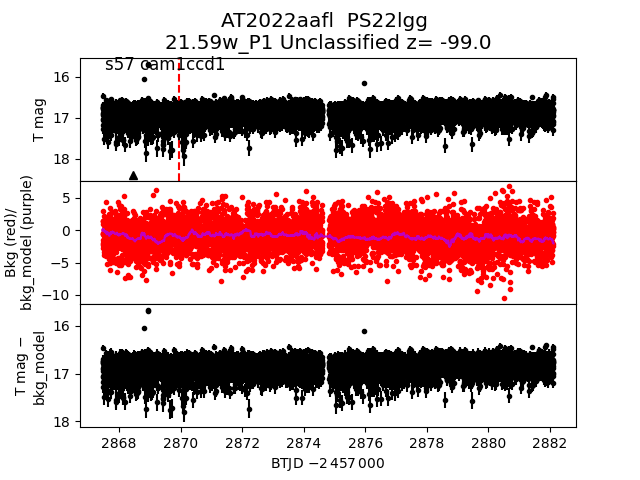
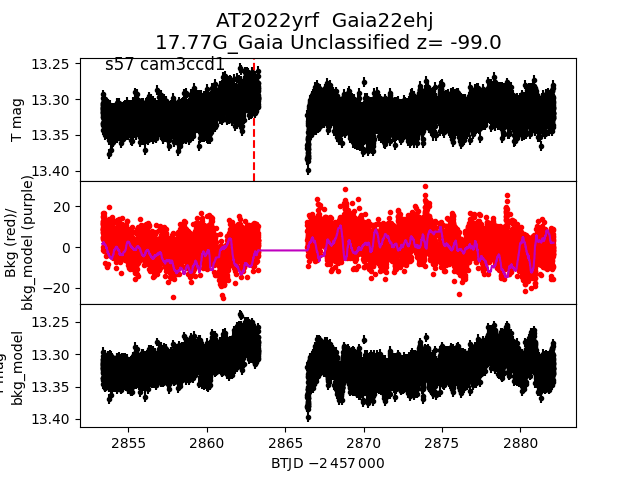
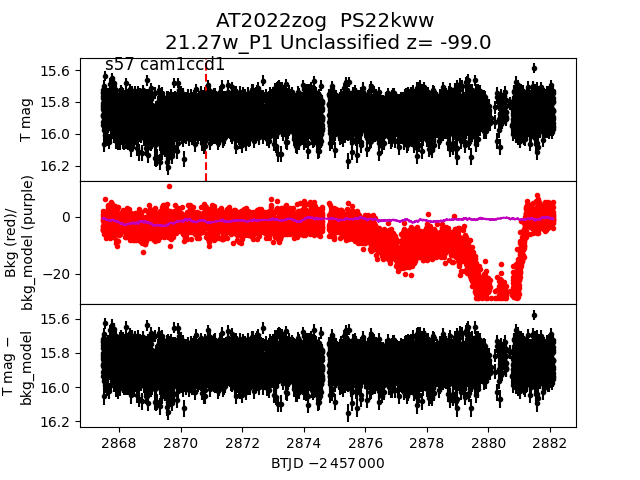
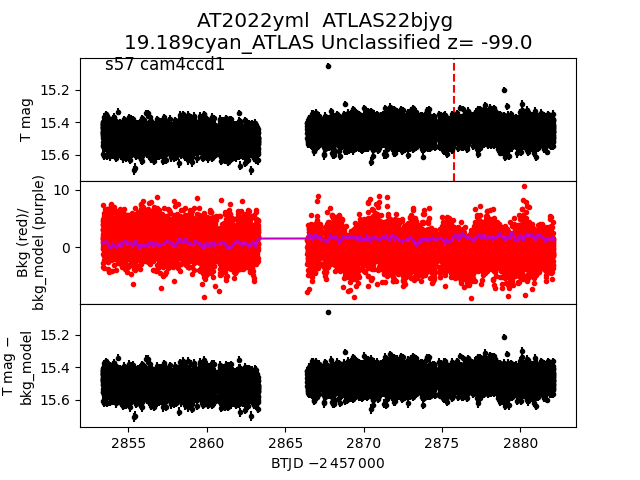
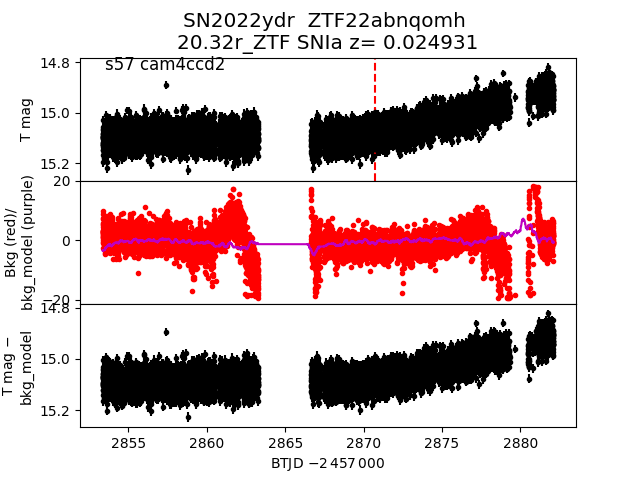
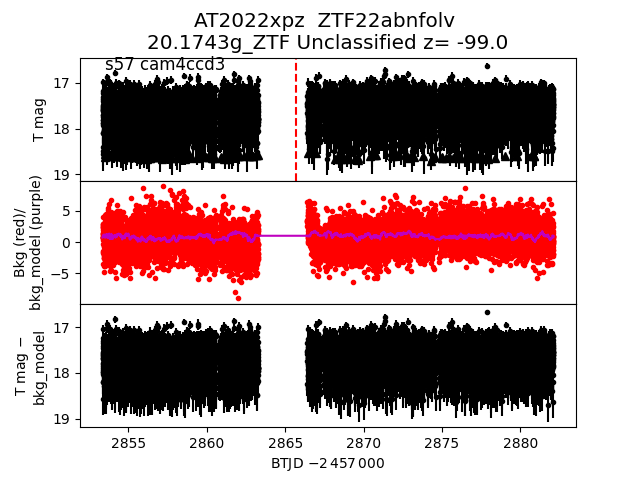
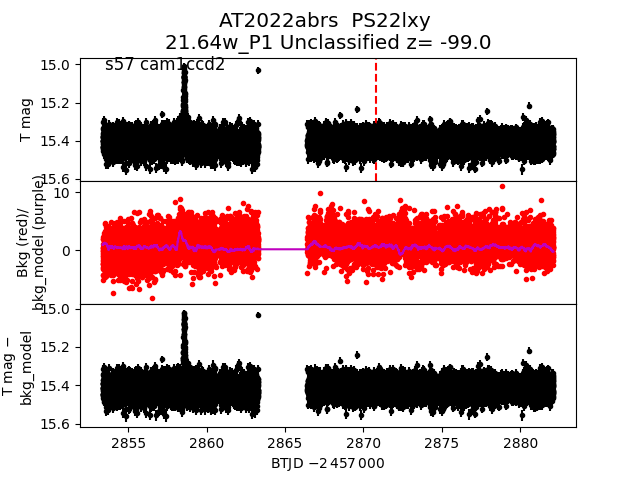
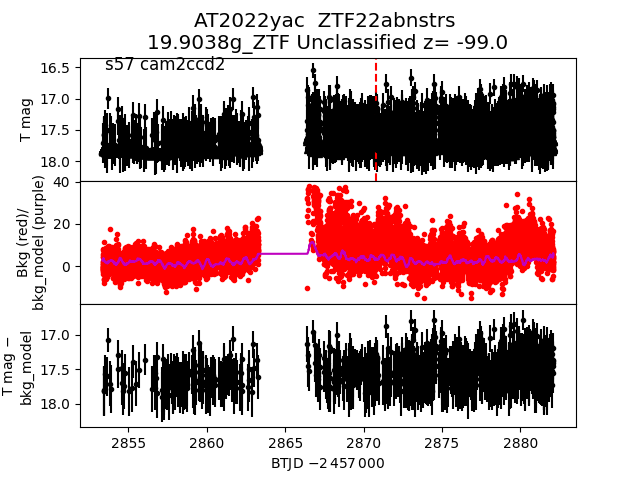
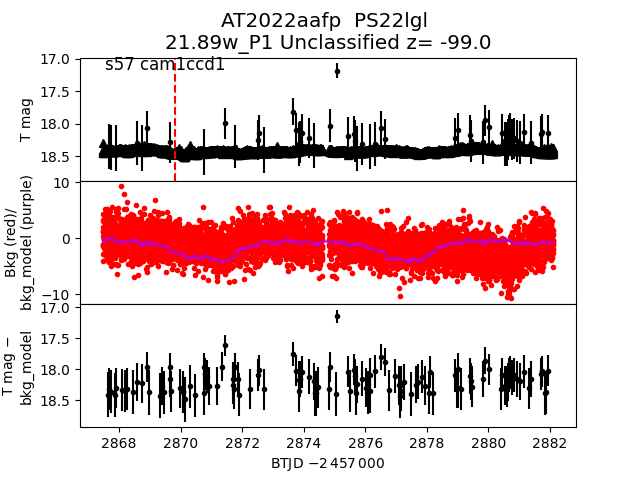
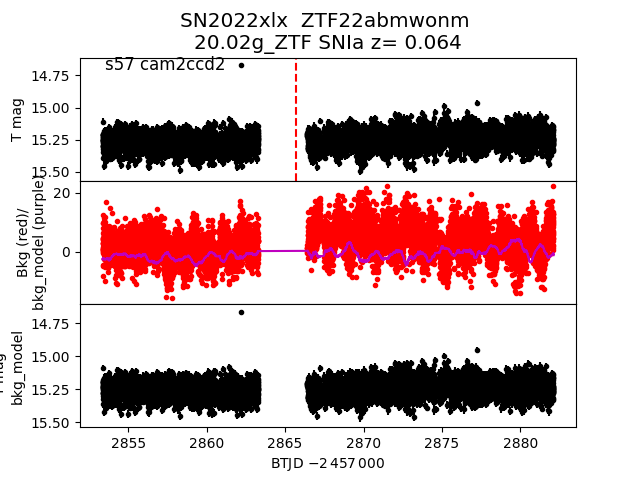
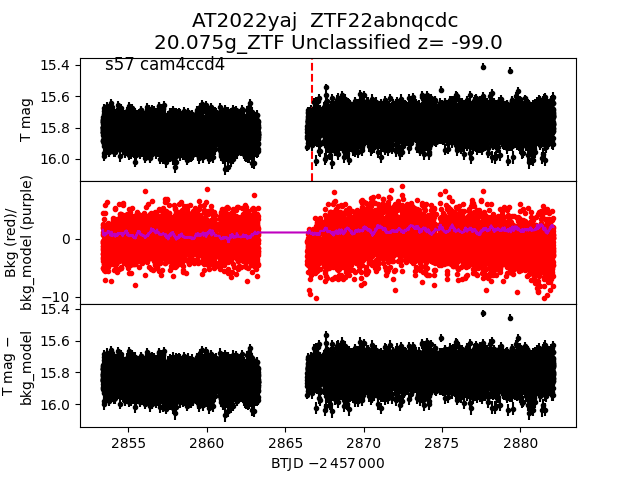
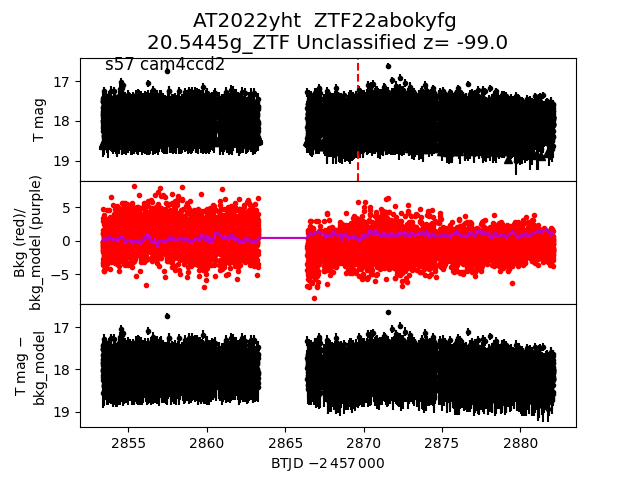
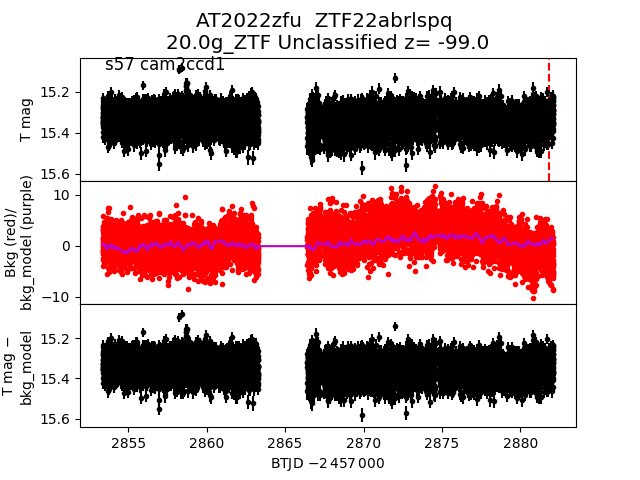
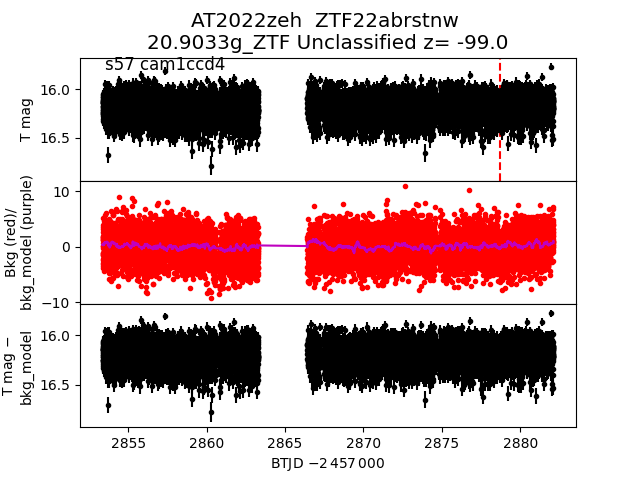
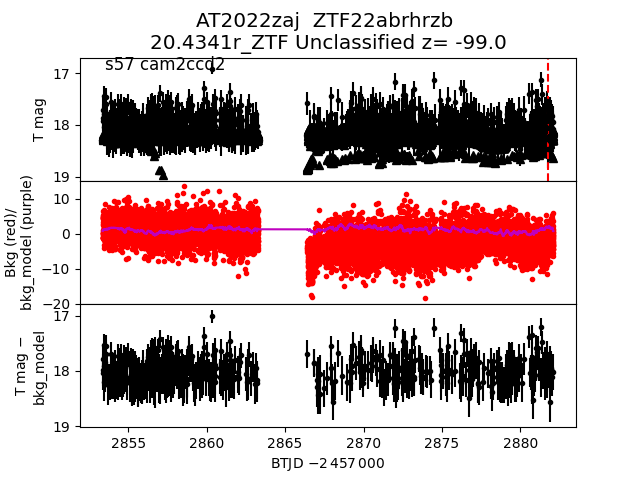
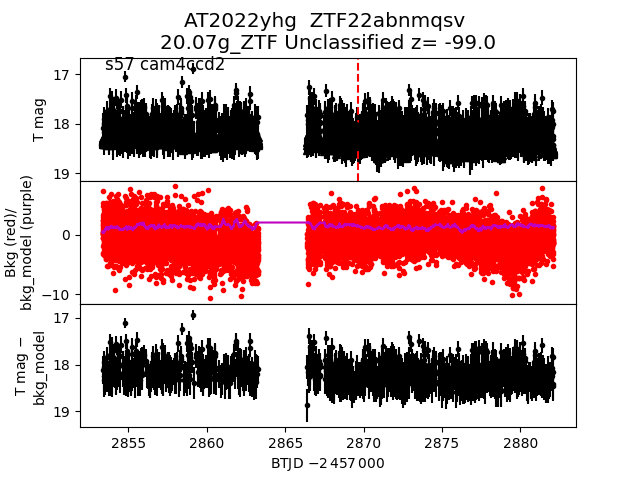
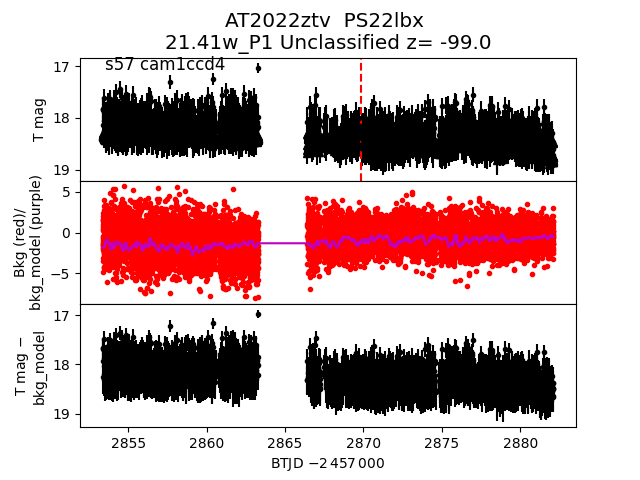
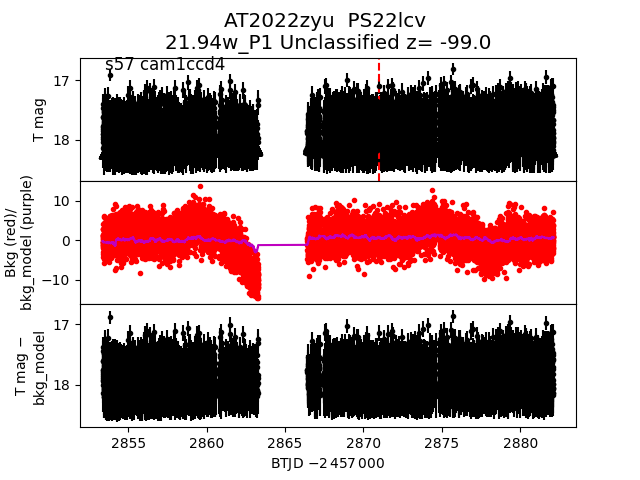
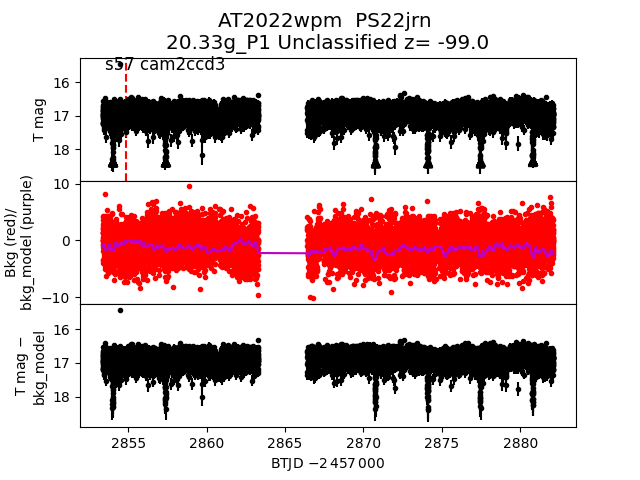
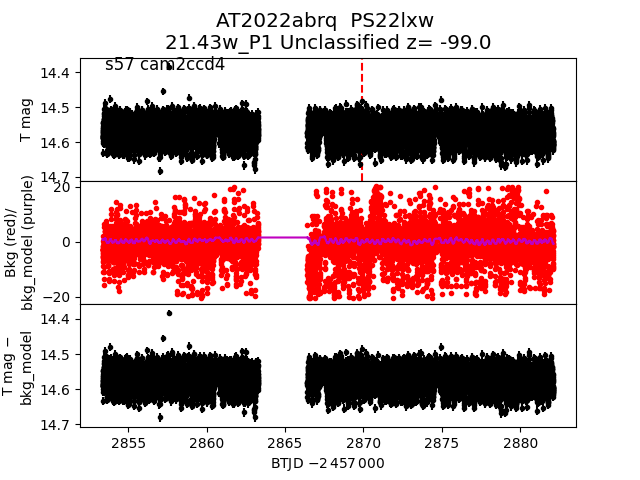
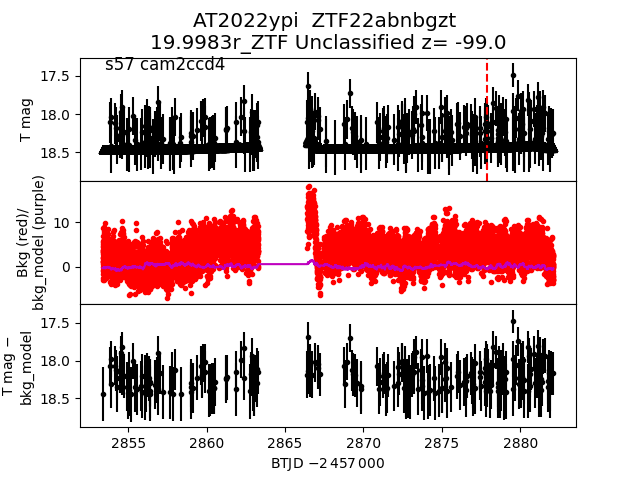
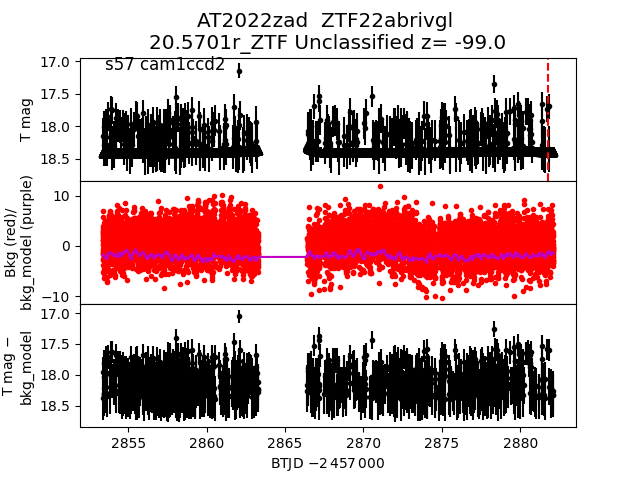
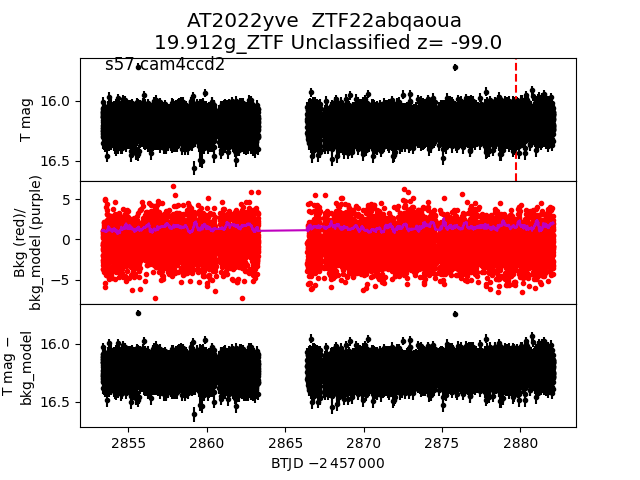
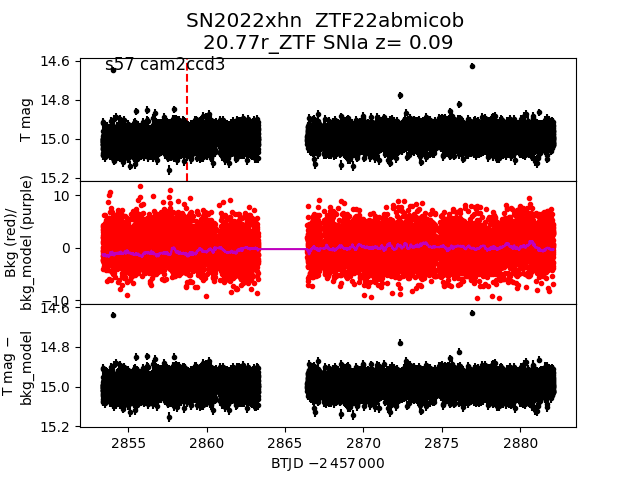
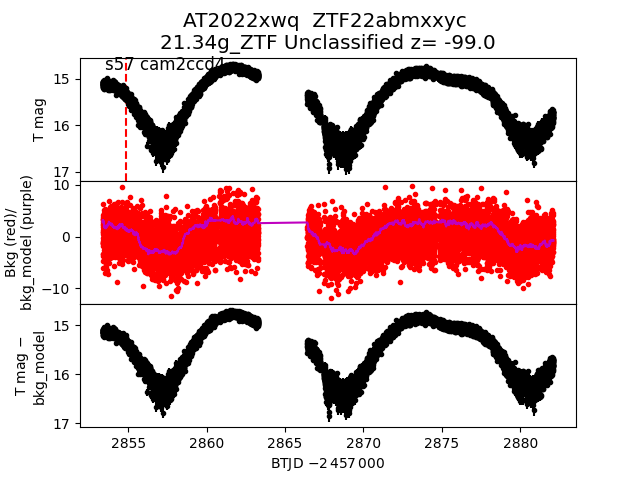
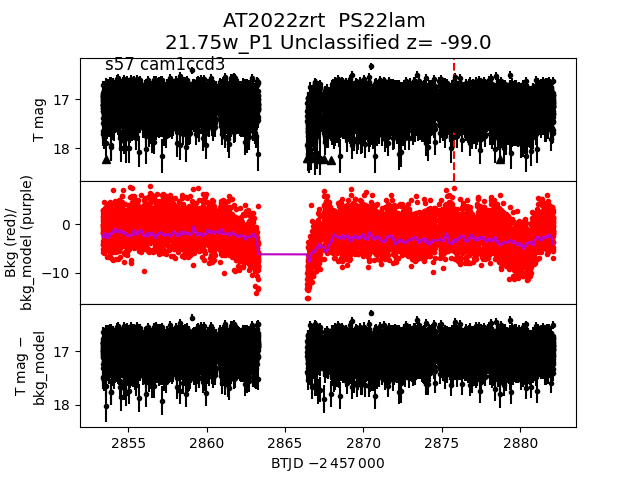
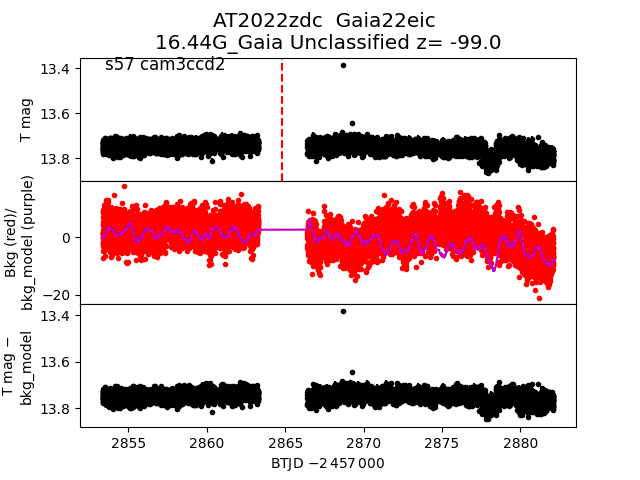
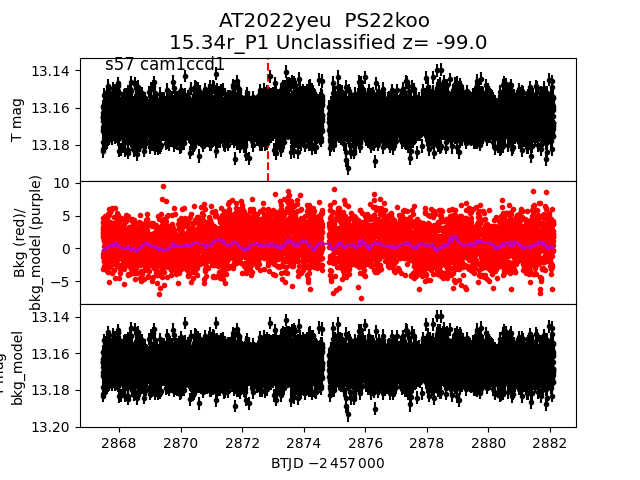
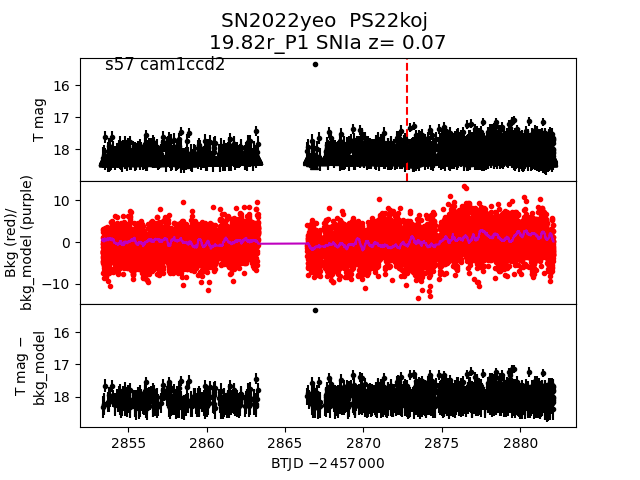
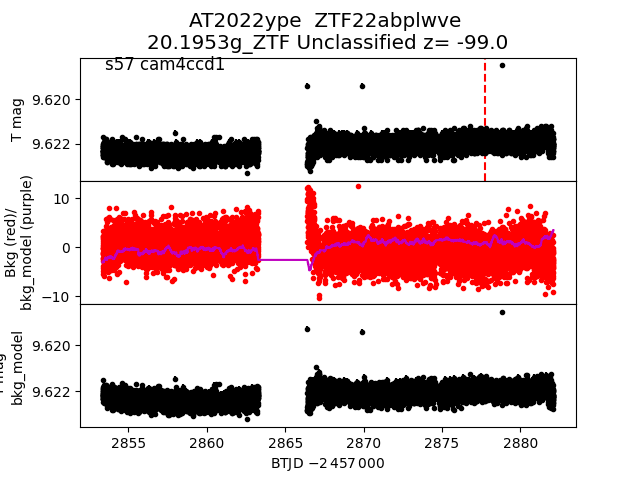
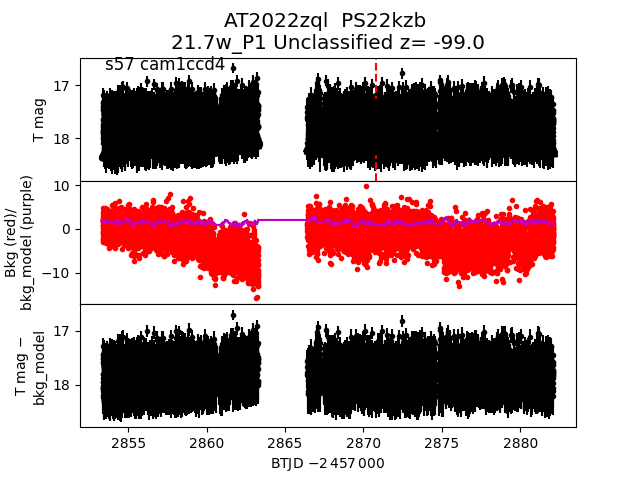
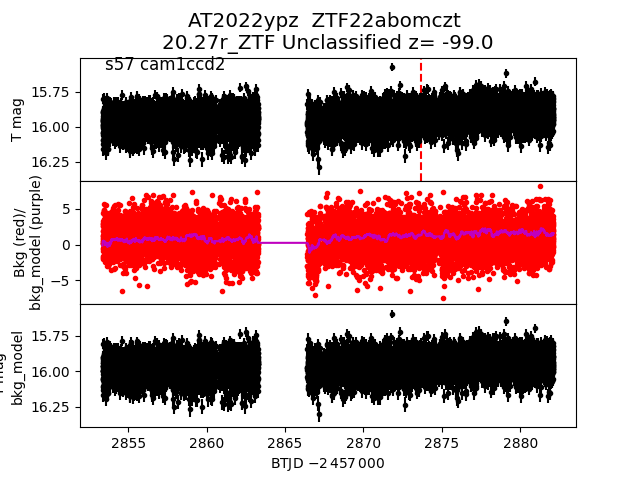
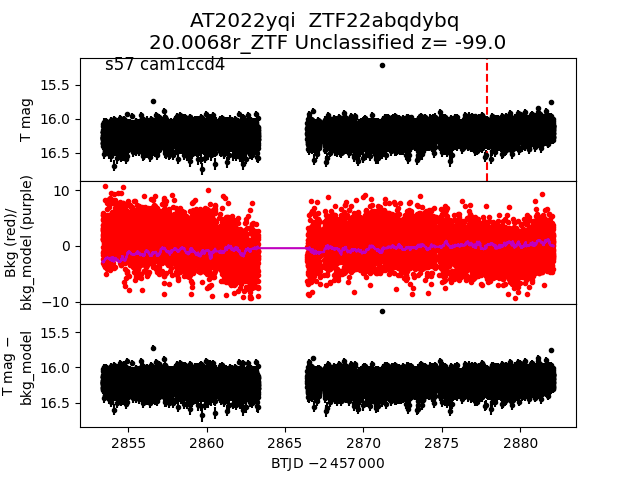
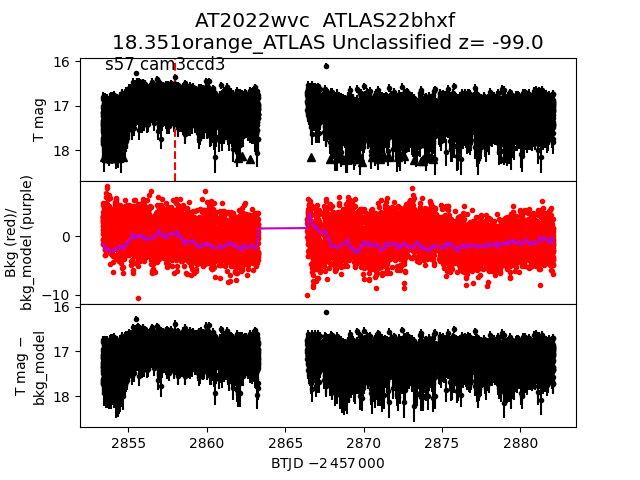
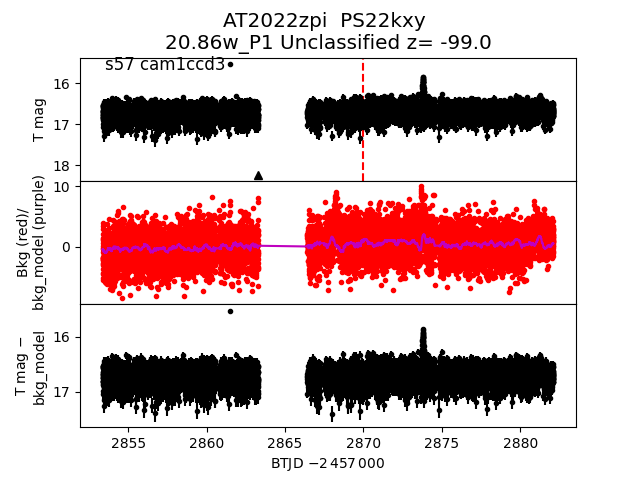
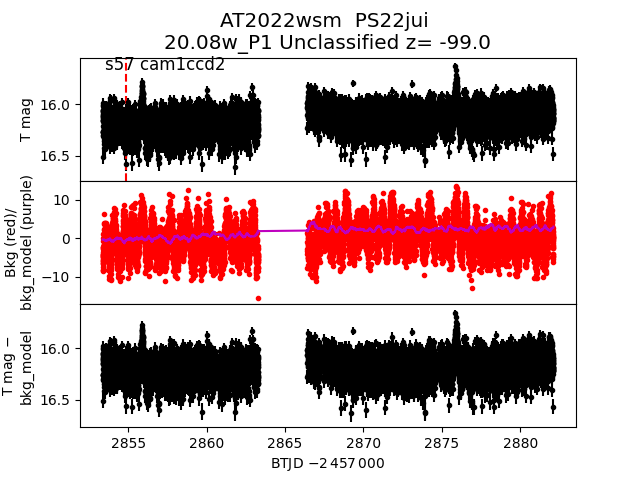
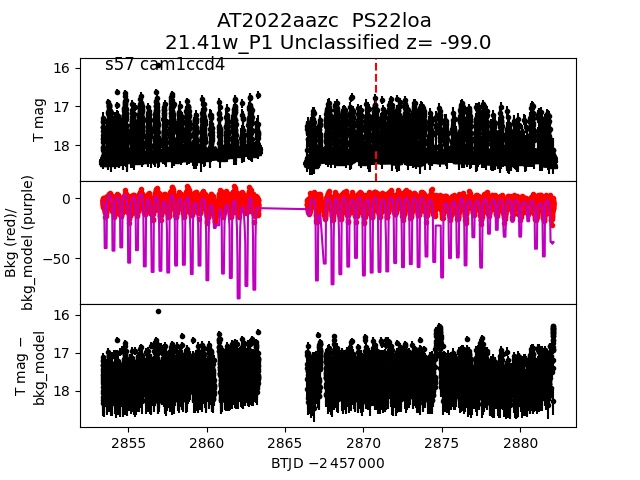
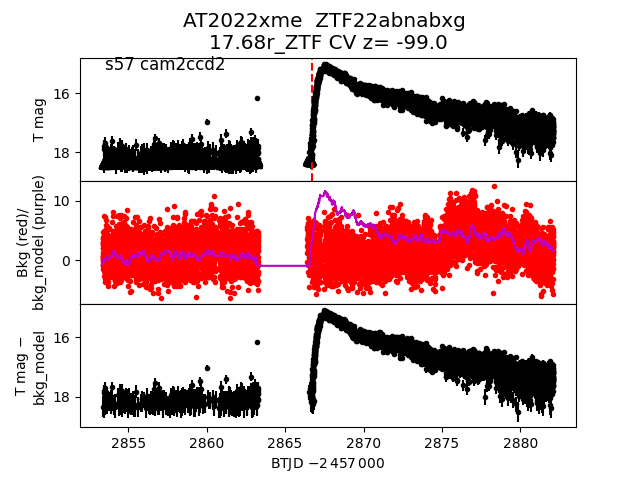
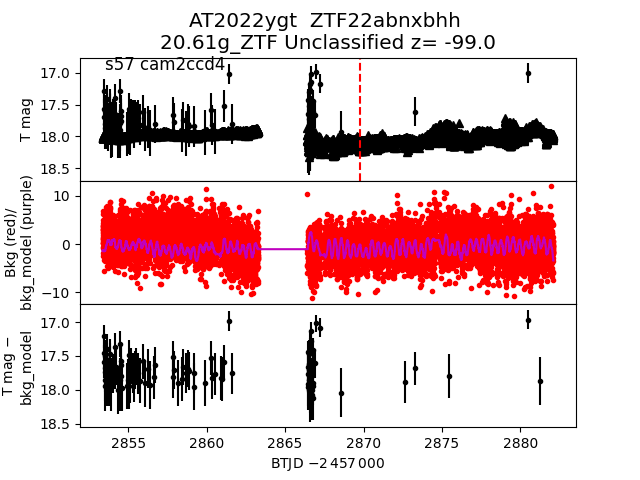
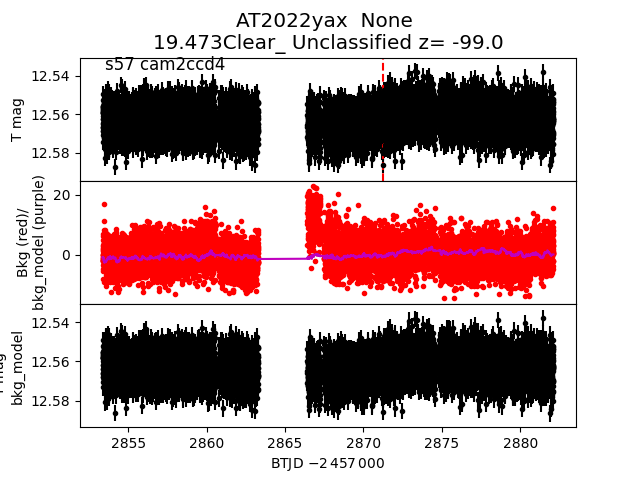
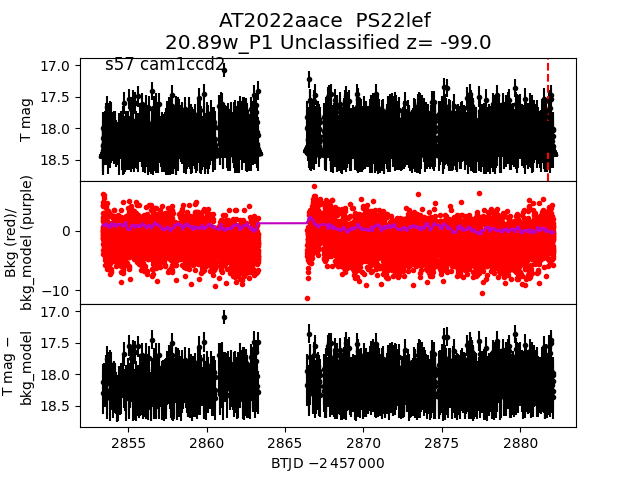
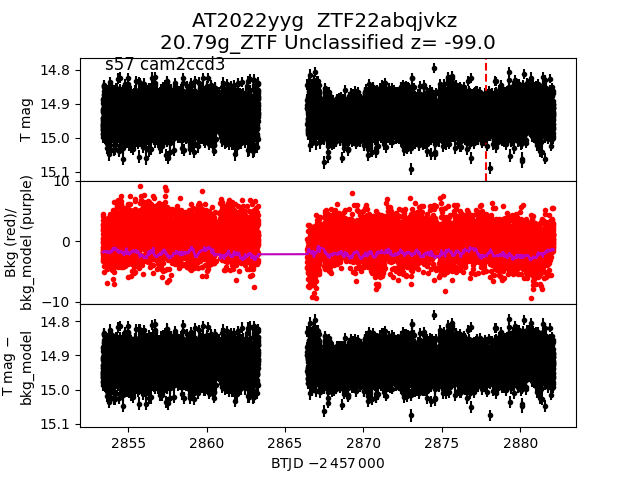
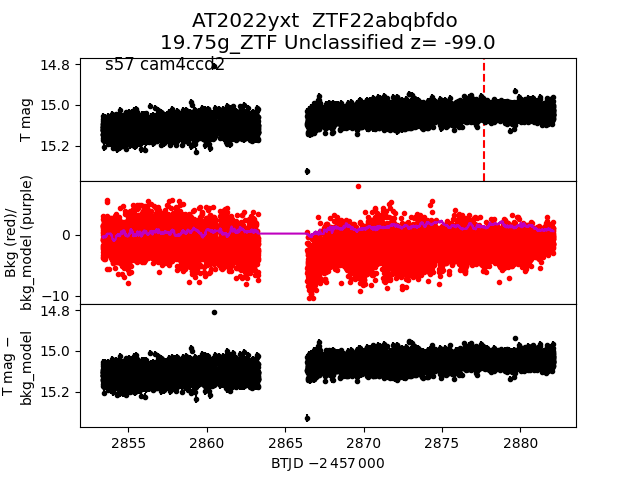
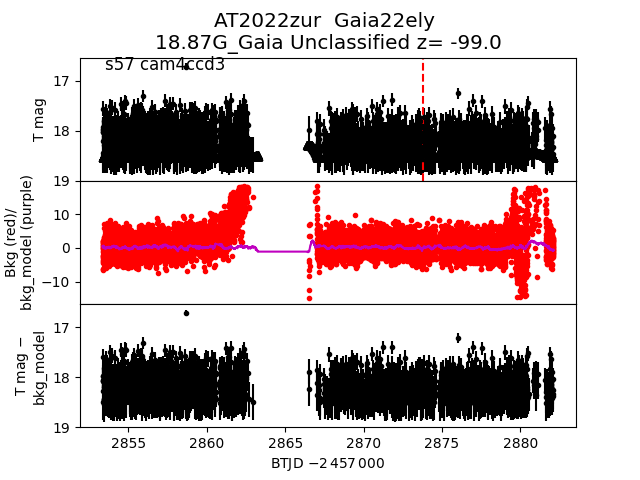
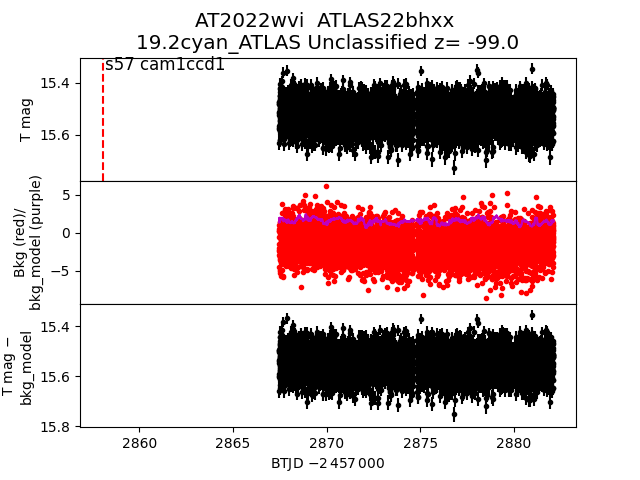
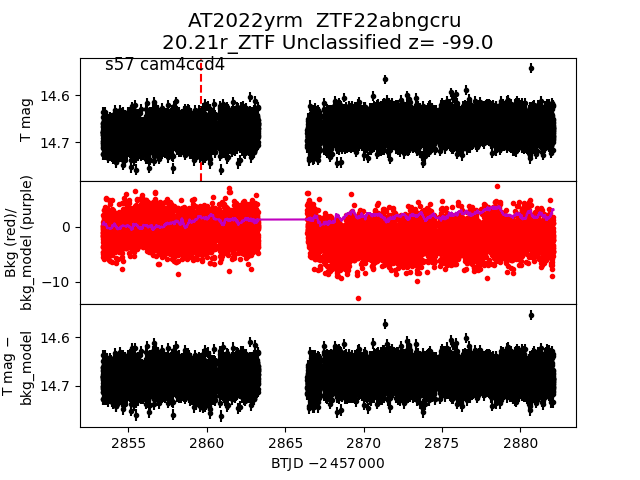
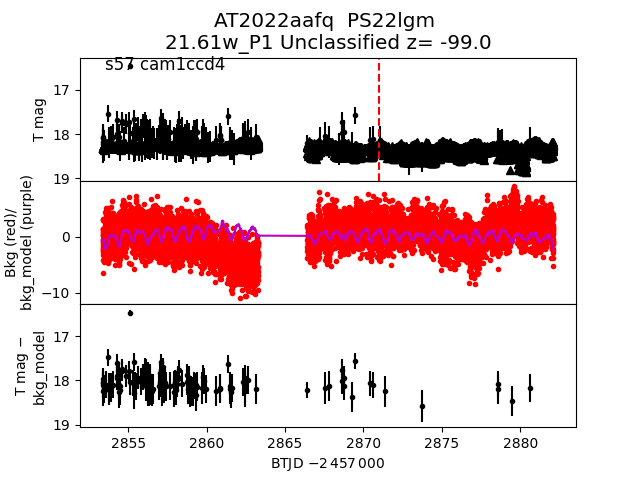
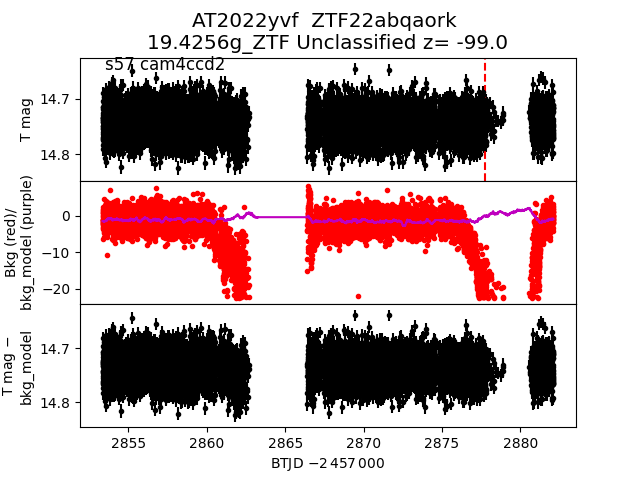
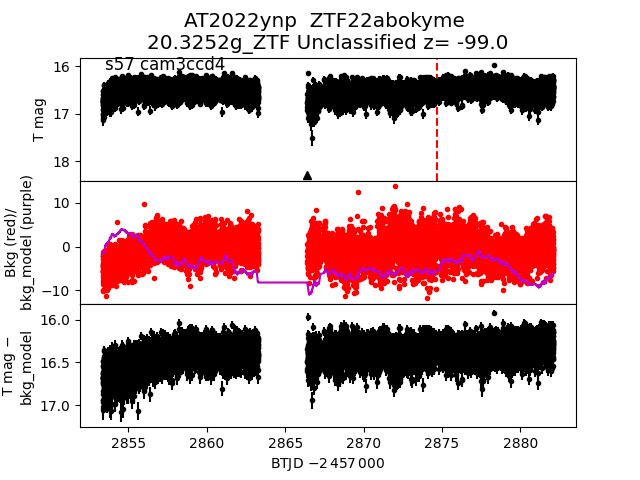
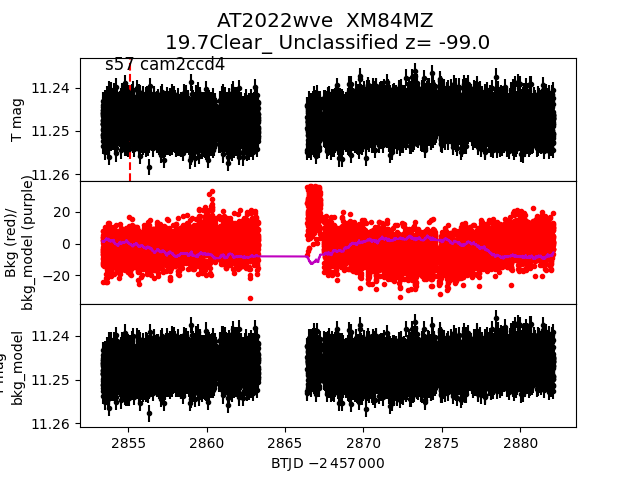
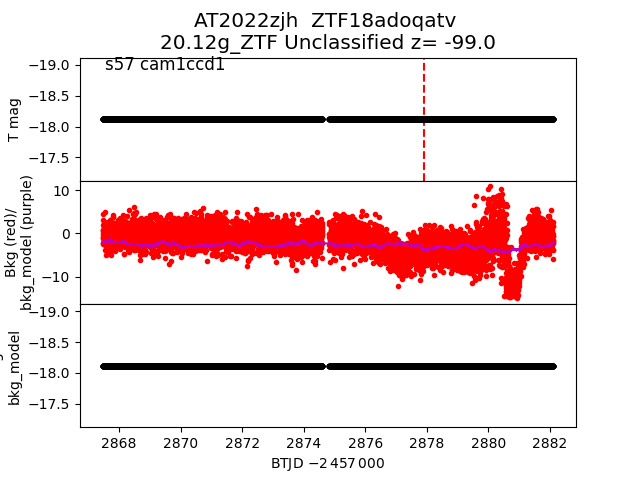
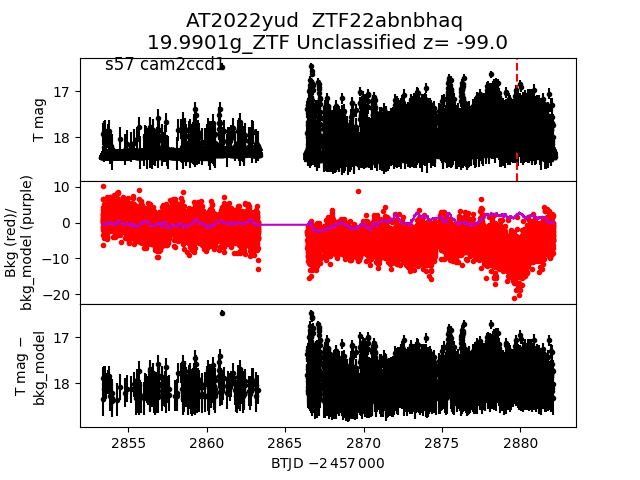
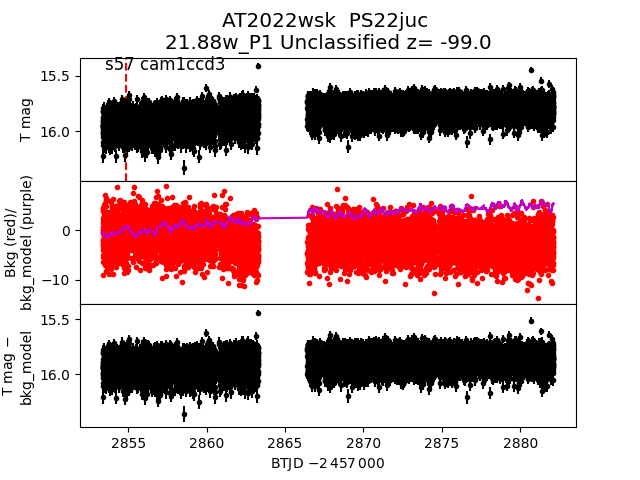
Each figure has three panels. The top panel shows the transient light curve, the middle panel shows the local background (estimated in an annulus), and the bottom panel shows a "background-model corrected" light curve. Details about the background model are in the README.
The vertical red line marks the time of discovery reported to TNS. Other useful metadata from TNS is in the figure title.
Note that the top and bottom panel are in magnitudes, while the middle panel is in differential flux units. The magnitudes are calibrated to the flux in the reference image used for image subtraction. Thus, flux from the host galaxy is included in these magnitudes.
3-sigma upper limits are plotted as triangles with no errorbars. A typical limiting magnitude is 19.6 in 30 minutes or 18.4 in 200 seconds (for low backgrounds).
The links allow you to download the light curve data as a text file.
More details in the README.
2022yae
 2022xny
 2022wwn
 2022yqa
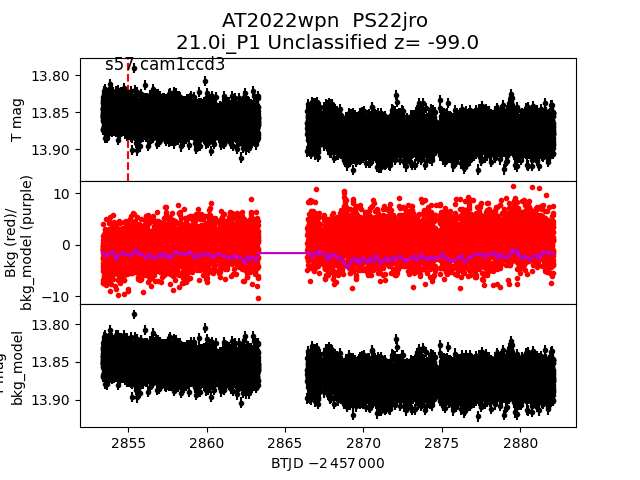
 2022wpn
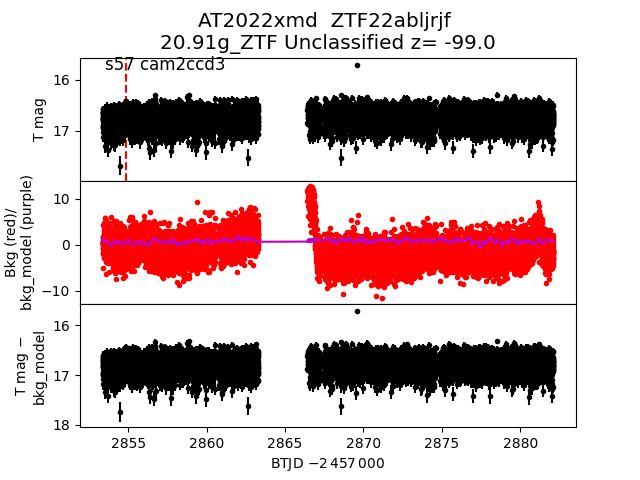
 2022xmd
 2022zxe
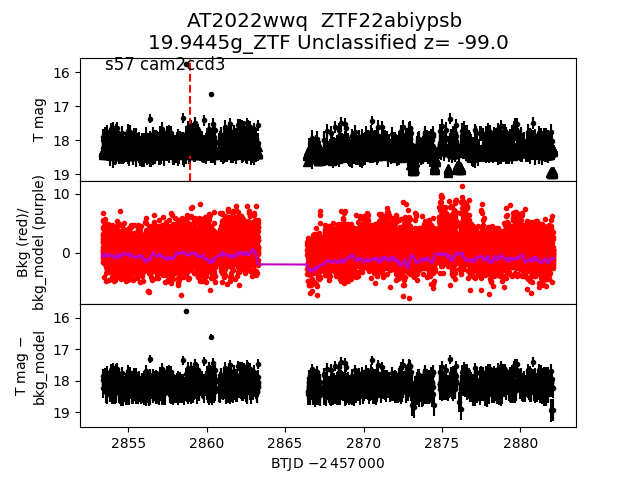
 2022wwq
 2022yxv
 2022yal
 2022xmm
 2022yye
 2022znd
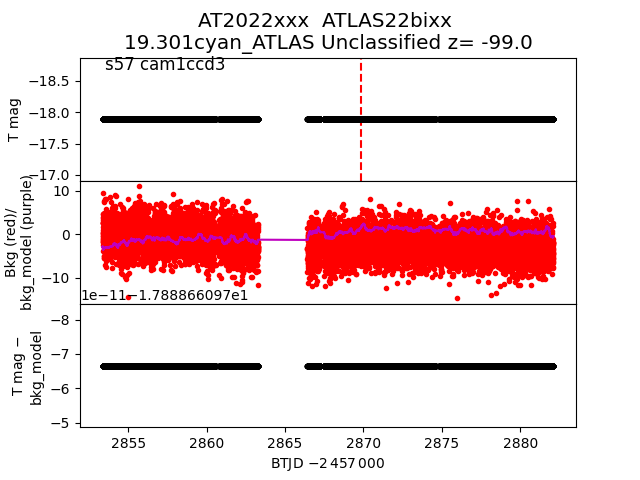
 2022xxx
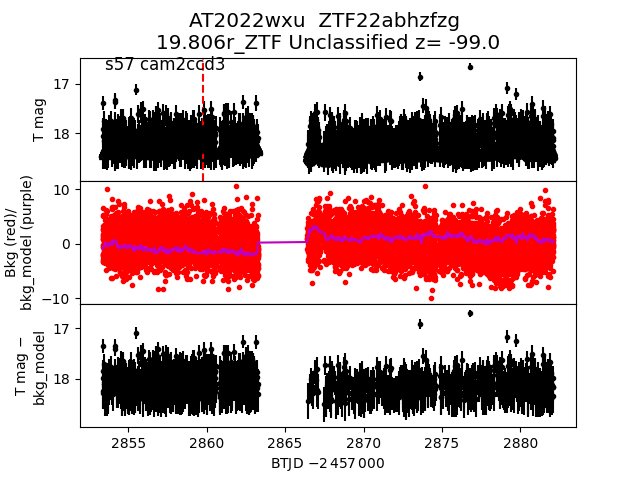
 2022wxu
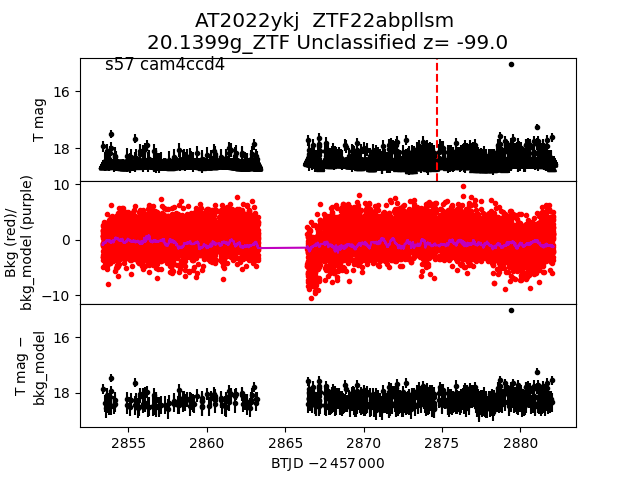
 2022ykj
 2022ydg
 2022xfx
 2022yai
 2022xhf
 2022aazn
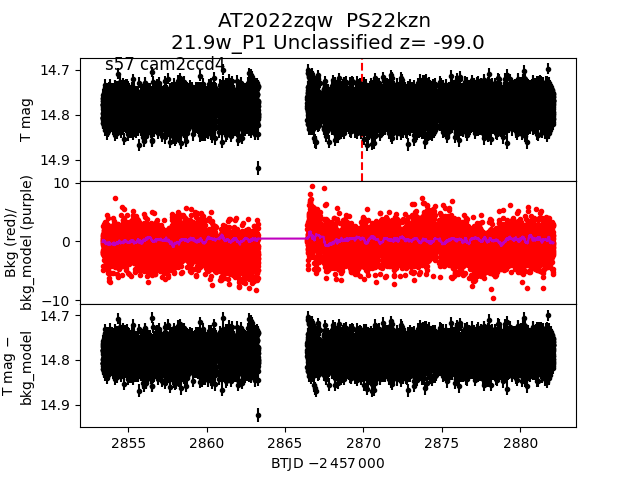
 2022zqw
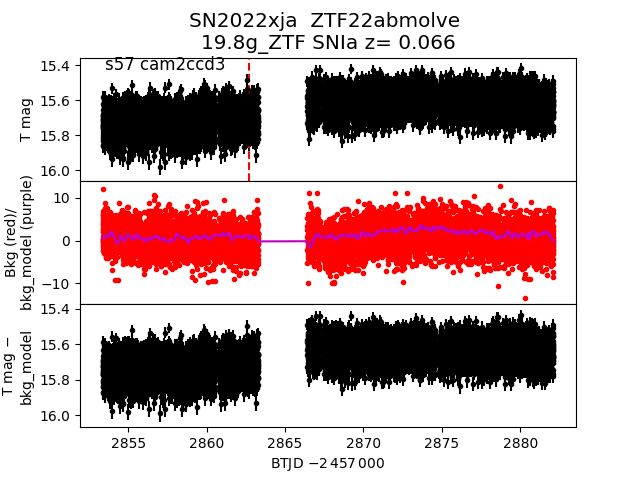
 2022xja
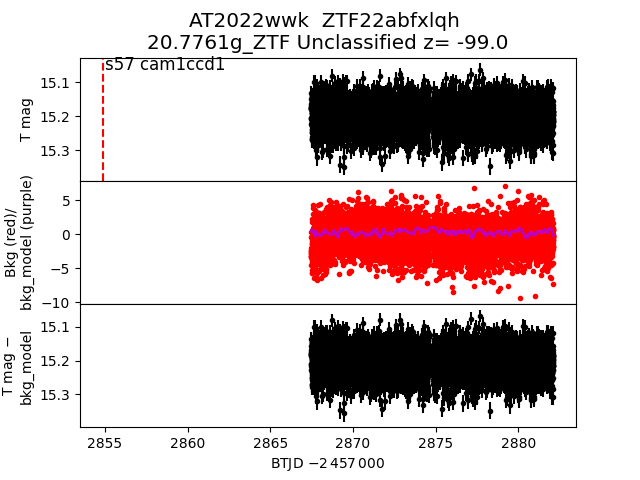
 2022wwk
 2022zae
 2022ypw
 2022xqu
 2022aafl
 2022yrf
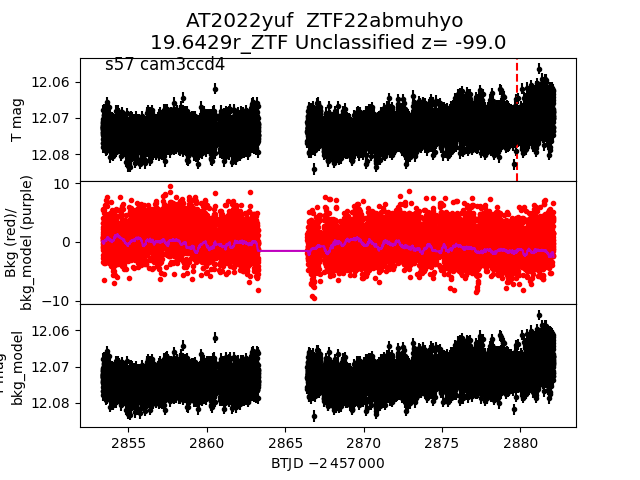
 2022yuf
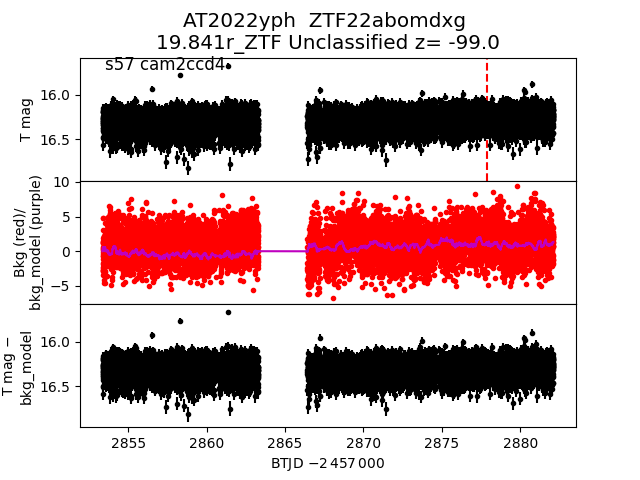
 2022yph
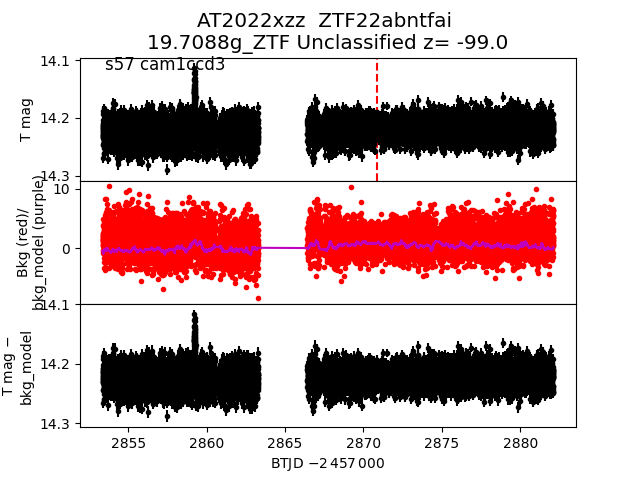
 2022xzz
 2022zog
 2022yml
 2022ydr
 2022xpz
 2022abrs
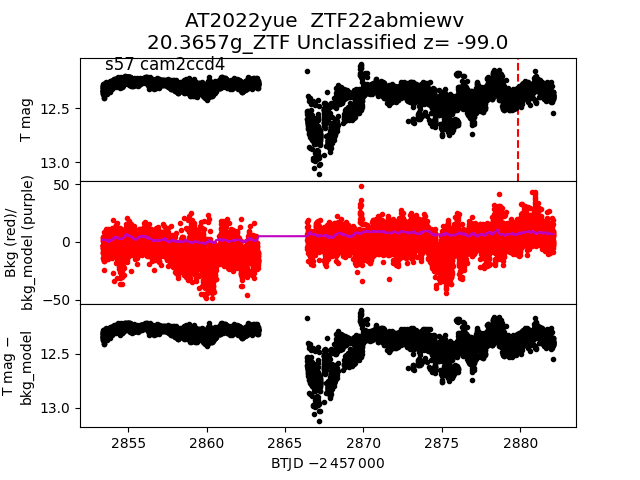
 2022yue
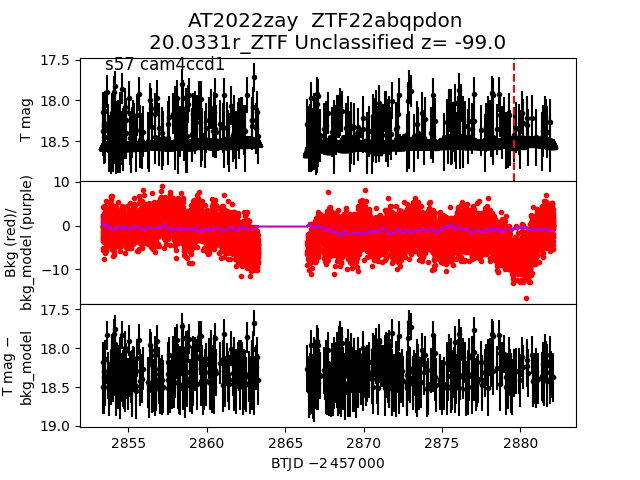
 2022zay
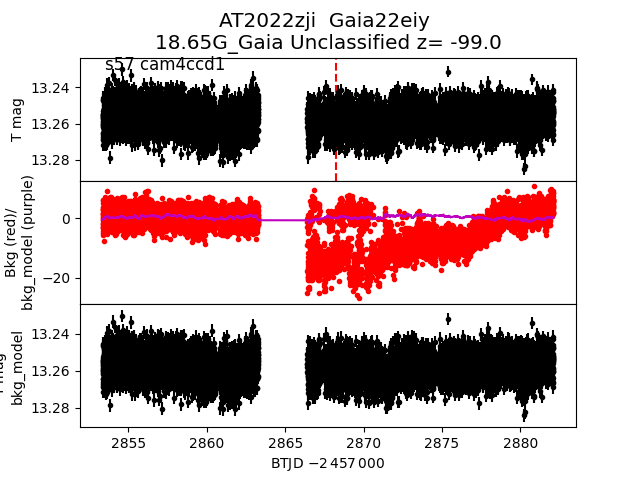
 2022zji
 2022yac
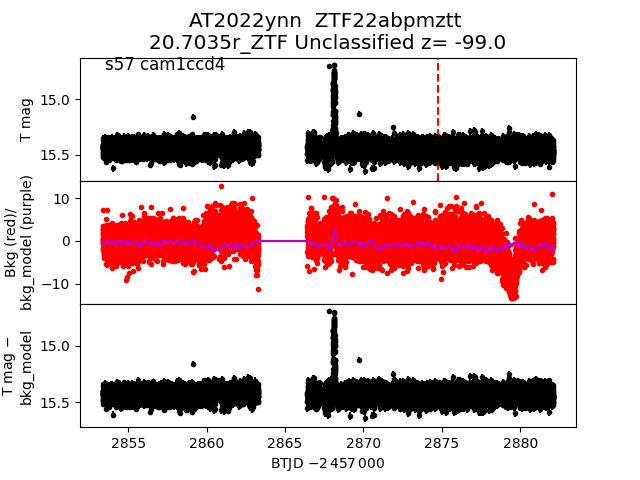
 2022ynn
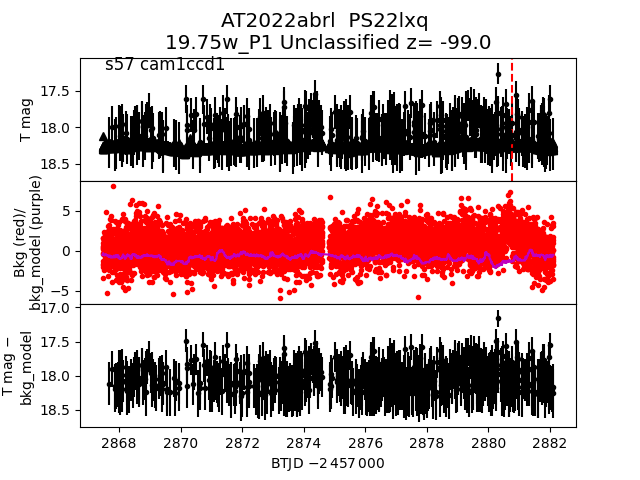
 2022abrl
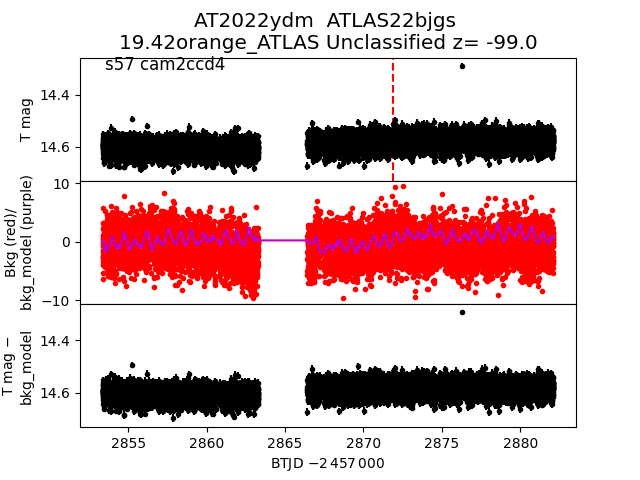
 2022ydm
 2022aafp
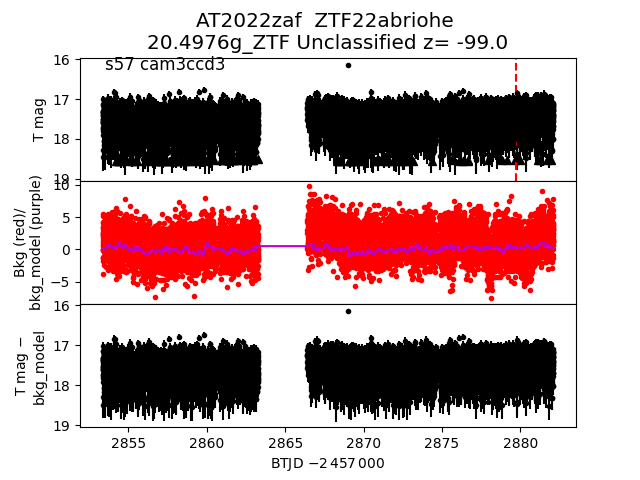
 2022zaf
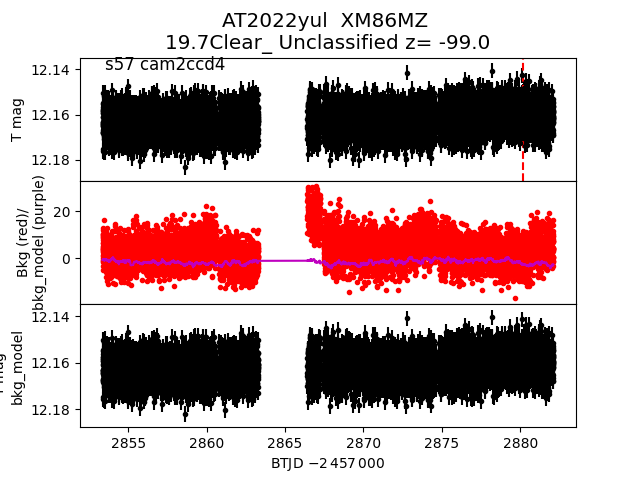
 2022yul
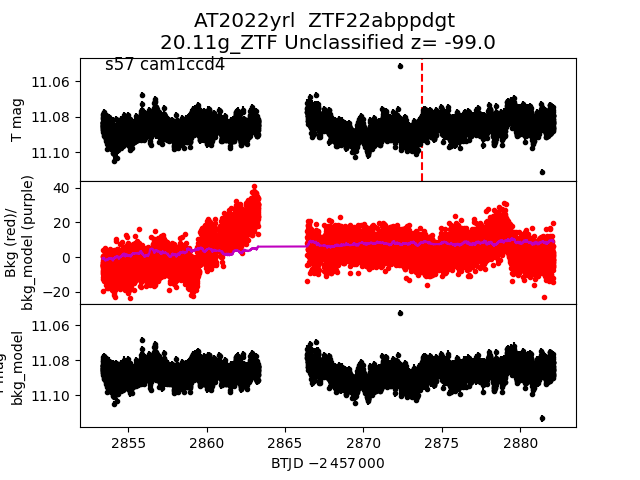
 2022yrl
 2022xlx
 2022yaj
 2022yht
 2022zfu
 2022zeh
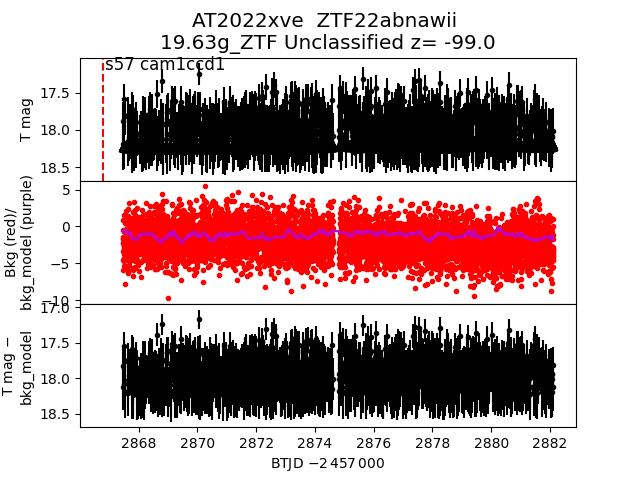
 2022xve
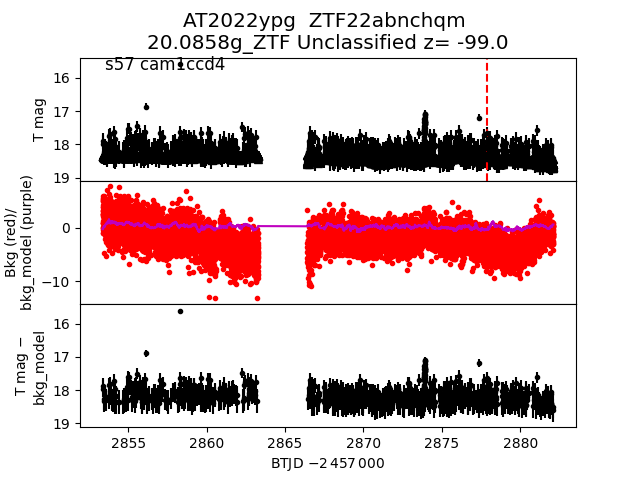
 2022ypg
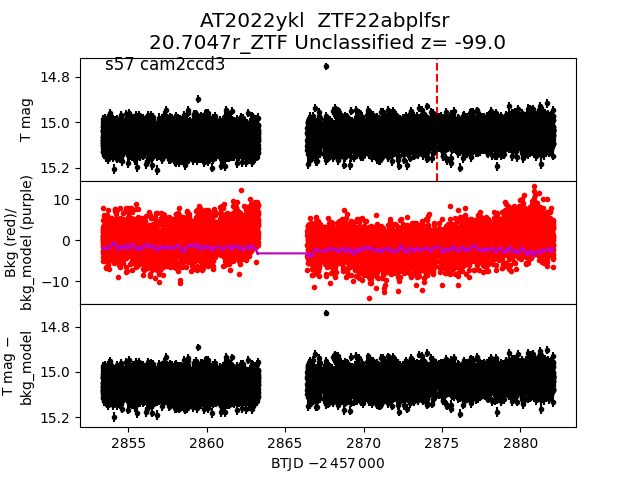
 2022ykl
 2022zaj
 2022yhg
 2022ztv
 2022zyu
 2022wpm
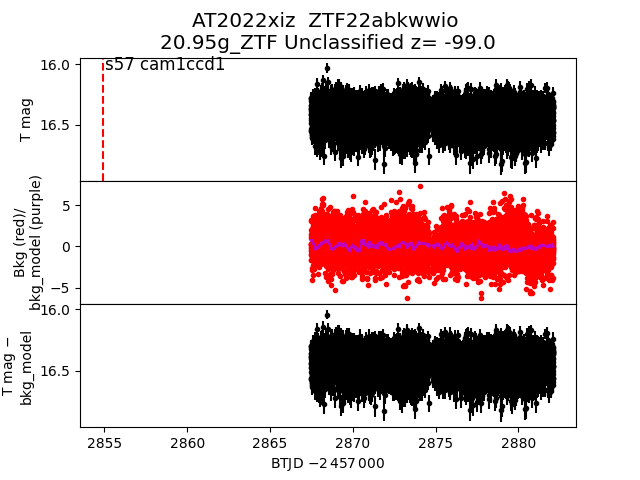
 2022xiz
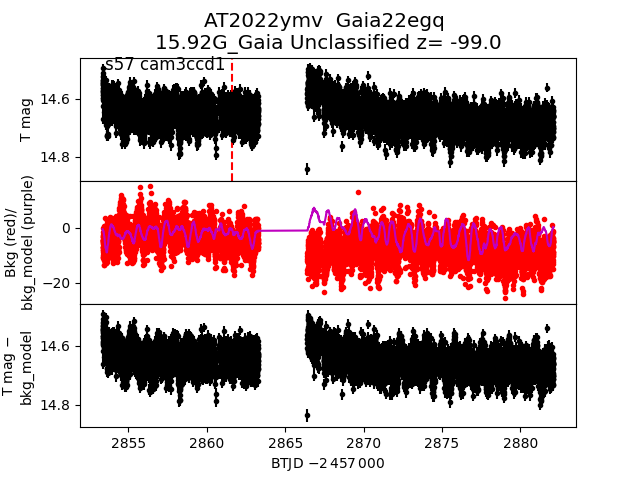
 2022ymv
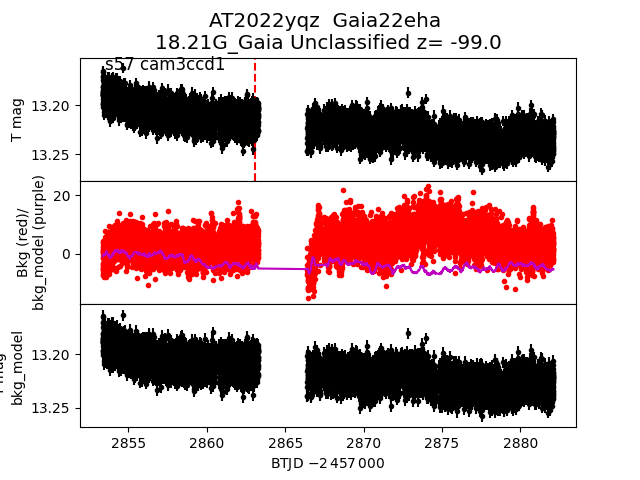
 2022yqz
 2022abrq
 2022ypi
 2022zad
 2022yve
 2022xhn
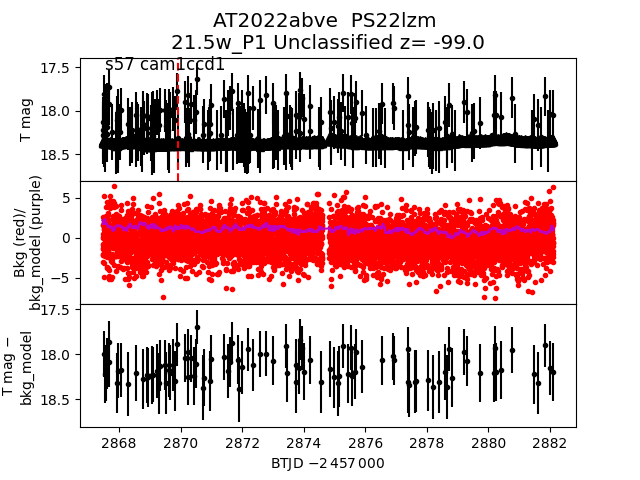
 2022abve
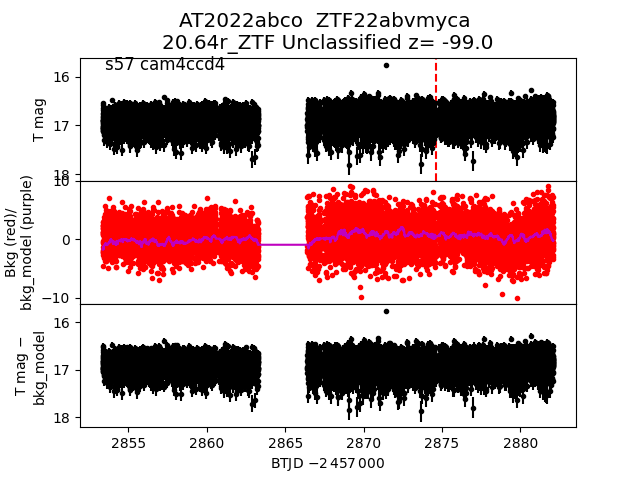
 2022abco
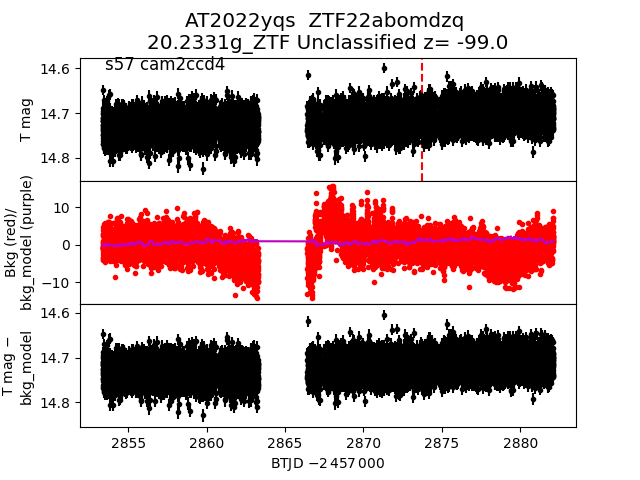
 2022yqs
 2022xwq
 2022aazp
 2022ynz
 2022ycf
 2022zrt
 2022zdc
 2022yeu
 2022yeo
 2022ype
 2022zql
 2022ypz
 2022yqi
 2022wvc
 2022zpi
 2022wsm
 2022aazc
 2022xme
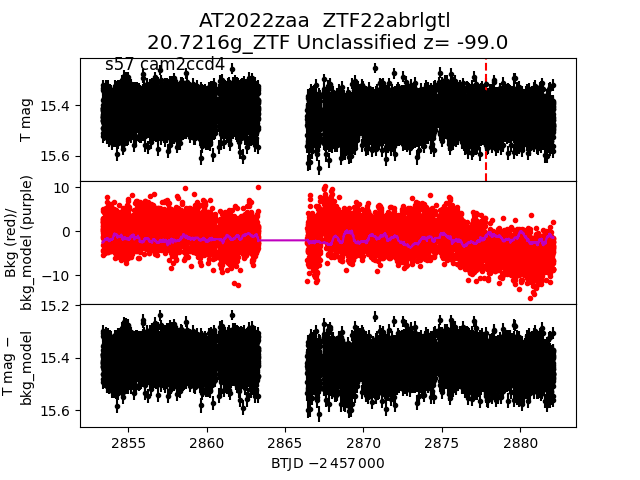
 2022zaa
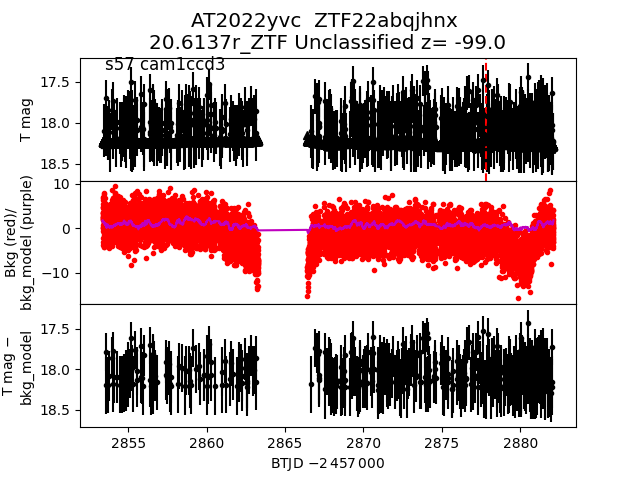
 2022yvc
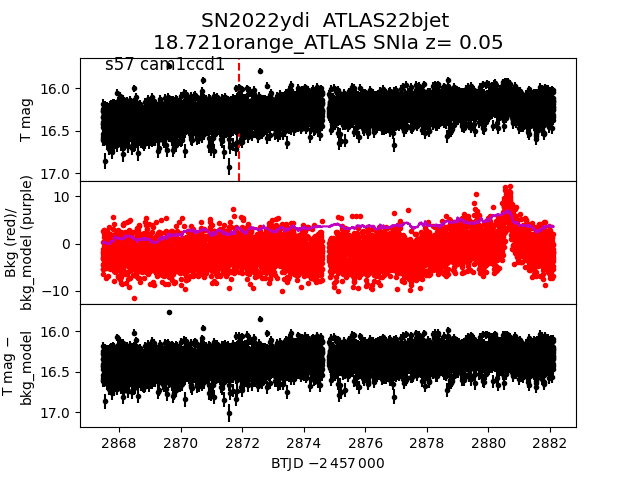
 2022ydi
 2022ygt
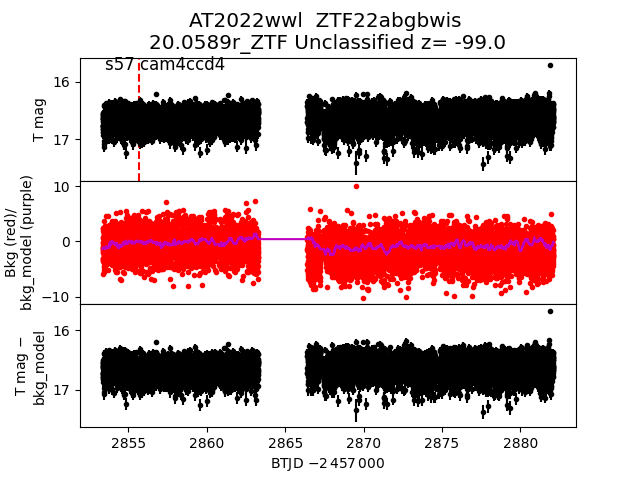
 2022wwl
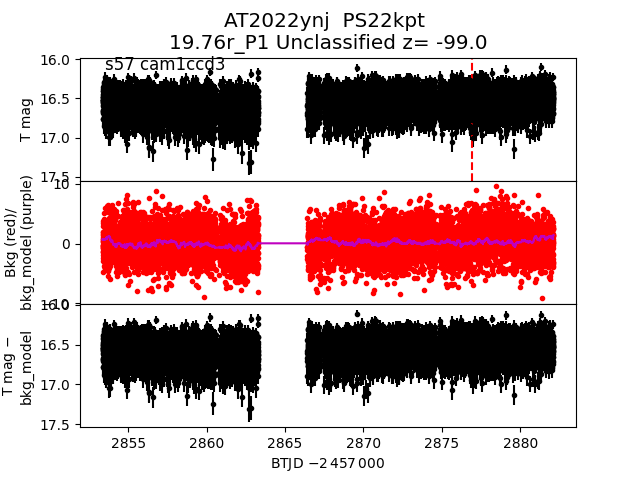
 2022ynj
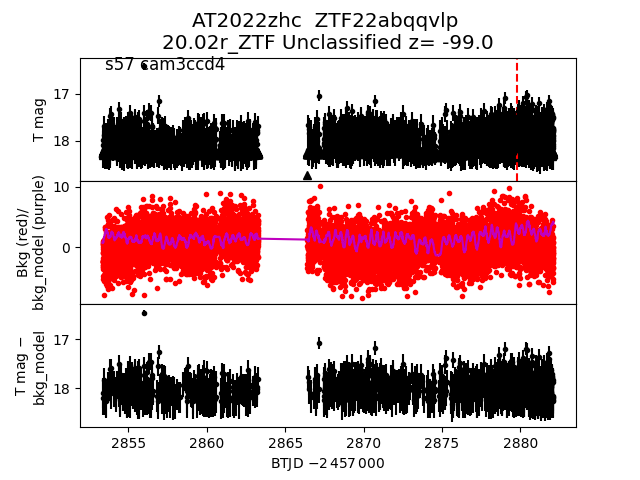
 2022zhc
 2022yax
 2022aace
 2022yyg
 2022yxt
 2022zur
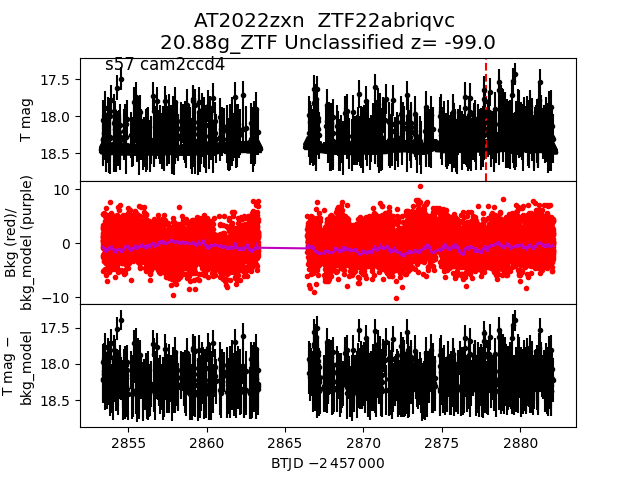
 2022zxn
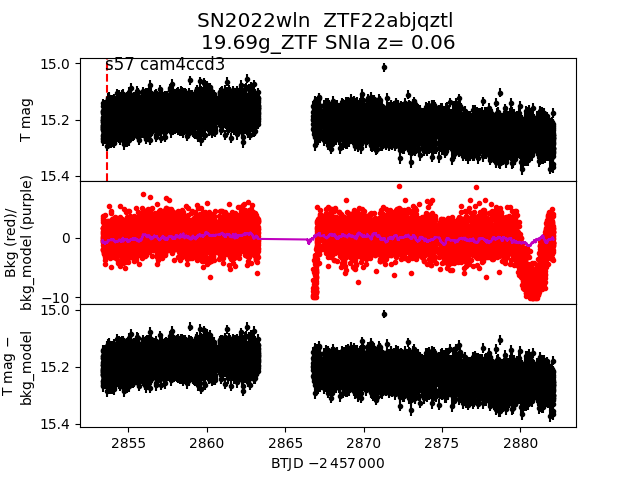
 2022wln
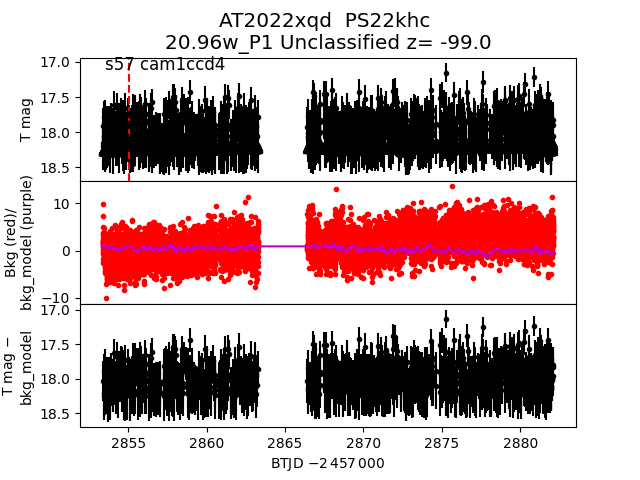
 2022xqd
 2022wvi
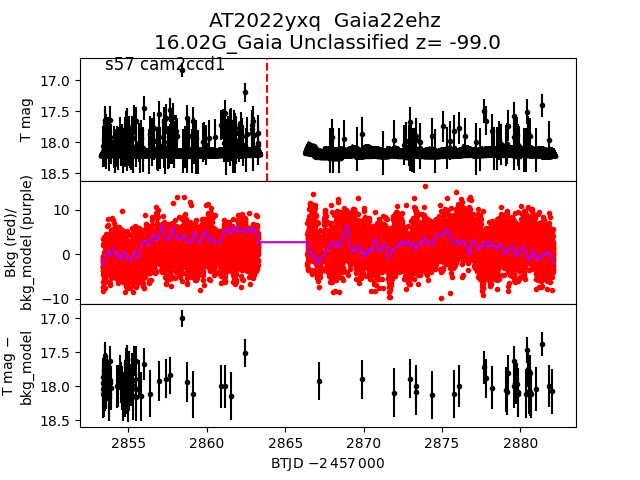
 2022yxq
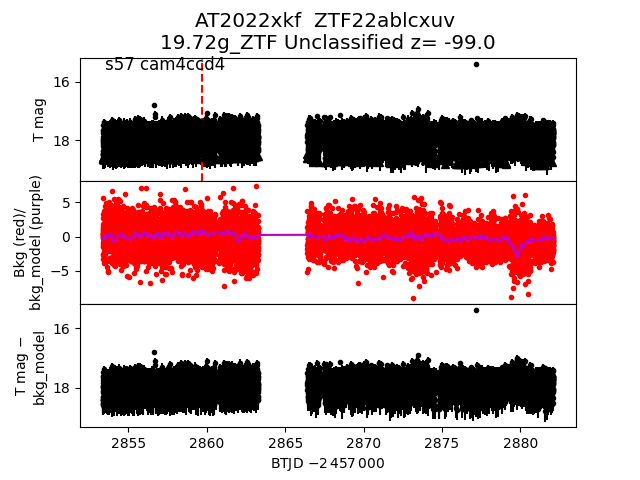
 2022xkf
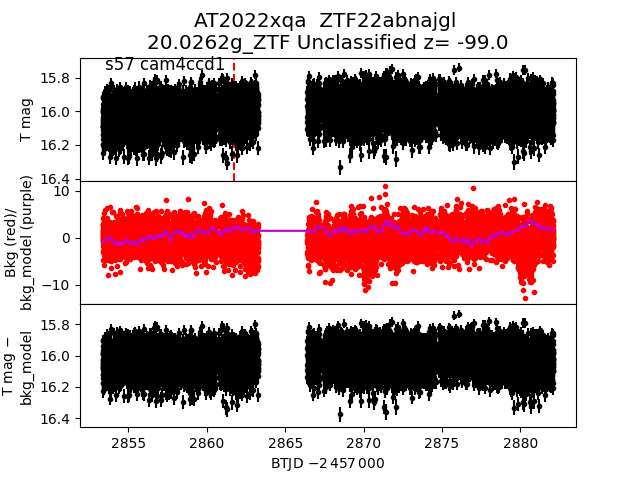
 2022xqa
 2022yrm
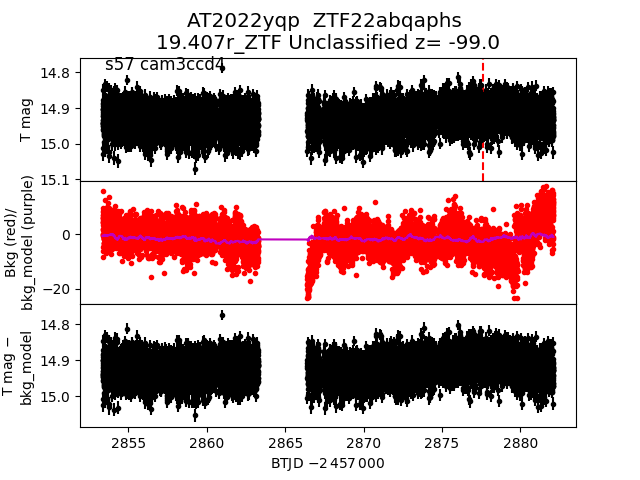
 2022yqp
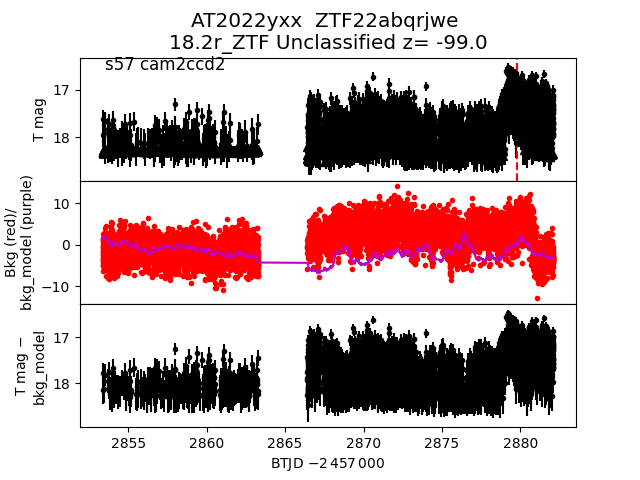
 2022yxx
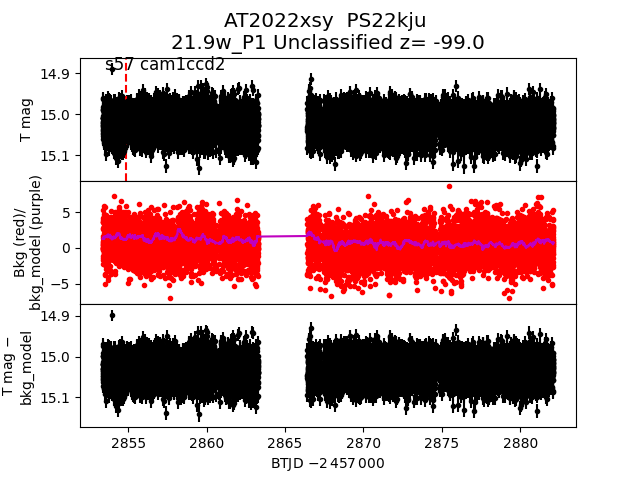
 2022xsy
 2022aafq
 2022yvf
 2022ynp
 2022wve
 2022zjh
 2022yud
 2022wsk
 2022aafn