all transients in sector54 (111 total)
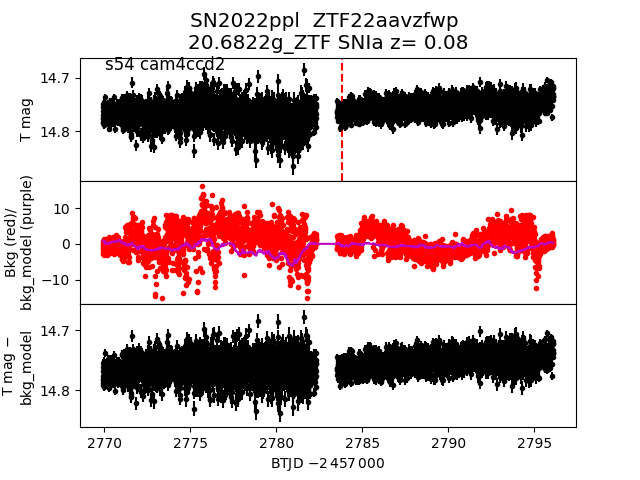
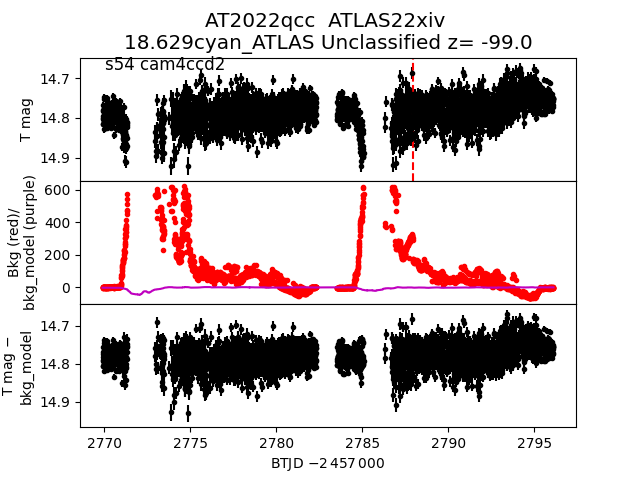
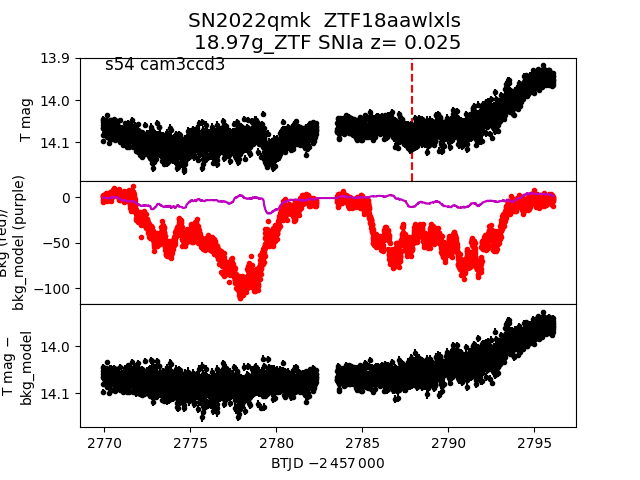
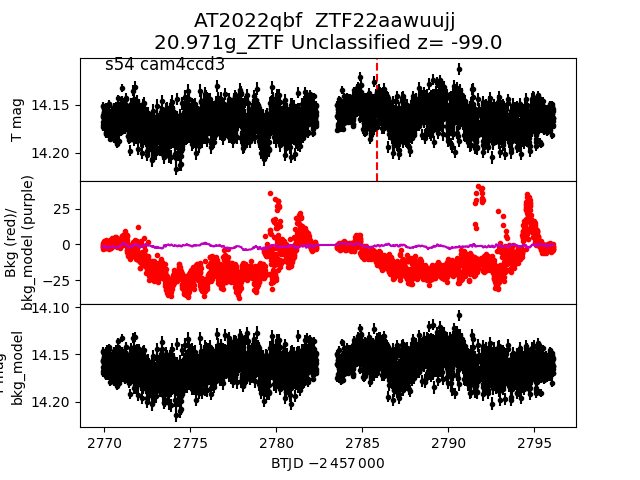
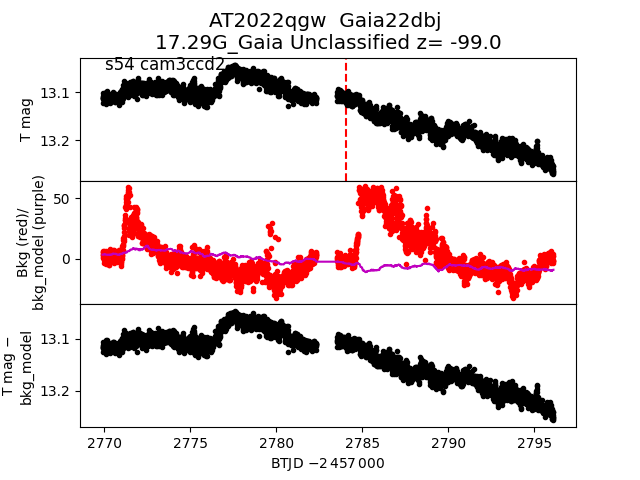
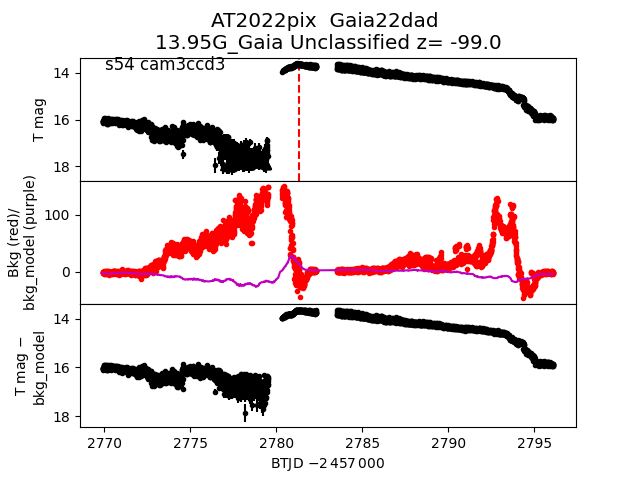
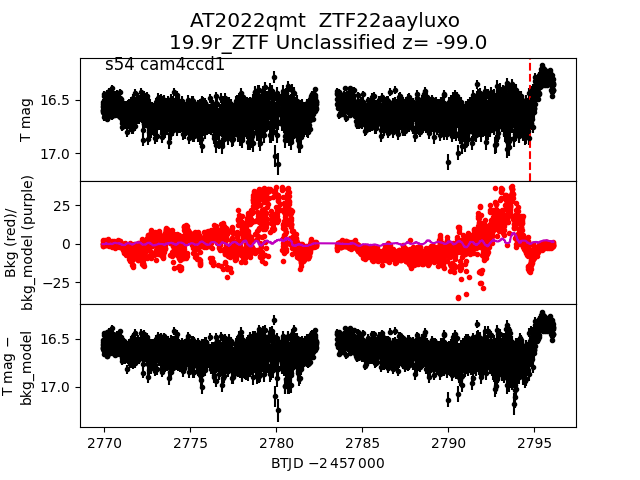
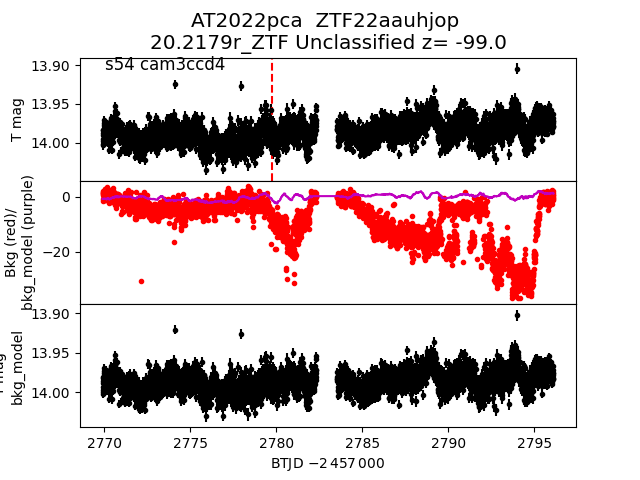
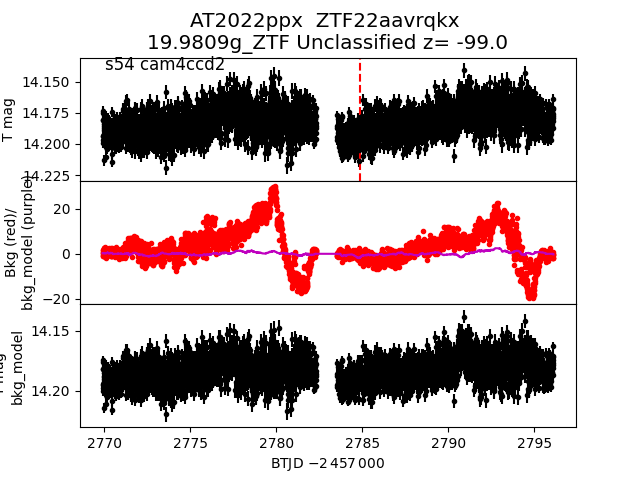
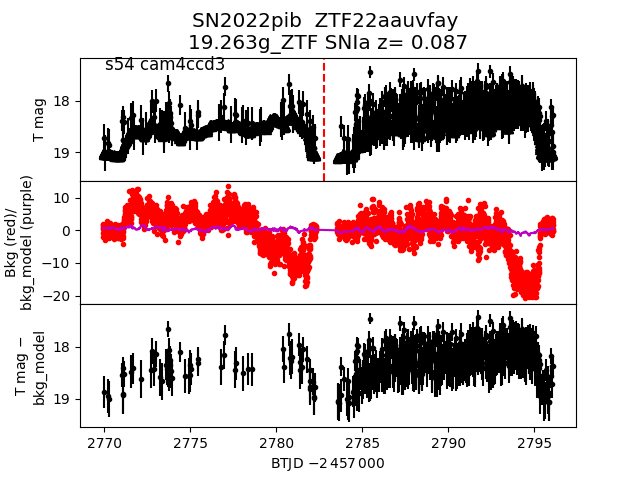
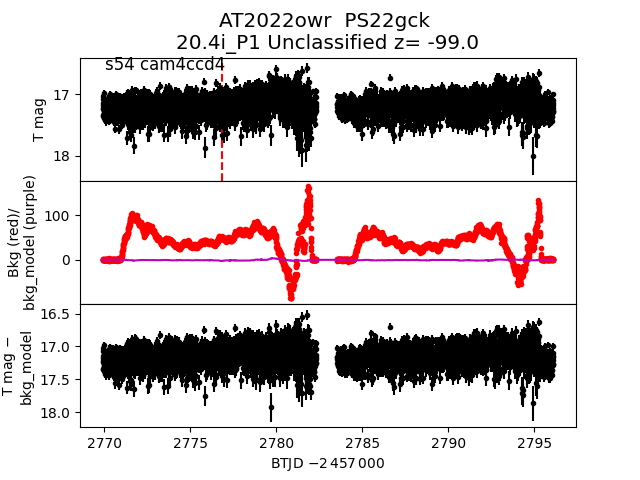
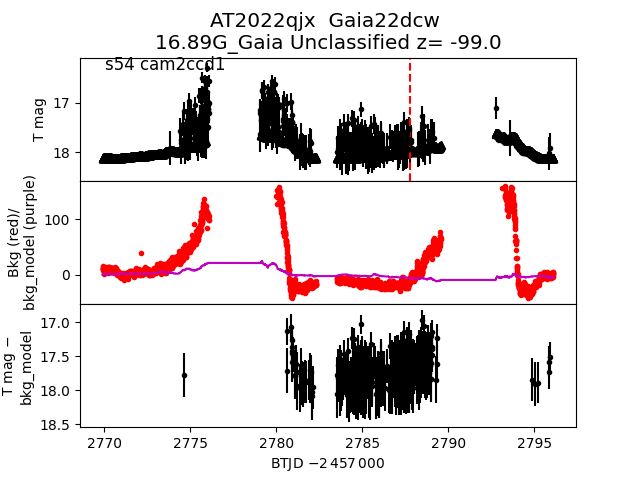
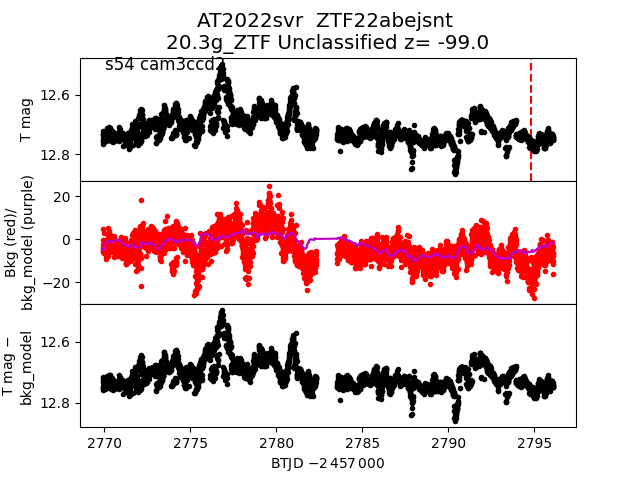
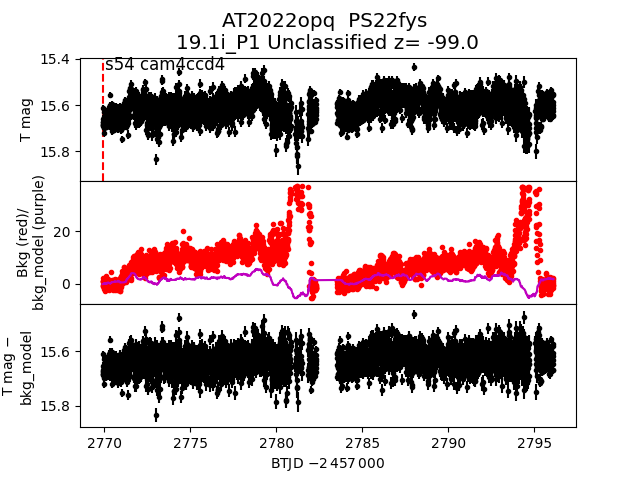
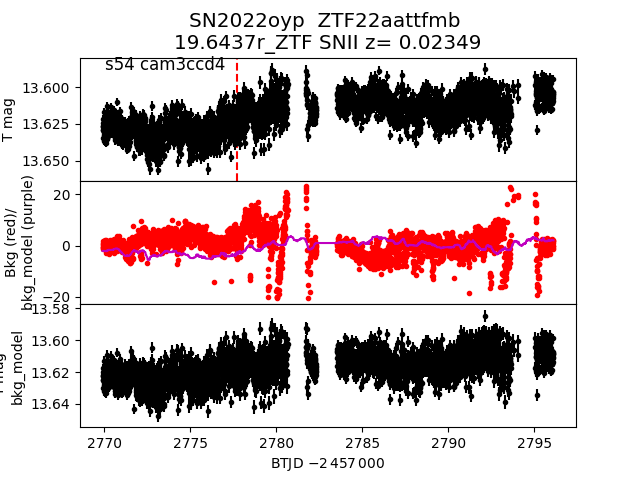
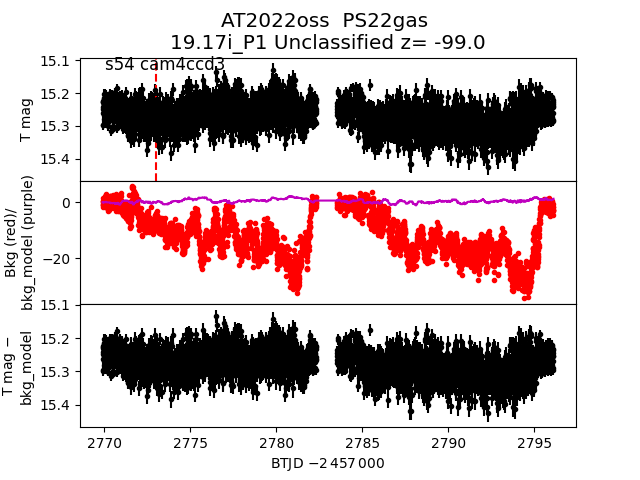
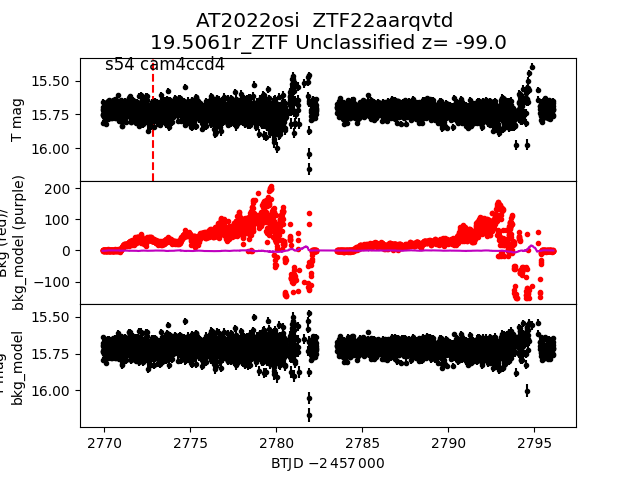
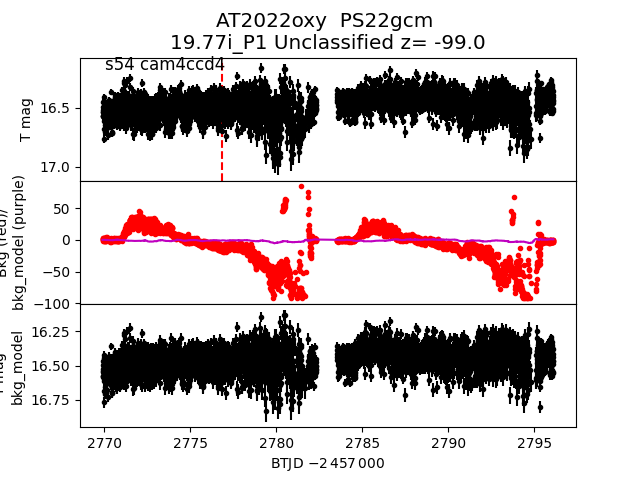
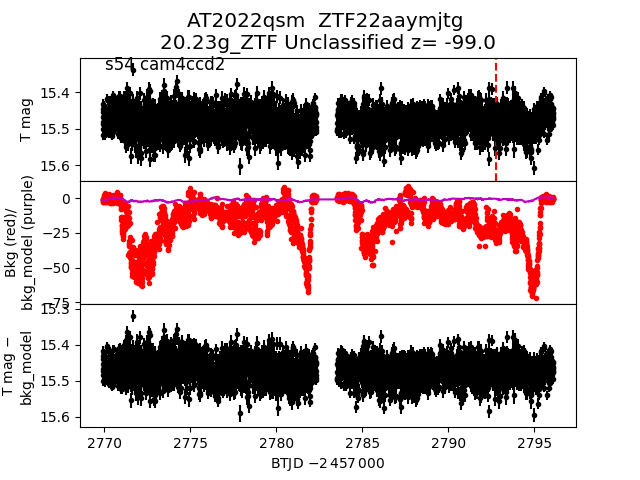
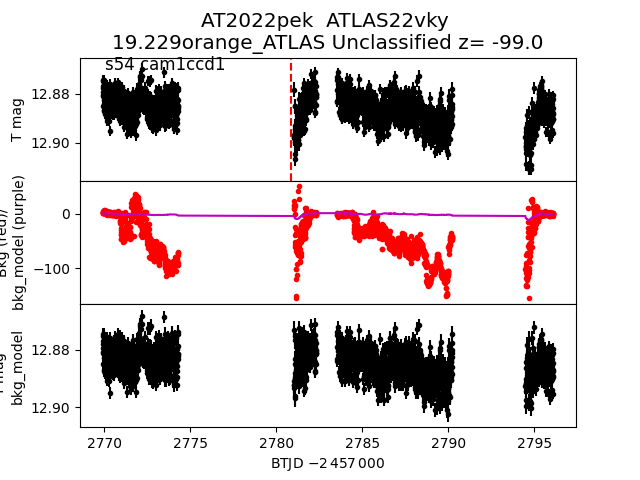
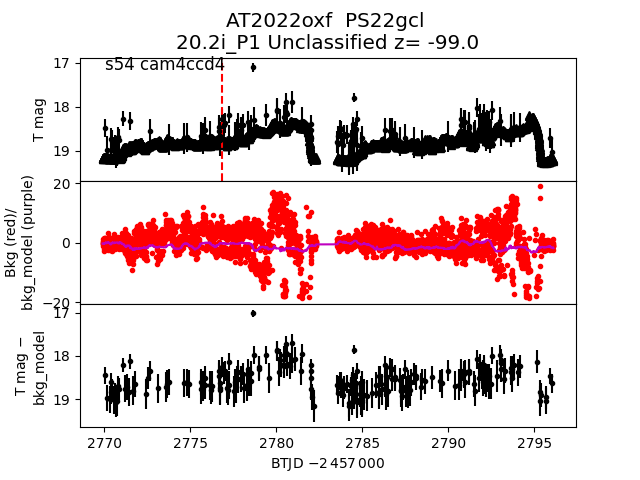
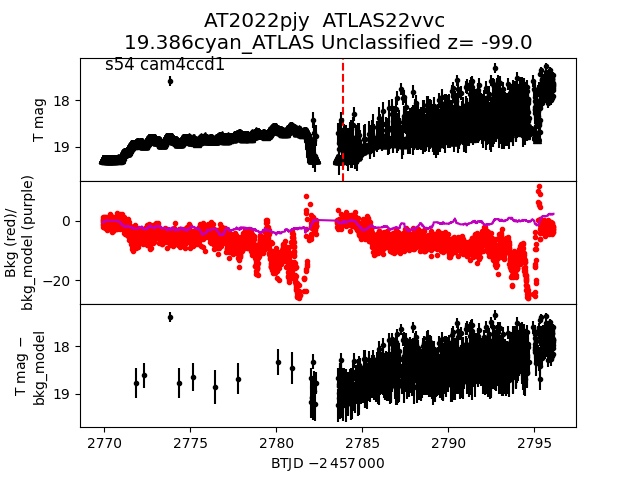
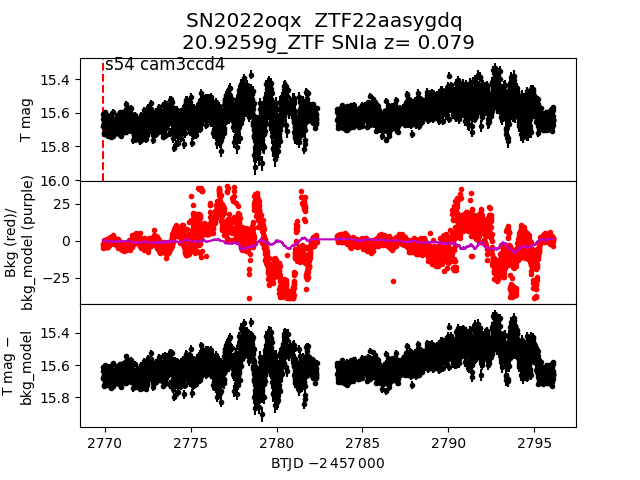
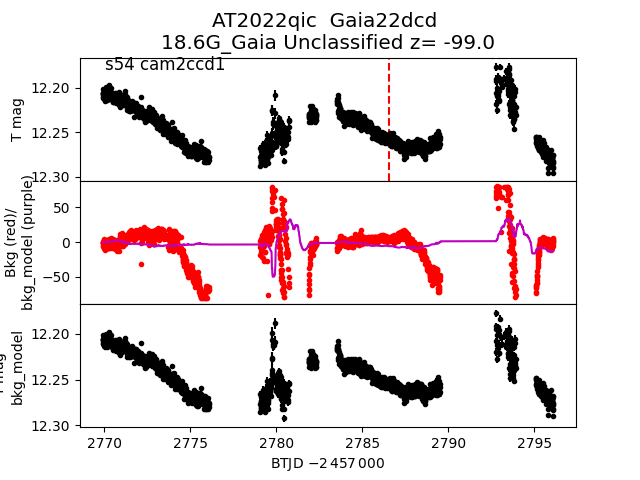
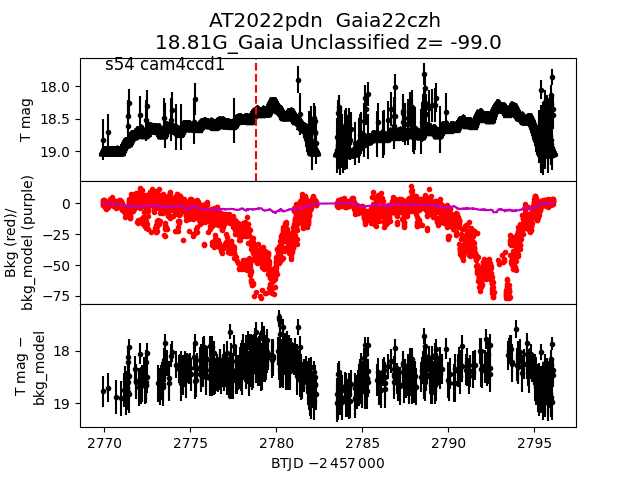
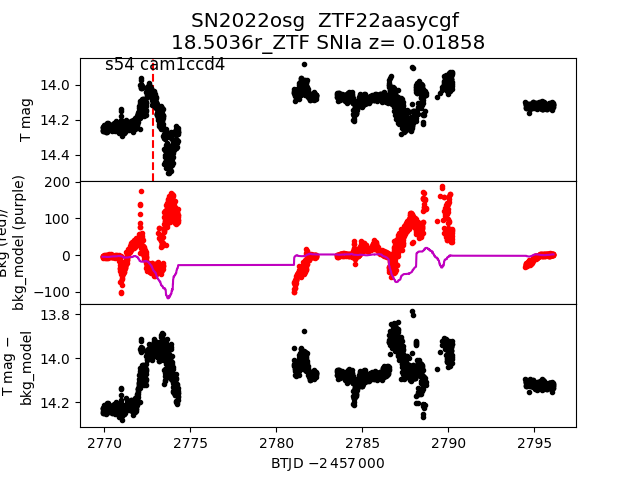
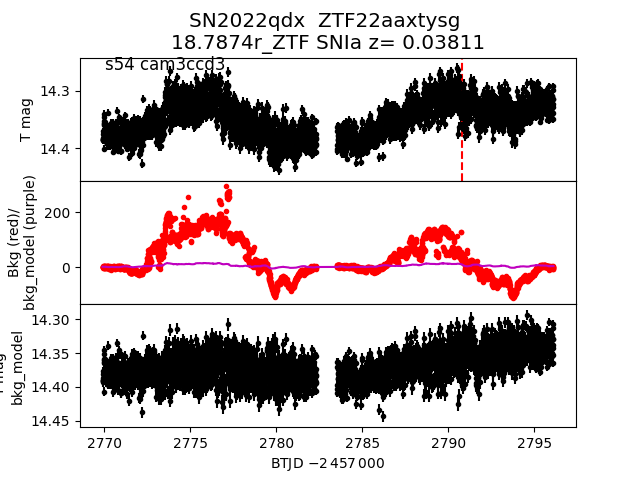
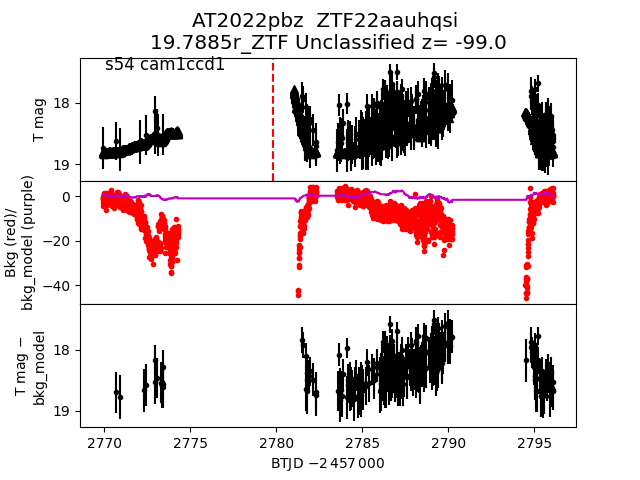
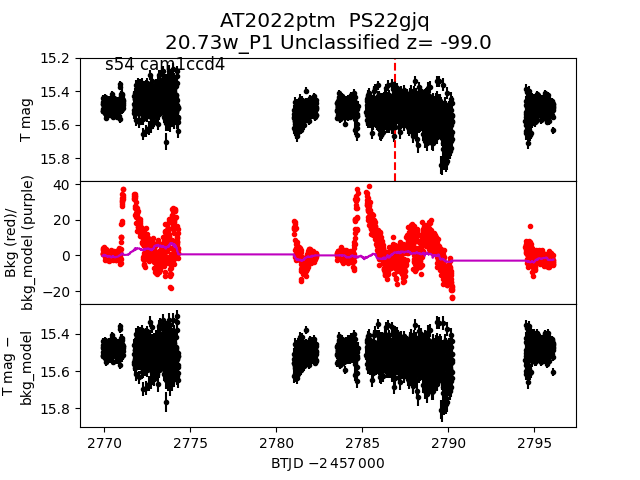
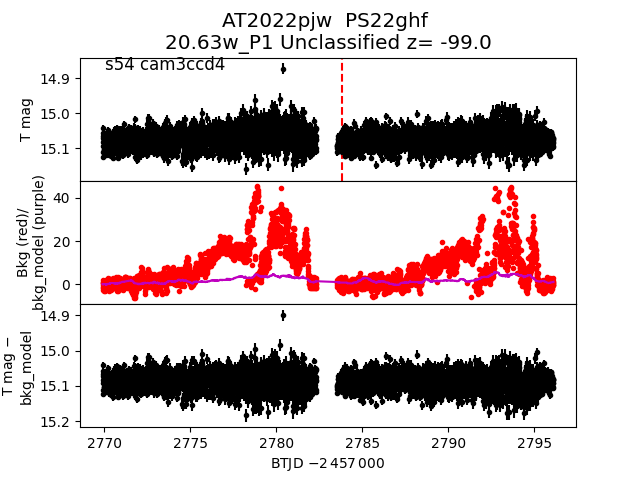
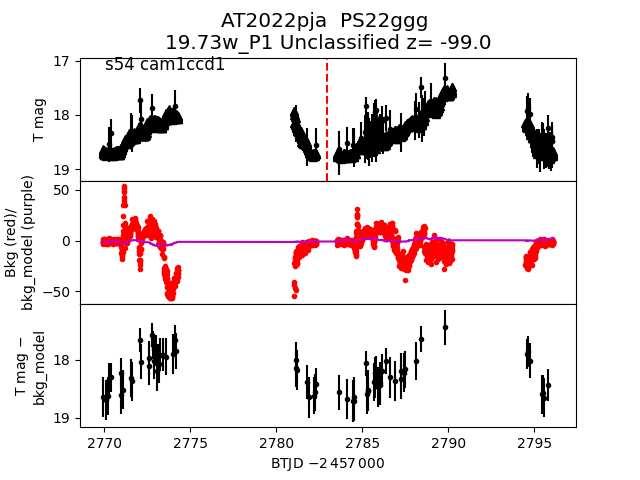
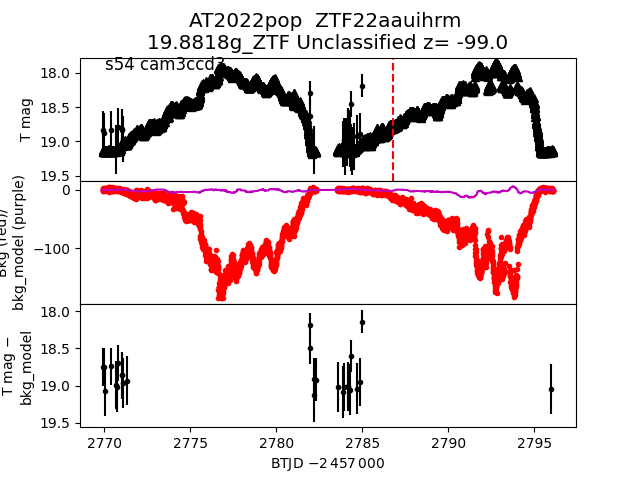
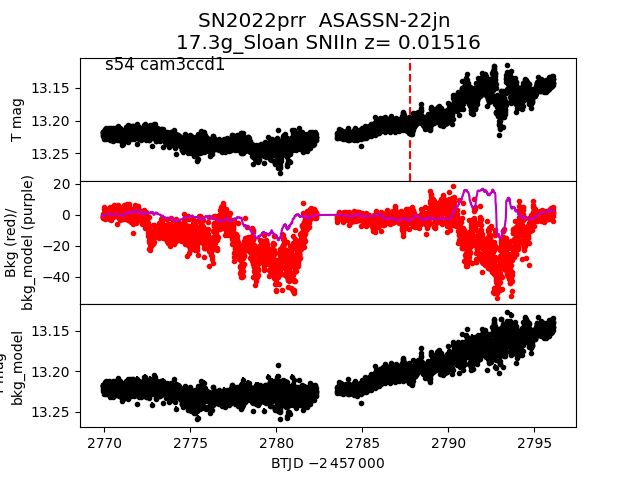
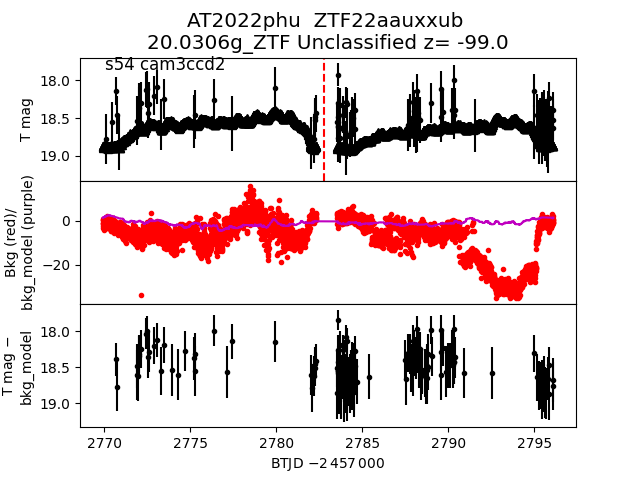
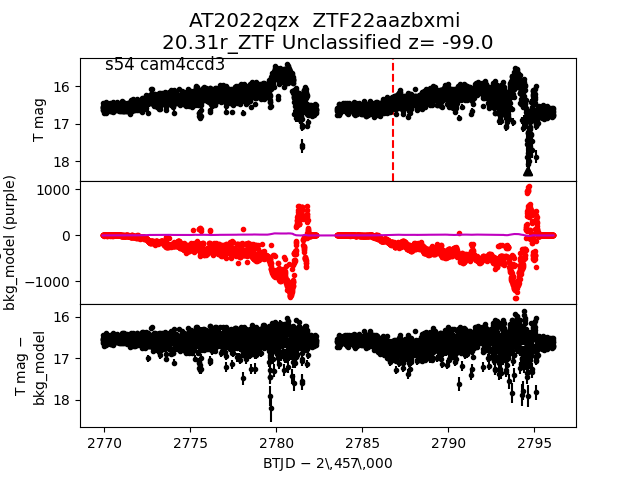
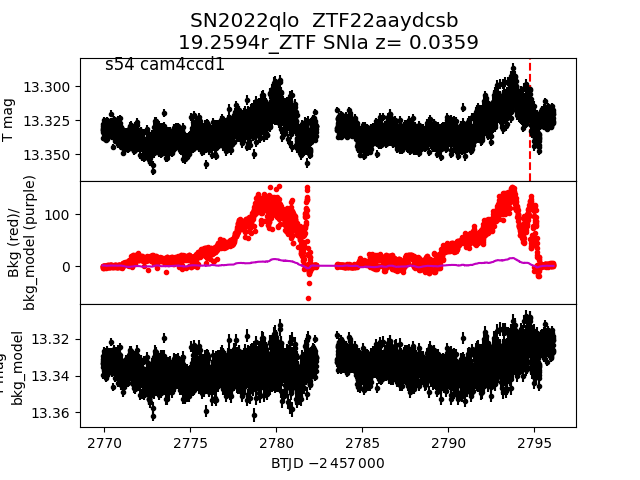
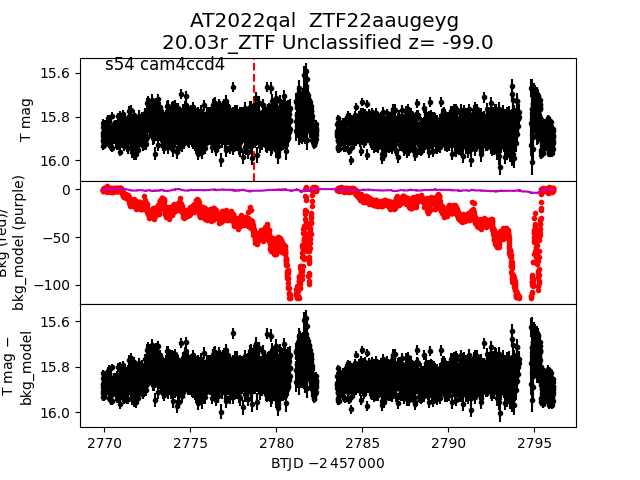
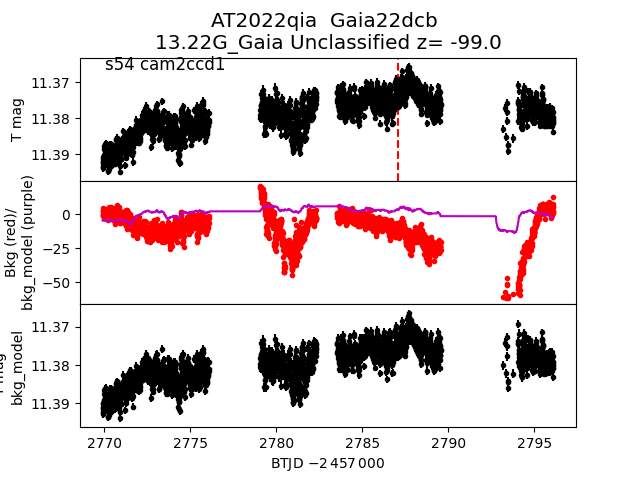
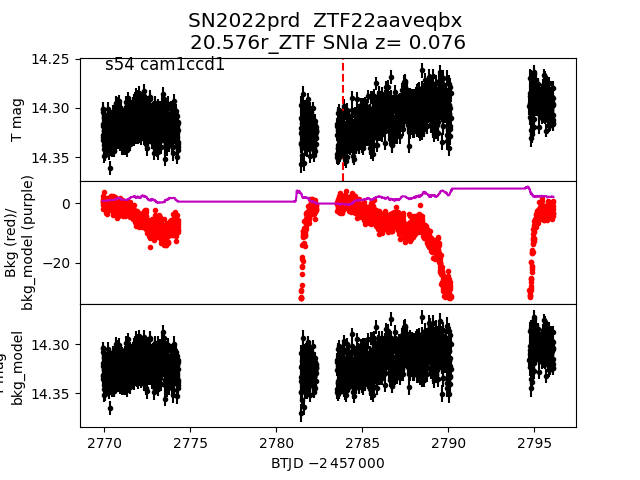
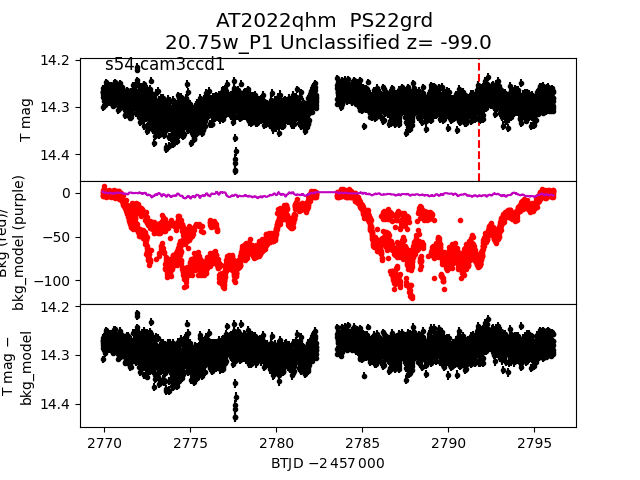
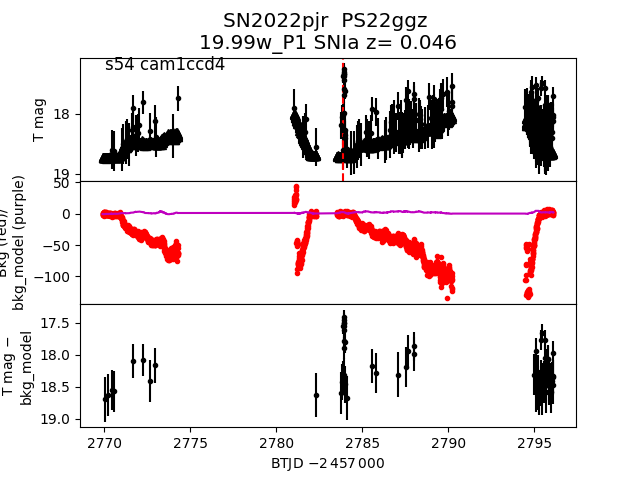
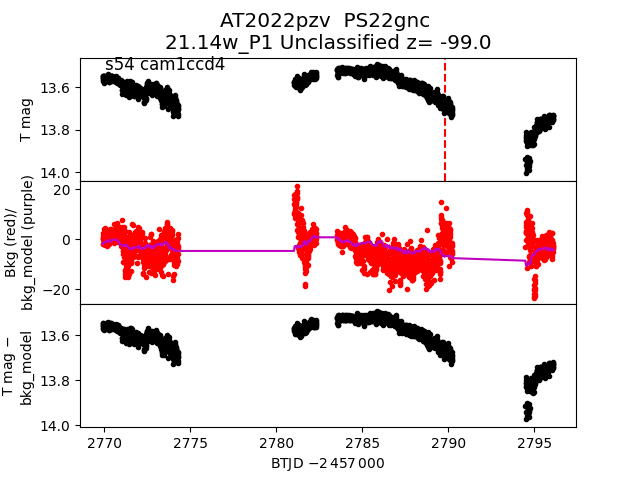
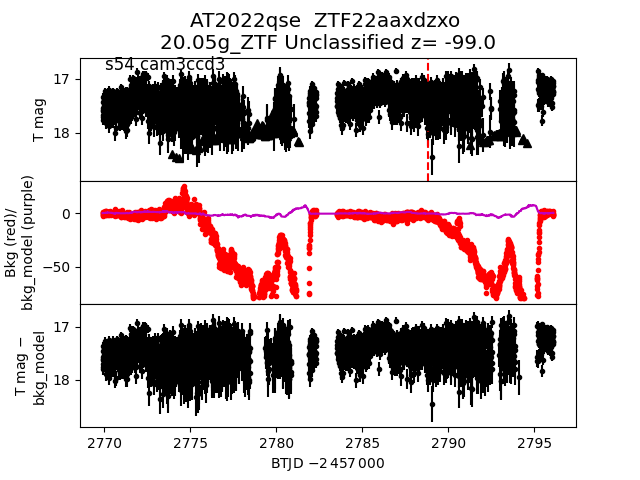
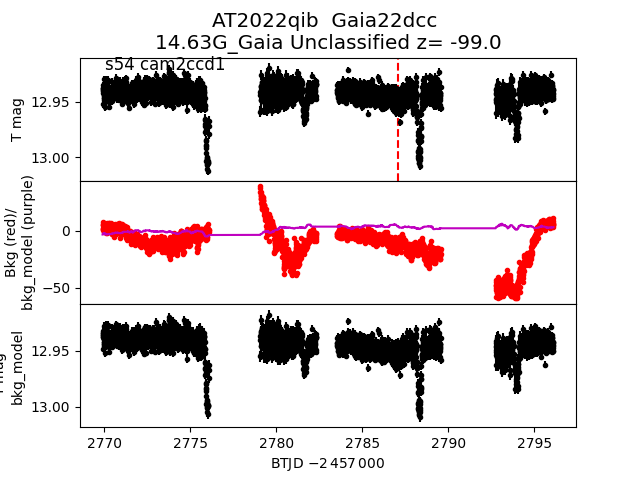
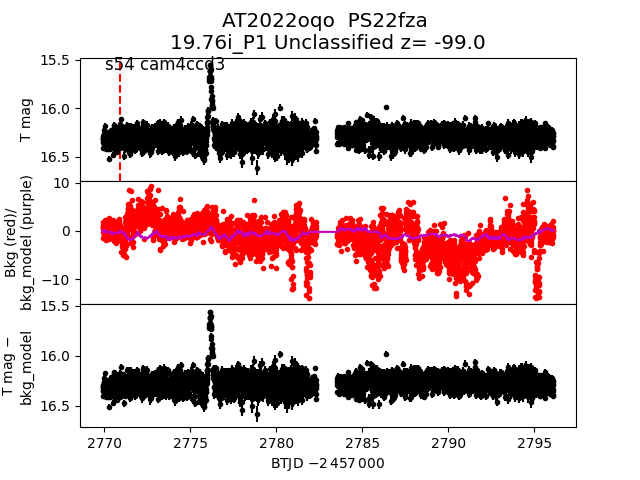
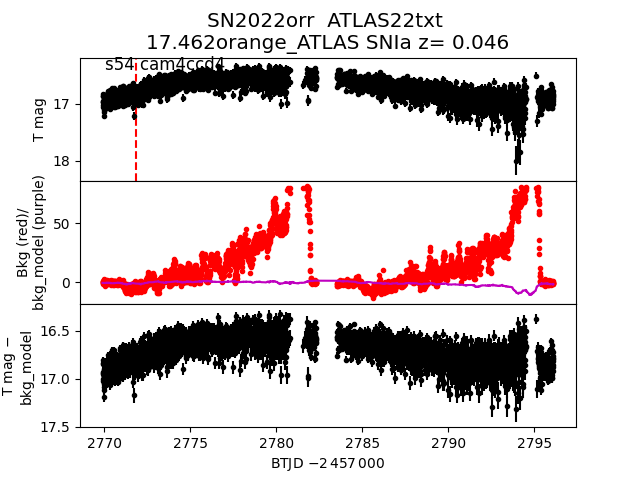
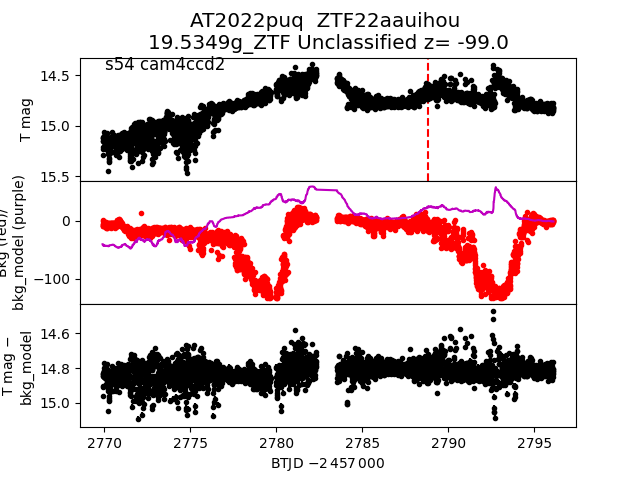
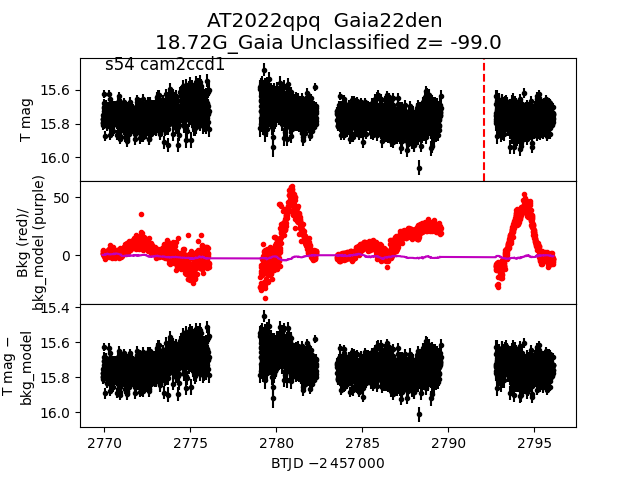
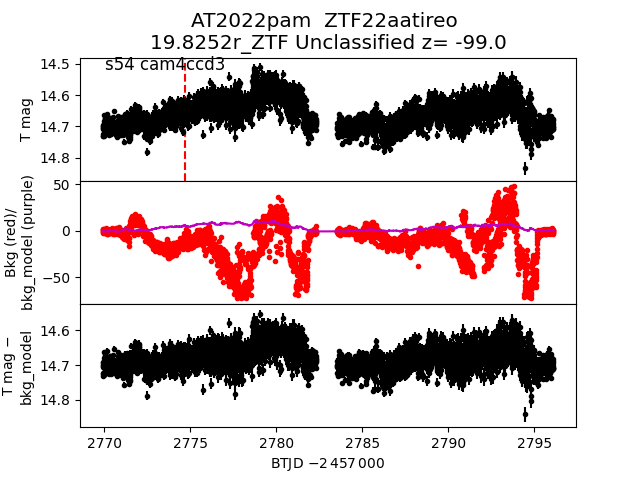
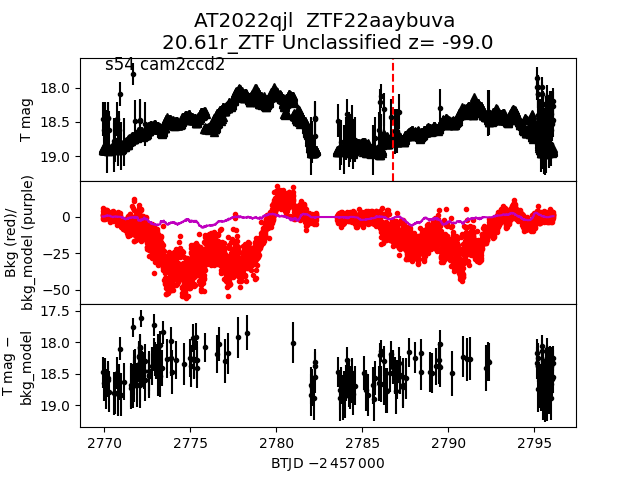
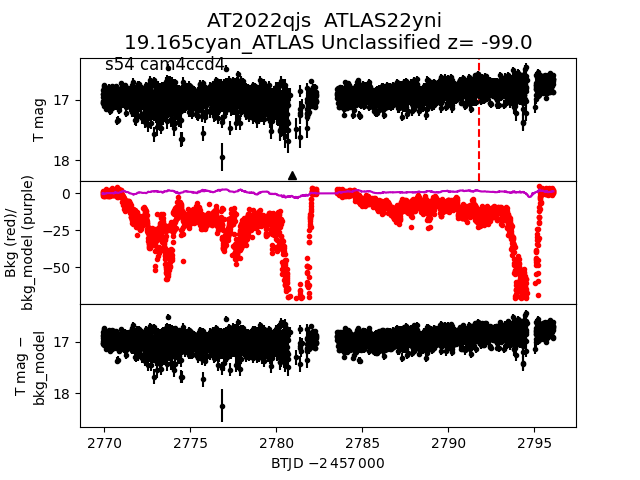
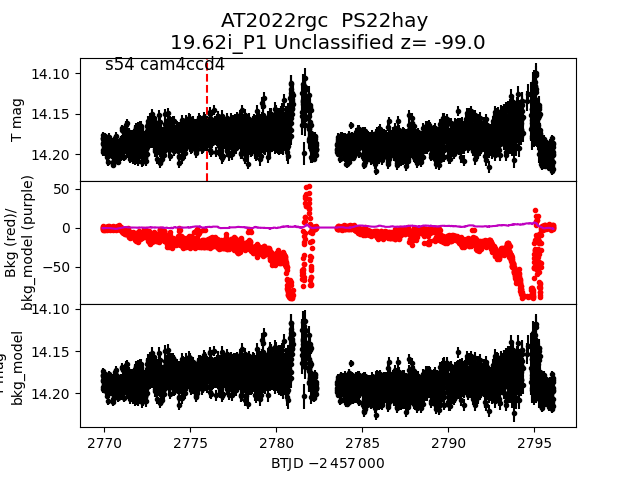
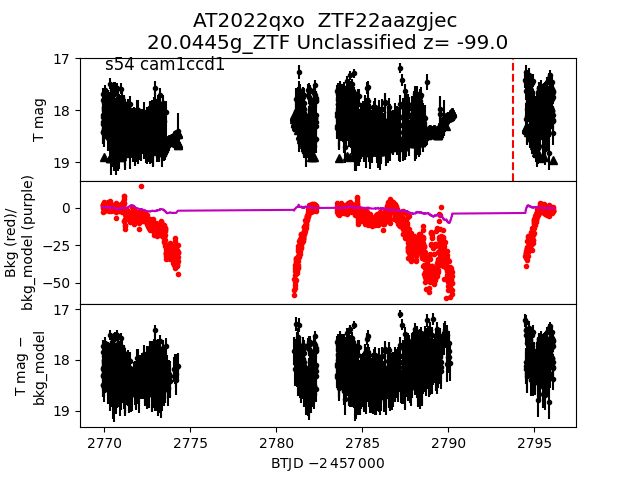
Each figure has three panels. The top panel shows the transient light curve, the middle panel shows the local background (estimated in an annulus), and the bottom panel shows a "background-model corrected" light curve. Details about the background model are in the README.
The vertical red line marks the time of discovery reported to TNS. Other useful metadata from TNS is in the figure title.
Note that the top and bottom panel are in magnitudes, while the middle panel is in differential flux units. The magnitudes are calibrated to the flux in the reference image used for image subtraction. Thus, flux from the host galaxy is included in these magnitudes.
3-sigma upper limits are plotted as triangles with no errorbars. A typical limiting magnitude is 19.6 in 30 minutes or 18.4 in 200 seconds (for low backgrounds).
The links allow you to download the light curve data as a text file.
More details in the README.
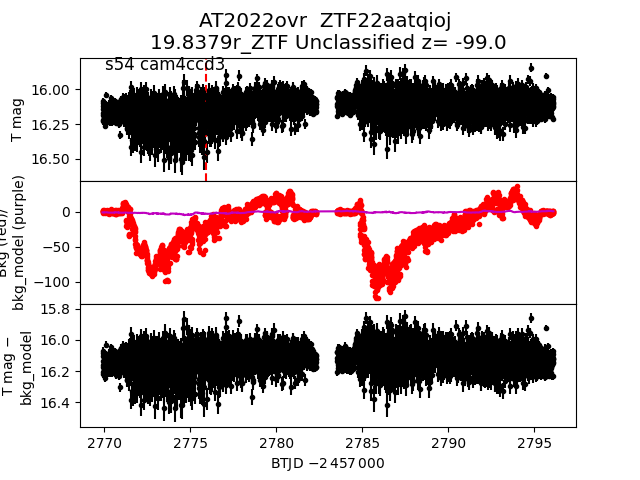
2022ovr
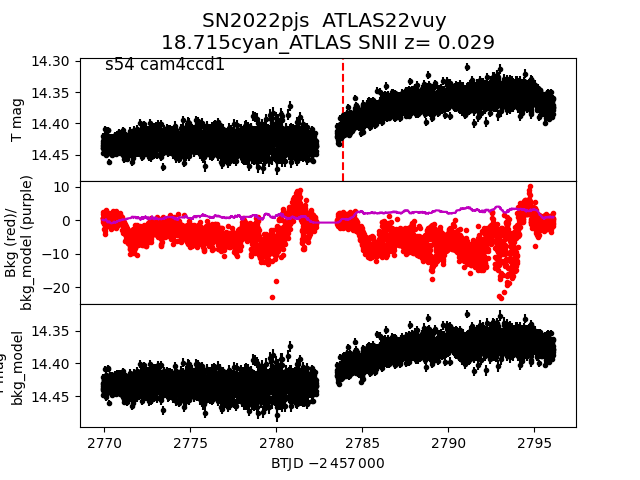
 2022pjs
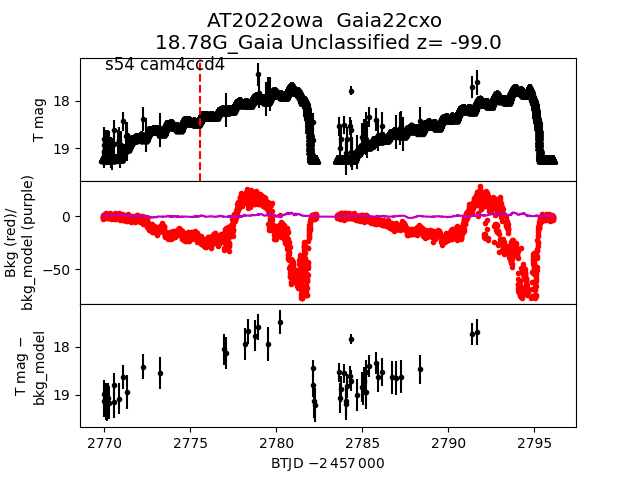
 2022owa
 2022qcc
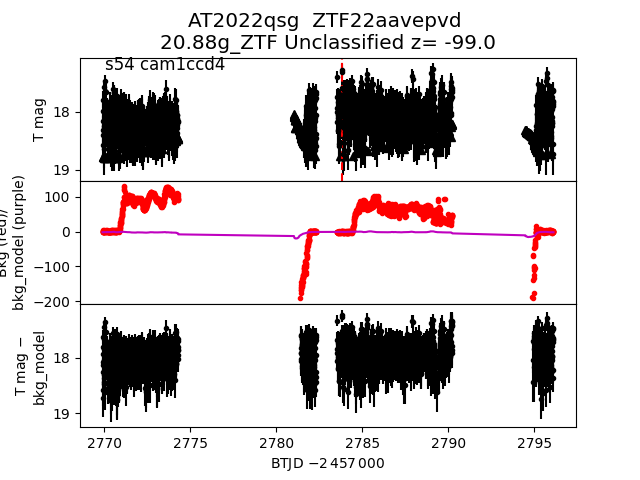
 2022qsg
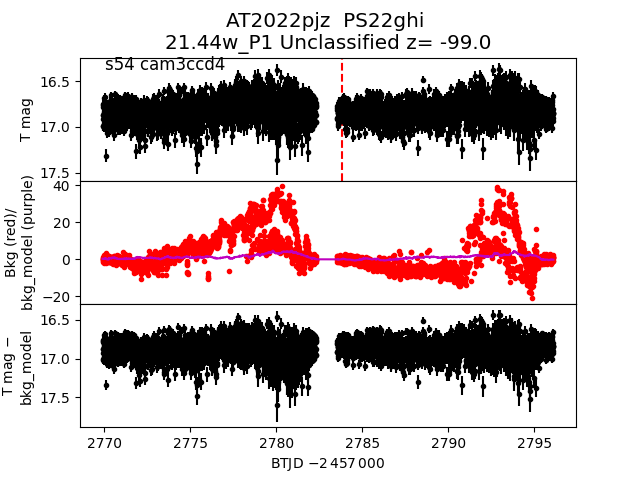
 2022pjz
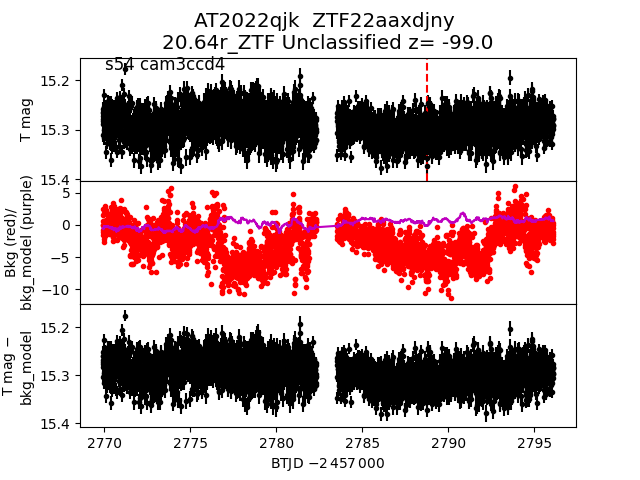
 2022qjk
 2022qmk
 2022qbf
 2022ouy
 2022qgw
 2022pix
 2022qmt
 2022pca
 2022ppx
 2022pib
 2022owr
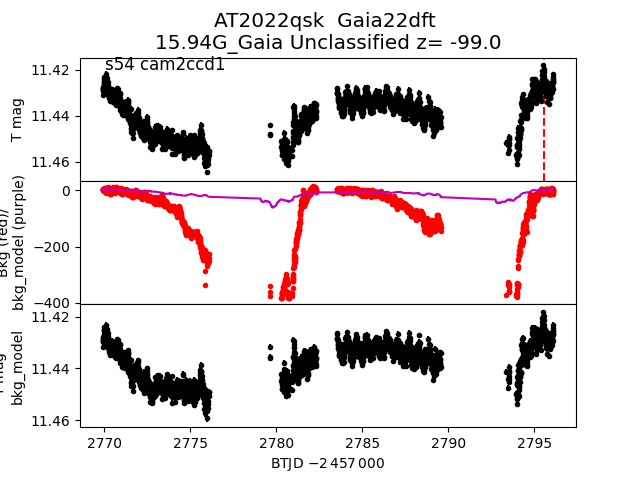
 2022qsk
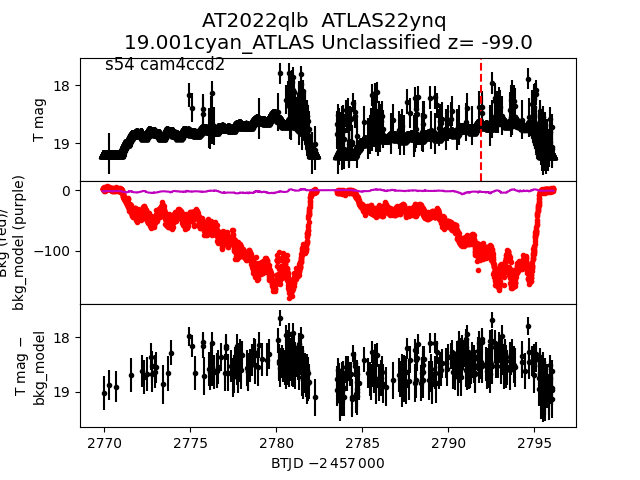
 2022qlb
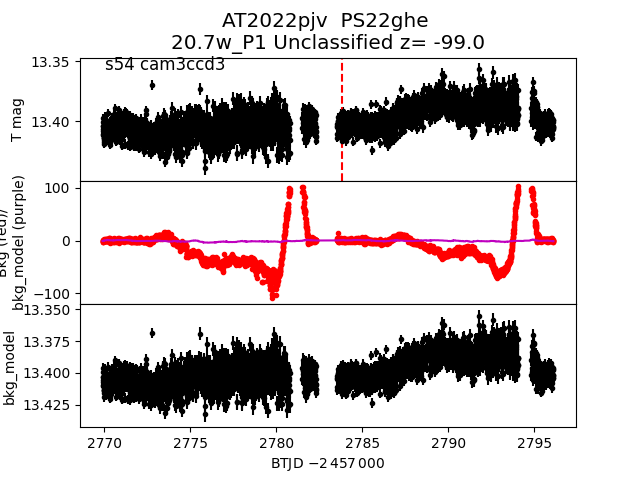
 2022pjv
 2022qjx
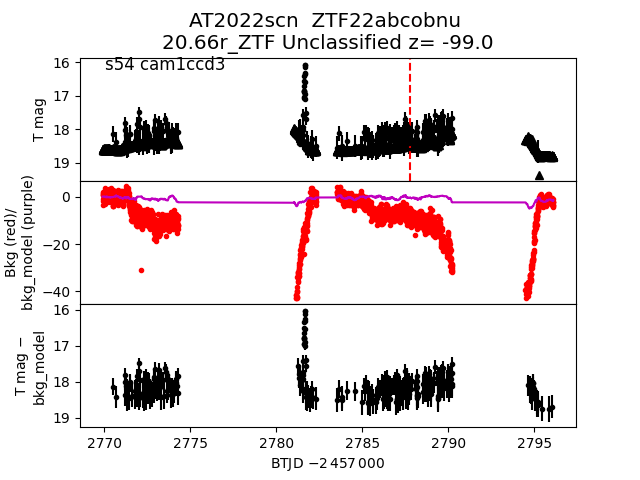
 2022scn
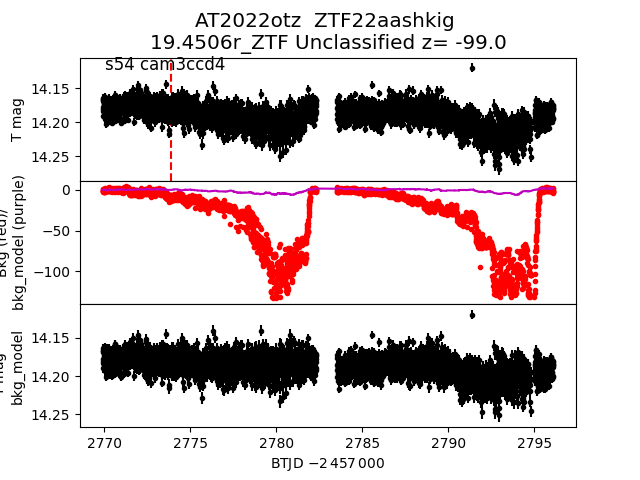
 2022otz
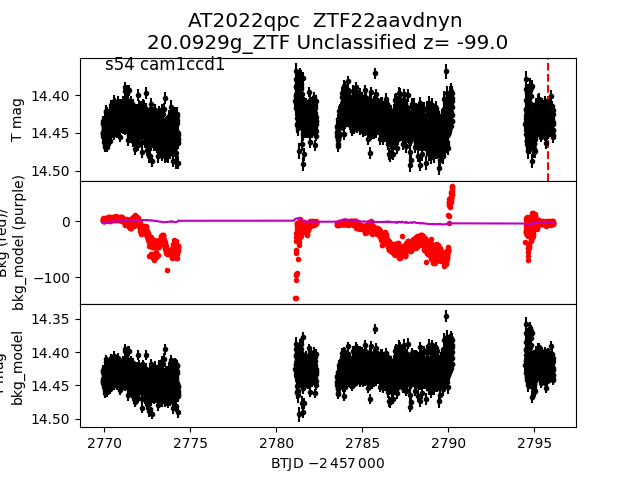
 2022qpc
 2022svr
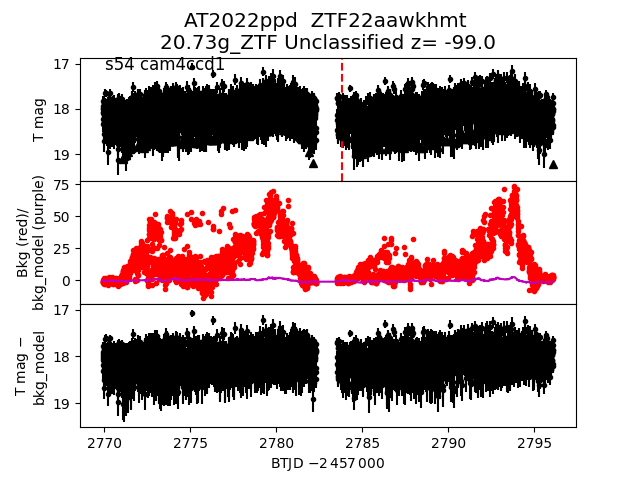
 2022ppd
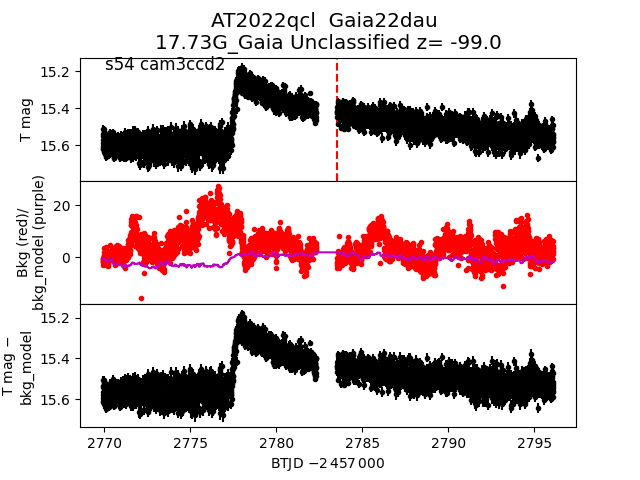
 2022qcl
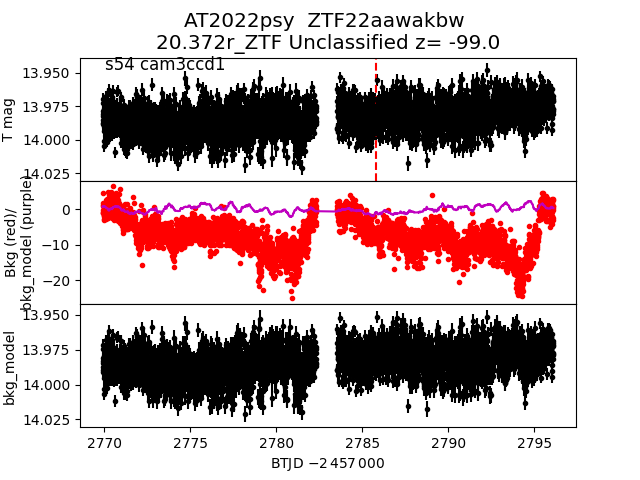
 2022psy
 2022opq
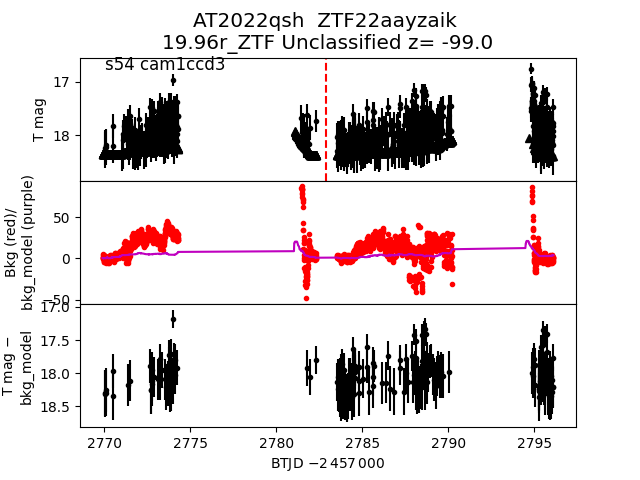
 2022qsh
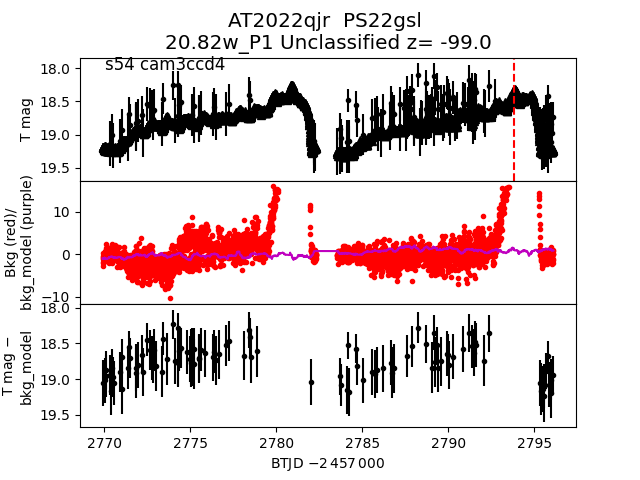
 2022qjr
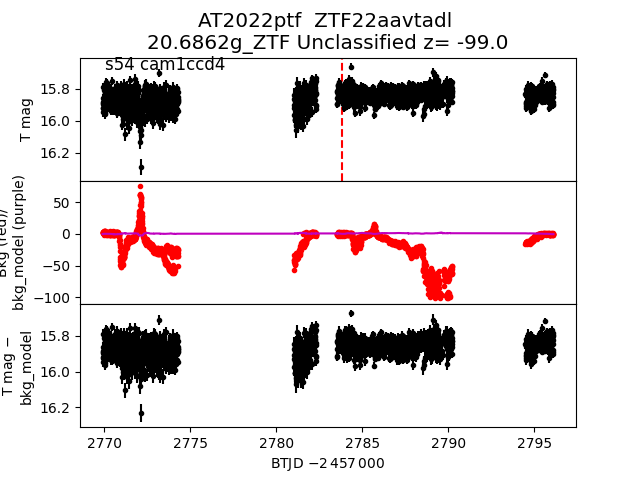
 2022ptf
 2022oyp
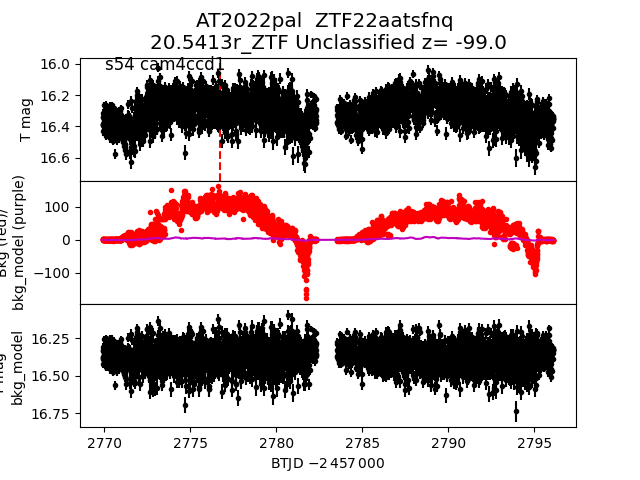
 2022pal
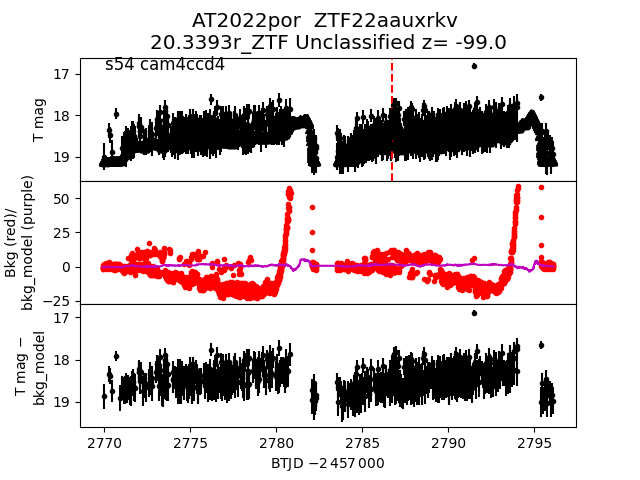
 2022por
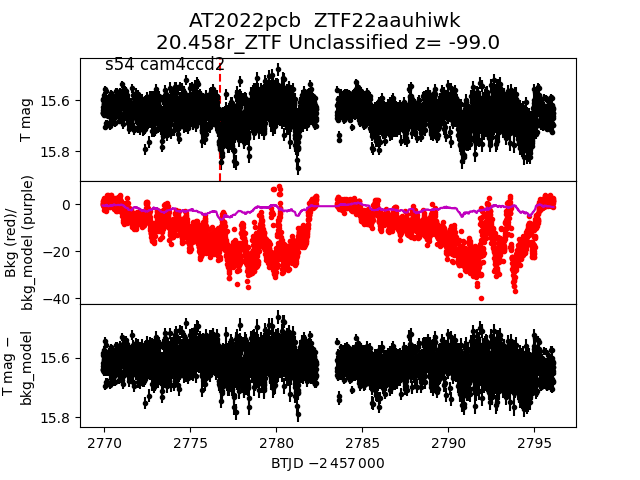
 2022pcb
 2022oss
 2022osi
 2022oxy
 2022qsm
 2022pek
 2022oxf
 2022pjy
 2022oqx
 2022qic
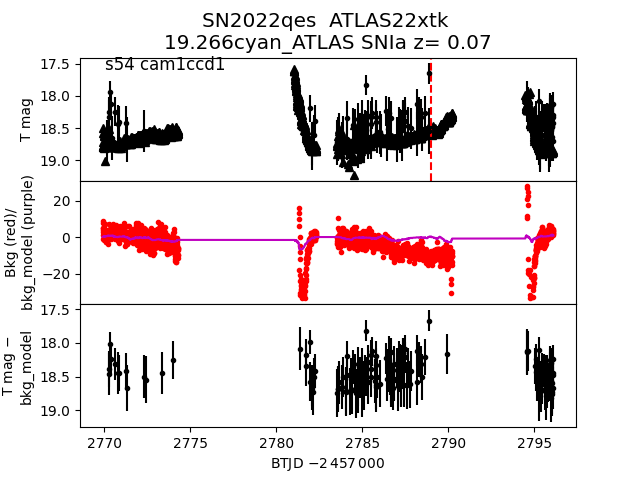
 2022qes
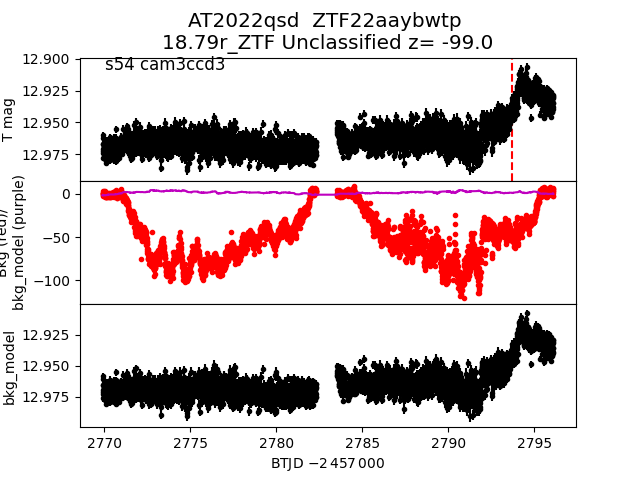
 2022qsd
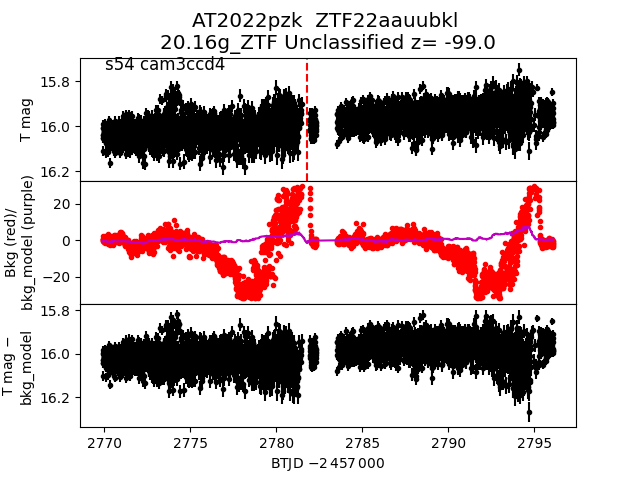
 2022pzk
 2022pdn
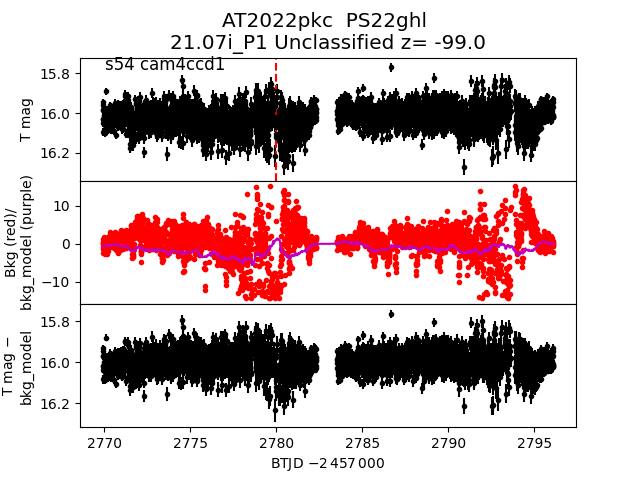
 2022pkc
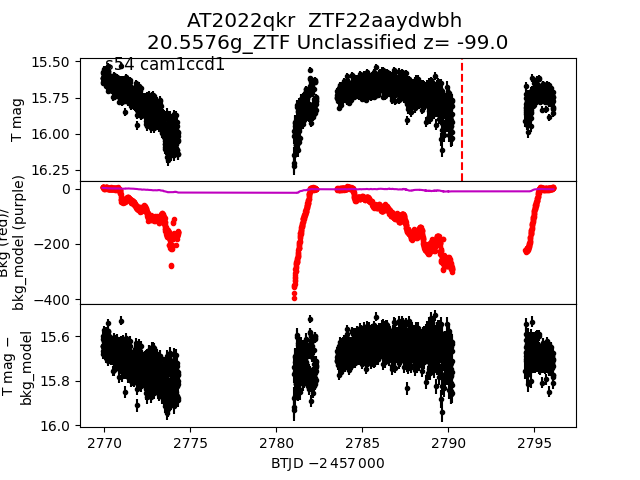
 2022qkr
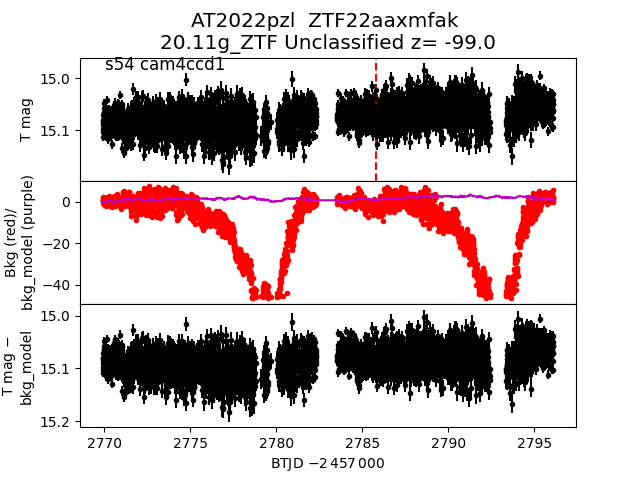
 2022pzl
 2022osg
 2022qdx
 2022pbz
 2022ptm
 2022pjw
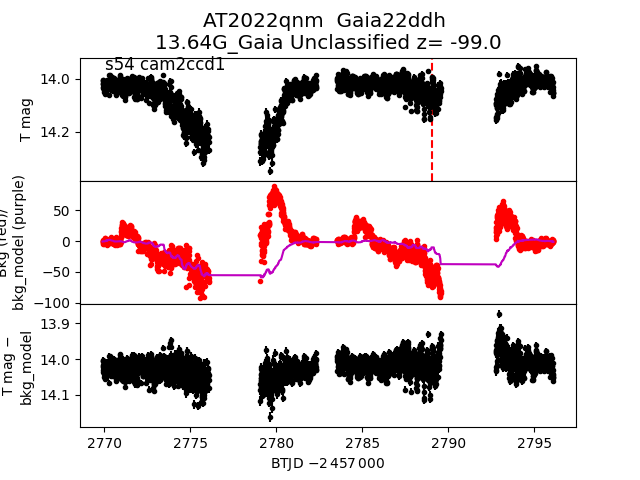
 2022qnm
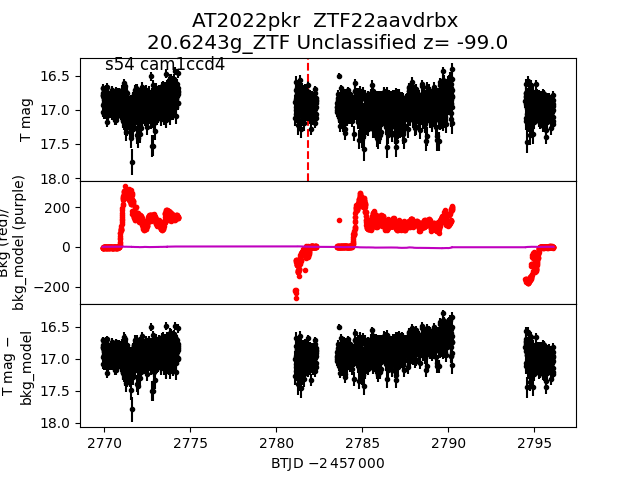
 2022pkr
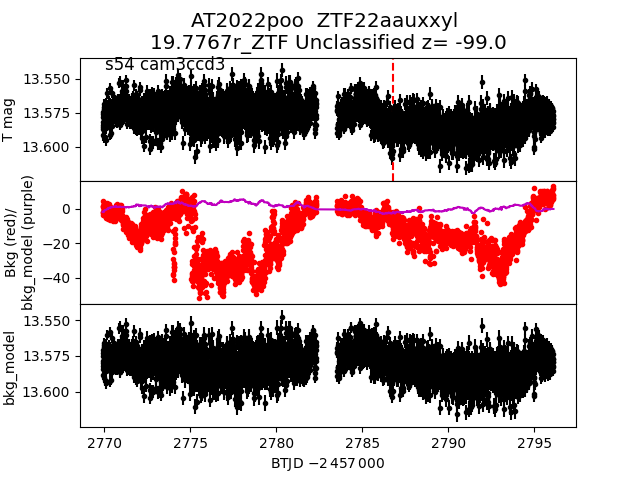
 2022poo
 2022pja
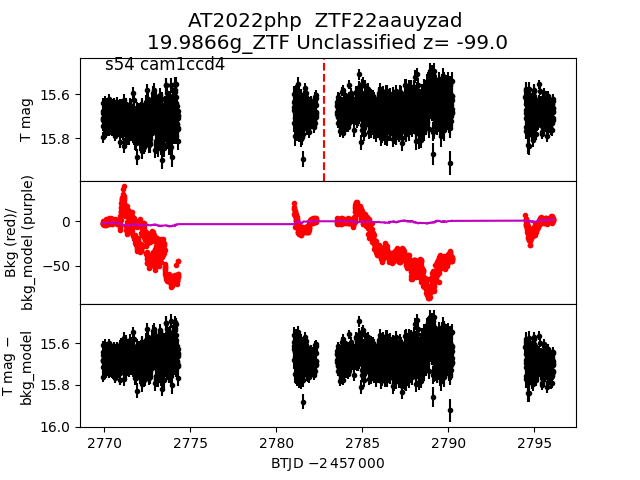
 2022php
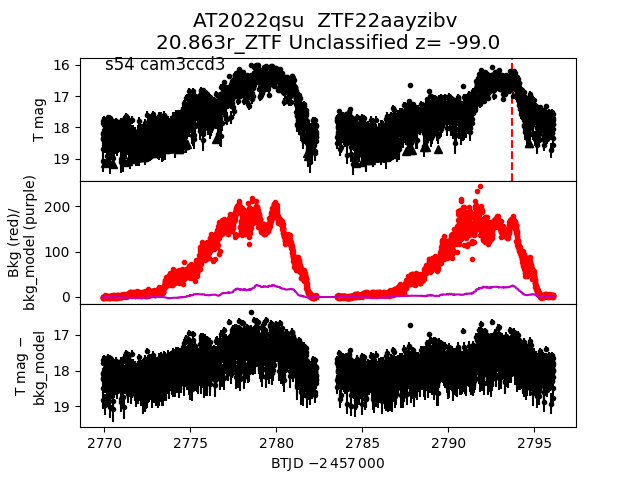
 2022qsu
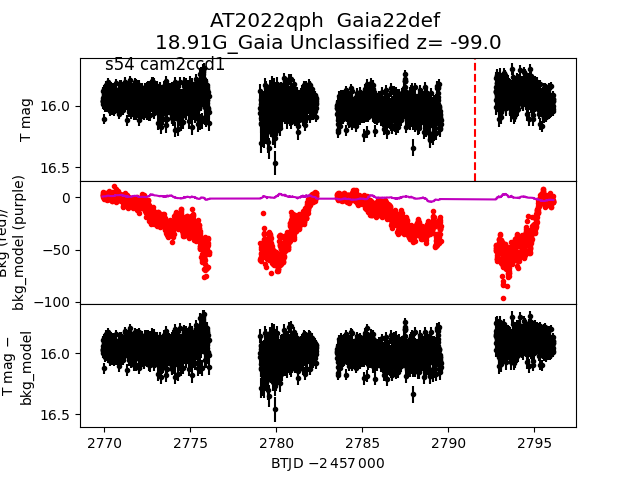
 2022qph
 2022pop
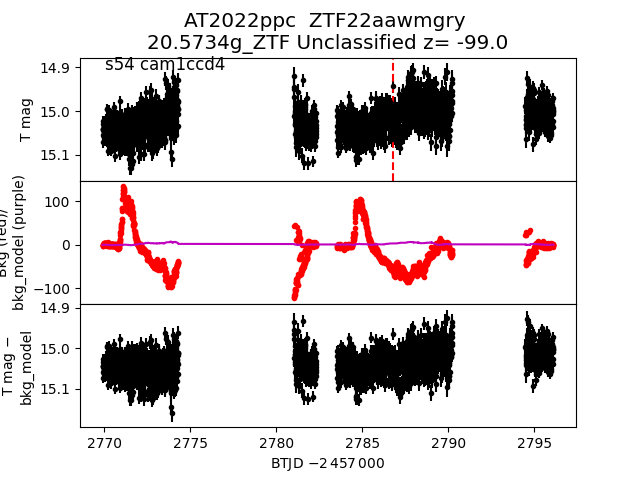
 2022ppc
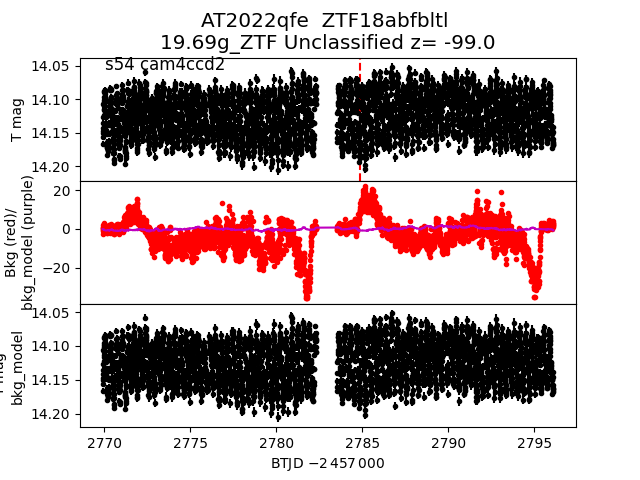
 2022qfe
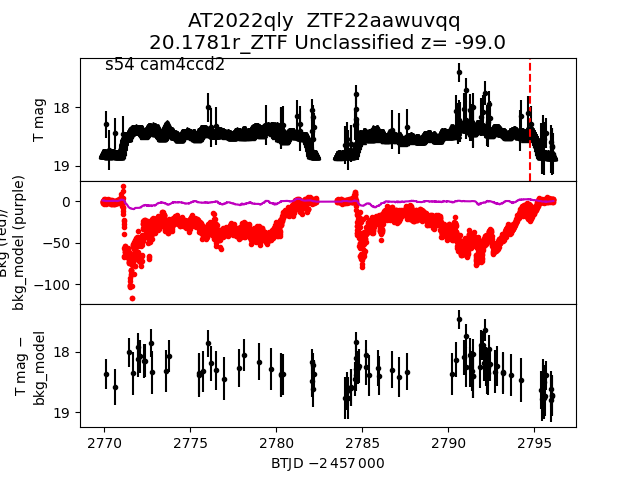
 2022qly
 2022prr
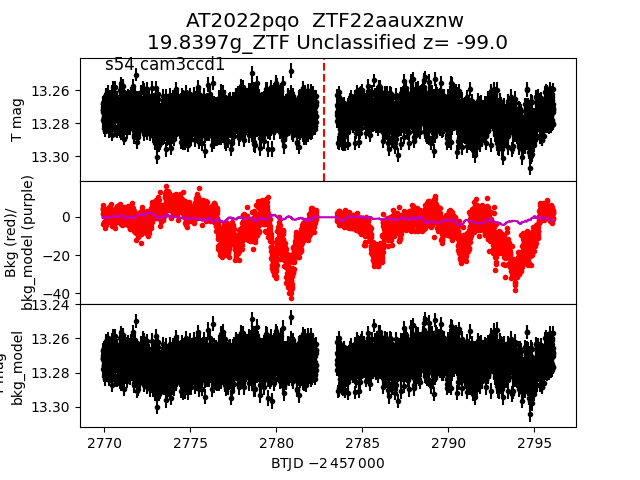
 2022pqo
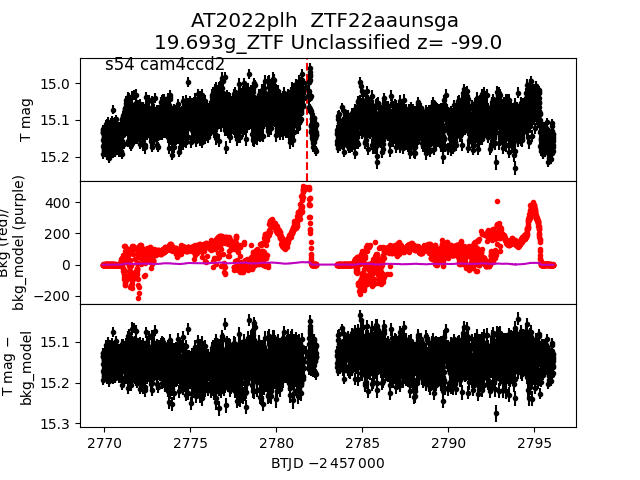
 2022plh
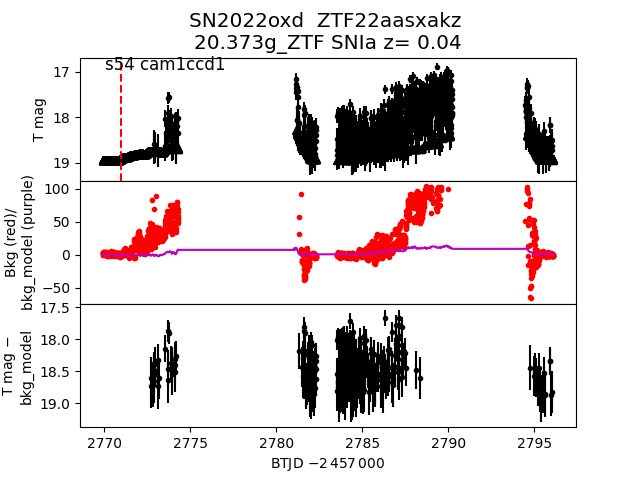
 2022oxd
 2022phu
 2022qzx
 2022qlo
 2022qal
 2022qia
 2022prd
 2022qhm
 2022pjr
 2022pzv
 2022pka
 2022owc
 2022pkb
 2022qse
 2022qib
 2022oqo
 2022orr
 2022puq
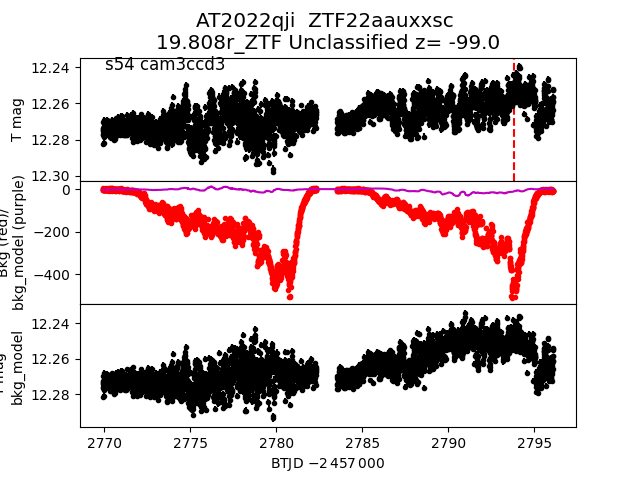
 2022qji
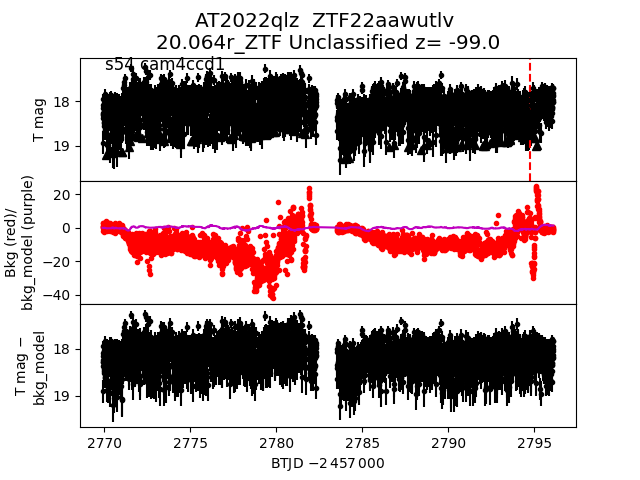
 2022qlz
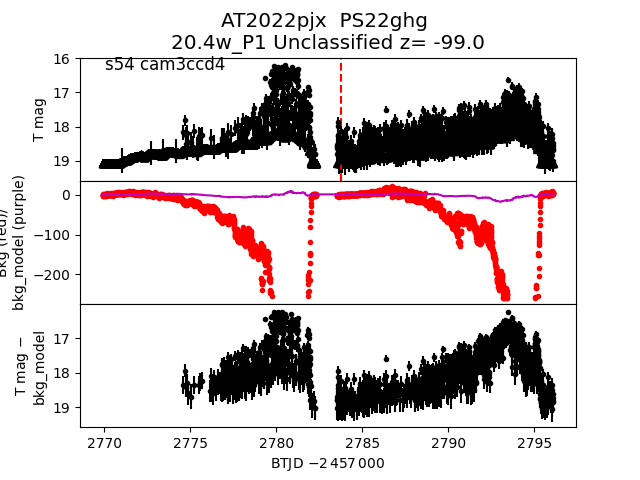
 2022pjx
 2022qpq
 2022osh
 2022qox
 2022qdh
 2022pam
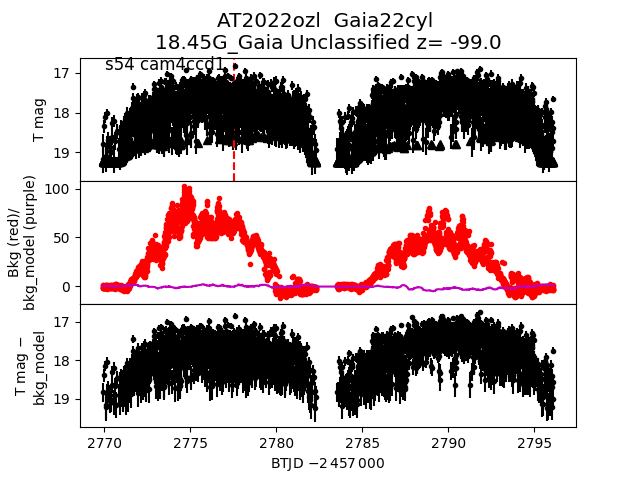
 2022ozl
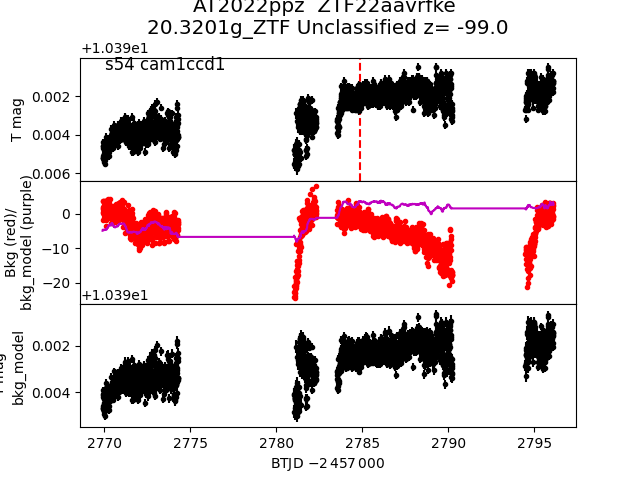
 2022ppz
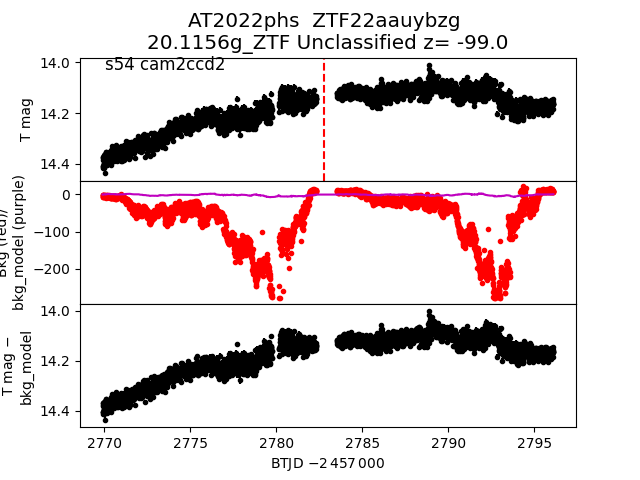
 2022phs
 2022qjl
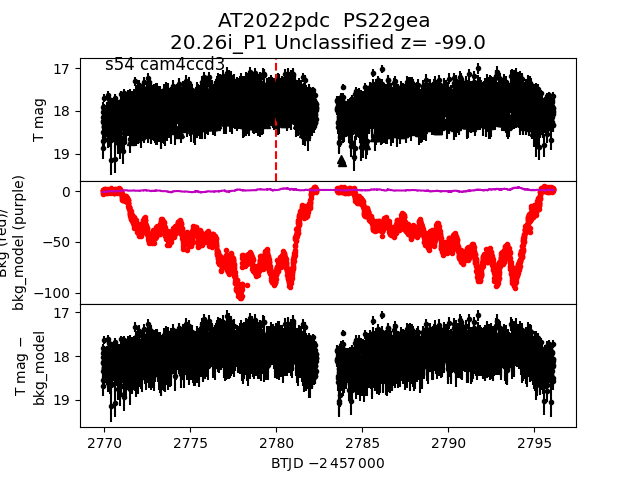
 2022pdc
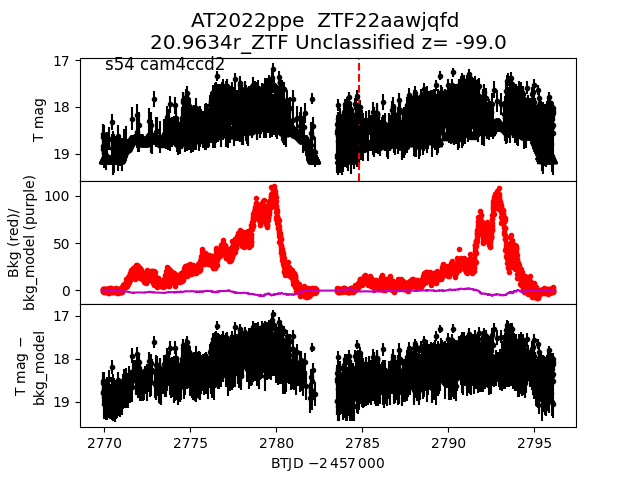
 2022ppe
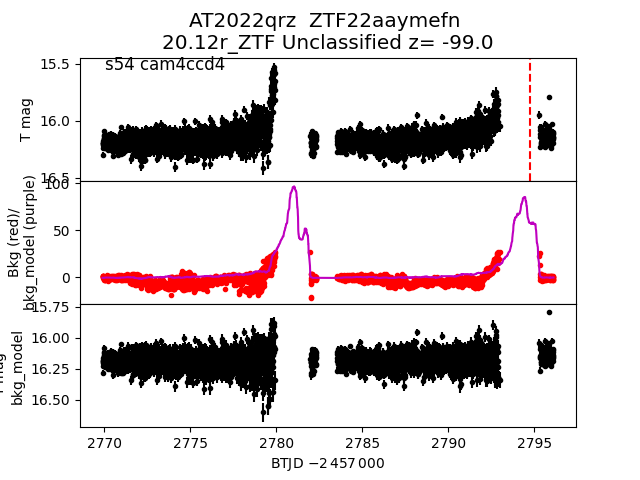
 2022qrz
 2022qjs
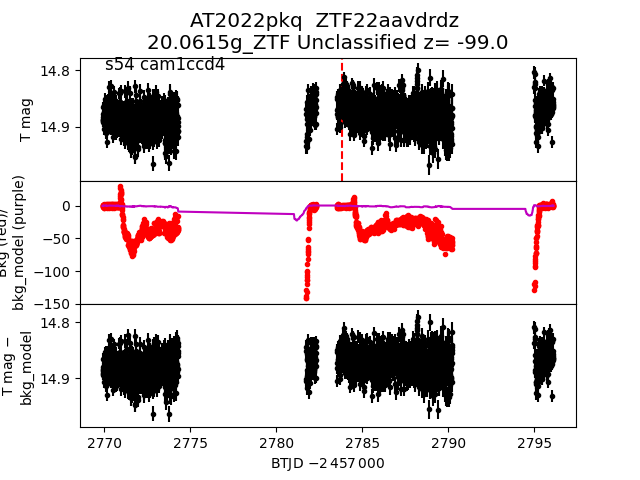
 2022pkq
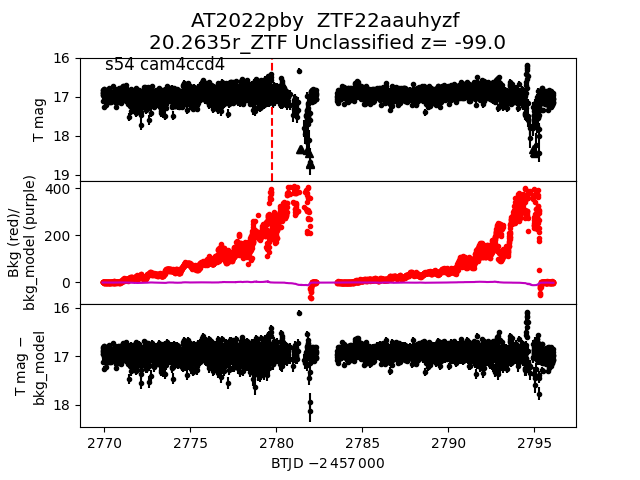
 2022pby
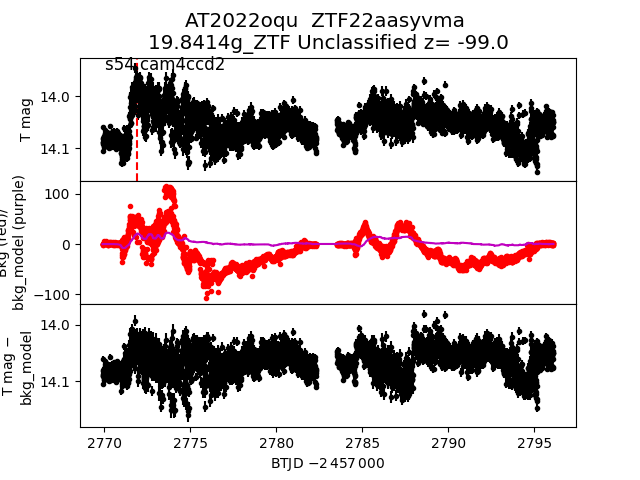
 2022oqu
 2022rgc
 2022qxo
 2022ppl