all transients in sector53 (115 total)
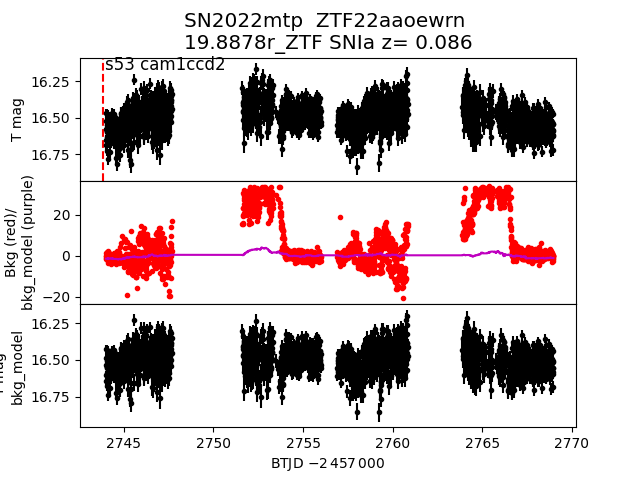
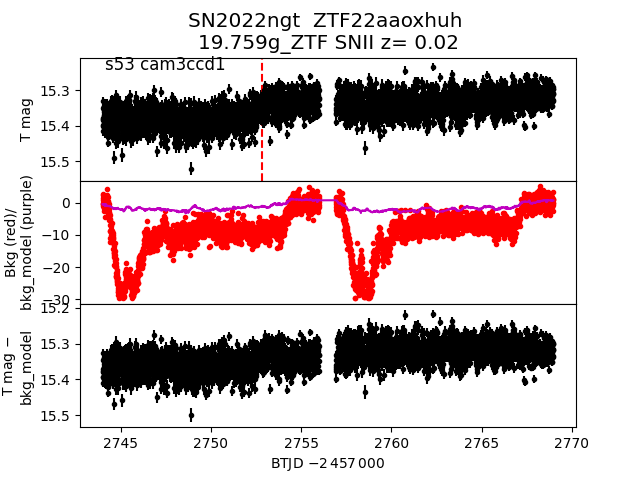
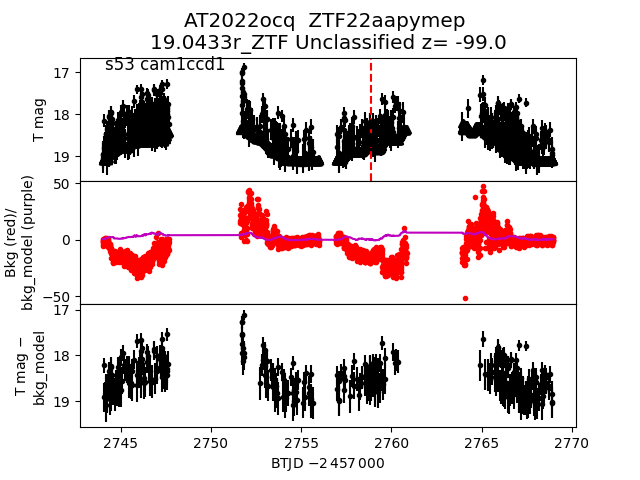
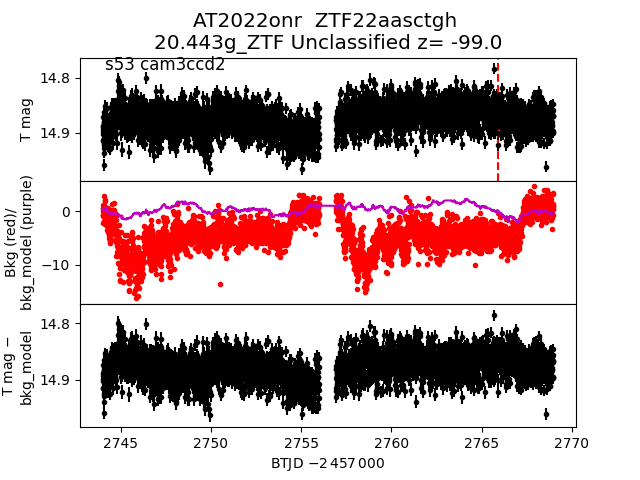
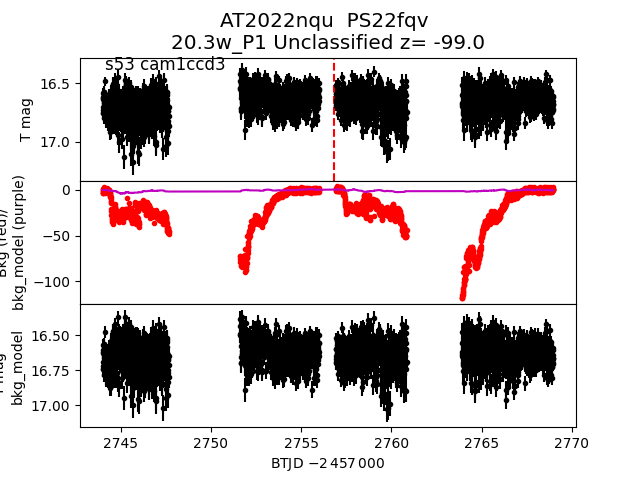
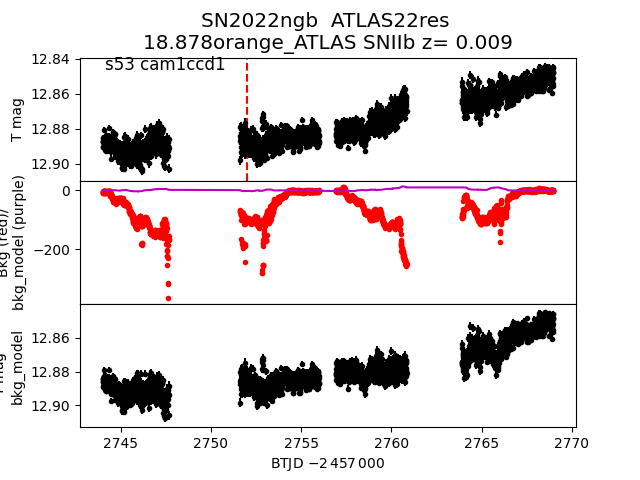
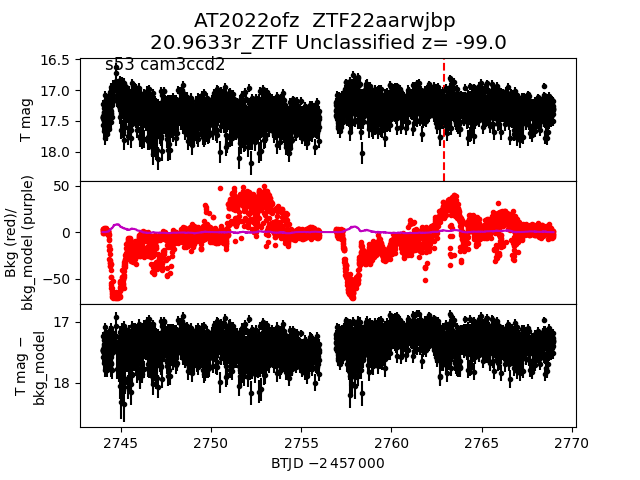
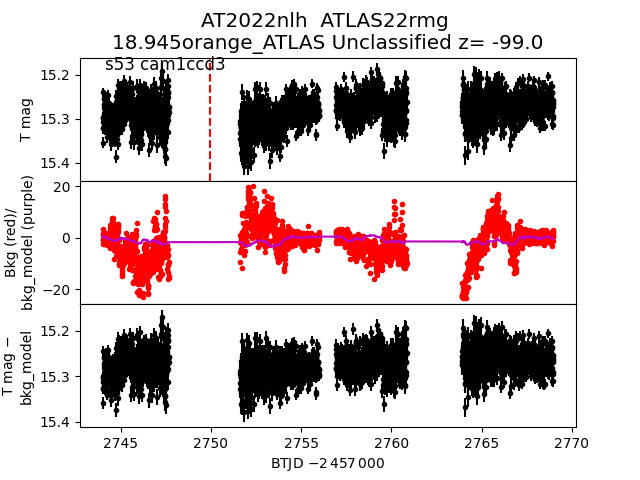
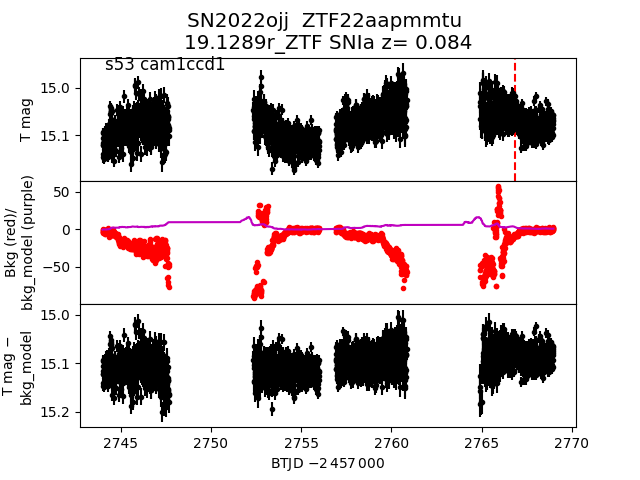
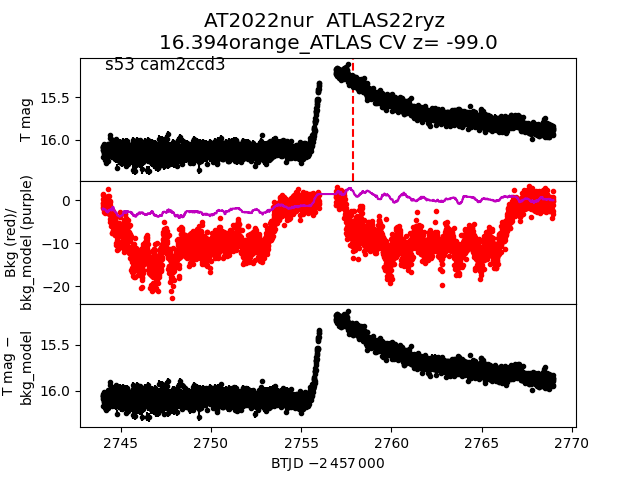
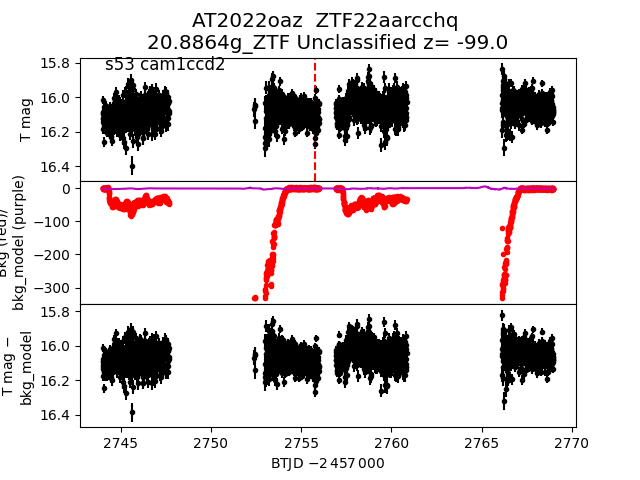
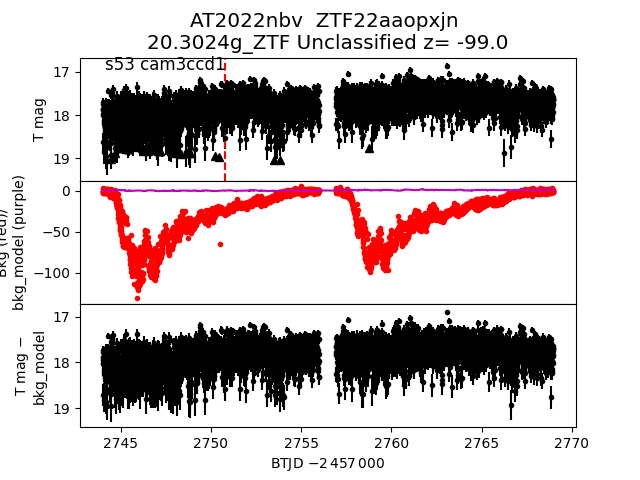
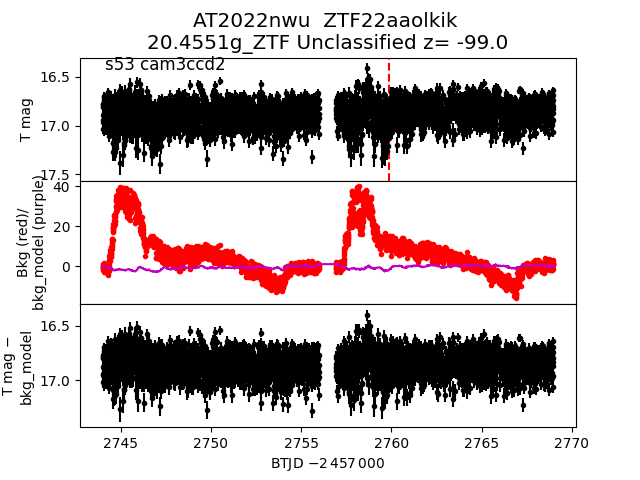
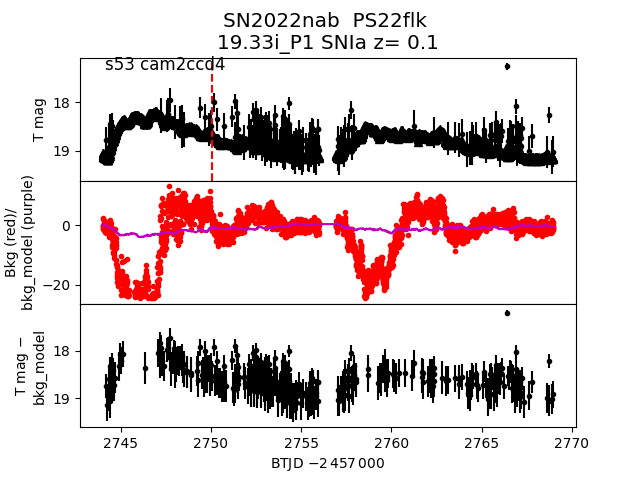
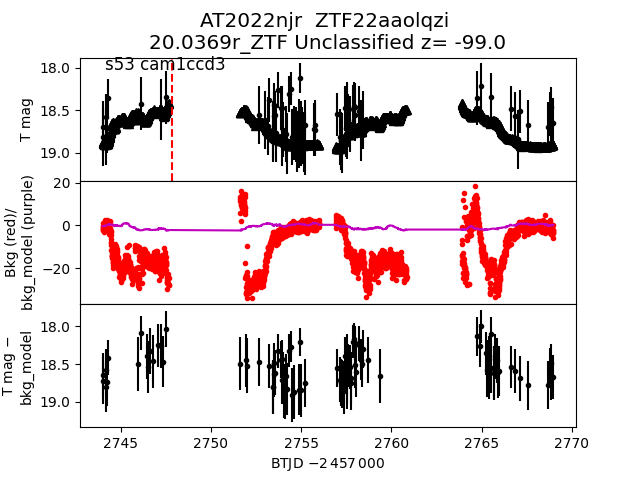
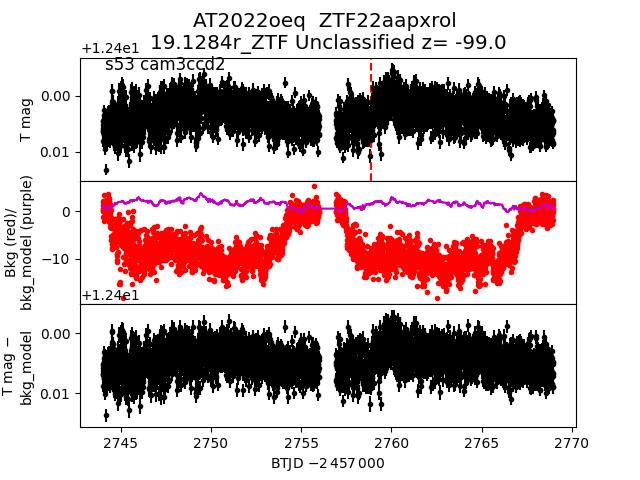
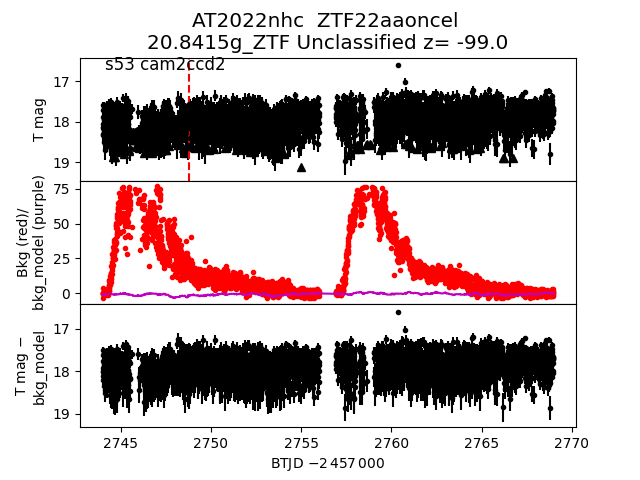
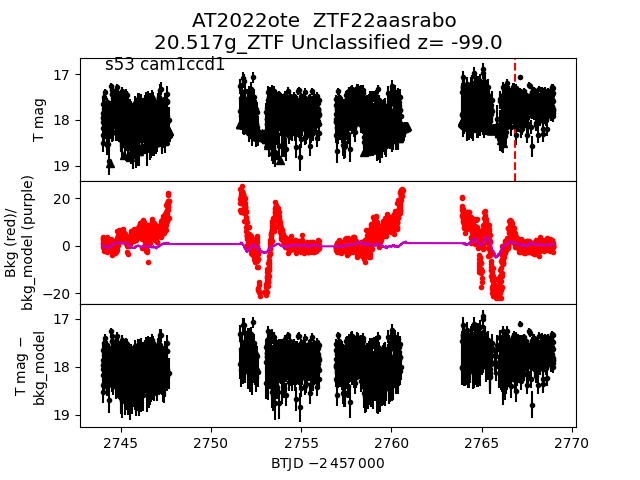
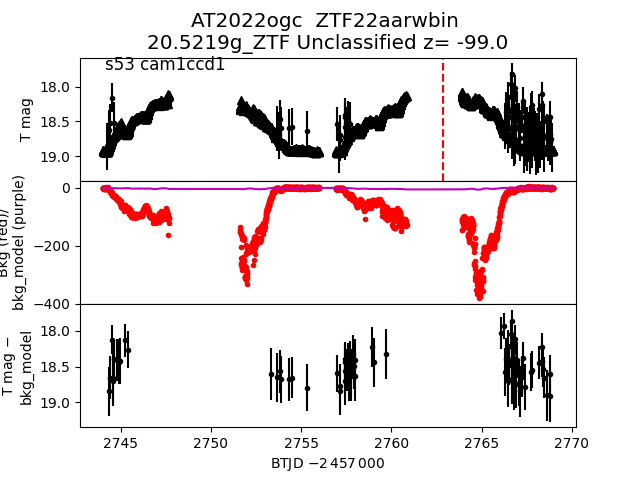
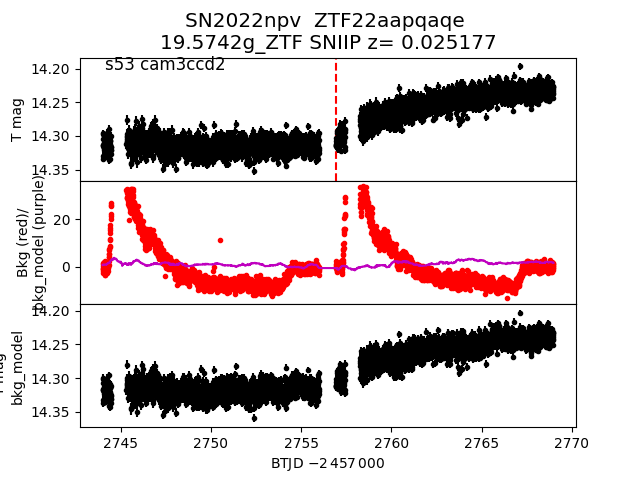
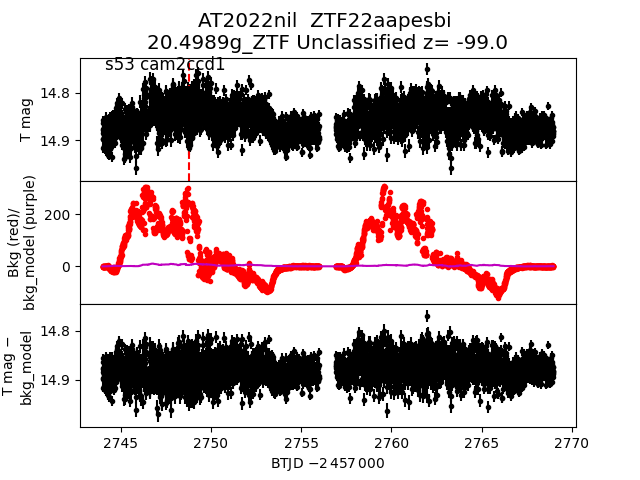
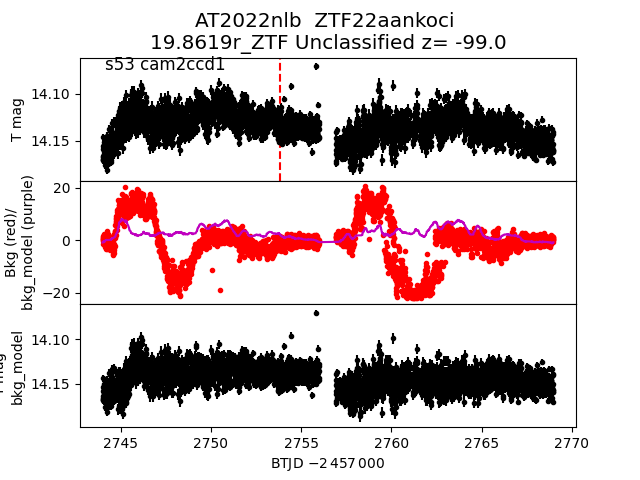
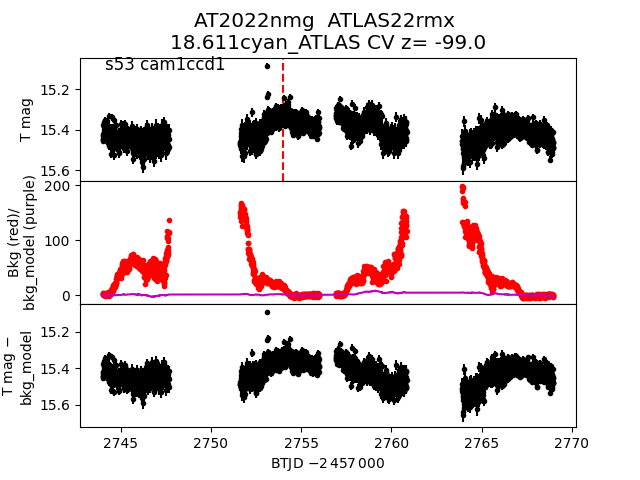
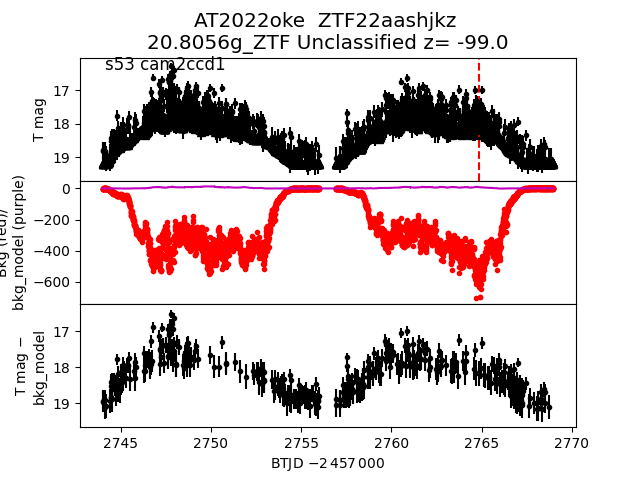
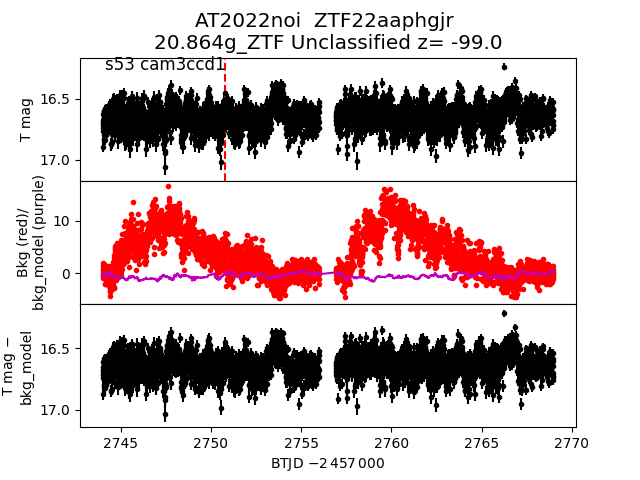
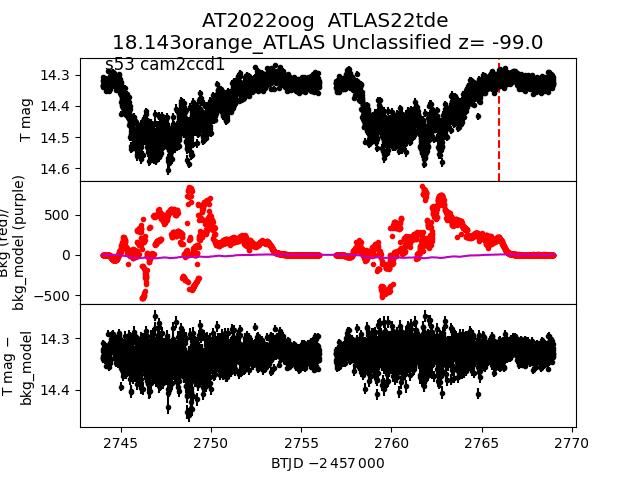
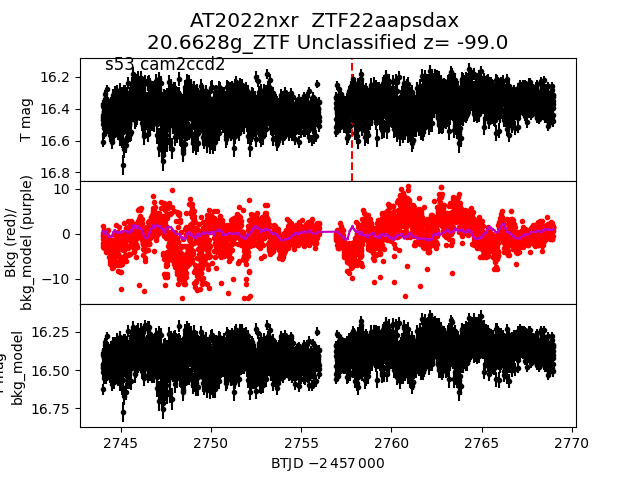
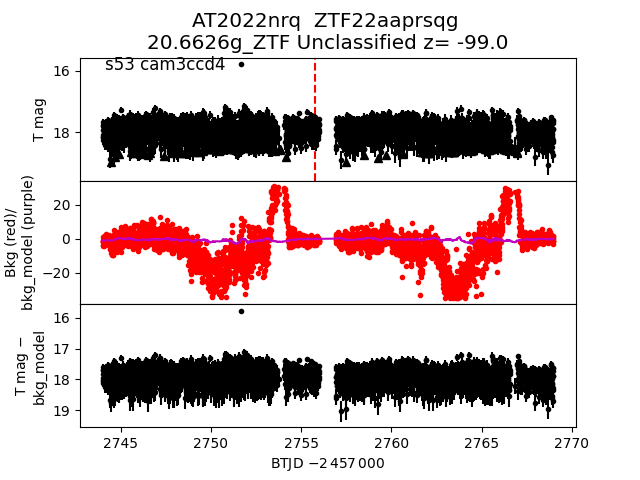
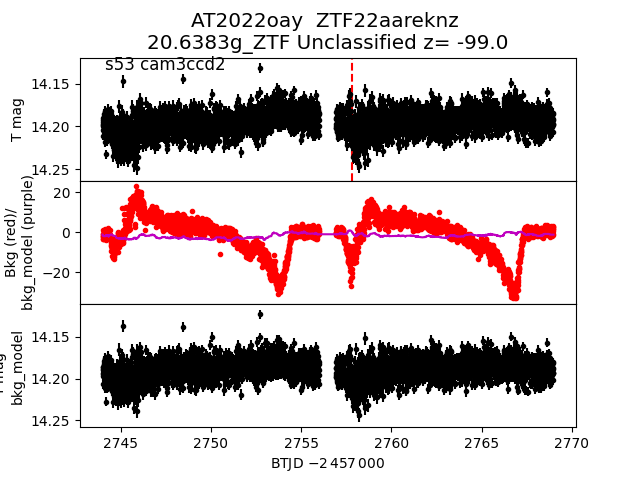
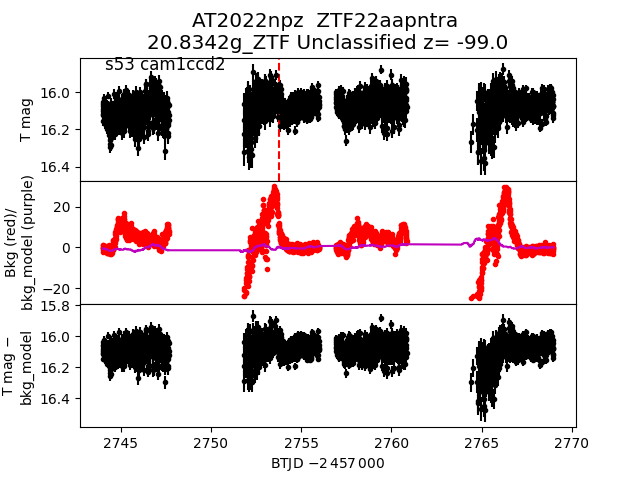
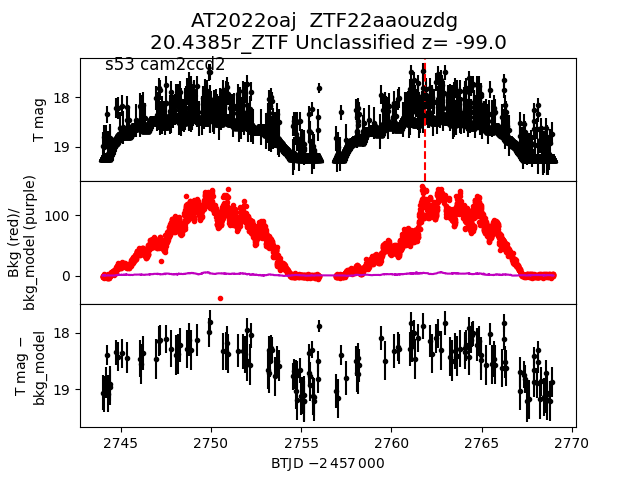
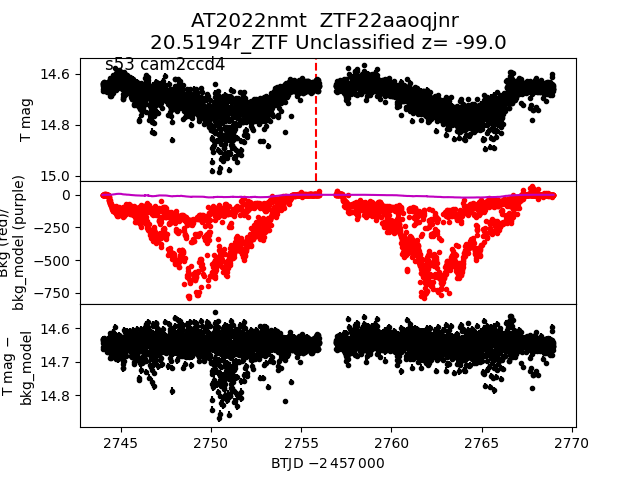
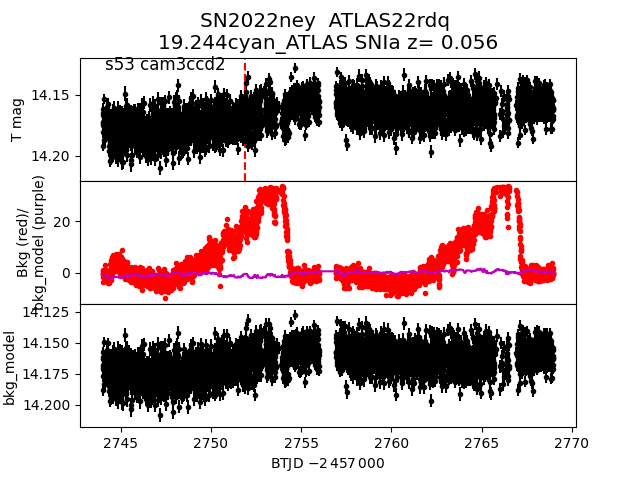
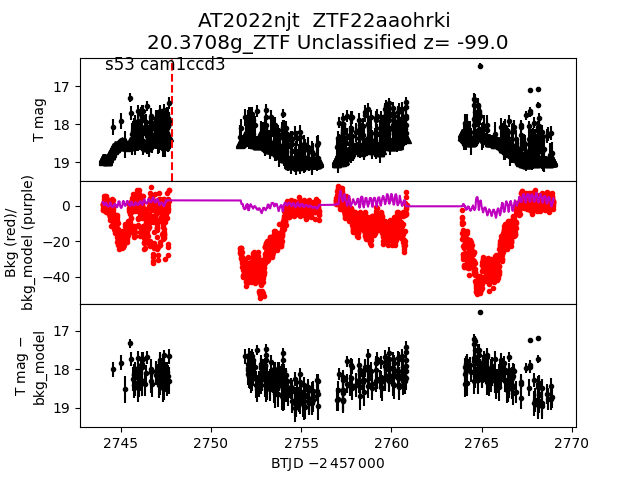
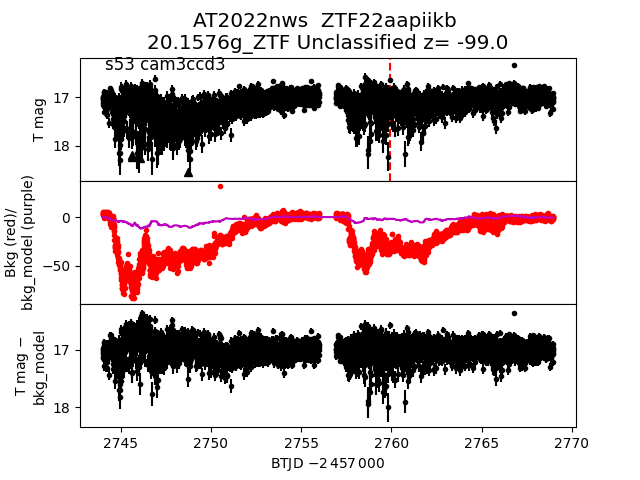
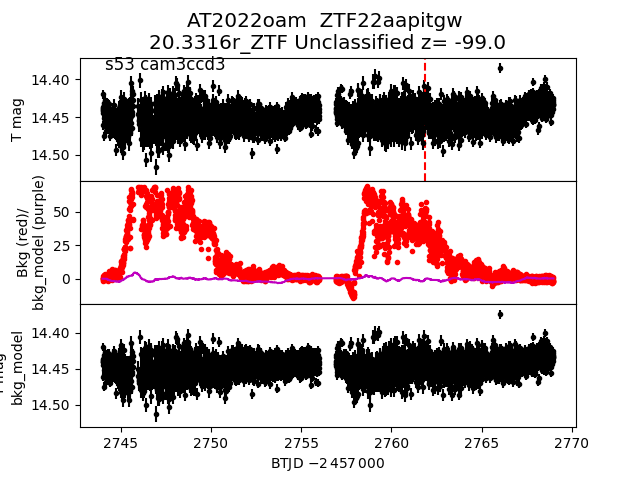
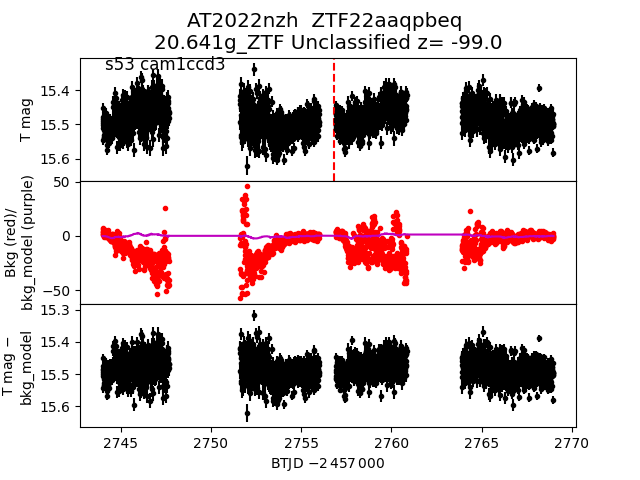
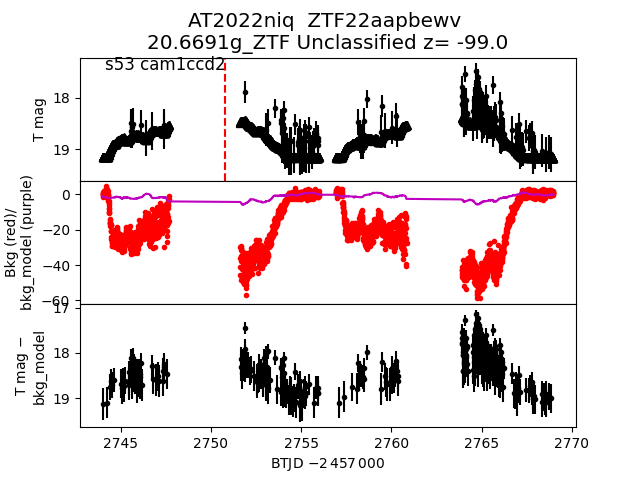
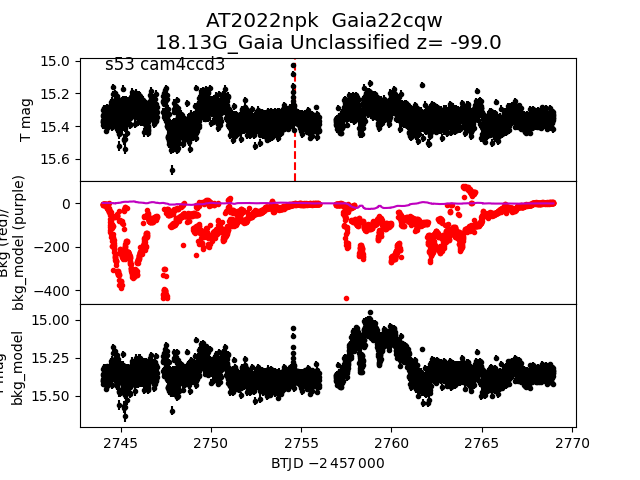
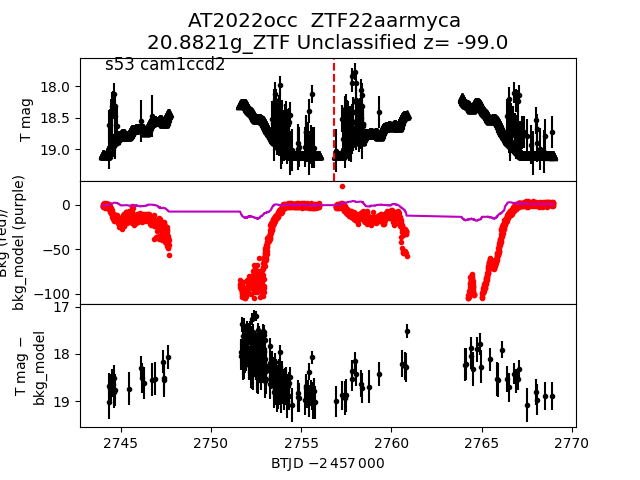
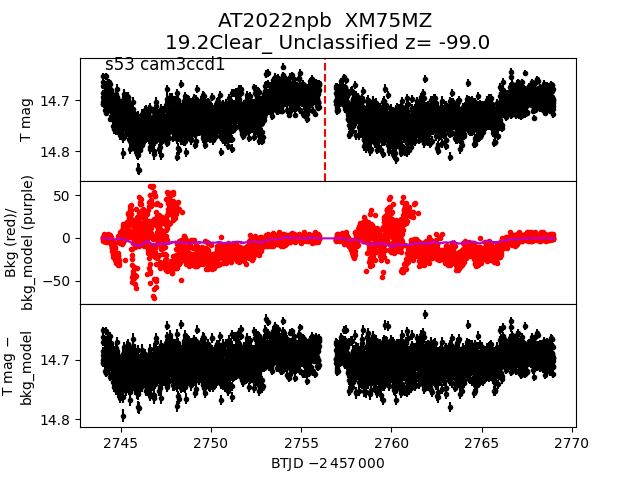
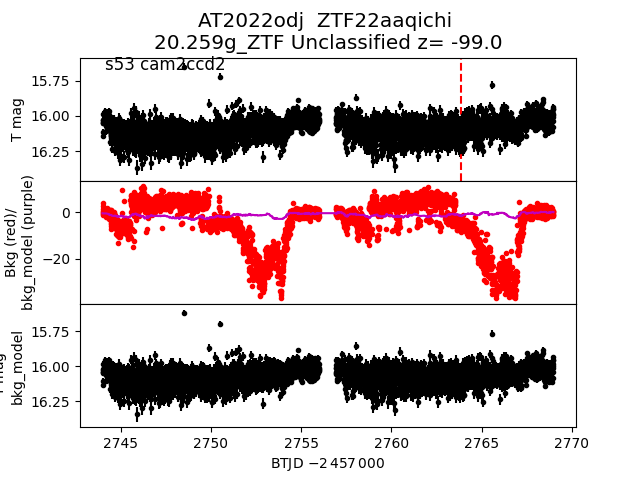
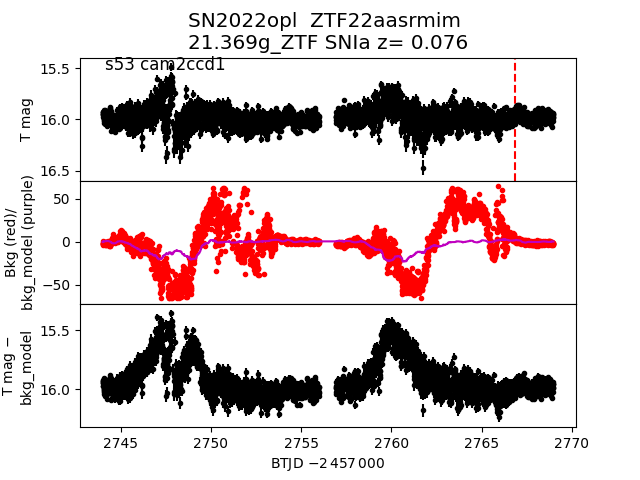
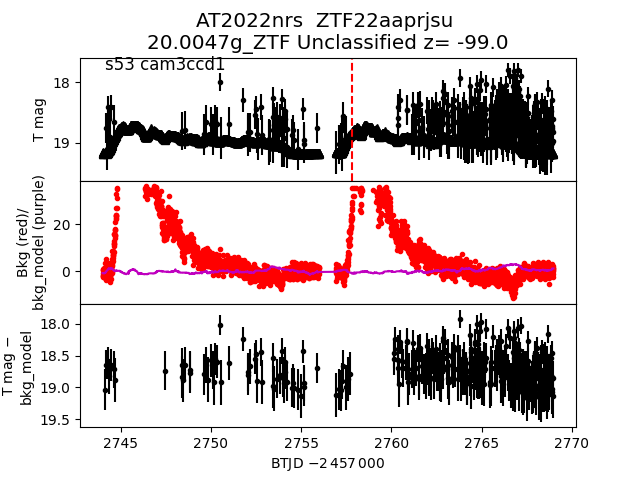
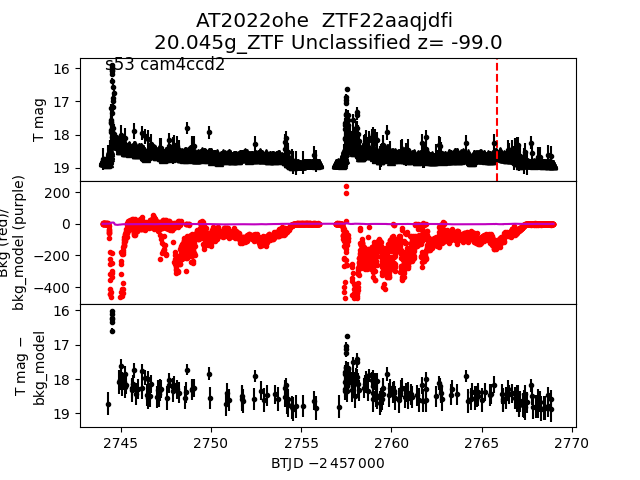
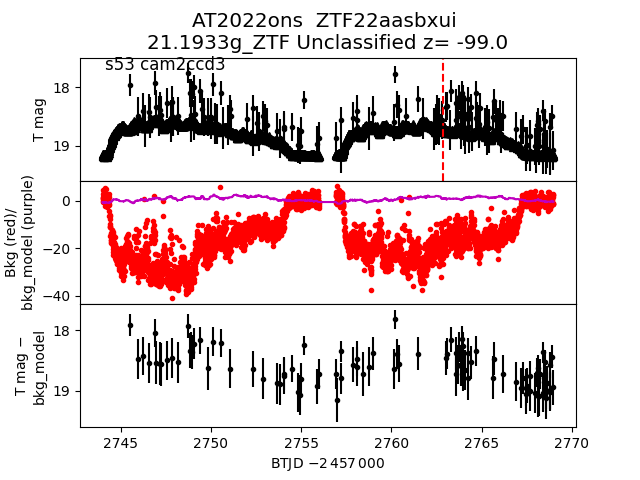
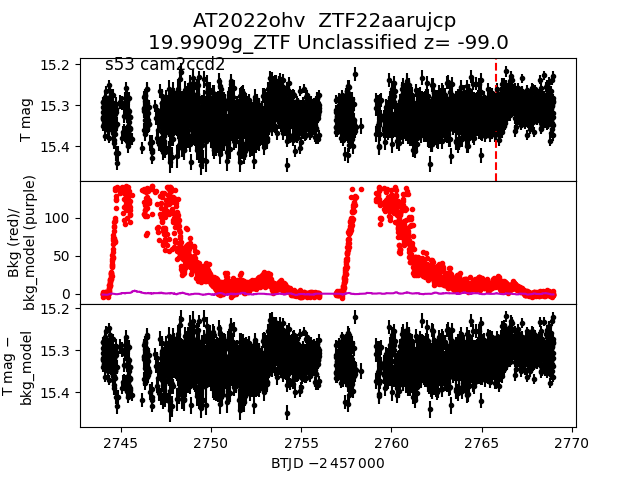
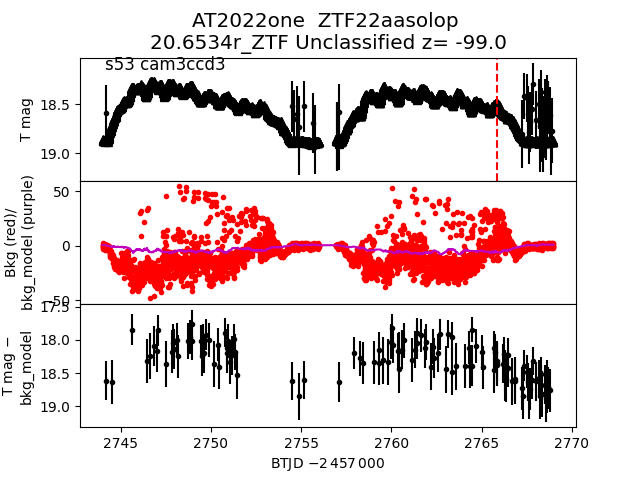
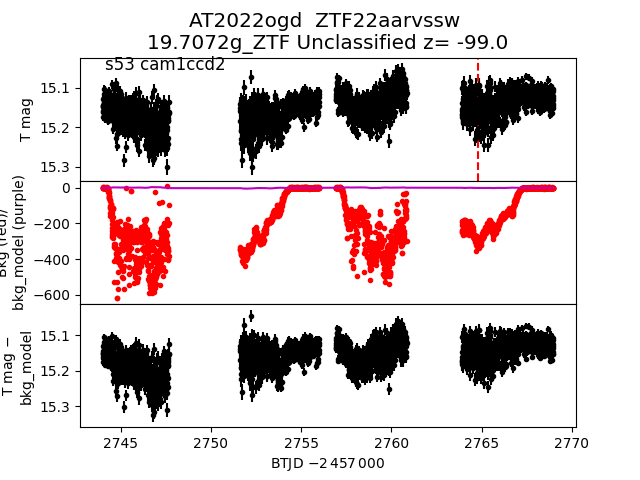
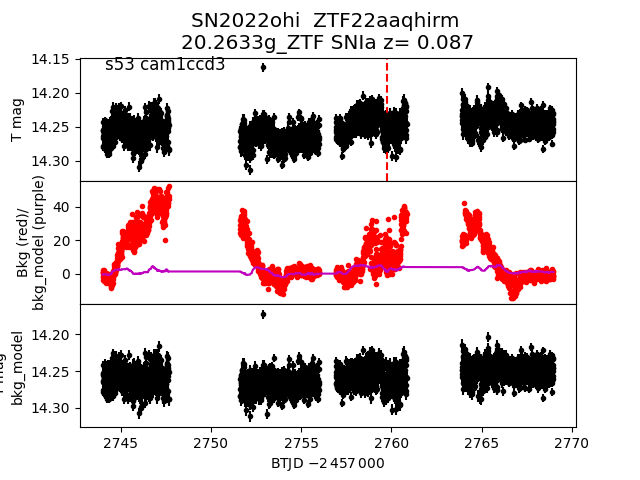
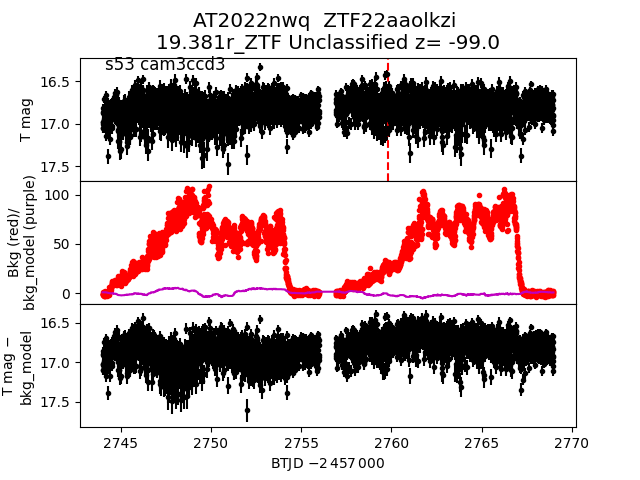
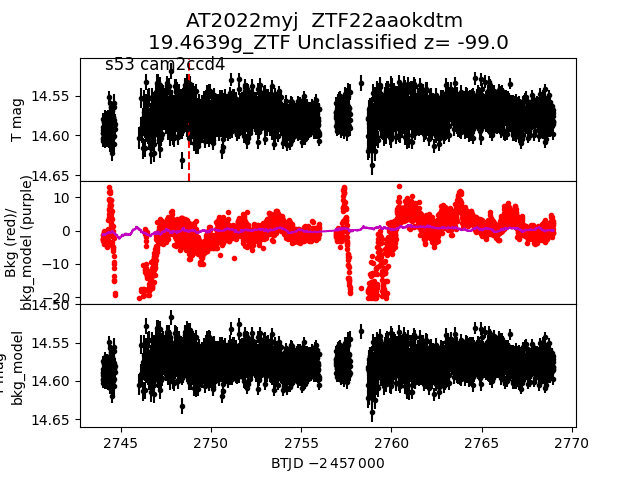
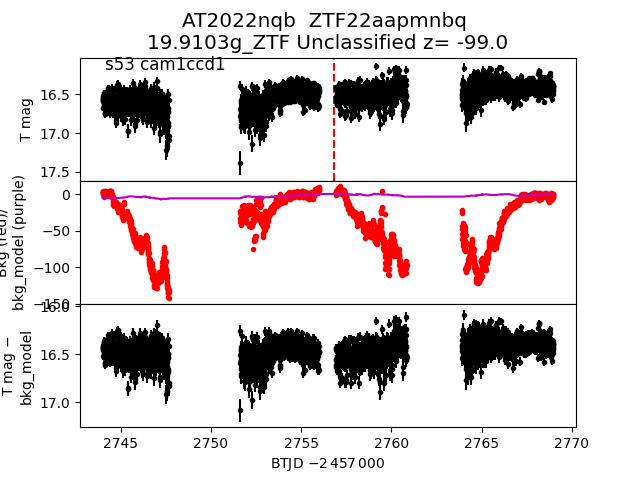
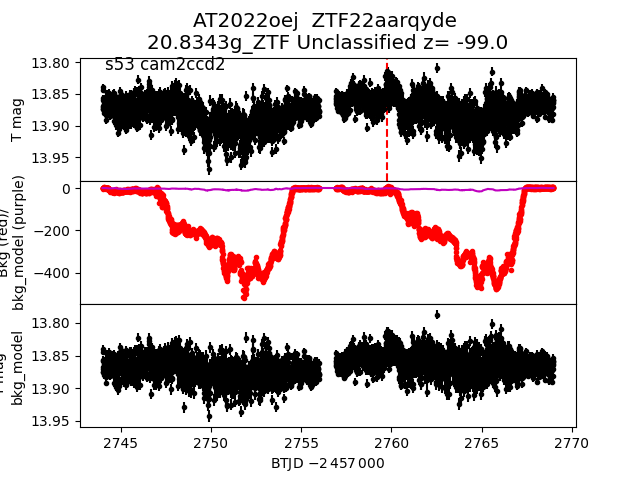
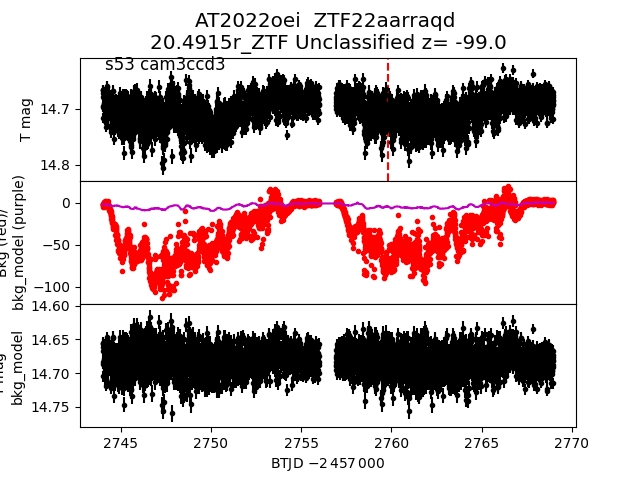
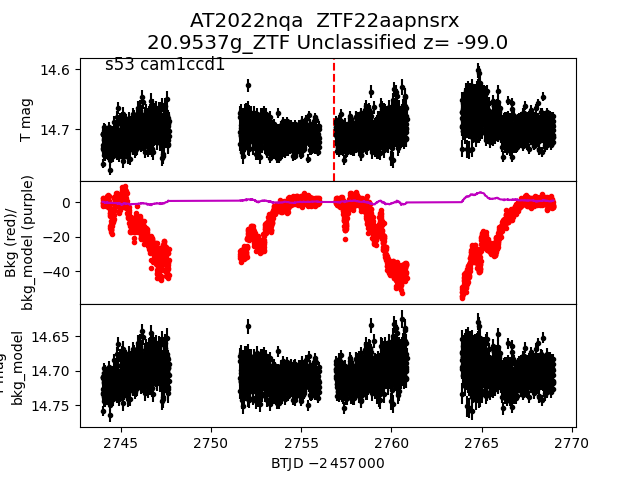
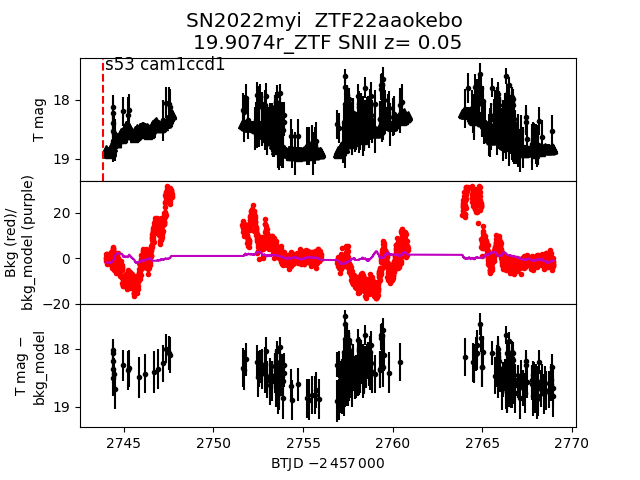
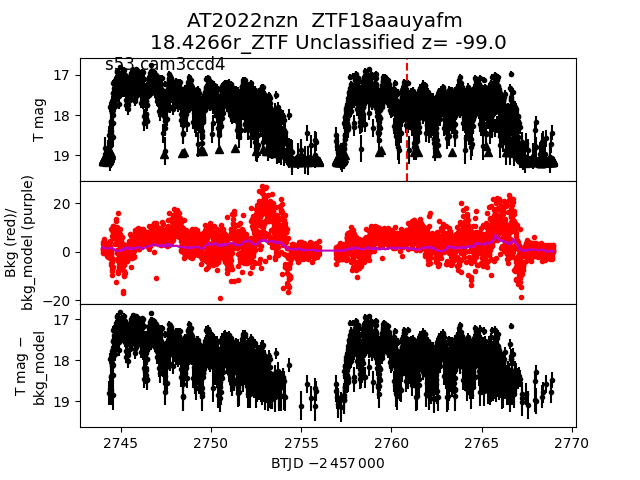
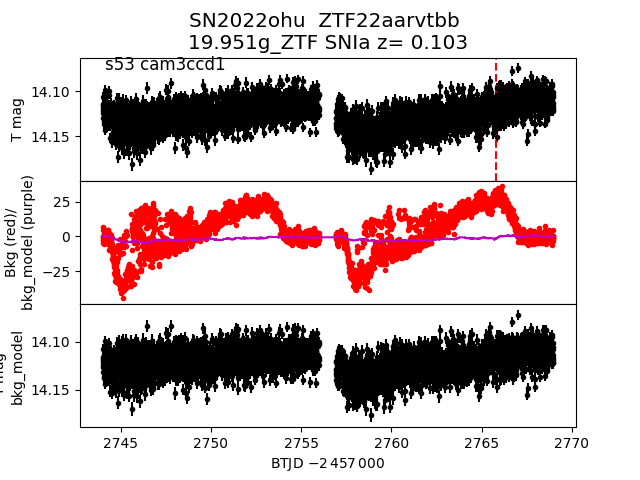
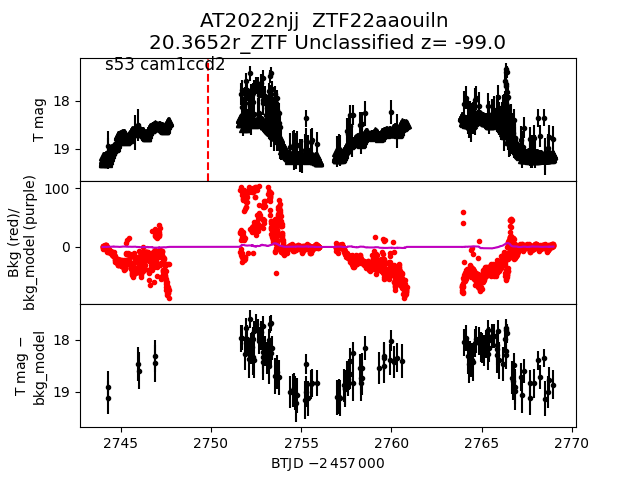
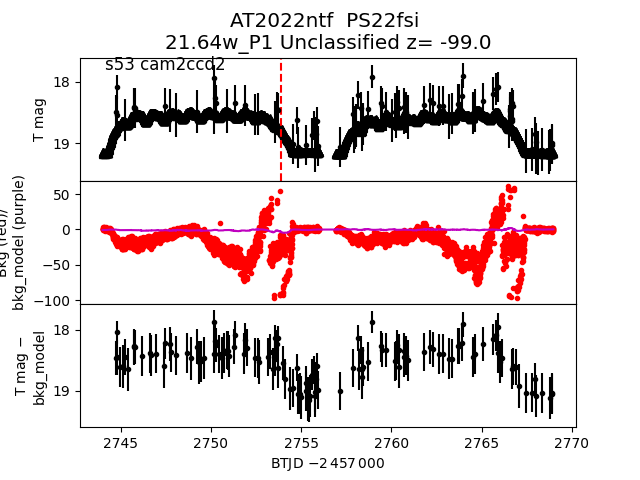
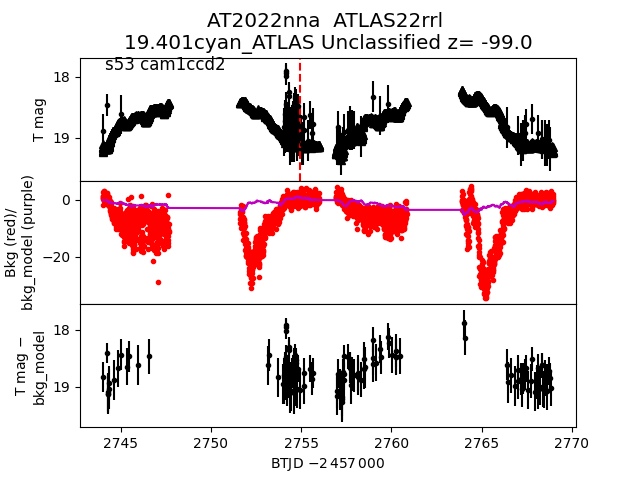
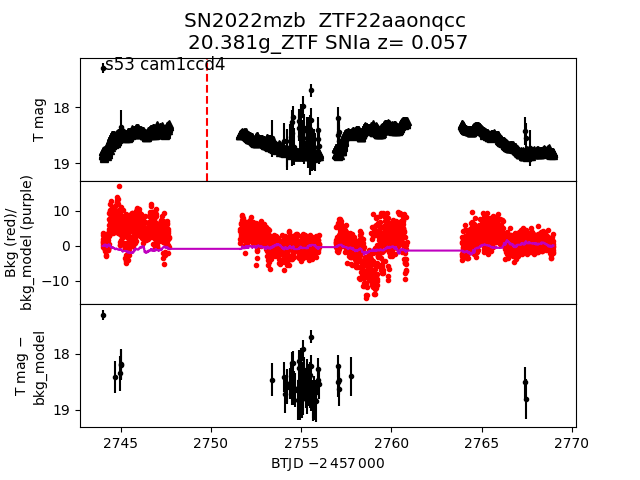
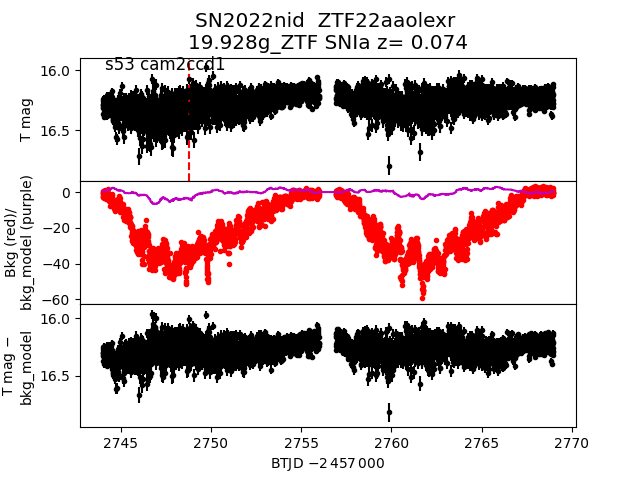
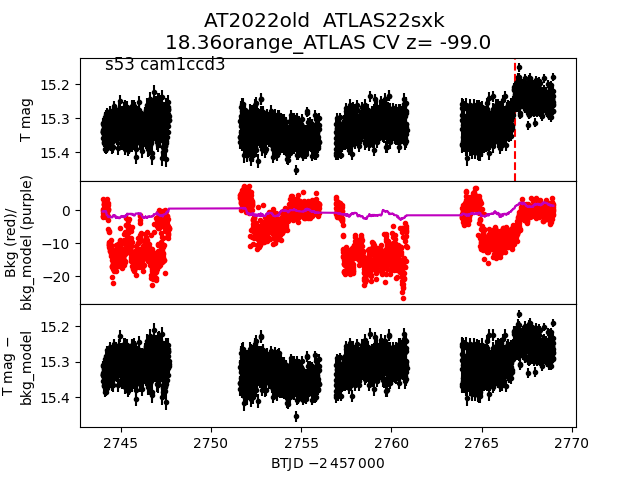
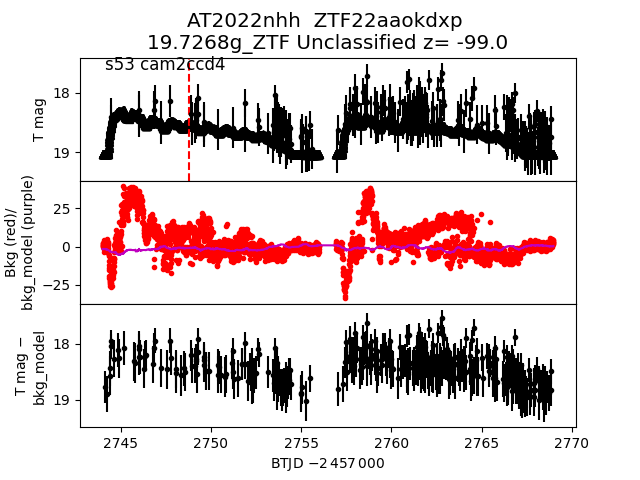
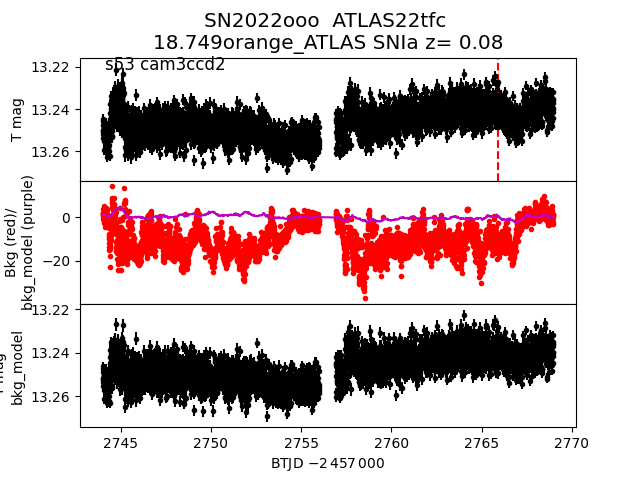
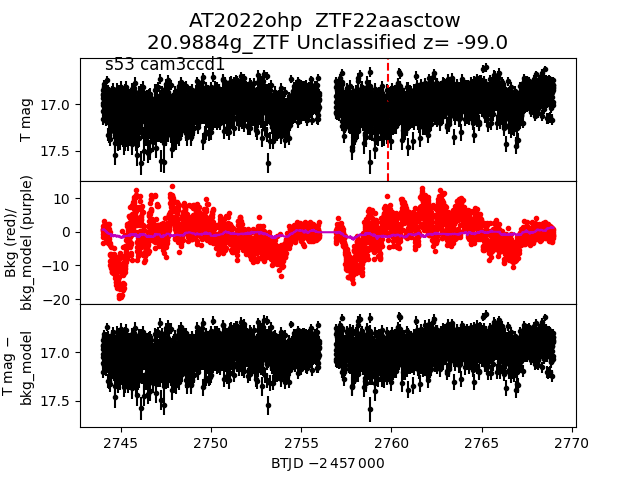
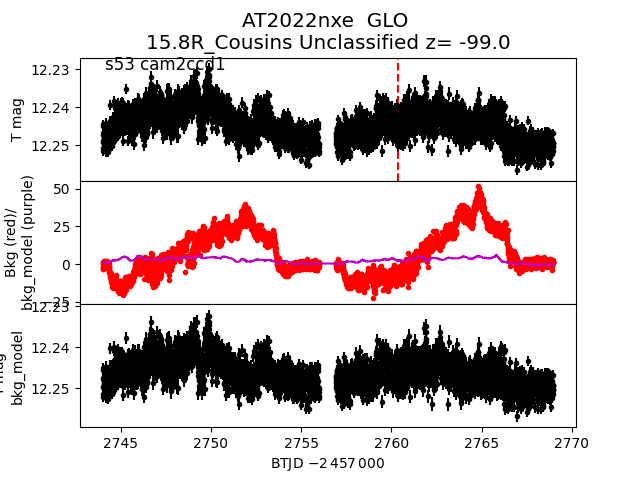
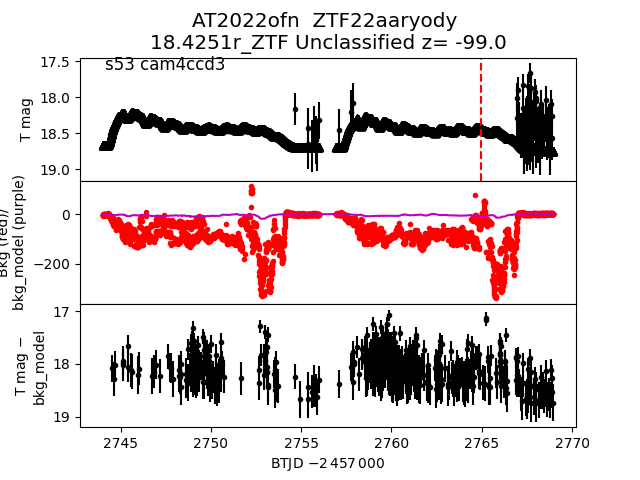
Each figure has three panels. The top panel shows the transient light curve, the middle panel shows the local background (estimated in an annulus), and the bottom panel shows a "background-model corrected" light curve. Details about the background model are in the README.
The vertical red line marks the time of discovery reported to TNS. Other useful metadata from TNS is in the figure title.
Note that the top and bottom panel are in magnitudes, while the middle panel is in differential flux units. The magnitudes are calibrated to the flux in the reference image used for image subtraction. Thus, flux from the host galaxy is included in these magnitudes.
3-sigma upper limits are plotted as triangles with no errorbars. A typical limiting magnitude is 19.6 in 30 minutes or 18.4 in 200 seconds (for low backgrounds).
The links allow you to download the light curve data as a text file.
More details in the README.
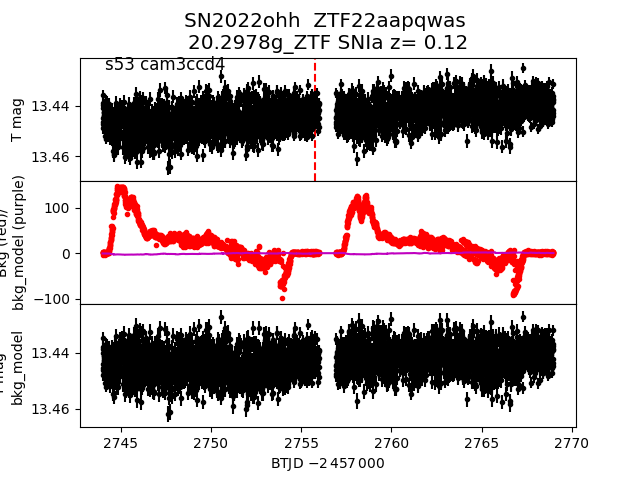
2022ohh
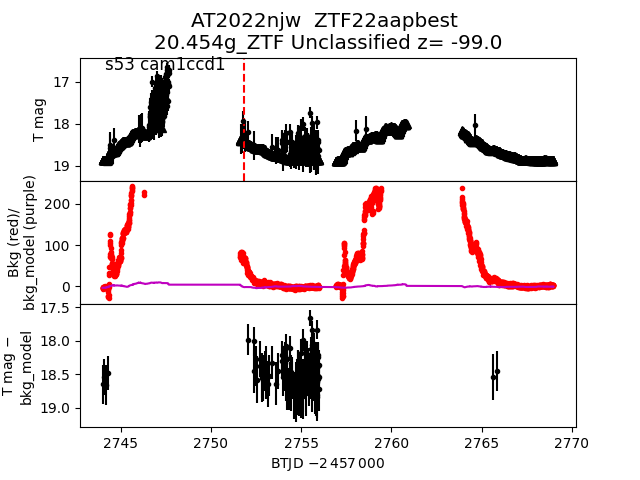
 2022njw
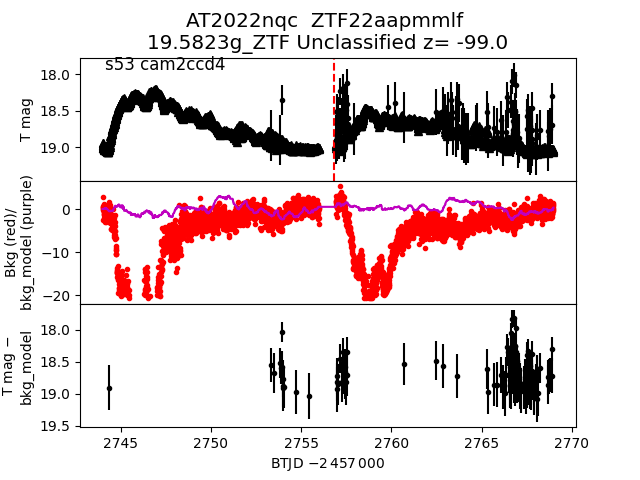
 2022nqc
 2022ngt
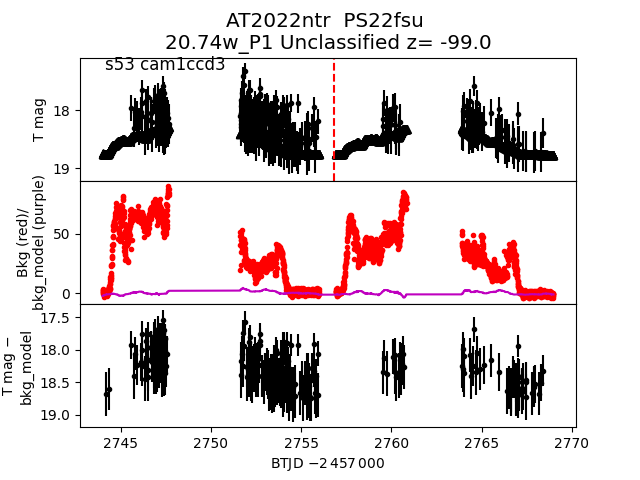
 2022ntr
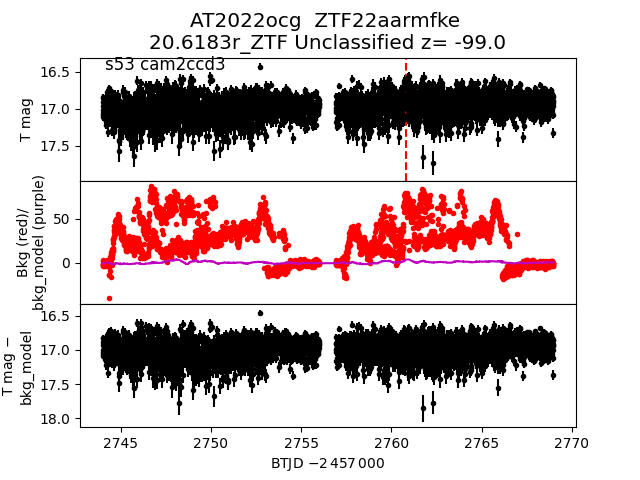
 2022ocg
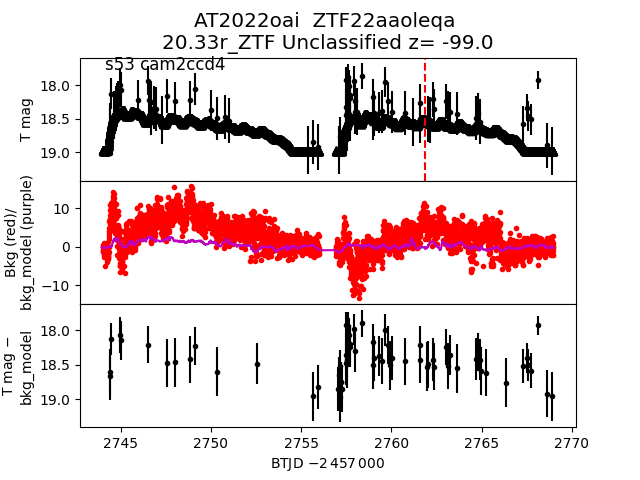
 2022oai
 2022ocq
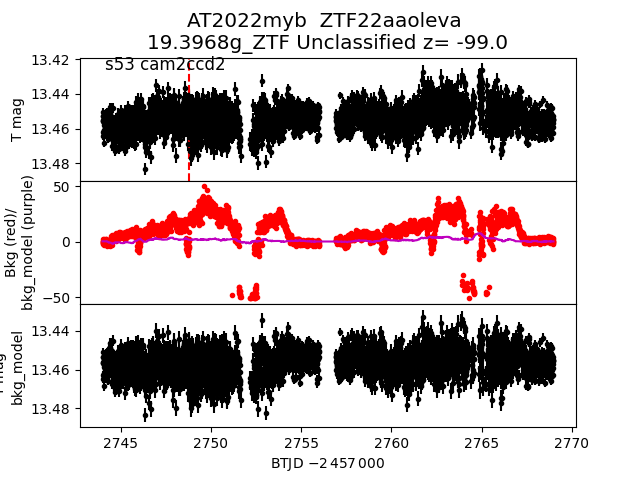
 2022myb
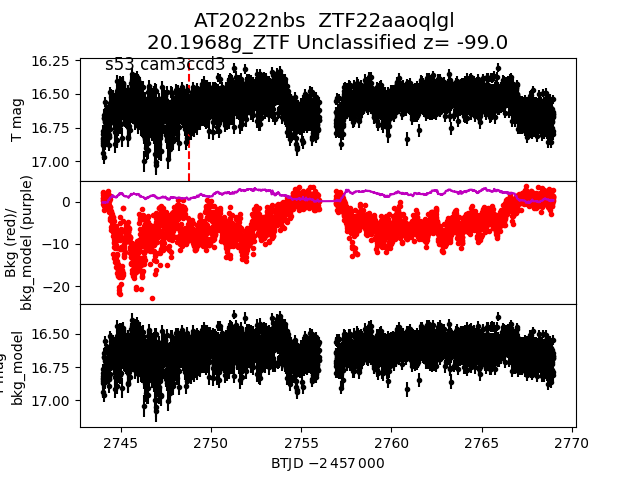
 2022nbs
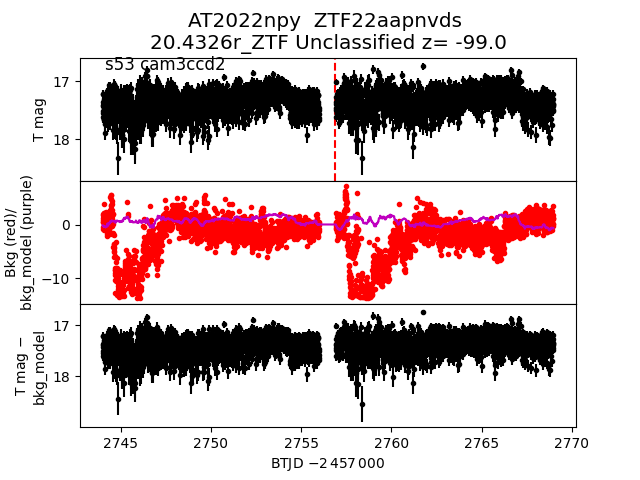
 2022npy
 2022onr
 2022nqu
 2022ngb
 2022ofz
 2022nlh
 2022ojj
 2022nur
 2022oaz
 2022nbv
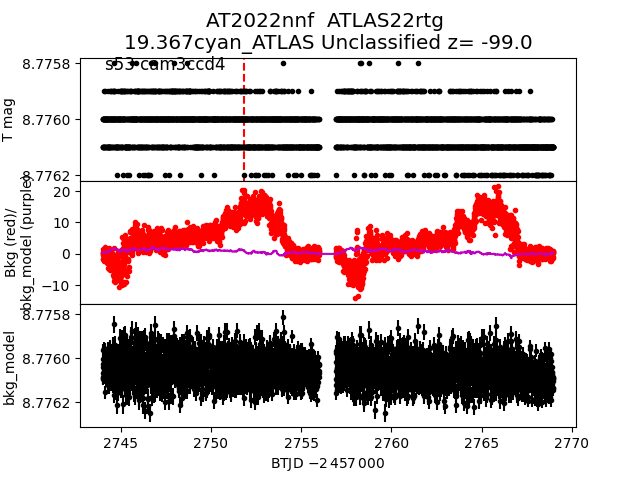
 2022nnf
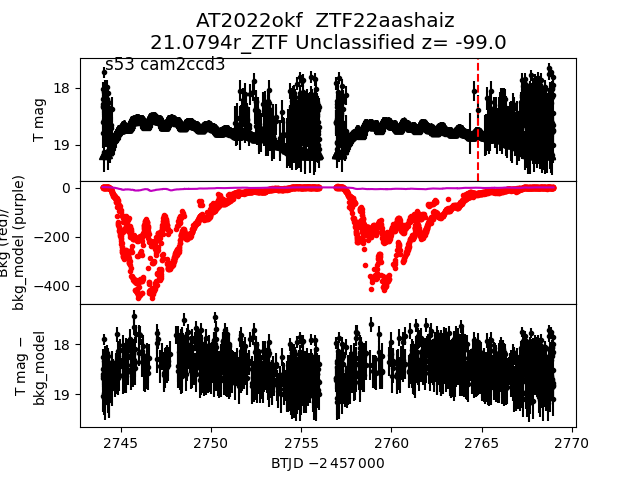
 2022okf
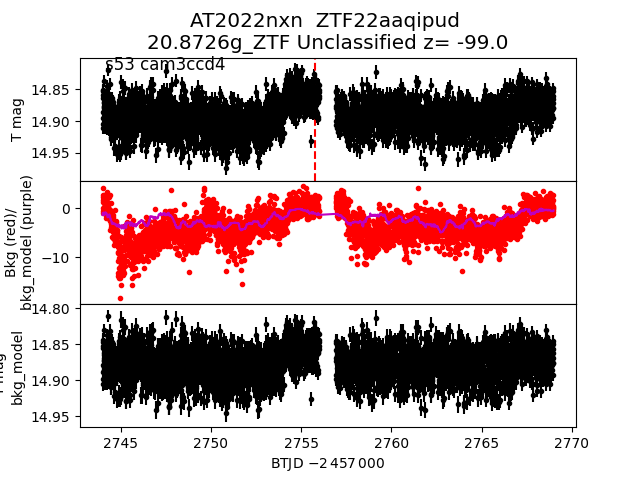
 2022nxn
 2022nwu
 2022nab
 2022njr
 2022oeq
 2022nhc
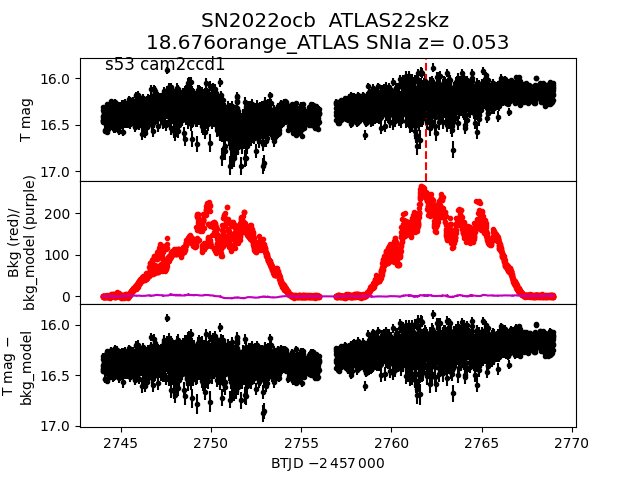
 2022ocb
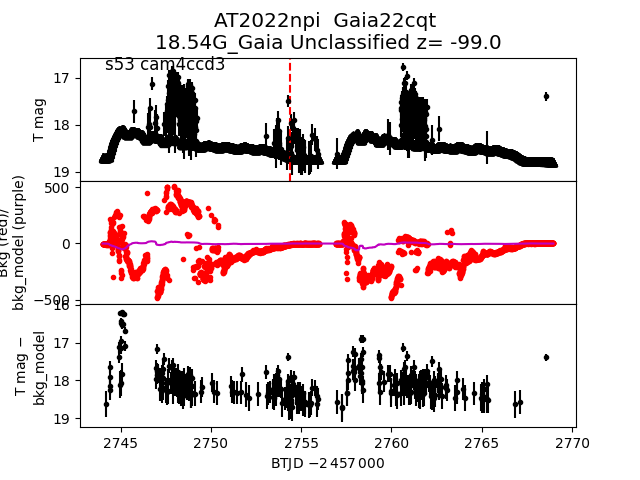
 2022npi
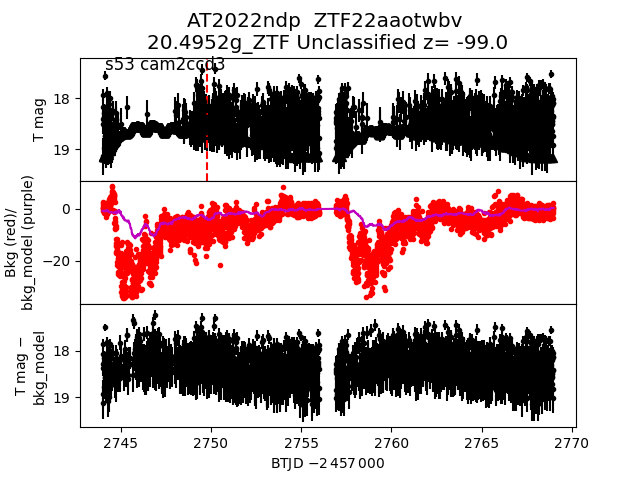
 2022ndp
 2022ote
 2022ogc
 2022npv
 2022nil
 2022nlb
 2022nmg
 2022oke
 2022noi
 2022oog
 2022nxr
 2022nrq
 2022oay
 2022npz
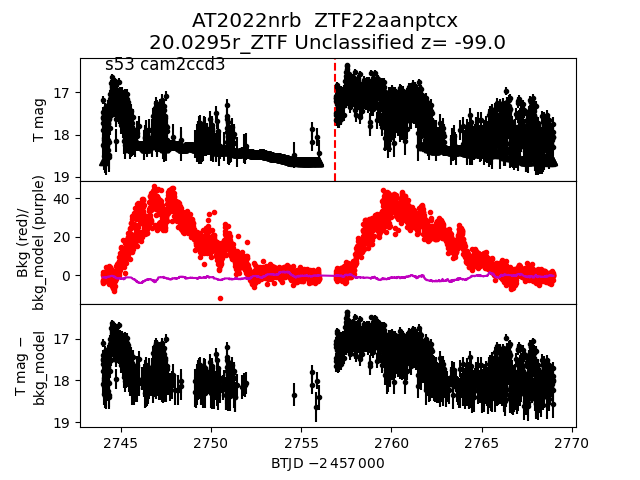
 2022nrb
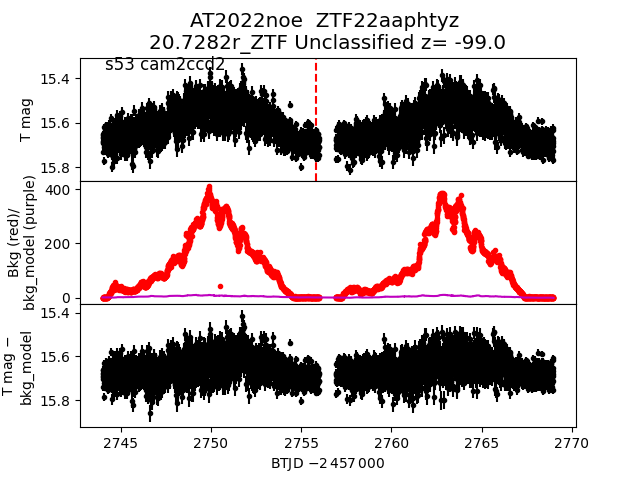
 2022noe
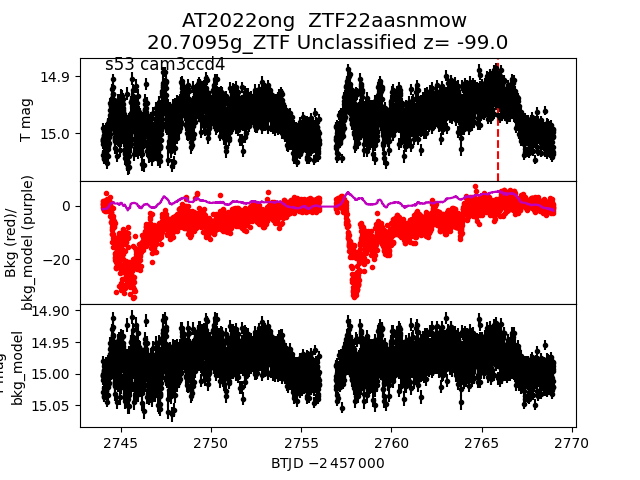
 2022ong
 2022oaj
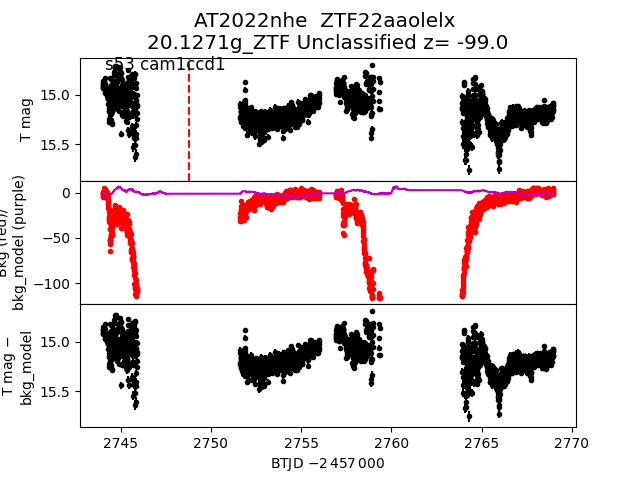
 2022nhe
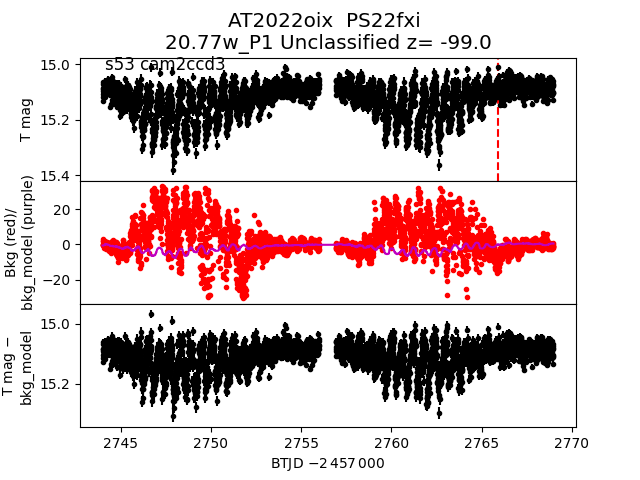
 2022oix
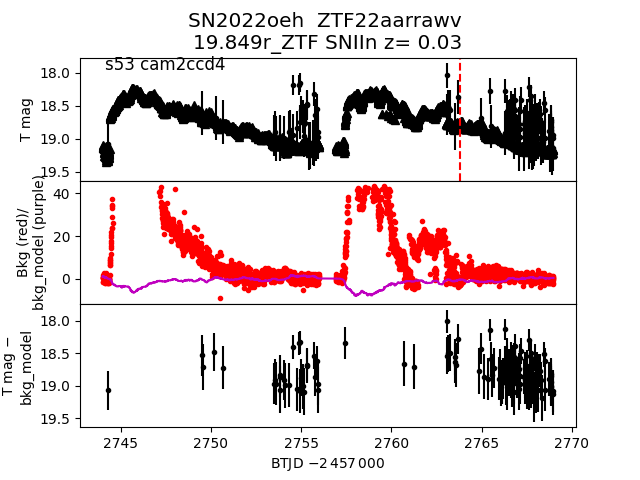
 2022oeh
 2022nmt
 2022ney
 2022njt
 2022nws
 2022oam
 2022nzh
 2022niq
 2022npk
 2022occ
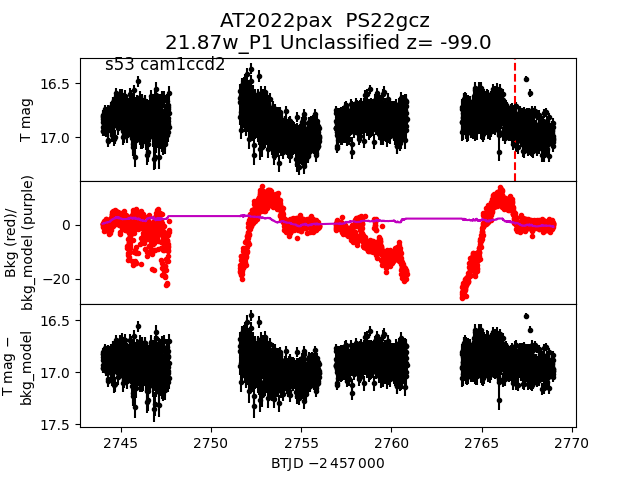
 2022pax
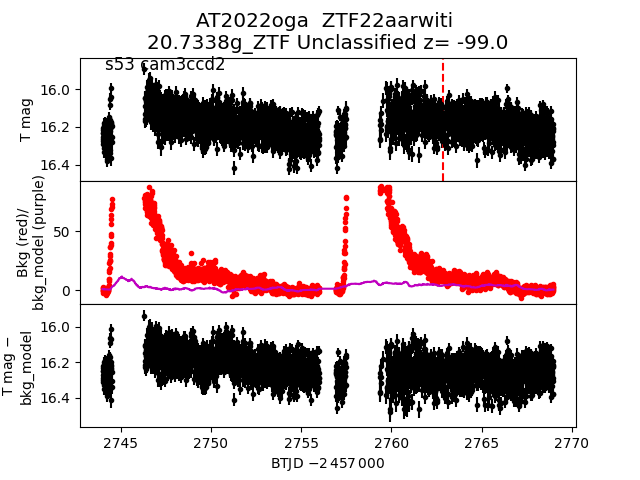
 2022oga
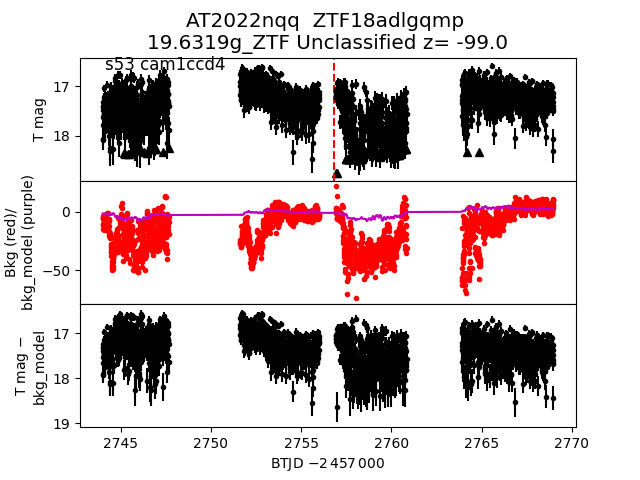
 2022nqq
 2022npb
 2022odj
 2022opl
 2022nrs
 2022ohe
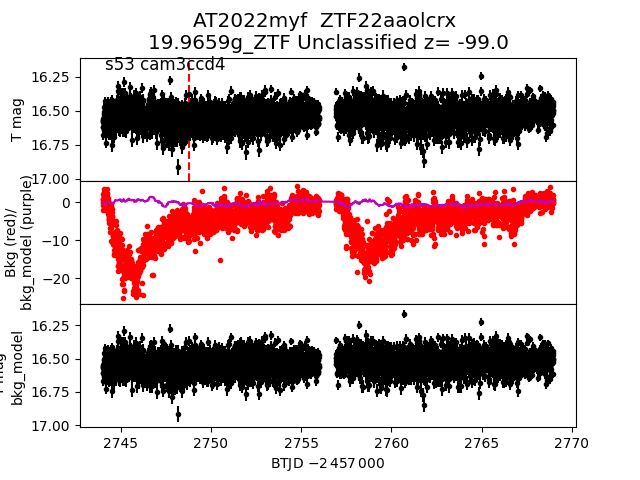
 2022myf
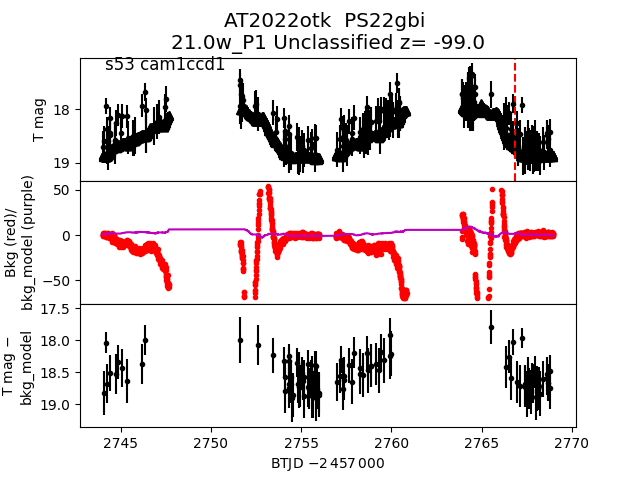
 2022otk
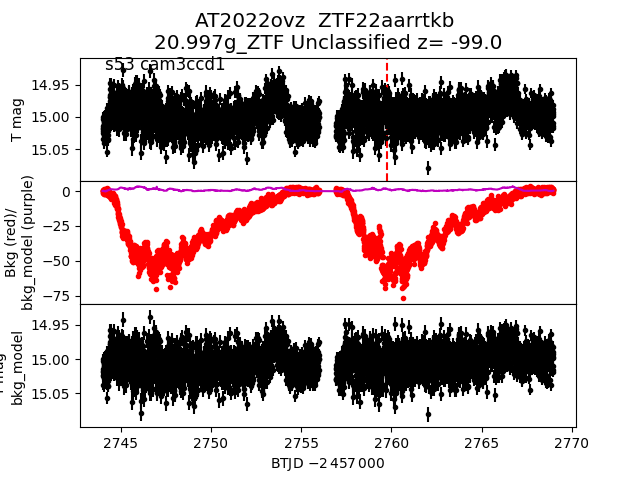
 2022ovz
 2022ons
 2022ohv
 2022one
 2022ogd
 2022ohi
 2022nwq
 2022myj
 2022nqb
 2022oej
 2022oei
 2022nqa
 2022myi
 2022nzn
 2022ohu
 2022njj
 2022ntf
 2022nna
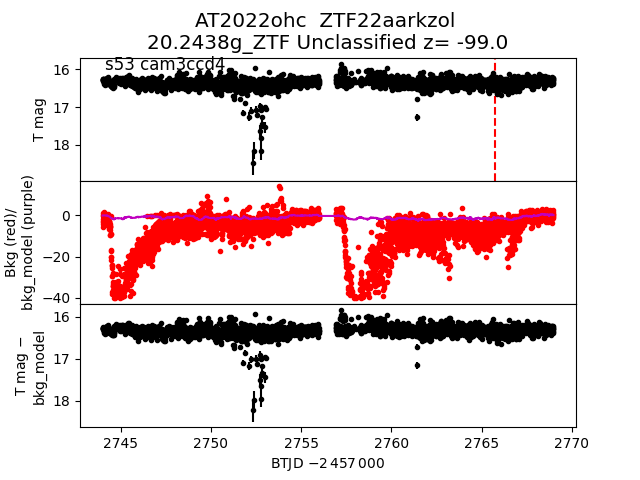
 2022ohc
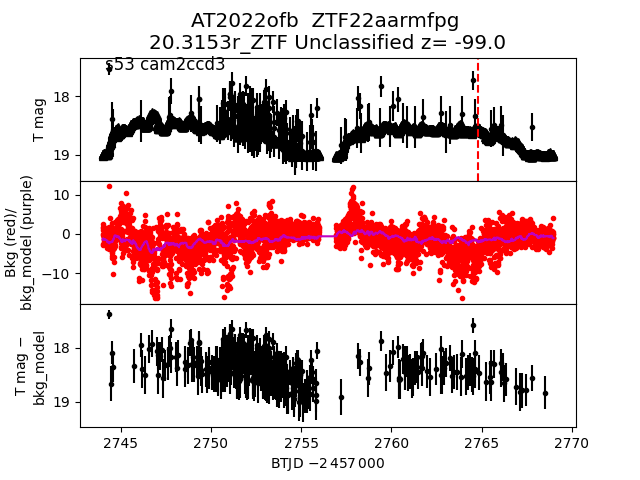
 2022ofb
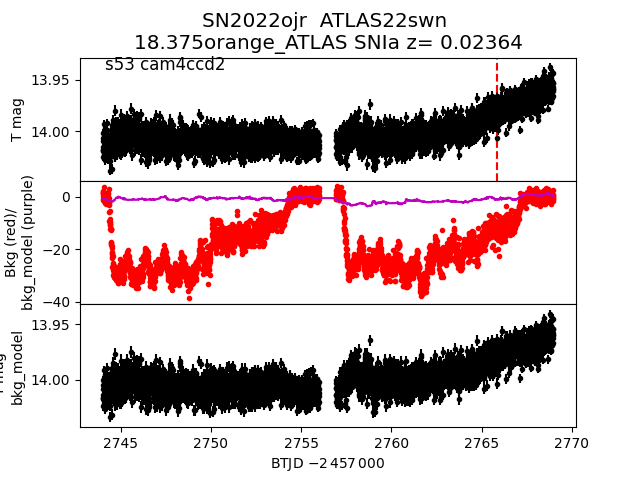
 2022ojr
 2022mzb
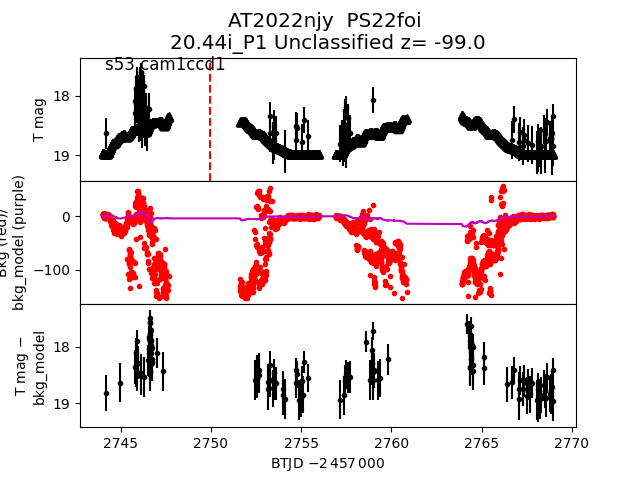
 2022njy
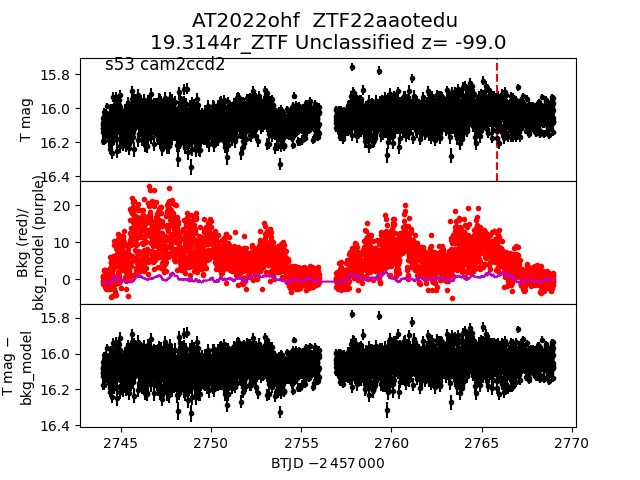
 2022ohf
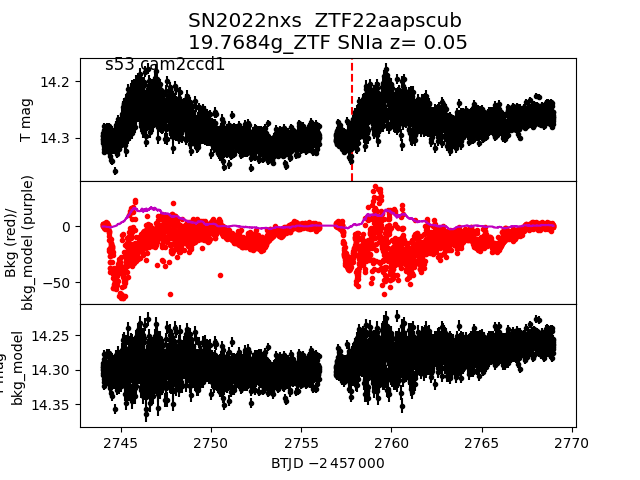
 2022nxs
 2022nid
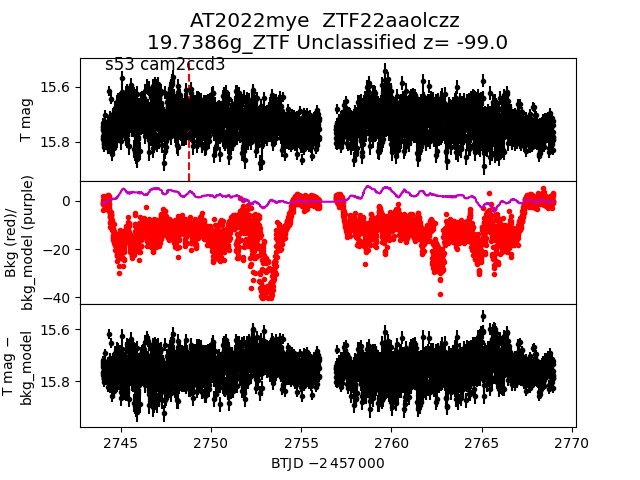
 2022mye
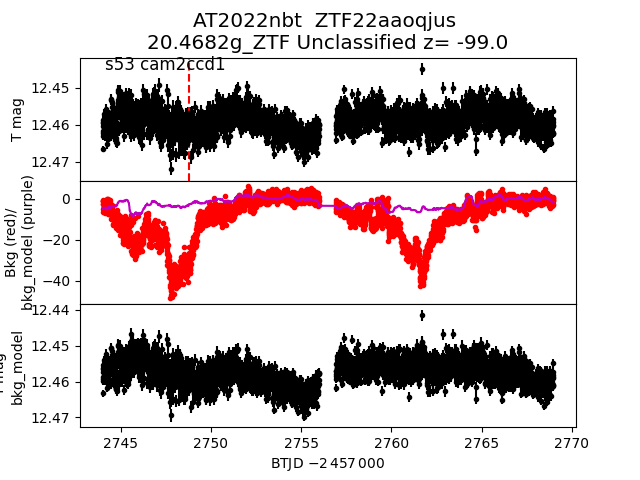
 2022nbt
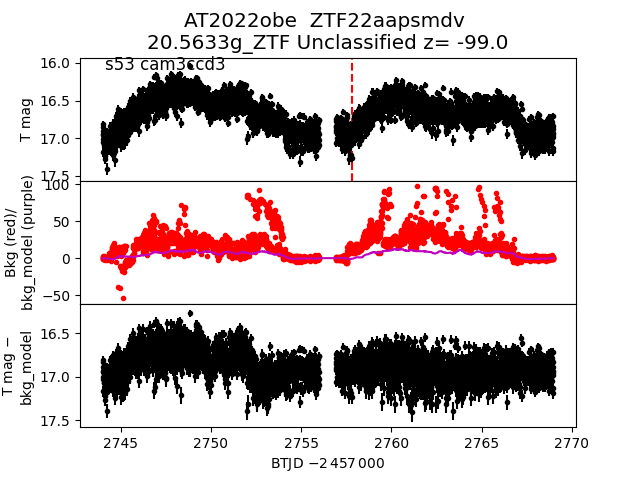
 2022obe
 2022old
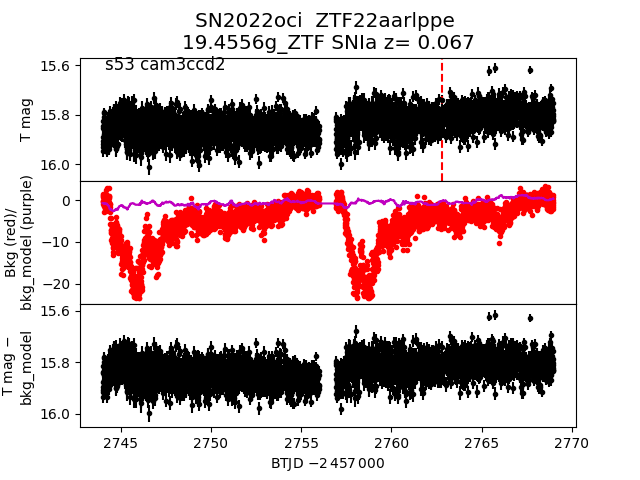
 2022oci
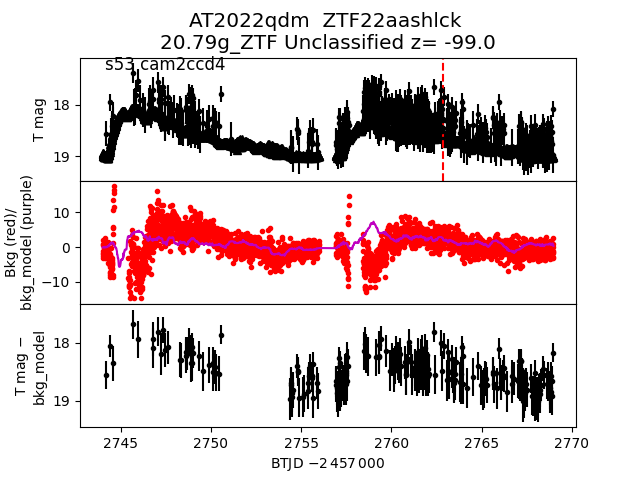
 2022qdm
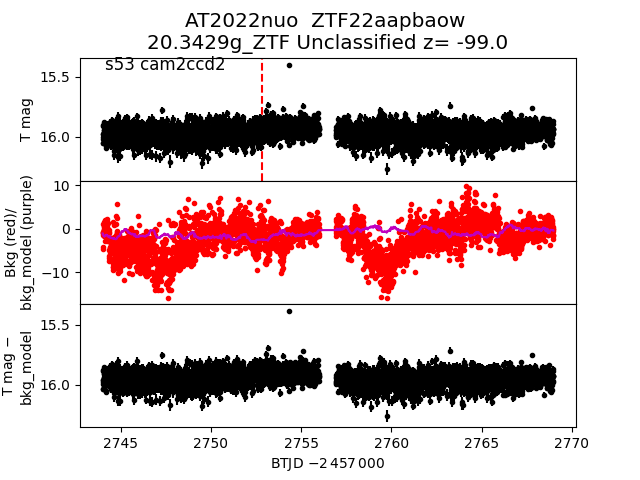
 2022nuo
 2022nhh
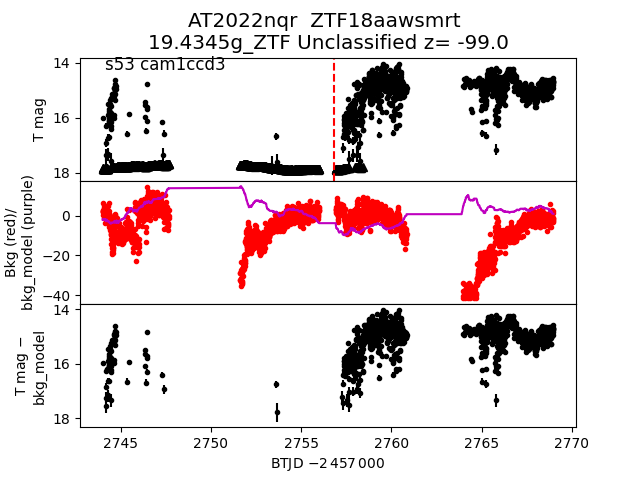
 2022nqr
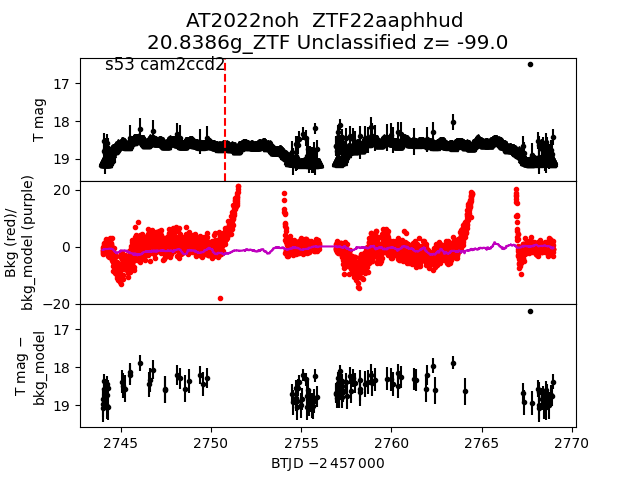
 2022noh
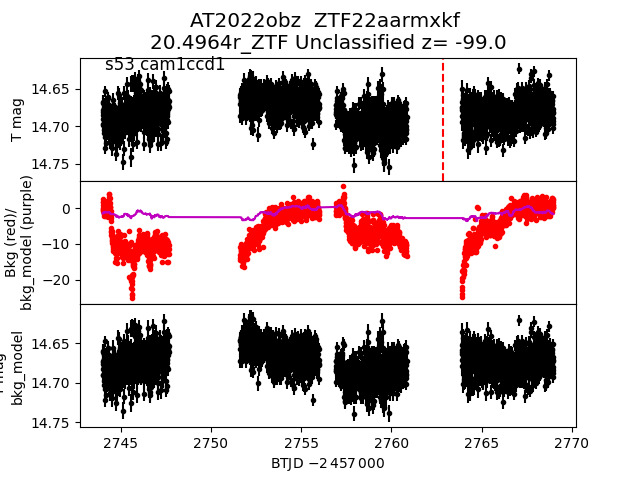
 2022obz
 2022ooo
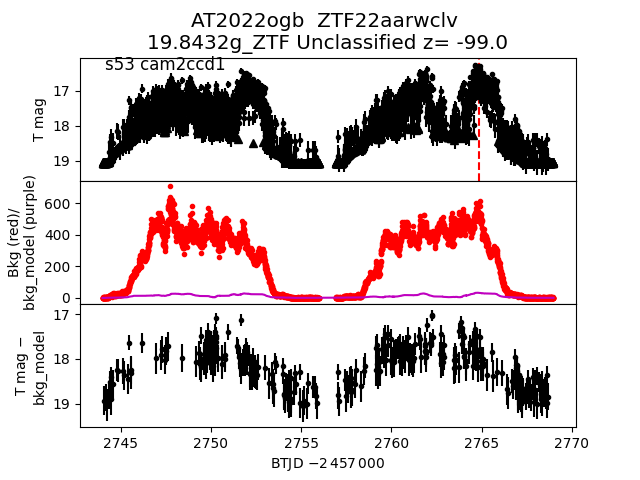
 2022ogb
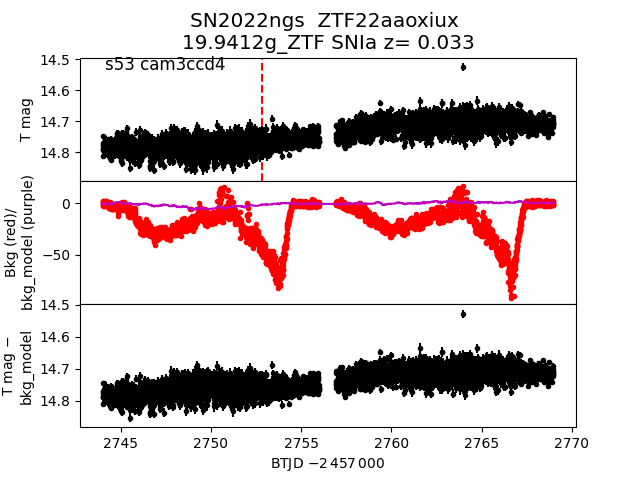
 2022ngs
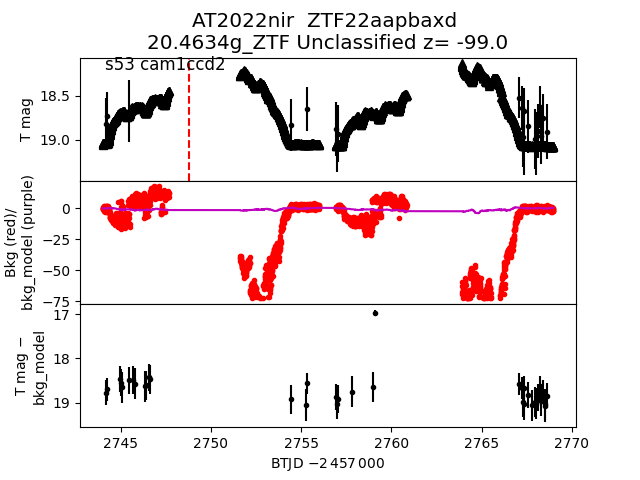
 2022nir
 2022ohp
 2022nxe
 2022ofn
 2022mtp