sector51 supernovae (26 total)
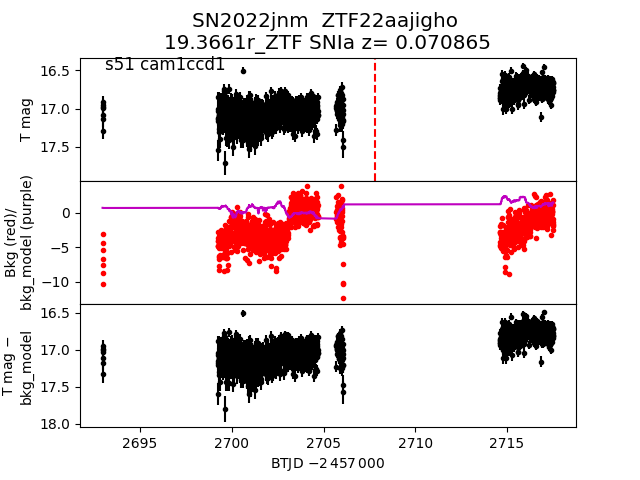
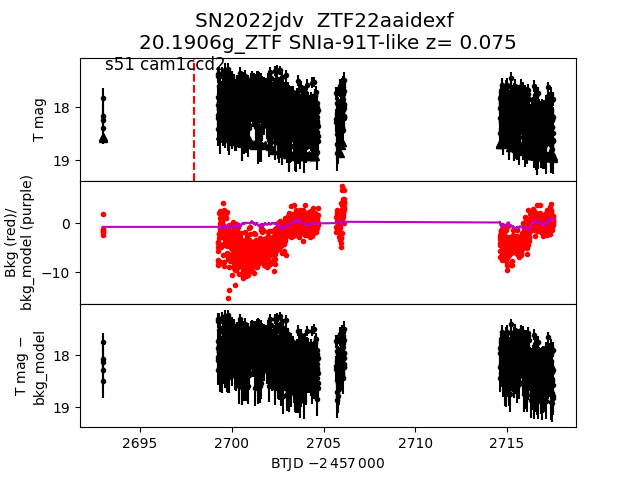
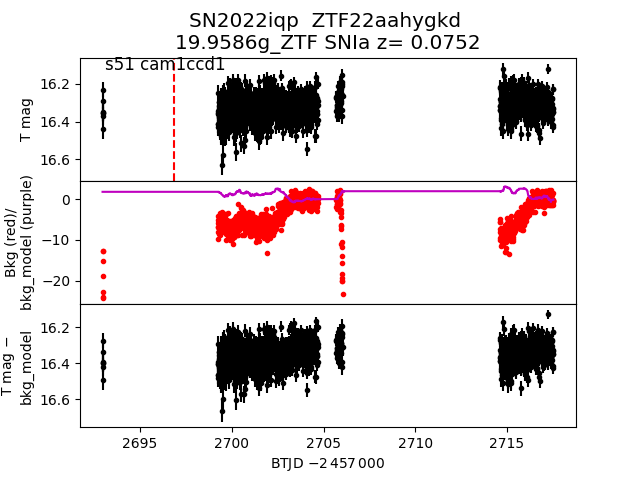
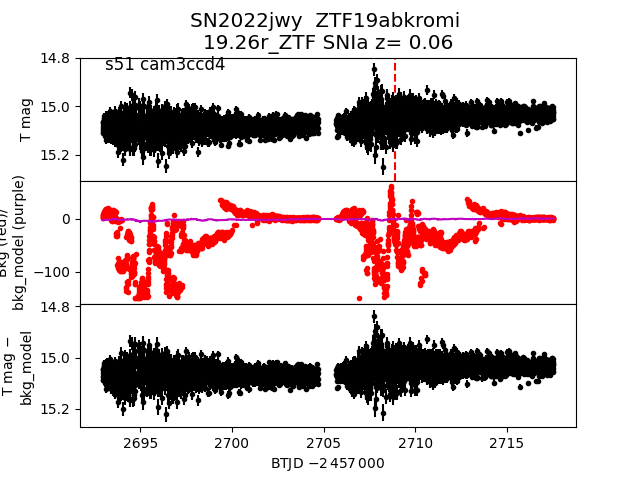
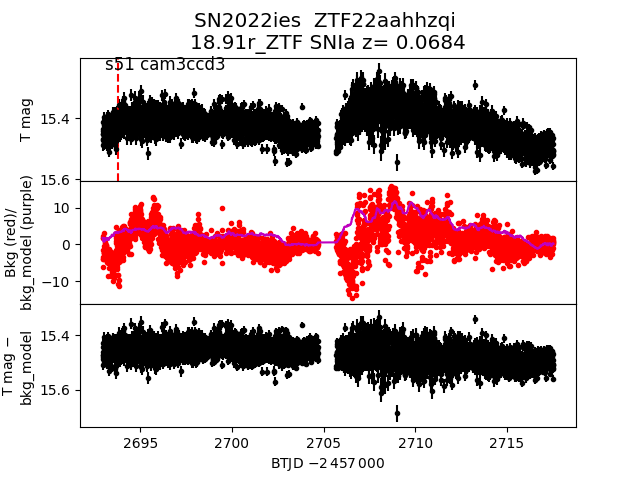
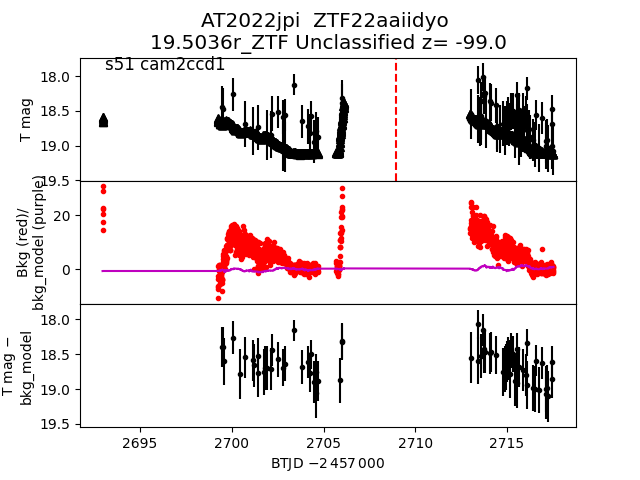
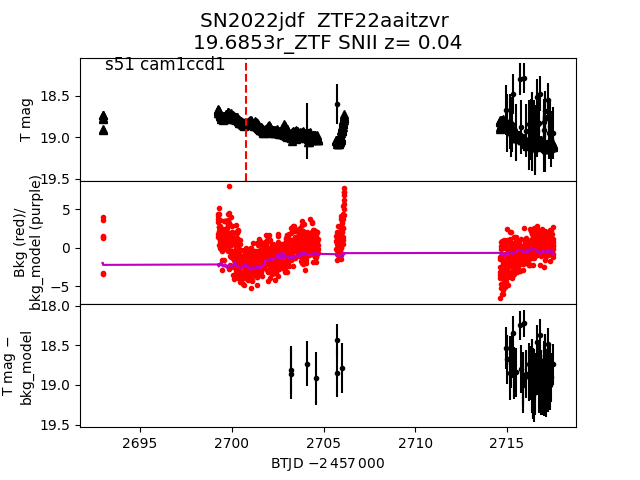
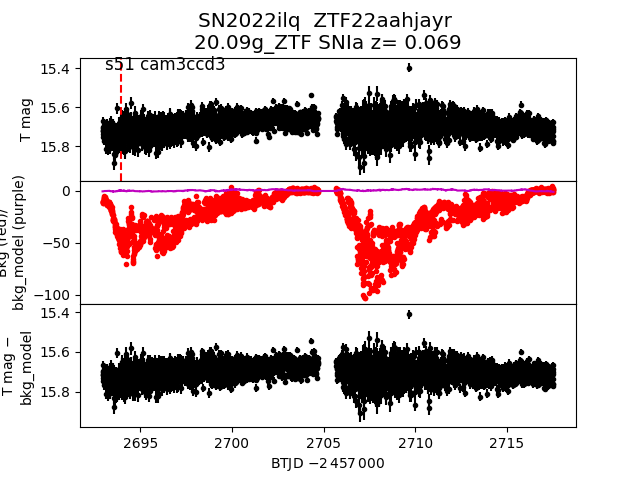
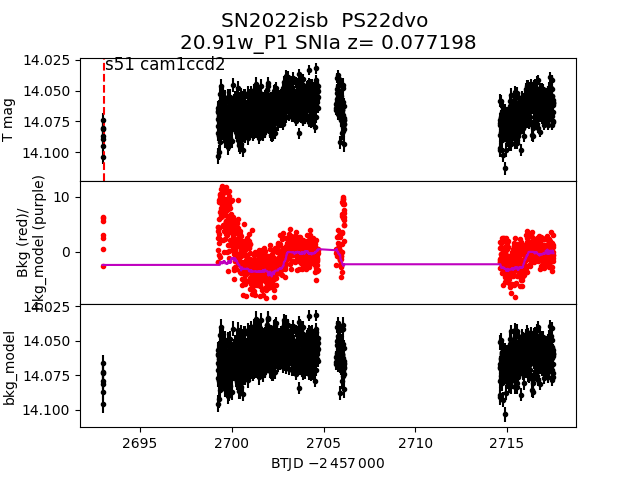
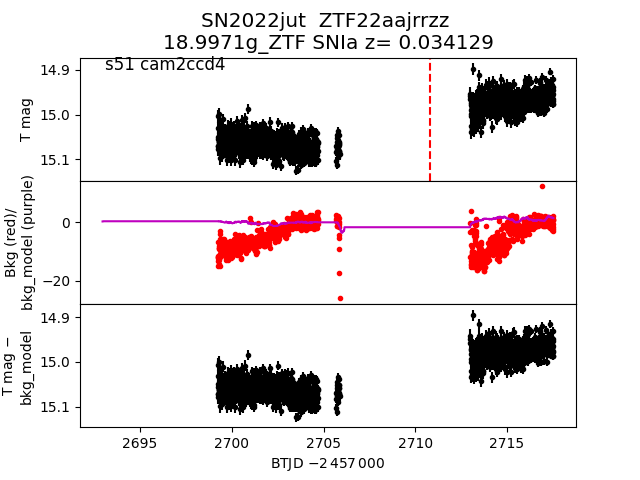
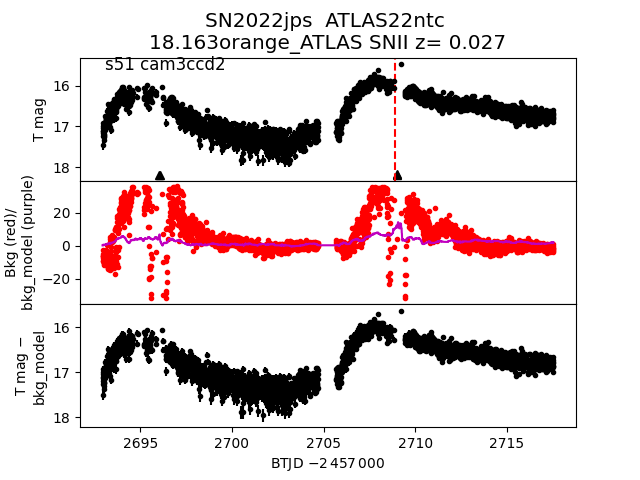
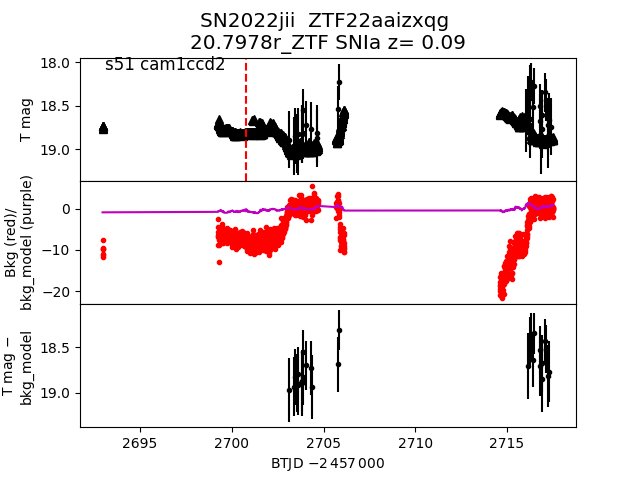
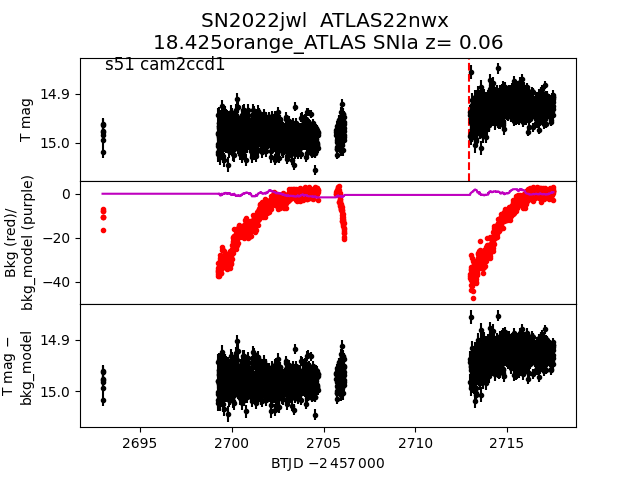
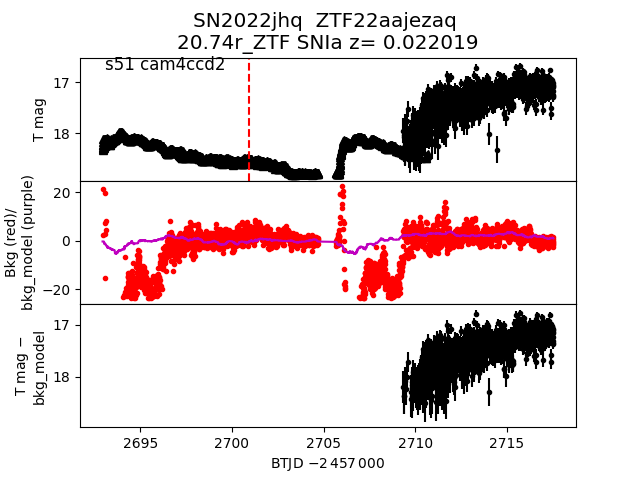
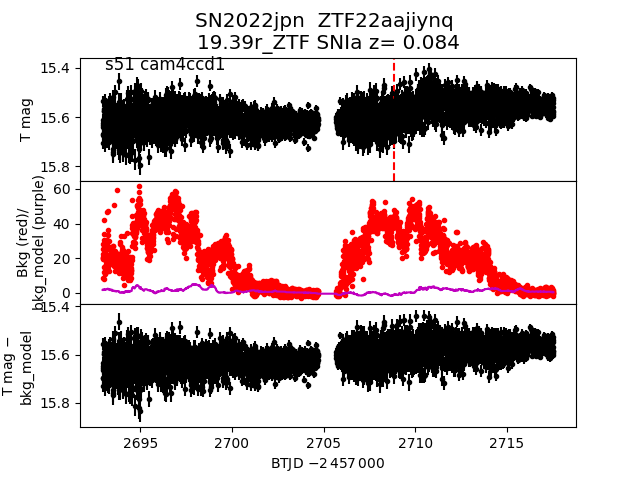
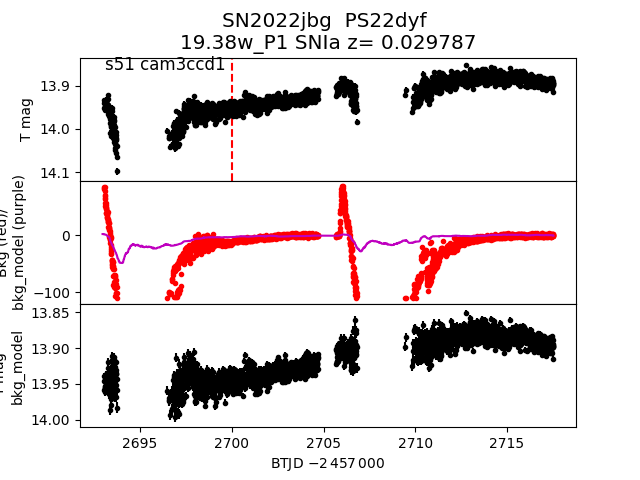
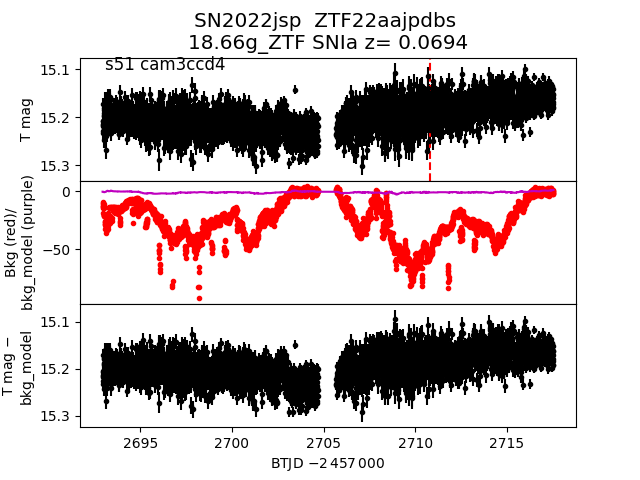
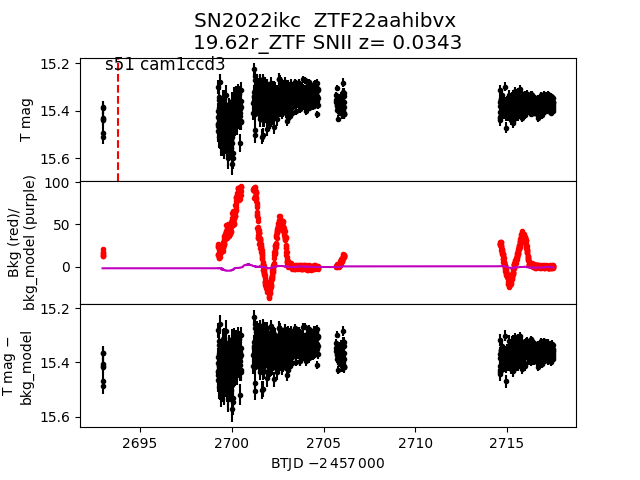
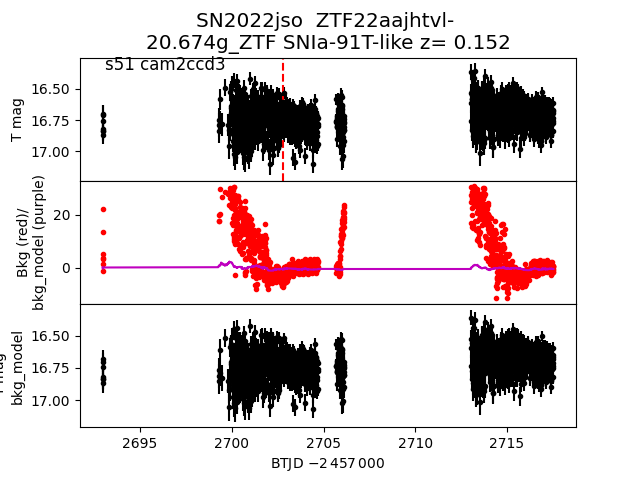
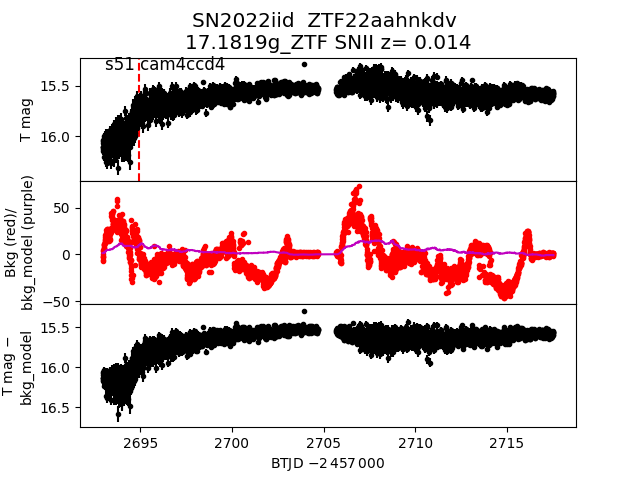
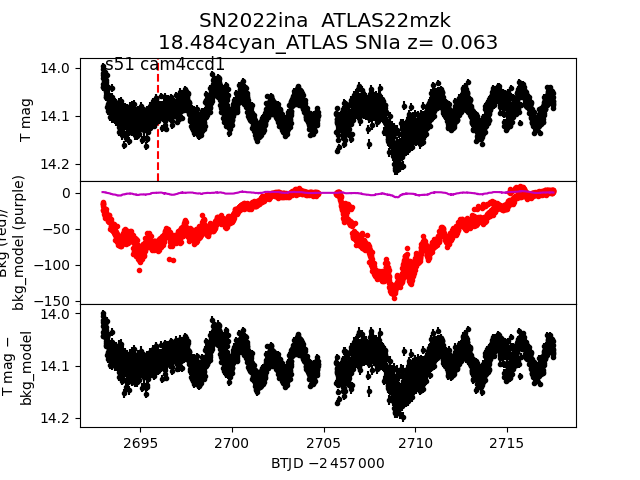
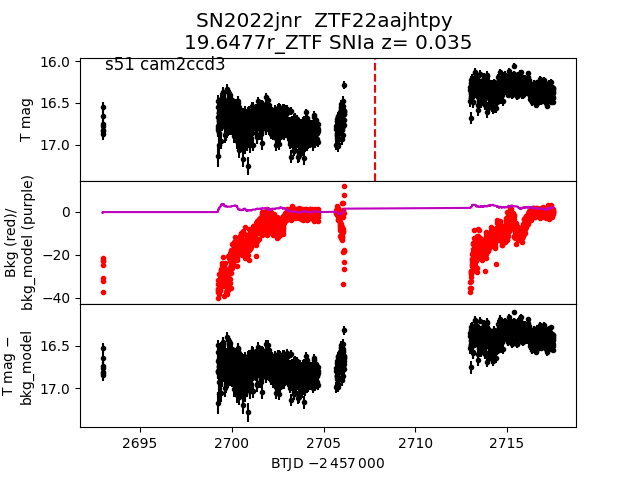
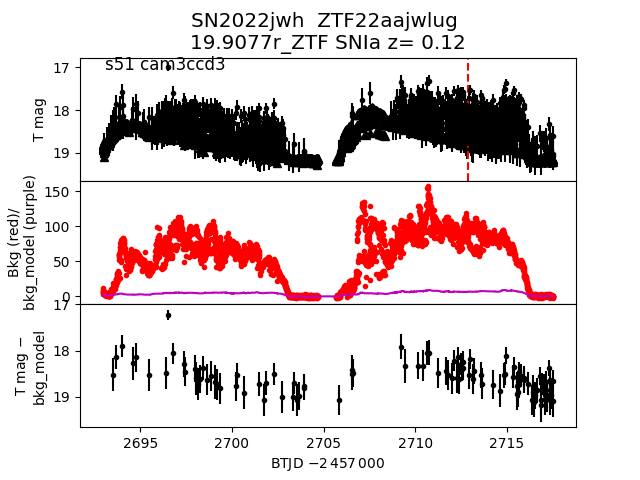
Each figure has three panels. The top panel shows the transient light curve, the middle panel shows the local background (estimated in an annulus), and the bottom panel shows a "background-model corrected" light curve. Details about the background model are in the README.
The vertical red line marks the time of discovery reported to TNS. Other useful metadata from TNS is in the figure title.
Note that the top and bottom panel are in magnitudes, while the middle panel is in differential flux units. The magnitudes are calibrated to the flux in the reference image used for image subtraction. Thus, flux from the host galaxy is included in these magnitudes.
3-sigma upper limits are plotted as triangles with no errorbars. A typical limiting magnitude is 19.6 in 30 minutes or 18.4 in 200 seconds (for low backgrounds).
The links allow you to download the light curve data as a text file.
More details in the README.
2022jdv
 2022iqp
 2022jwy
 2022ies
 2022jpi
 2022jdf
 2022ilq
 2022isb
 2022jut
 2022jps
 2022jii
 2022jwl
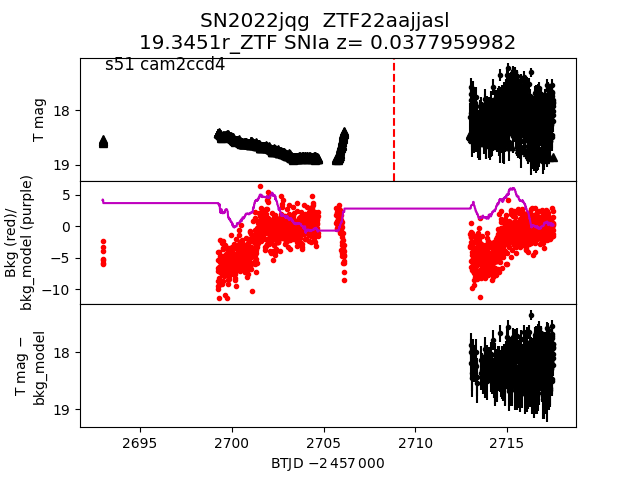
 2022jqg
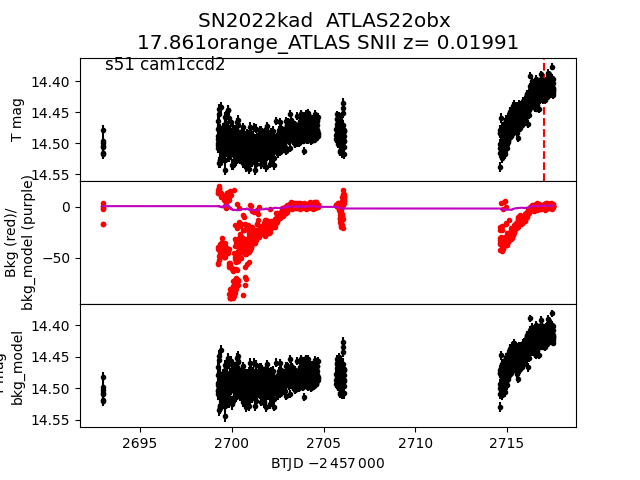
 2022kad
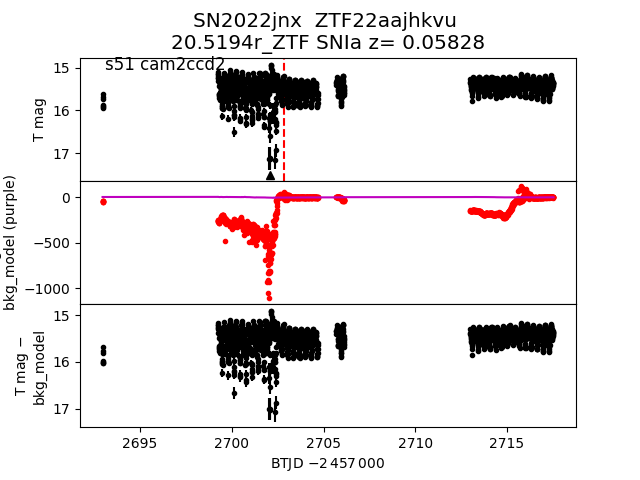
 2022jnx
 2022jhq
 2022jpn
 2022jbg
 2022jsp
 2022ikc
 2022jso
 2022iid
 2022ina
 2022jnr
 2022jwh
 2022jnm