sector50 supernovae (24 total)
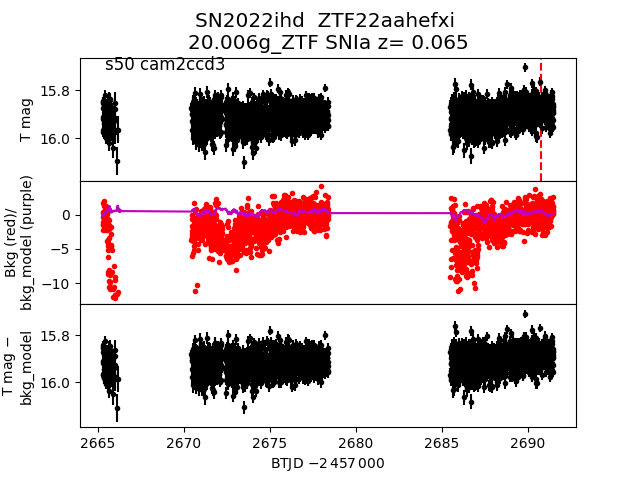
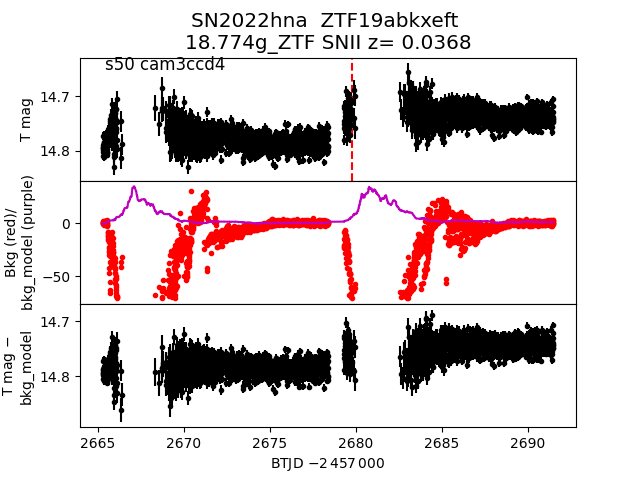
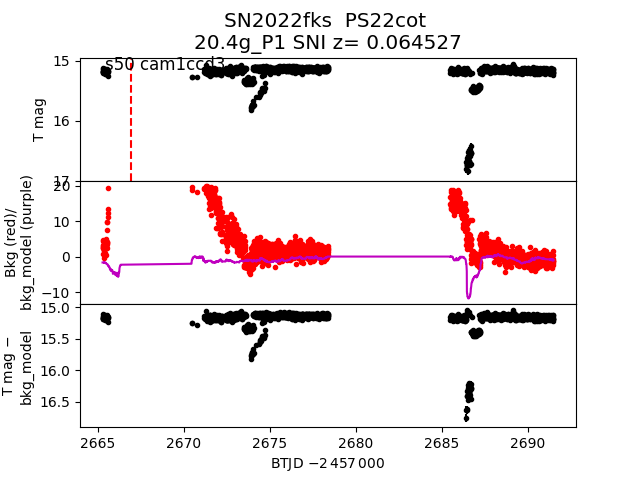
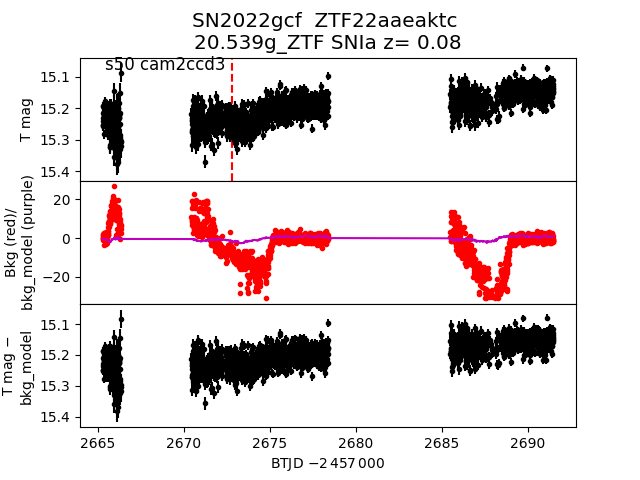
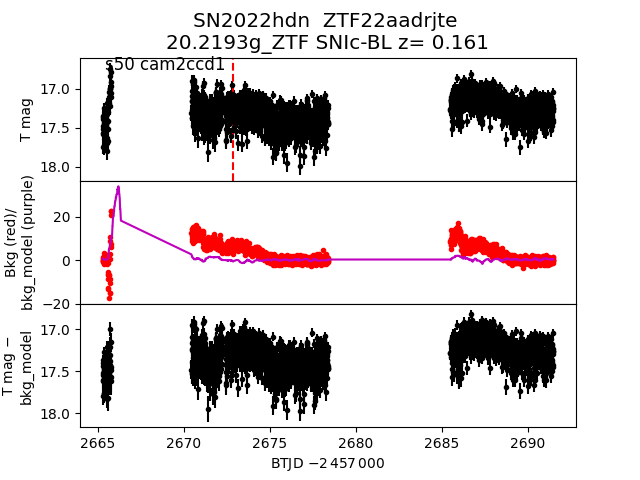
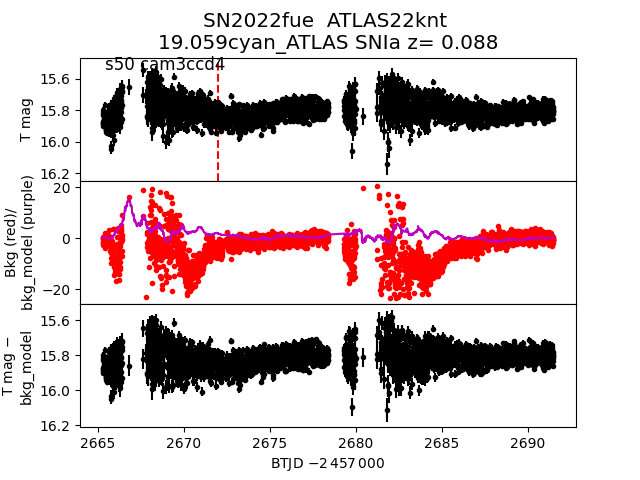
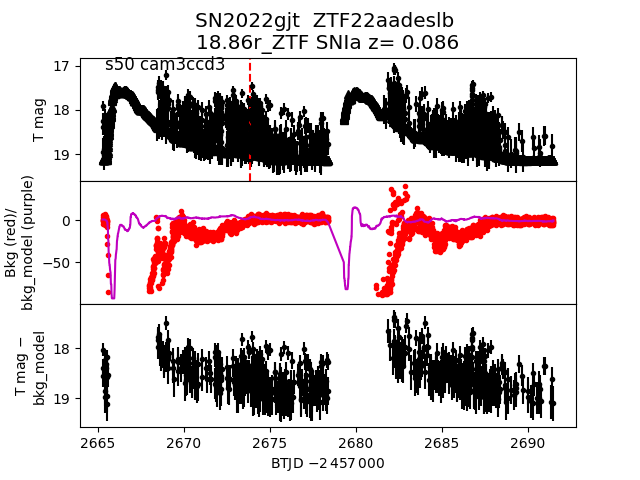
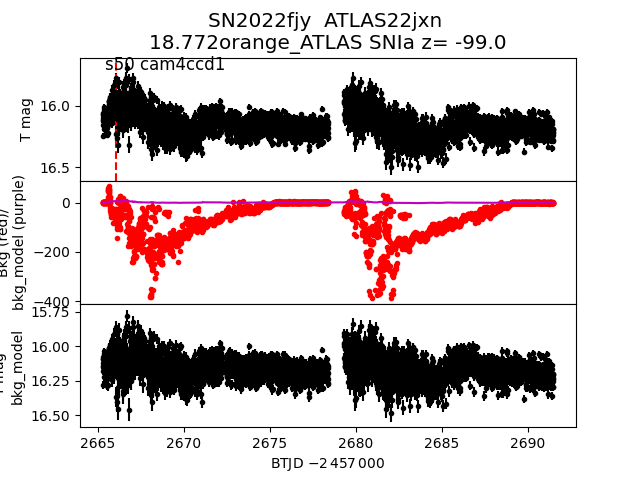
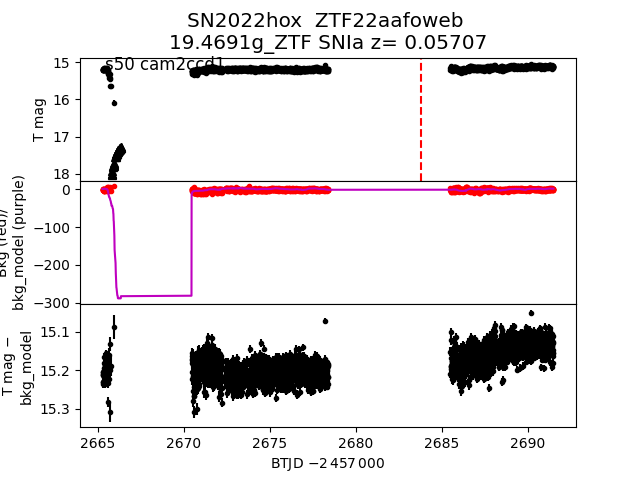
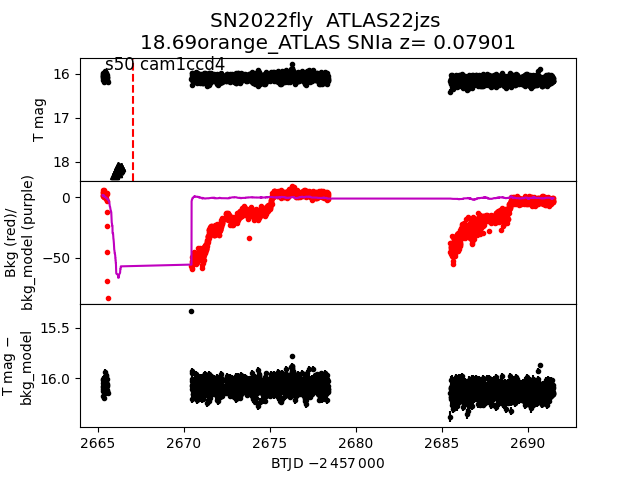
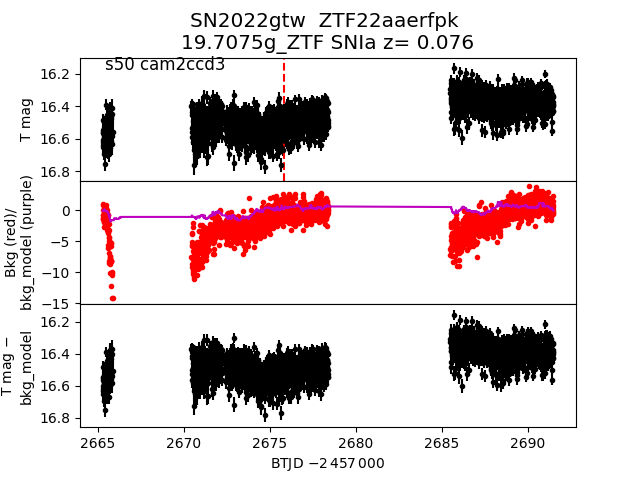
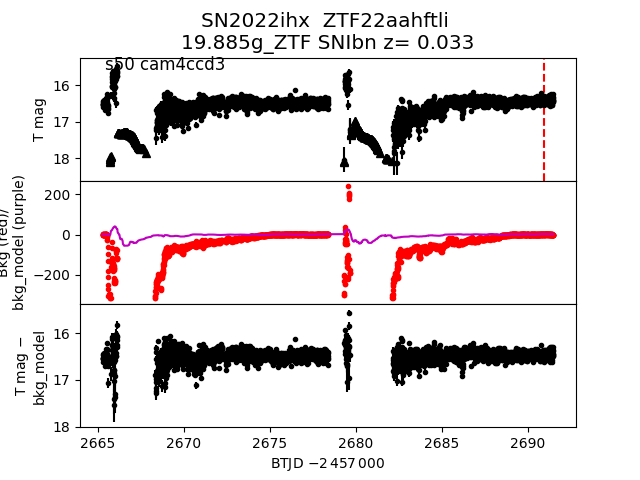
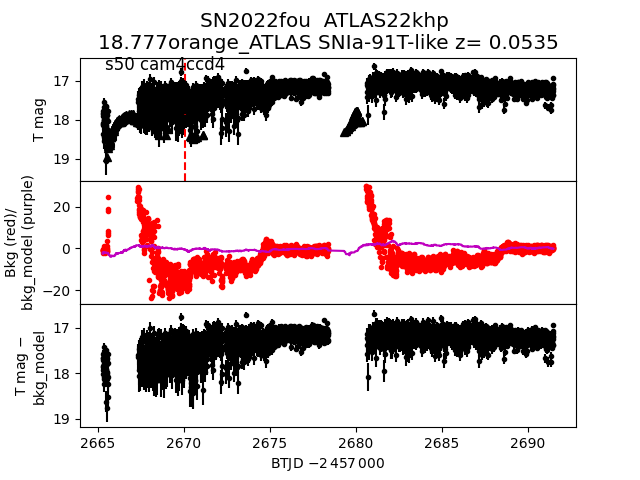
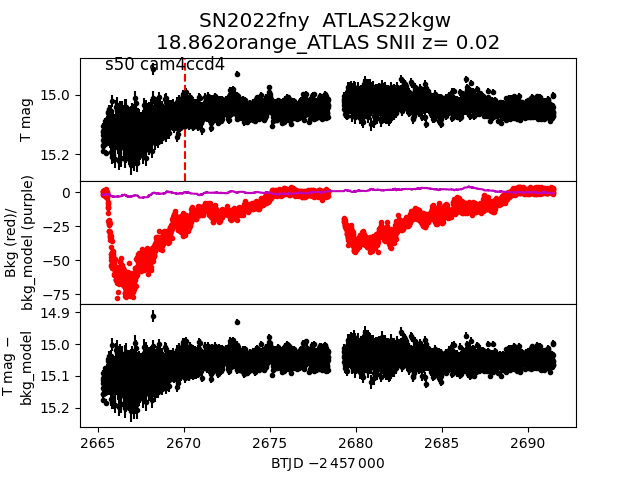
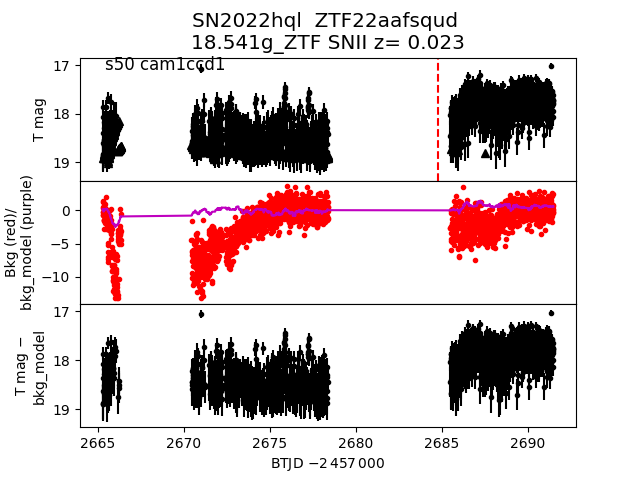
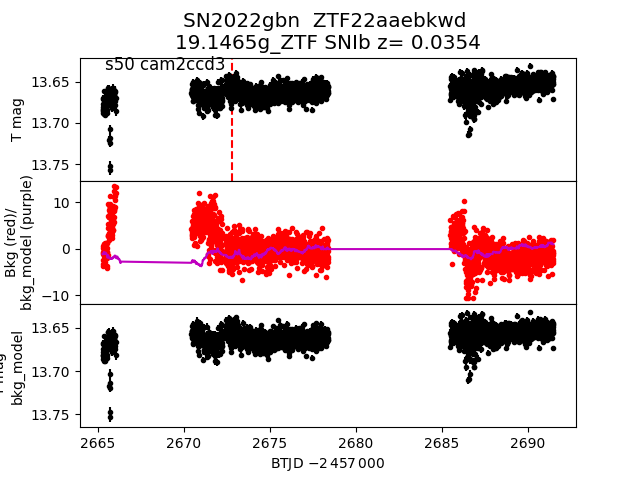
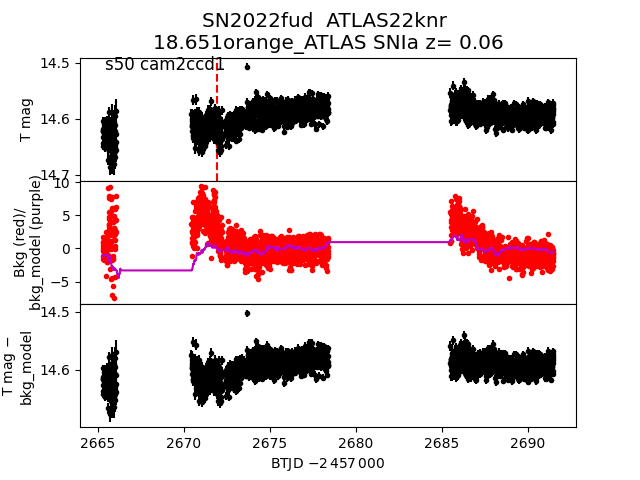
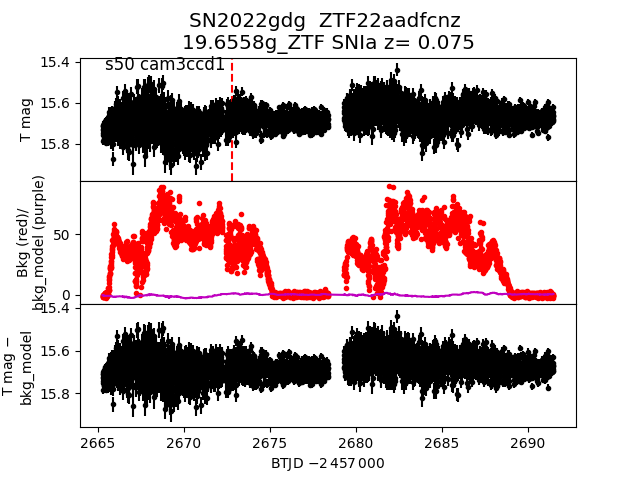
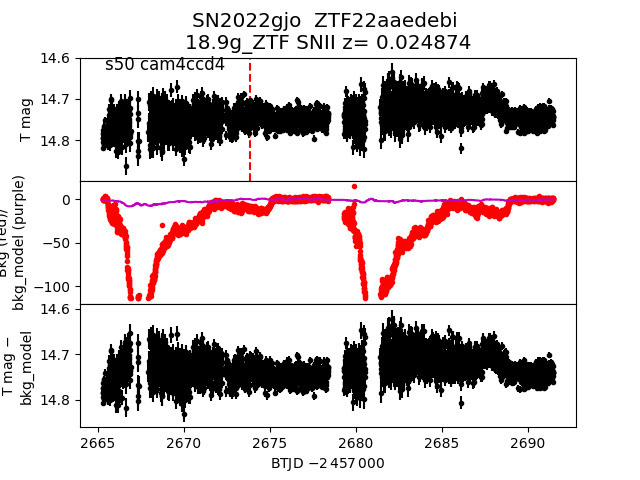
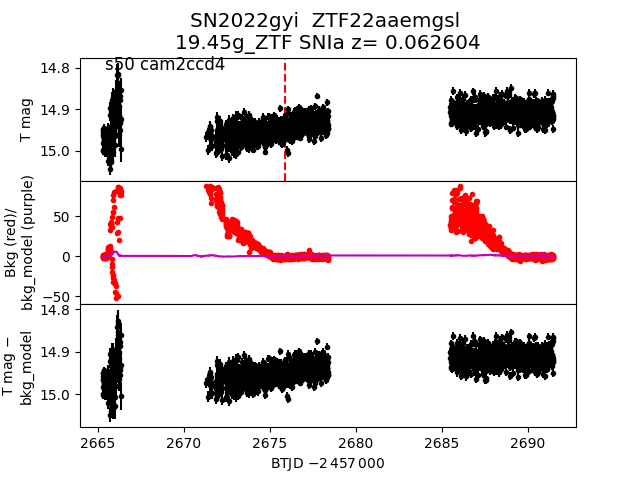
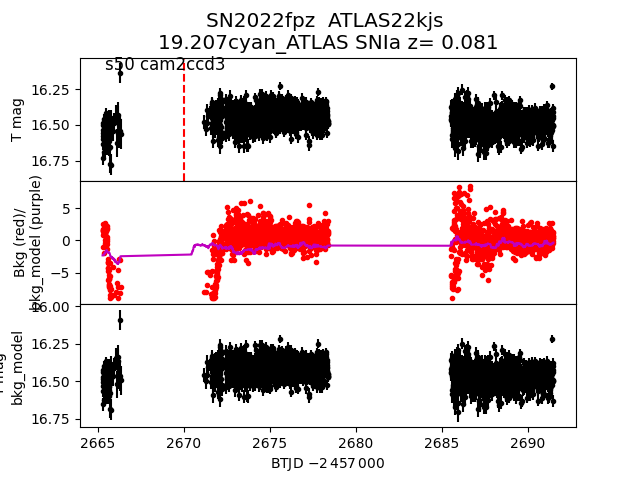
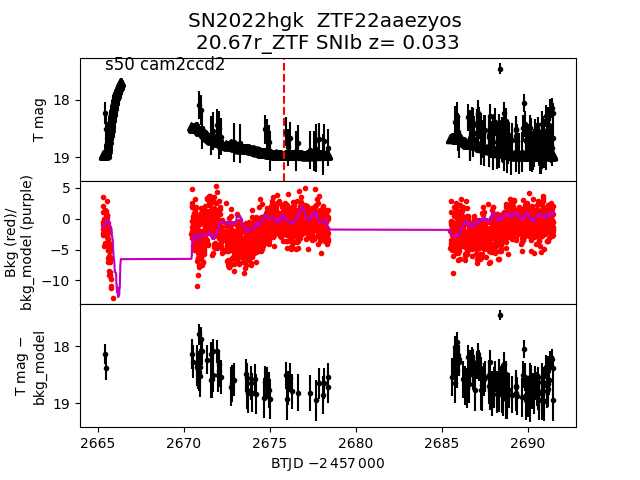
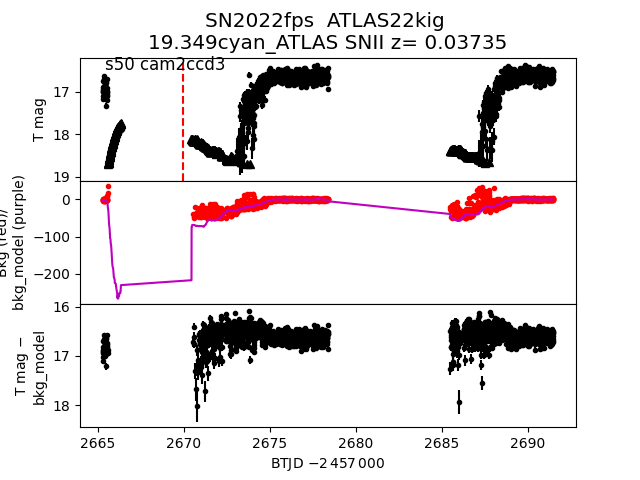
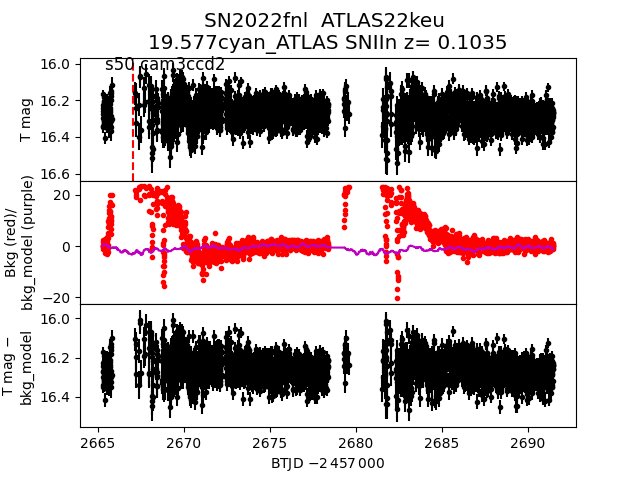
Each figure has three panels. The top panel shows the transient light curve, the middle panel shows the local background (estimated in an annulus), and the bottom panel shows a "background-model corrected" light curve. Details about the background model are in the README.
The vertical red line marks the time of discovery reported to TNS. Other useful metadata from TNS is in the figure title.
Note that the top and bottom panel are in magnitudes, while the middle panel is in differential flux units. The magnitudes are calibrated to the flux in the reference image used for image subtraction. Thus, flux from the host galaxy is included in these magnitudes.
3-sigma upper limits are plotted as triangles with no errorbars. A typical limiting magnitude is 19.6 in 30 minutes or 18.4 in 200 seconds (for low backgrounds).
The links allow you to download the light curve data as a text file.
More details in the README.
2022hna
 2022fks
 2022gcf
 2022hdn
 2022fue
 2022gjt
 2022fjy
 2022hox
 2022fly
 2022gtw
 2022ihx
 2022fou
 2022fny
 2022hql
 2022gbn
 2022fud
 2022gdg
 2022gjo
 2022gyi
 2022fpz
 2022hgk
 2022fps
 2022fnl
 2022ihd