all transients in sector49 (135 total)
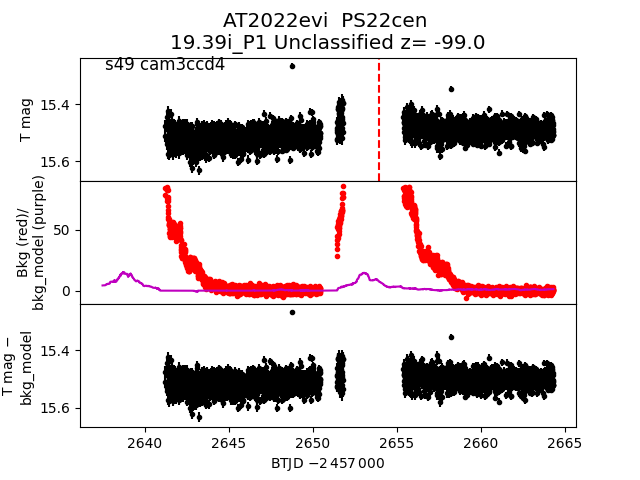
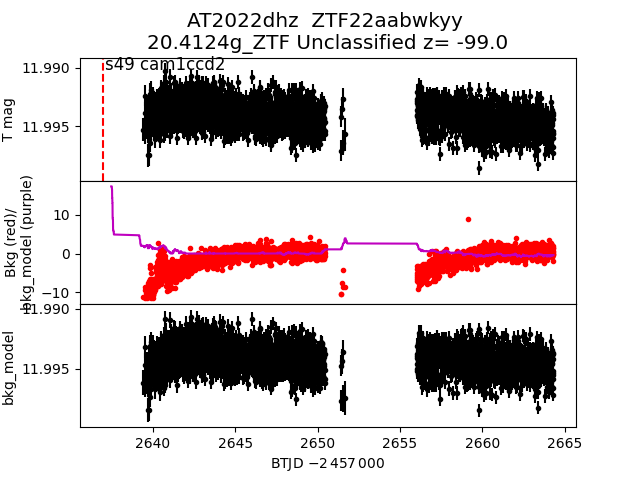
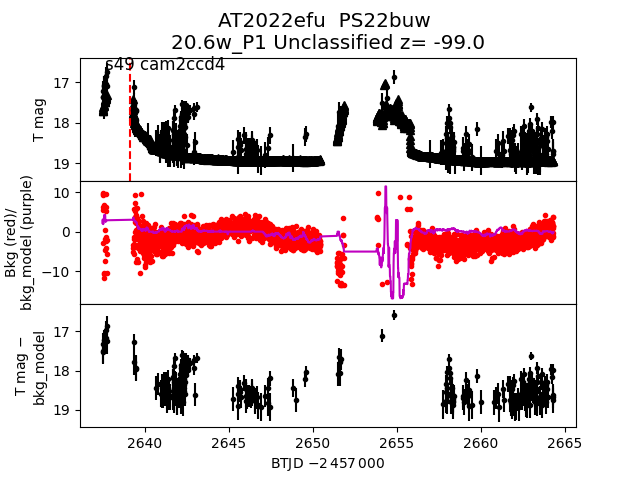
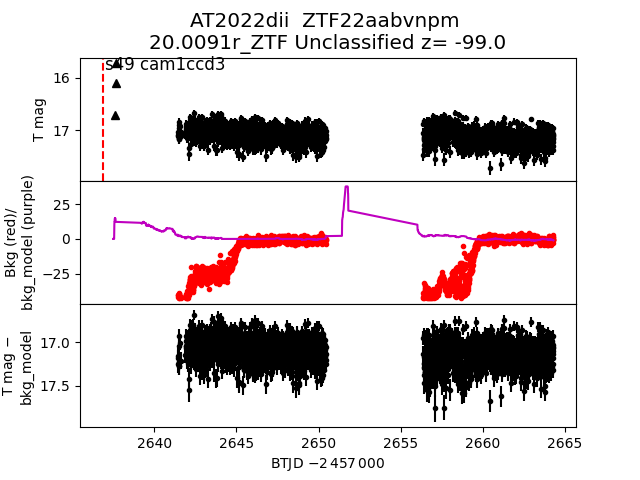
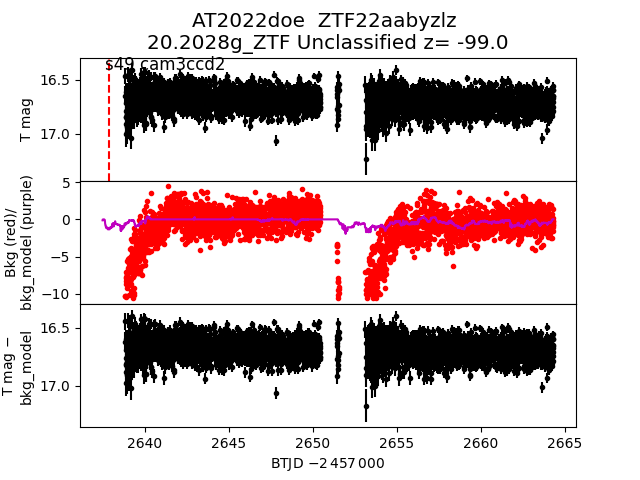
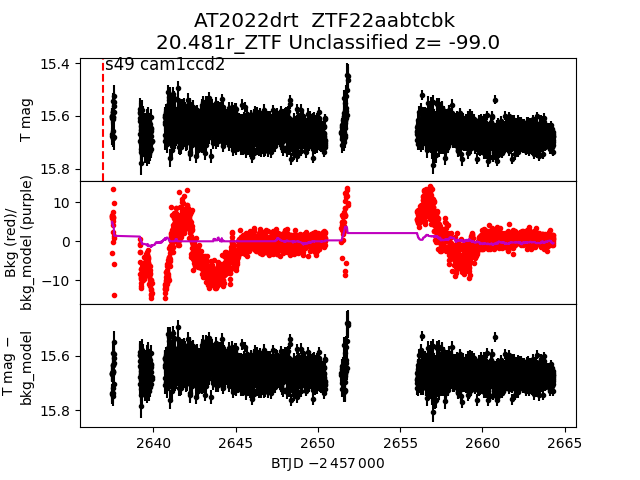
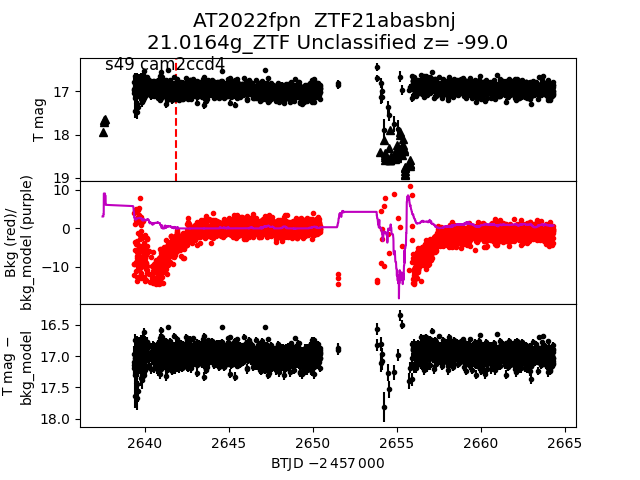
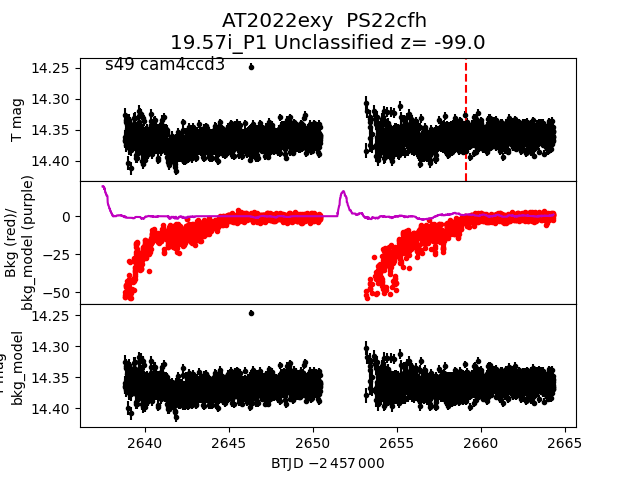
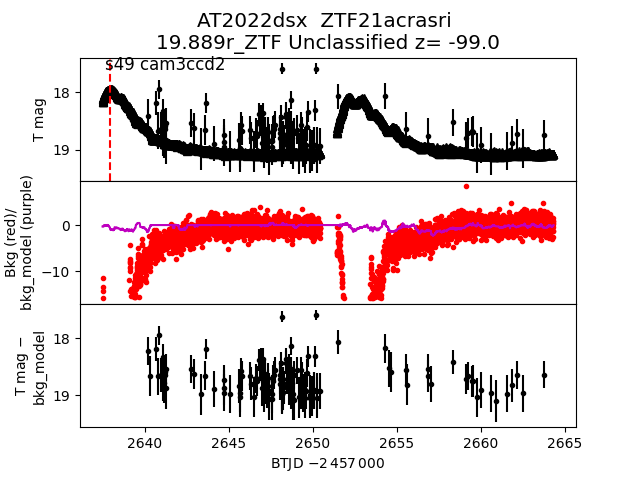
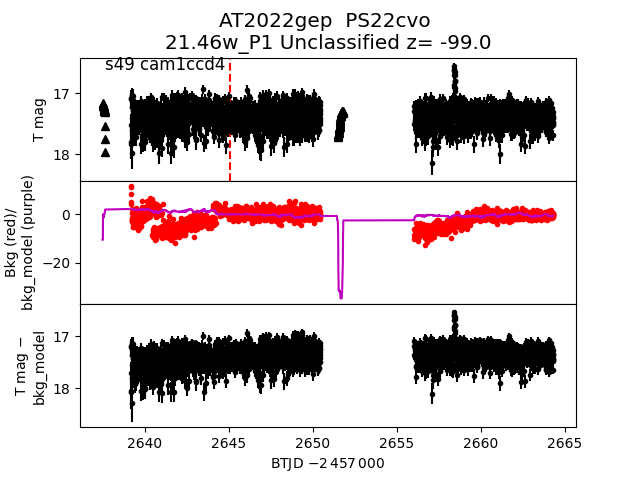
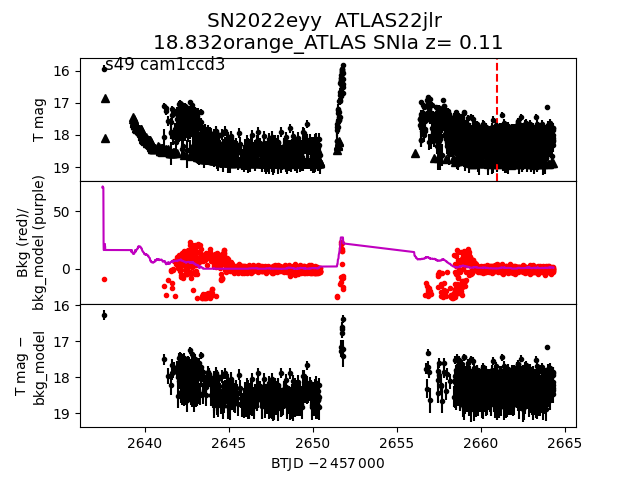
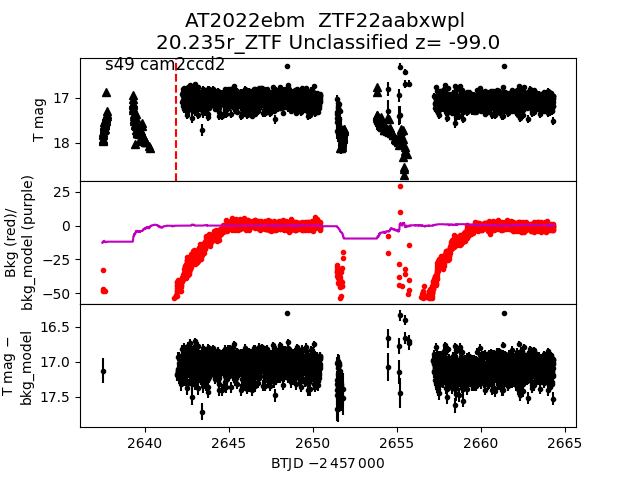
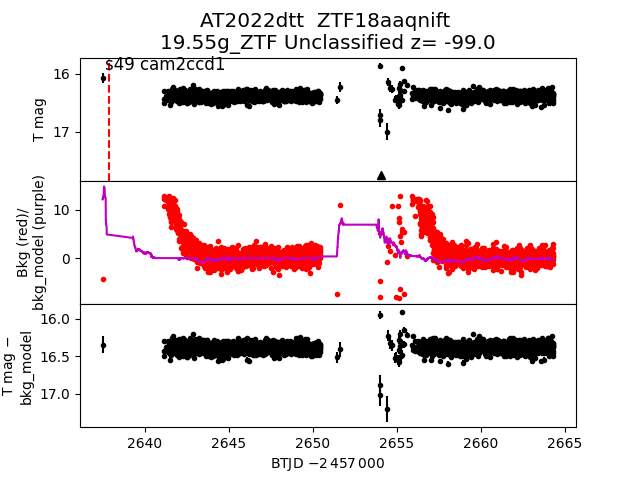
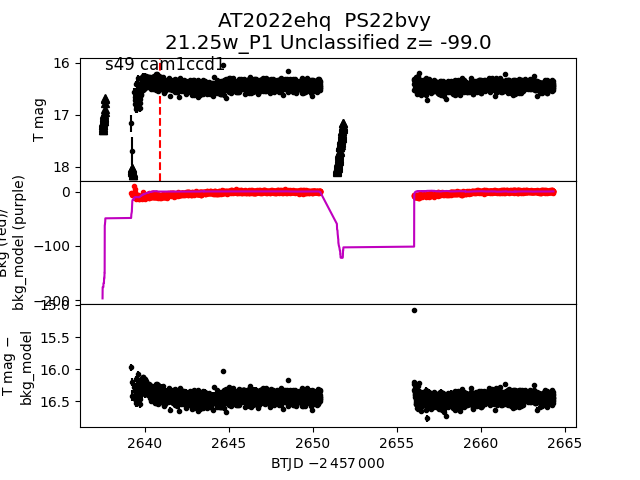
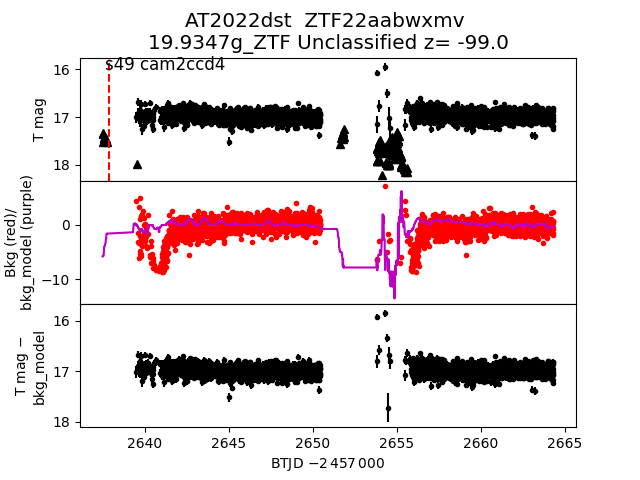
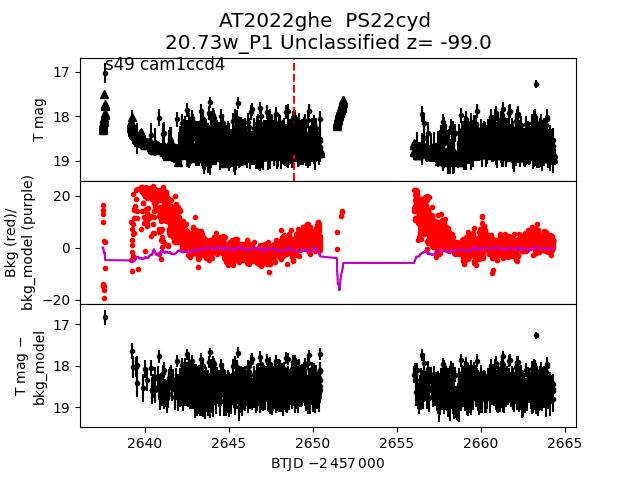
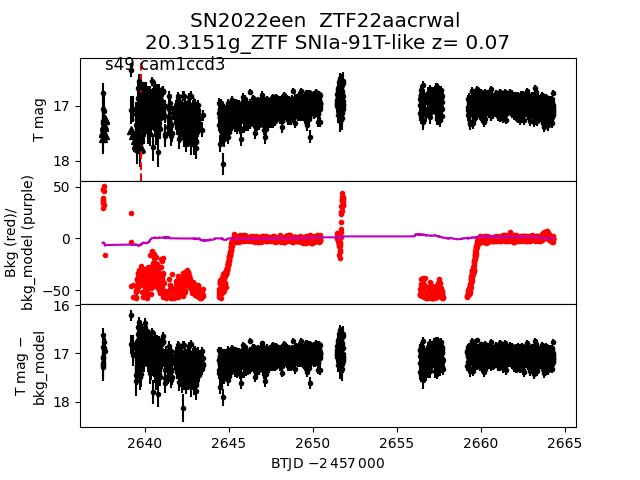
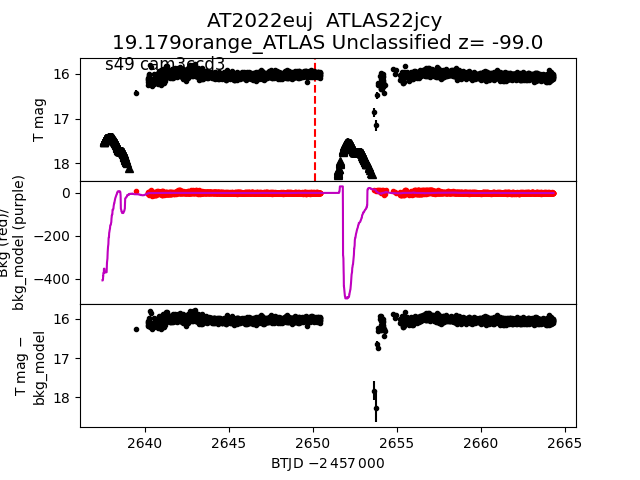
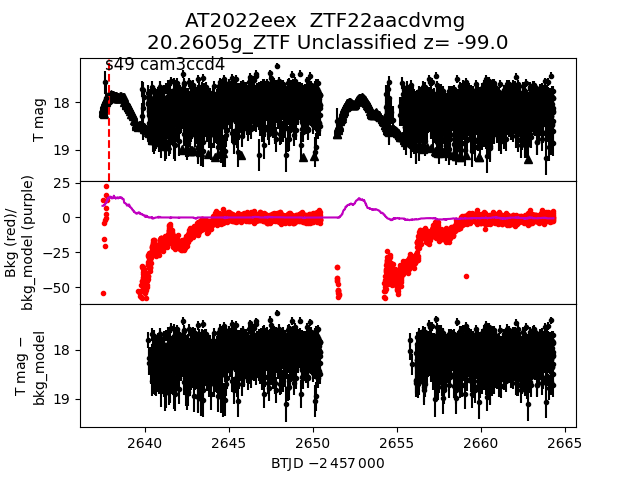
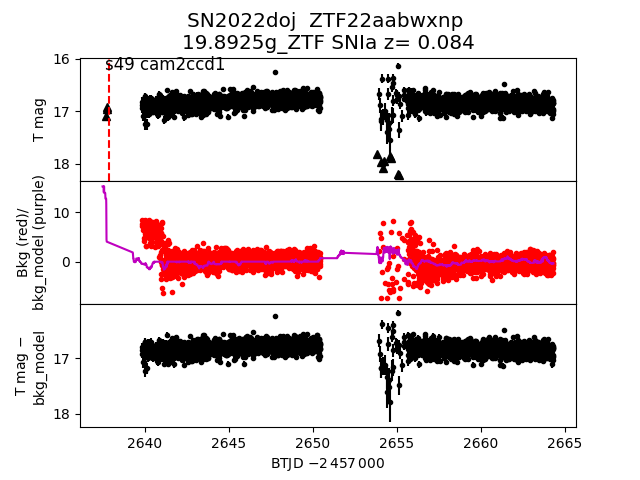
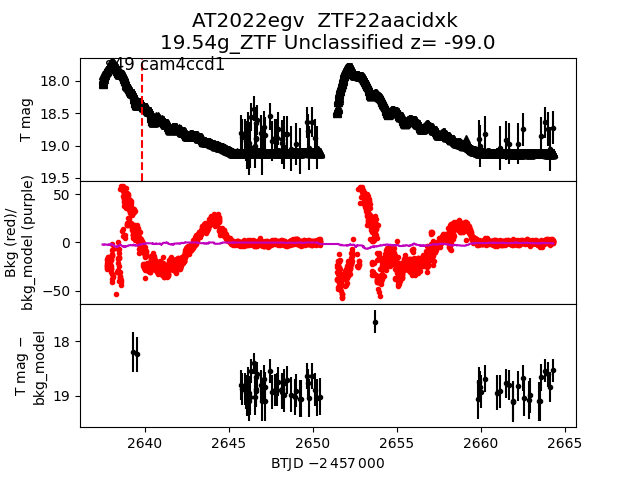
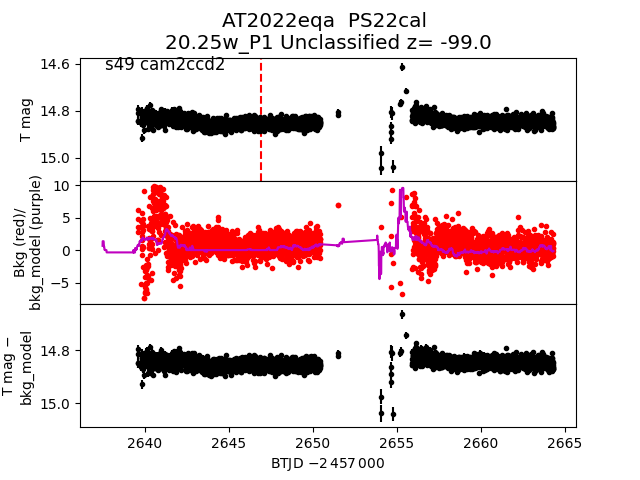
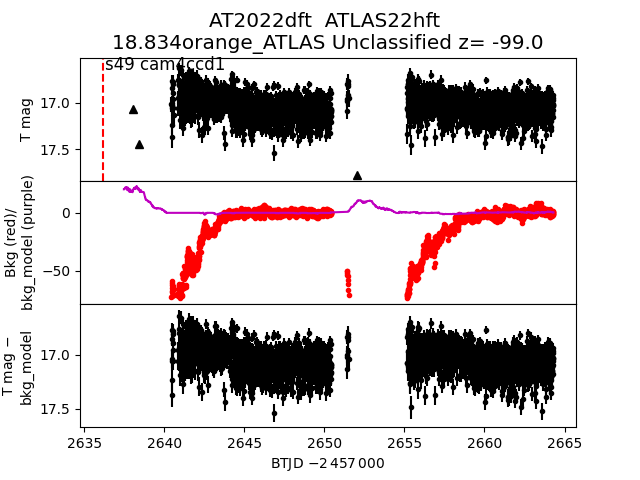
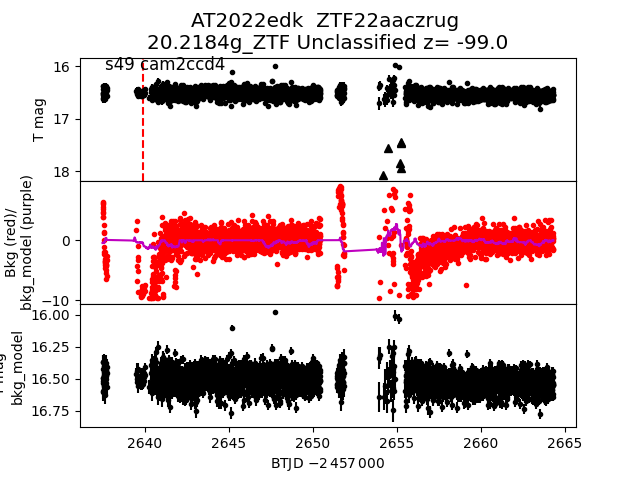
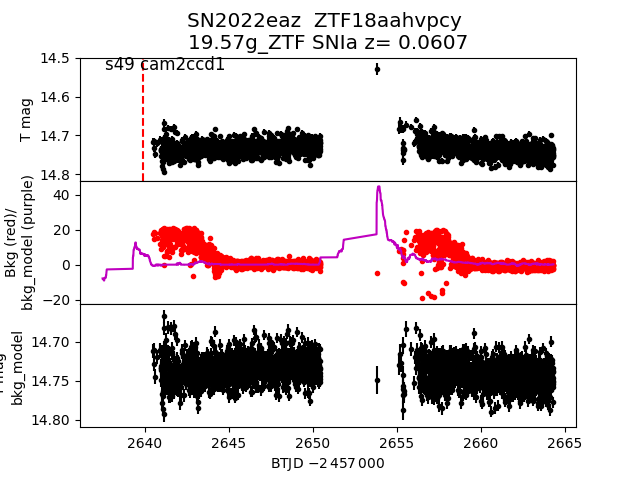
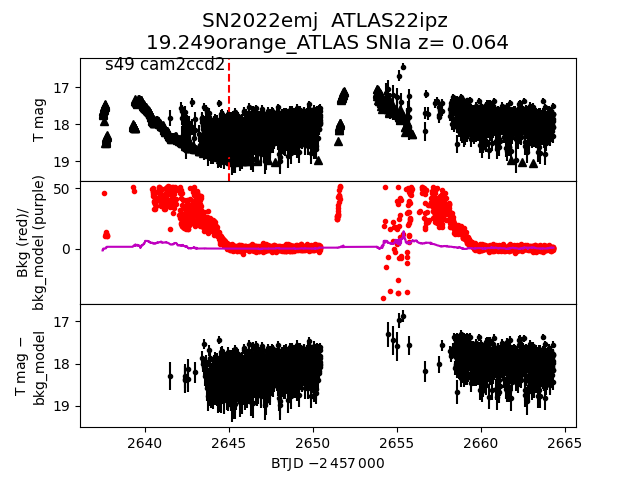
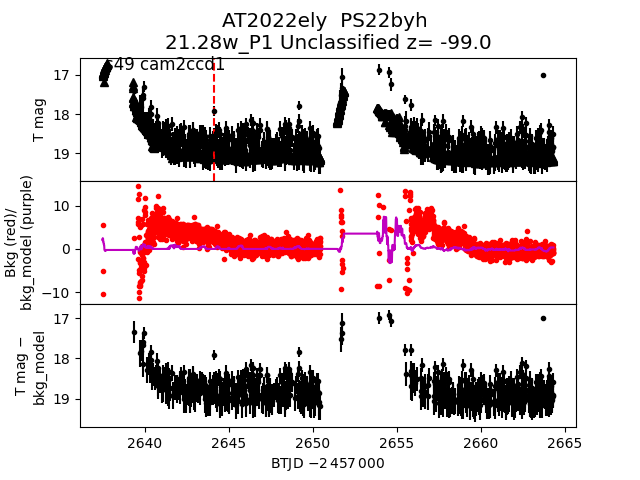
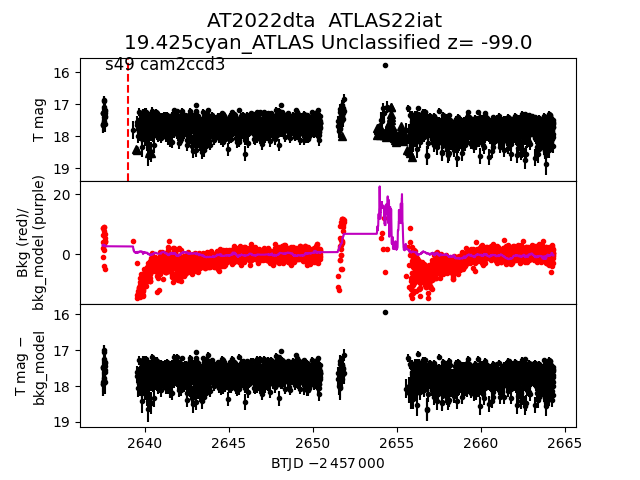
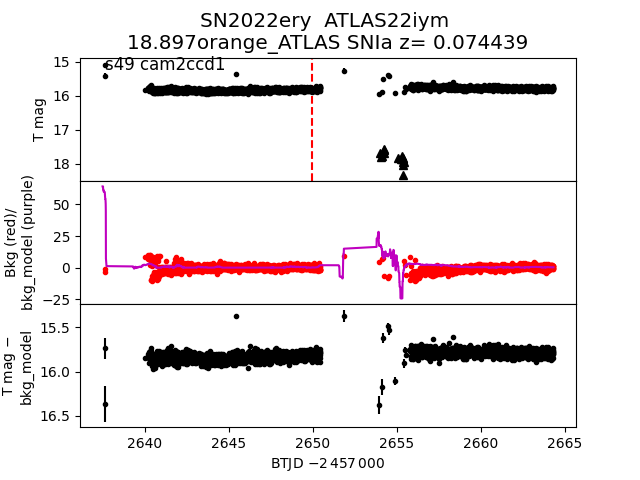
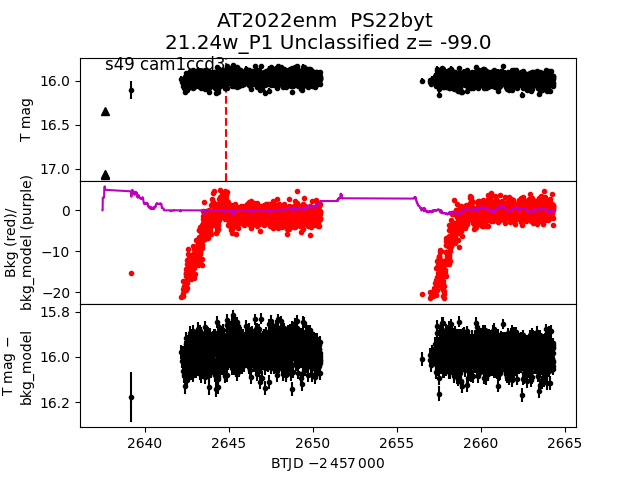
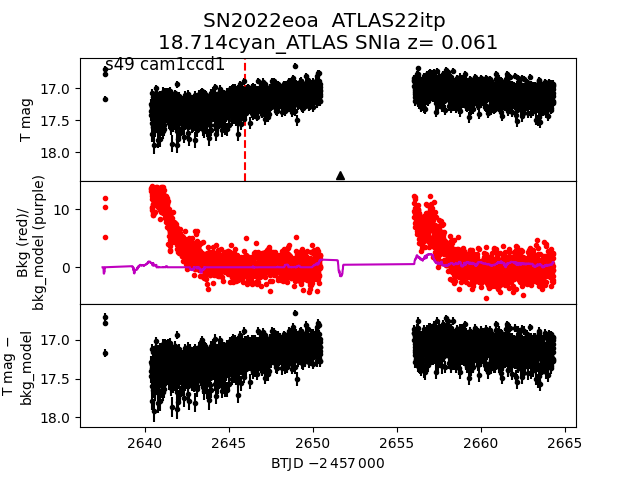
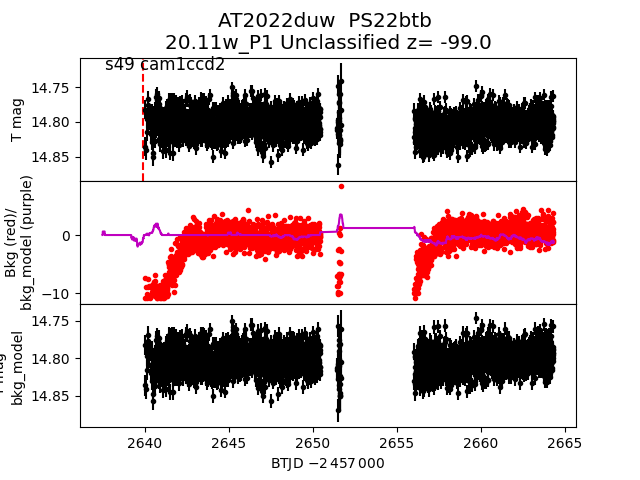
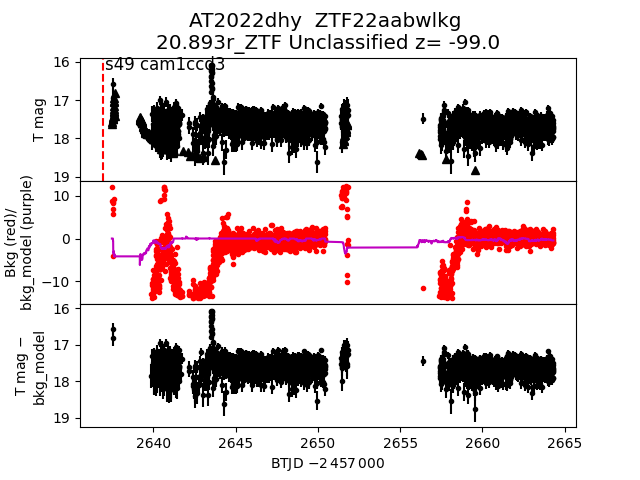
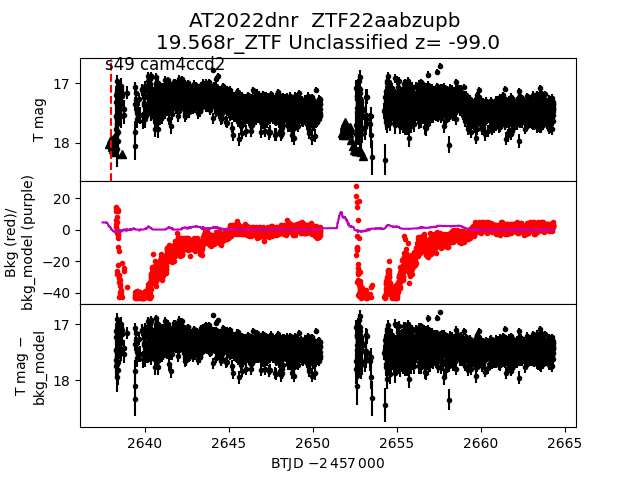
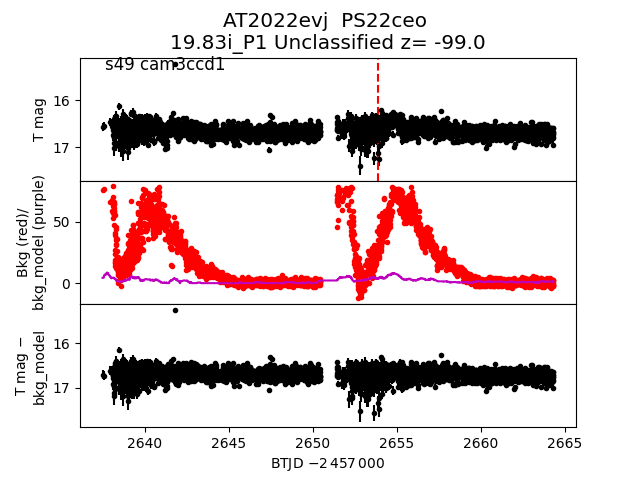
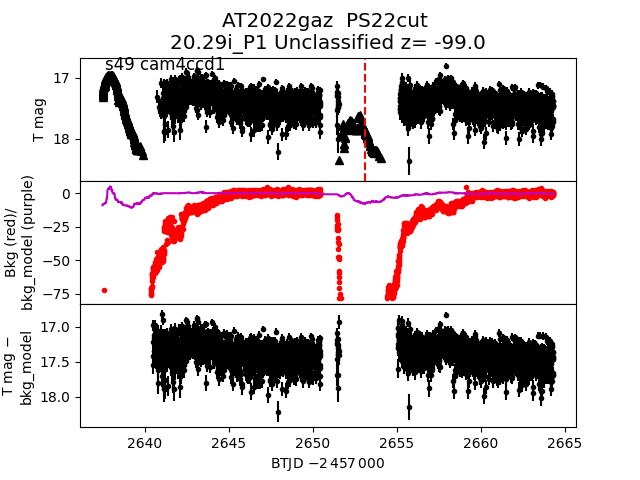
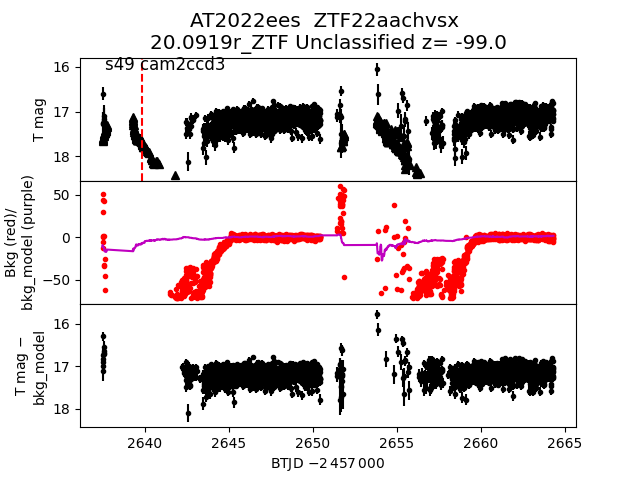
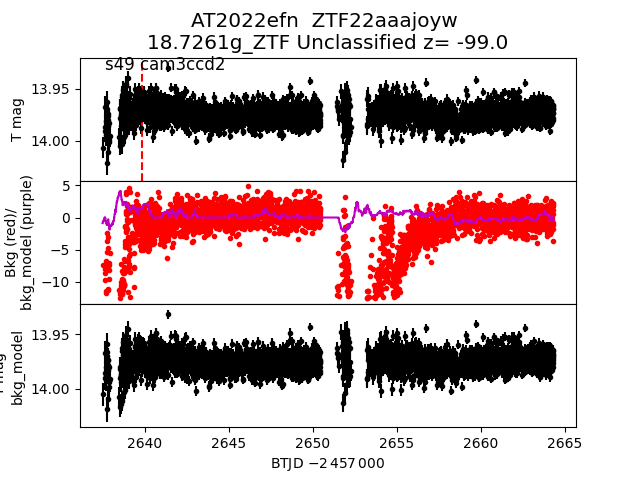
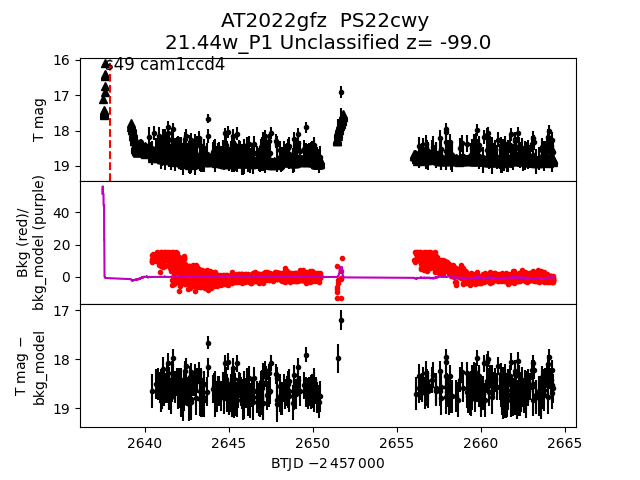
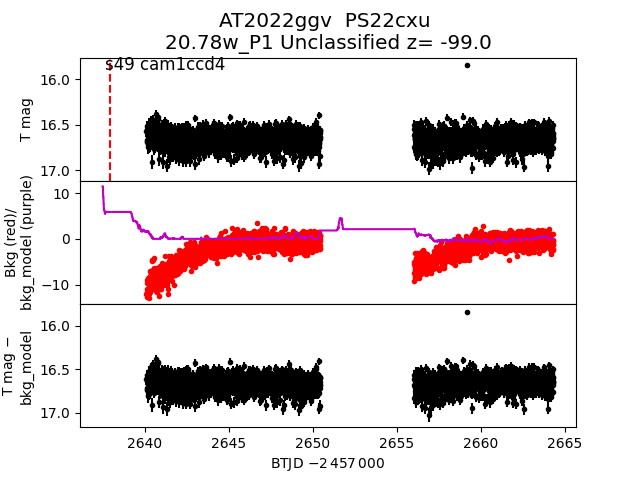
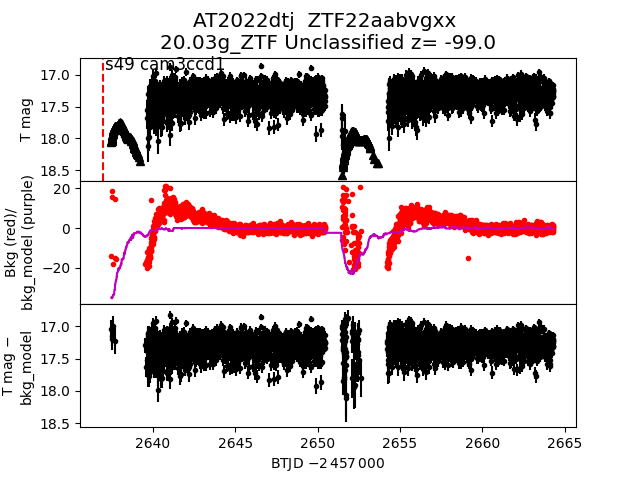
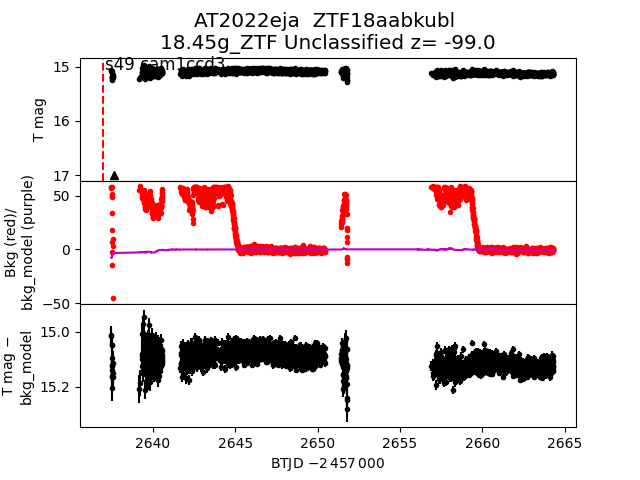
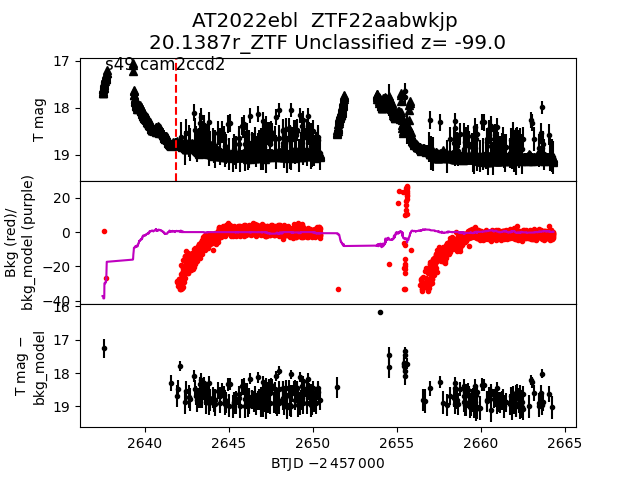
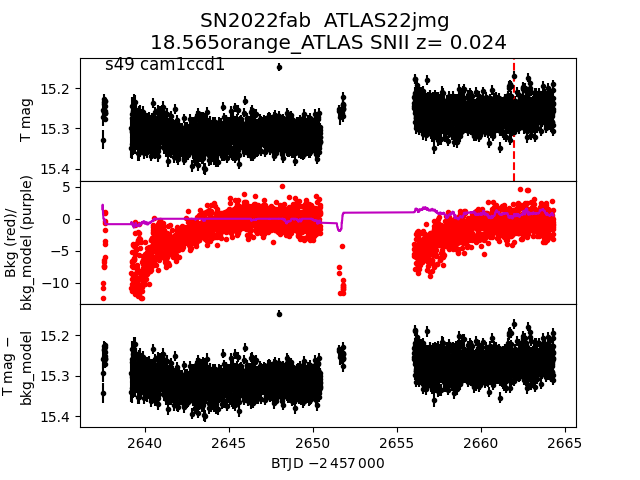
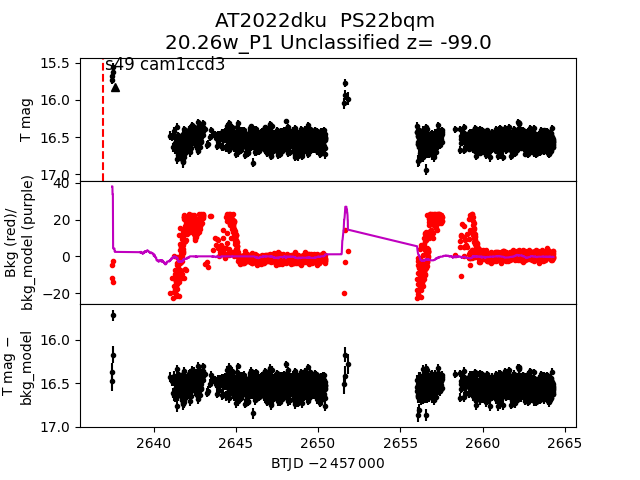
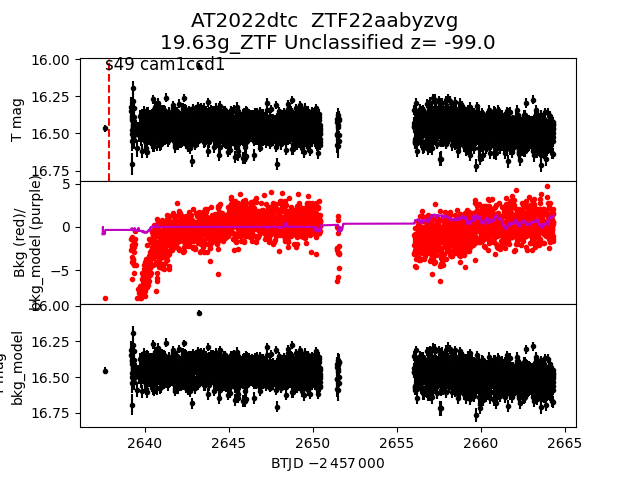
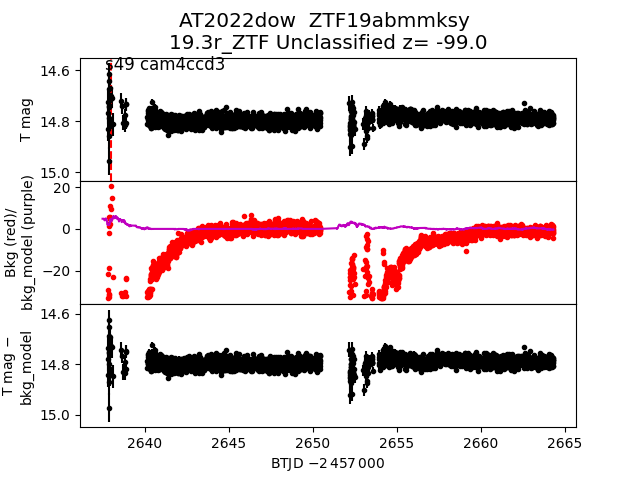
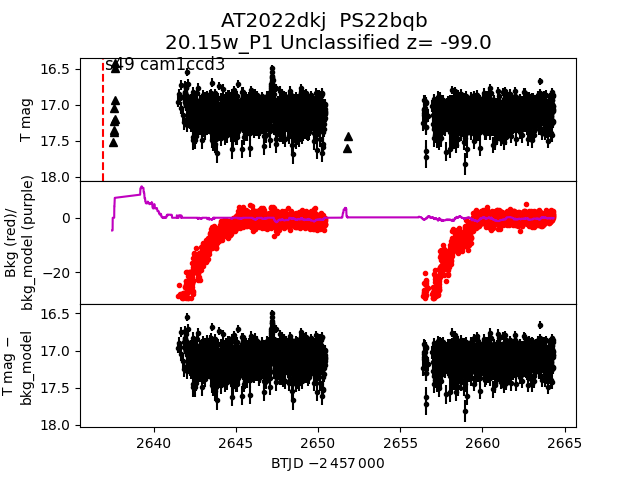
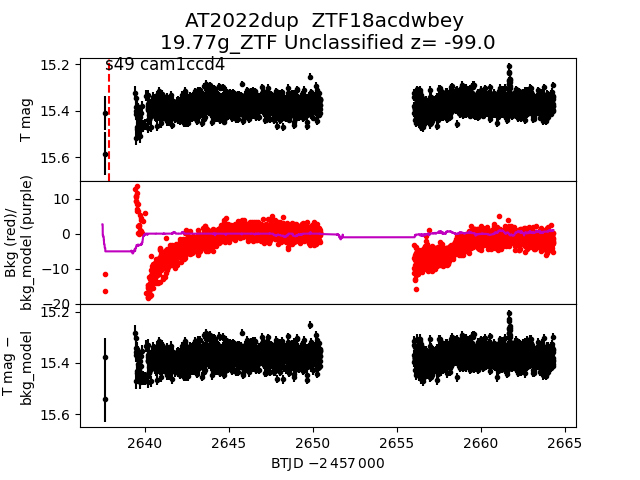
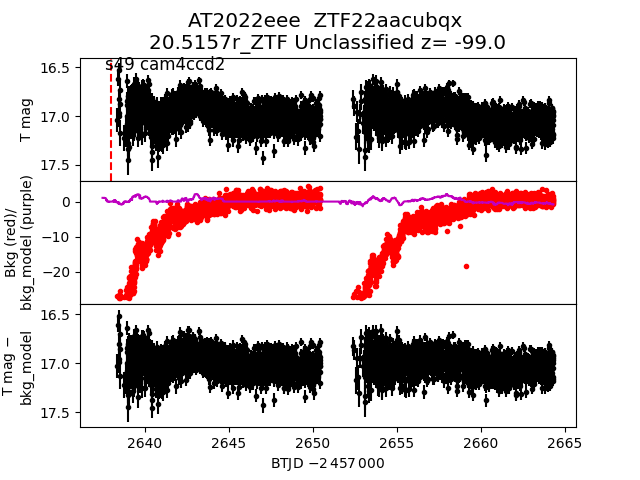
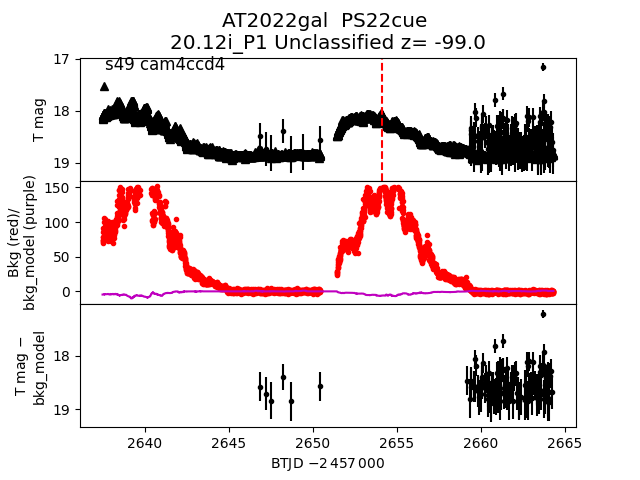
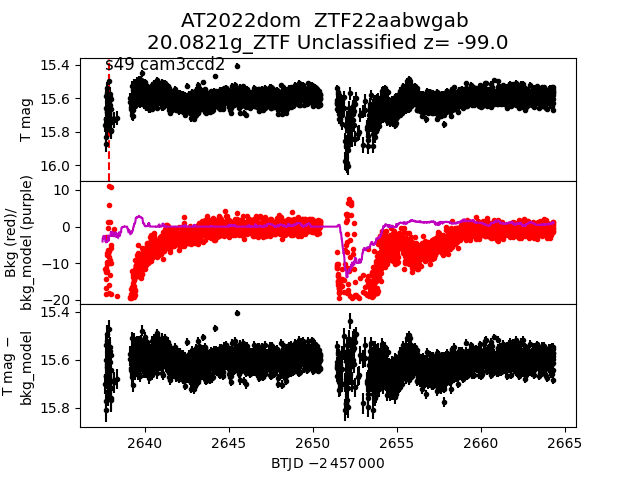
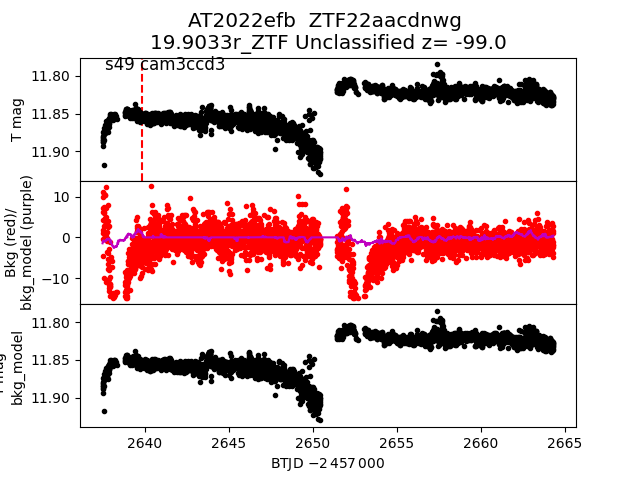
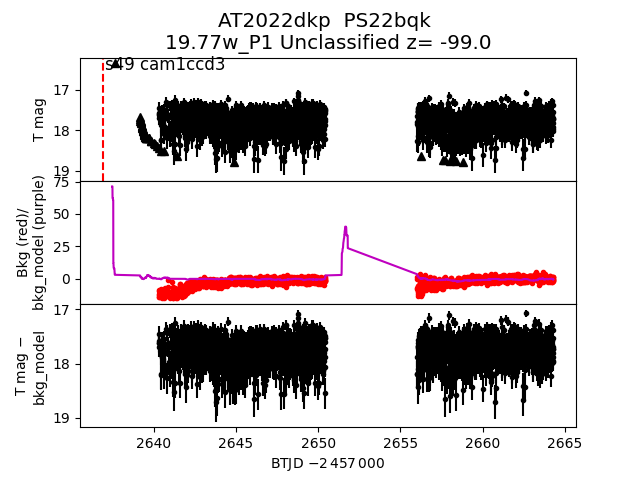
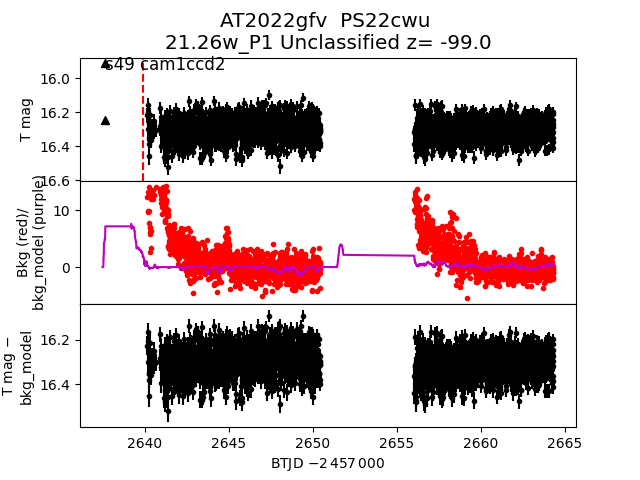
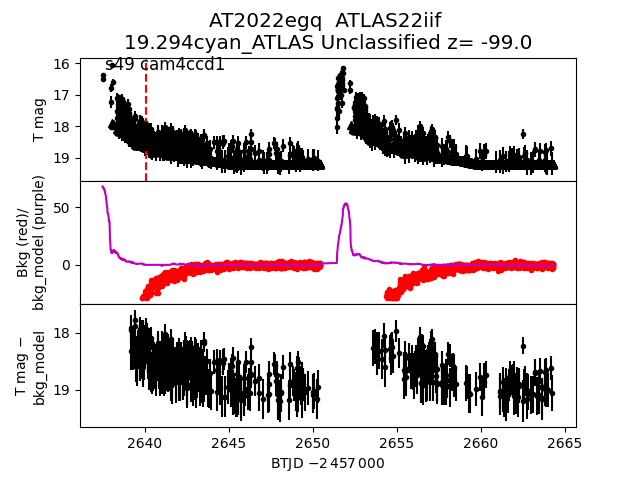
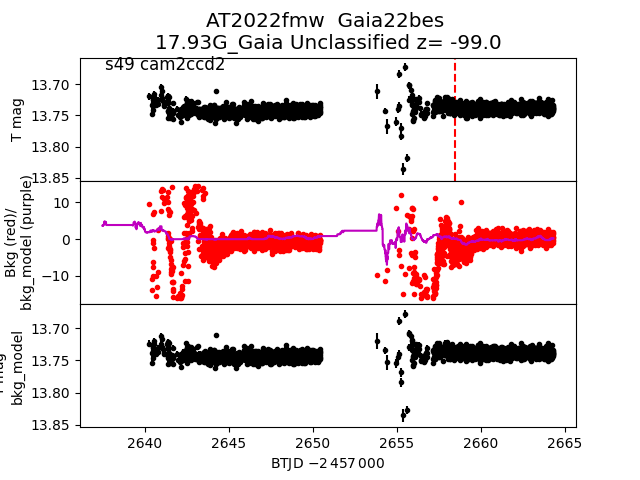
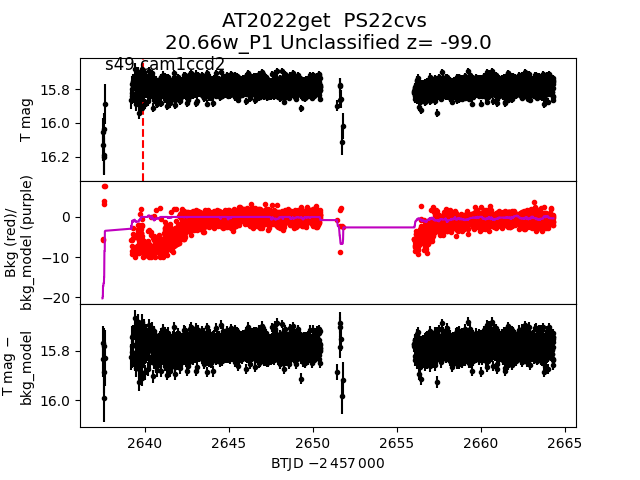
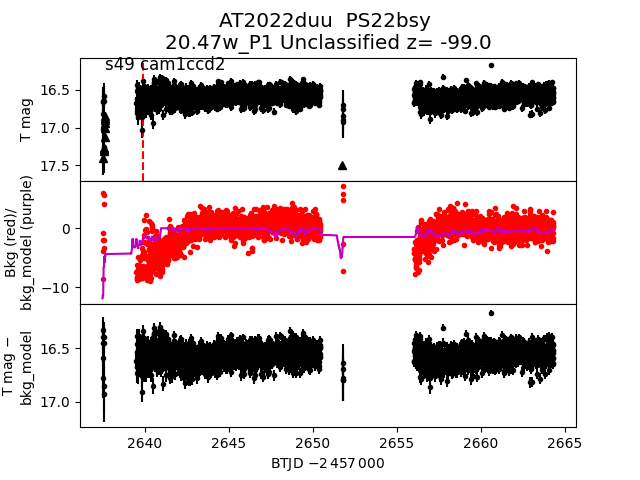
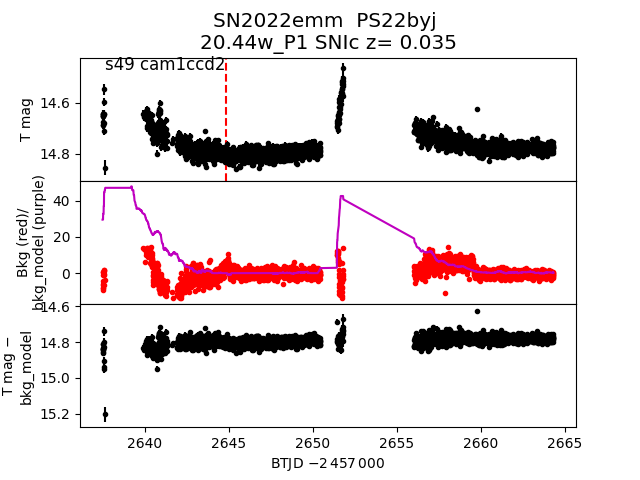
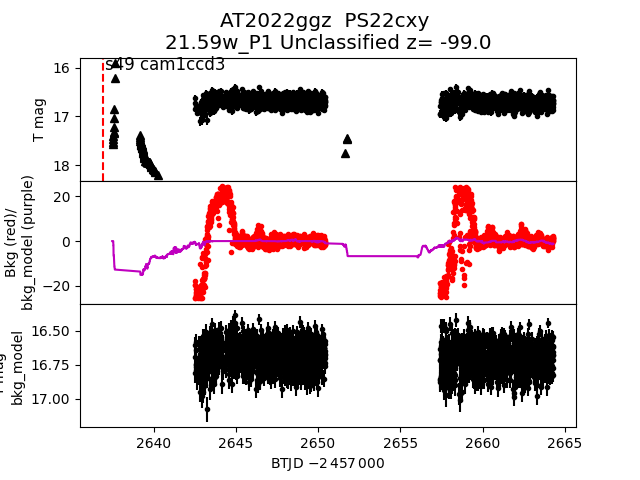
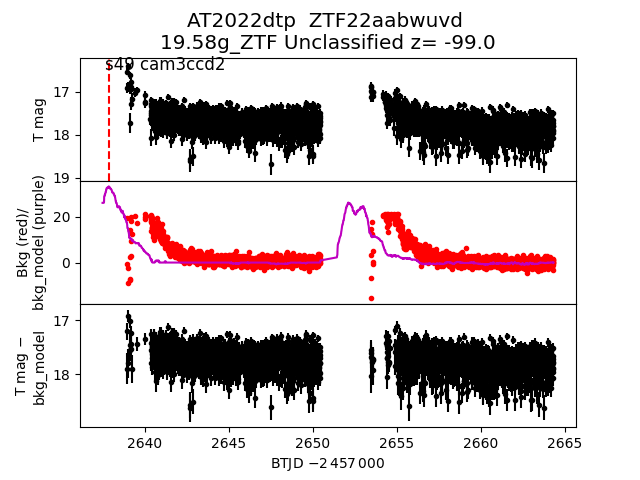
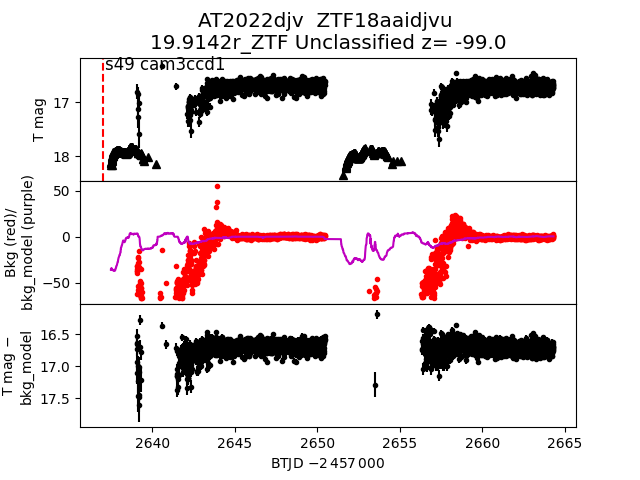
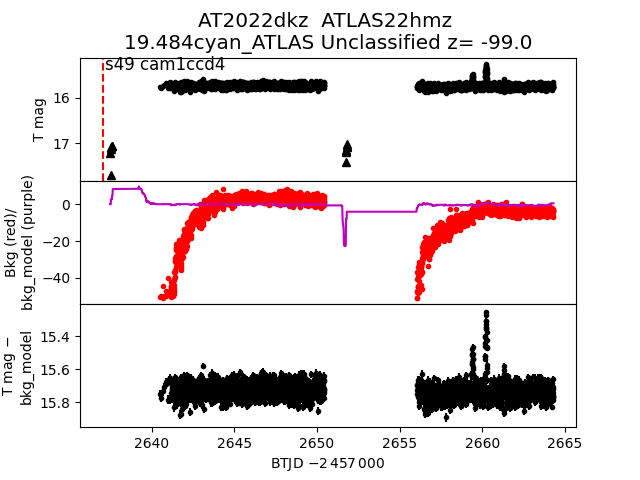
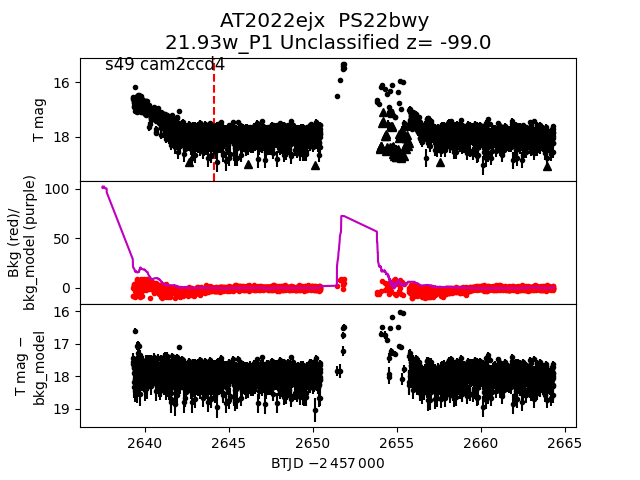
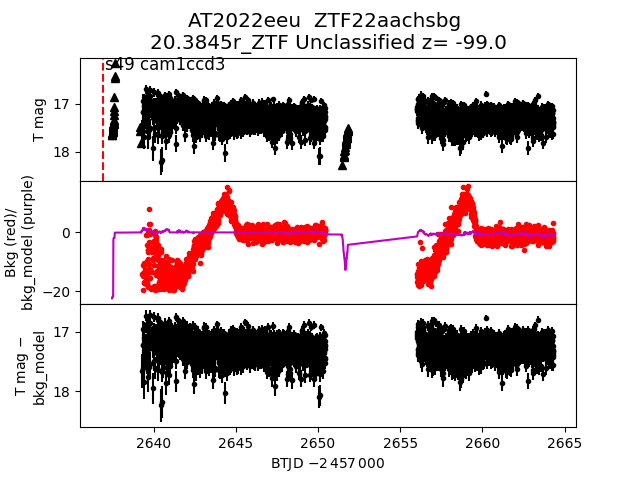
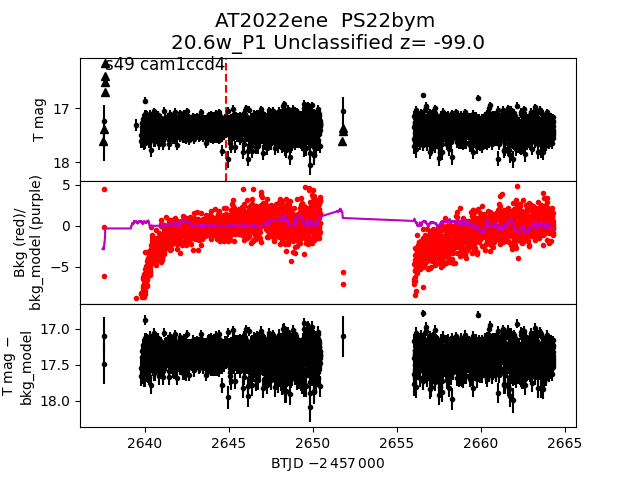
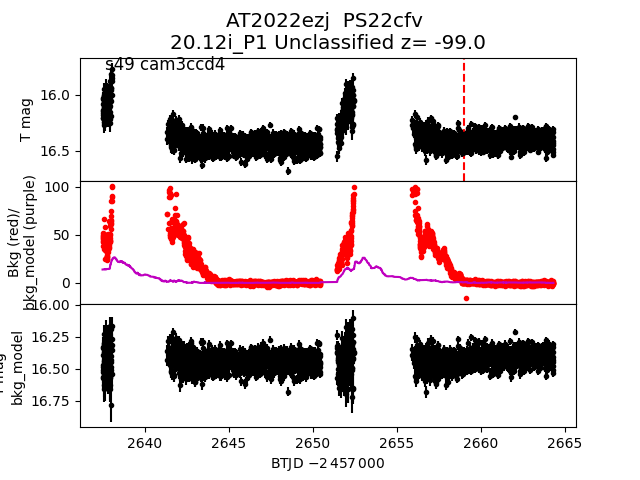
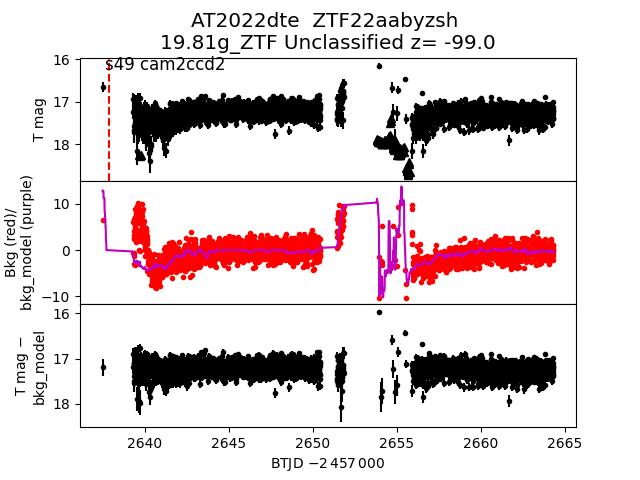
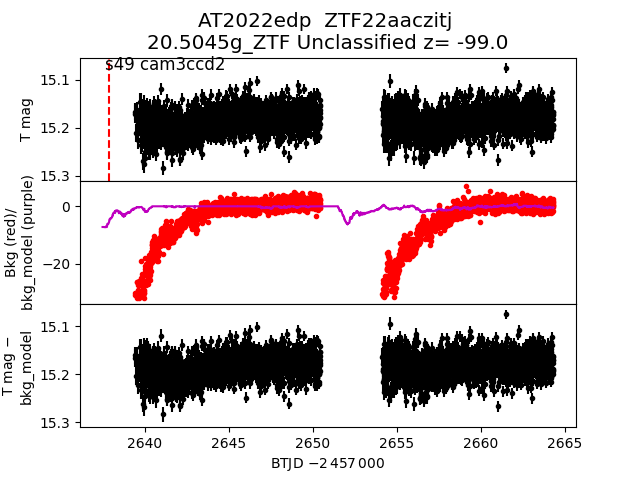
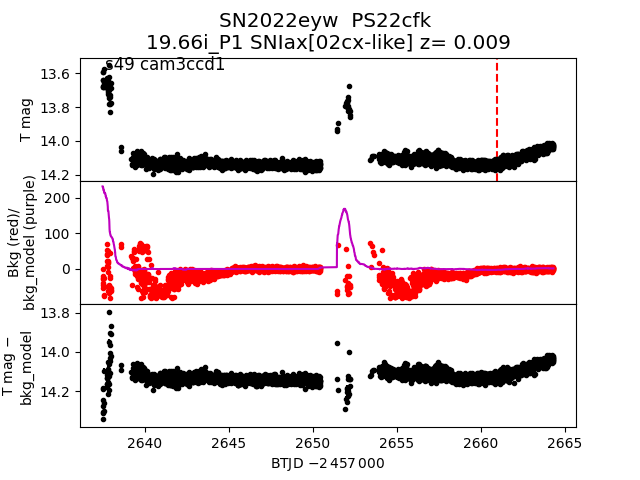
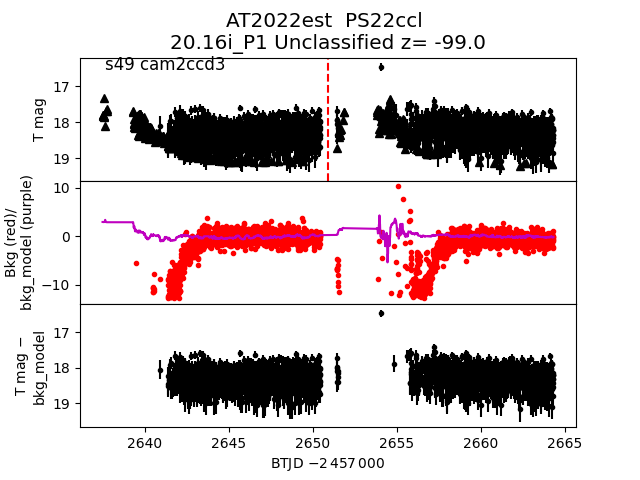
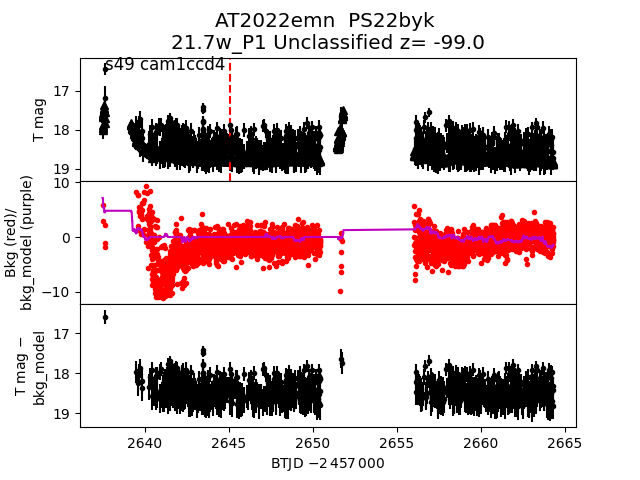
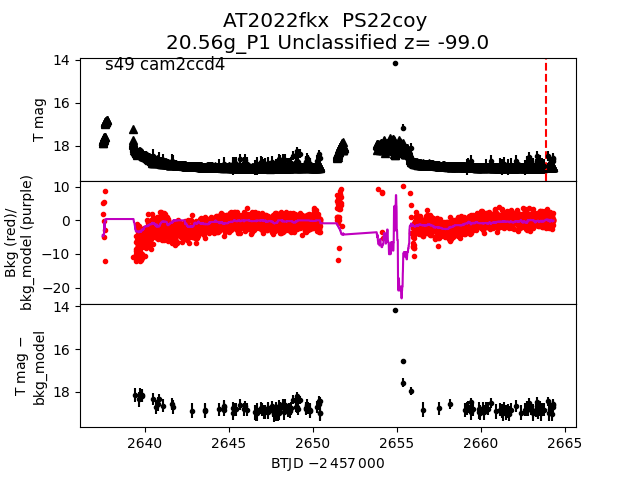
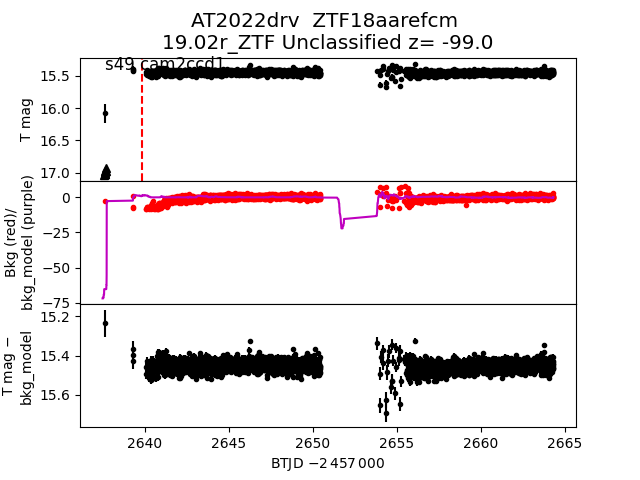
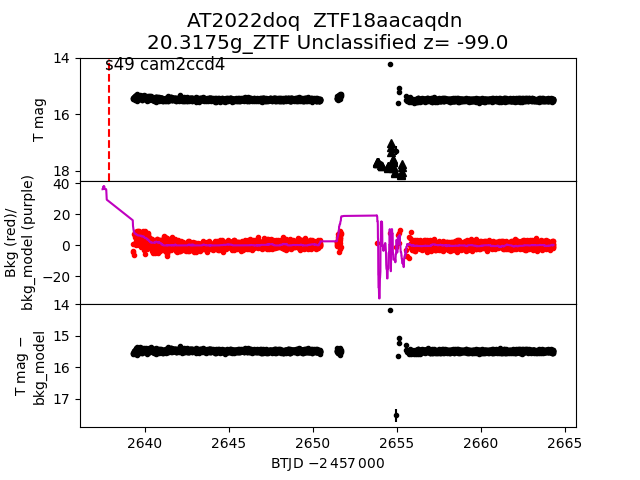
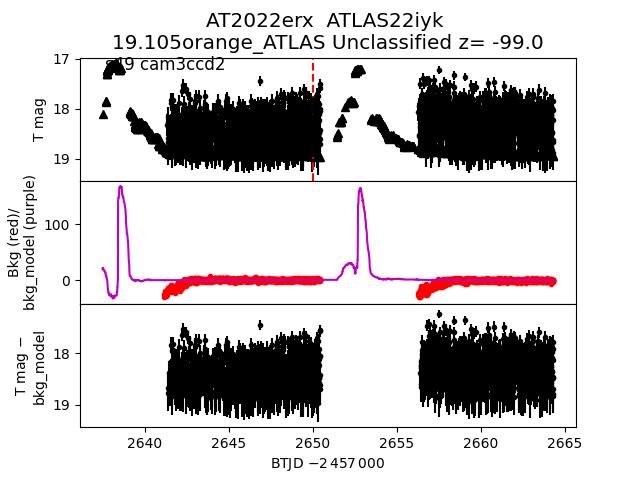
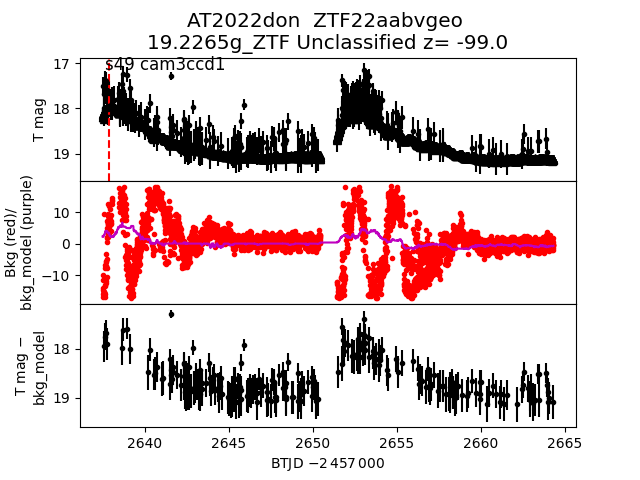
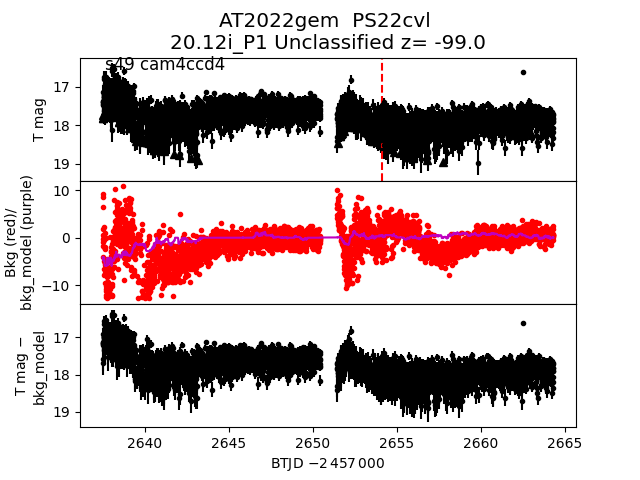
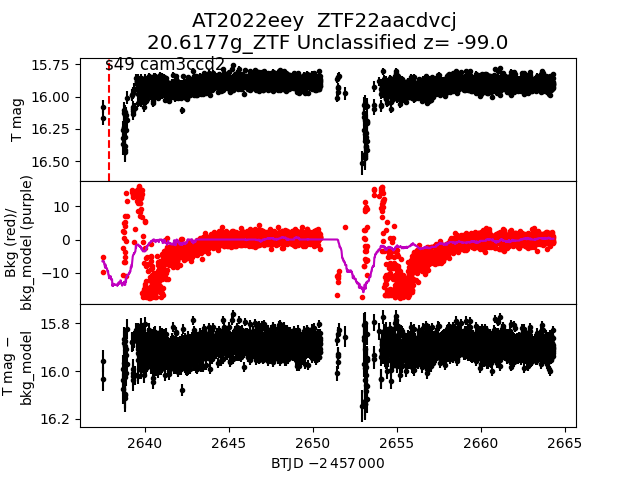
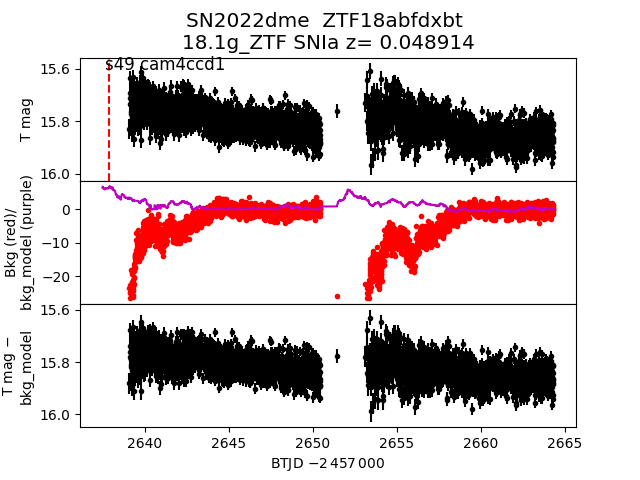
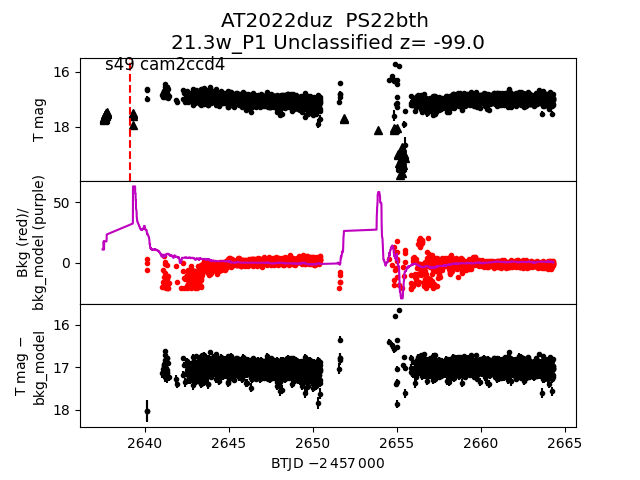
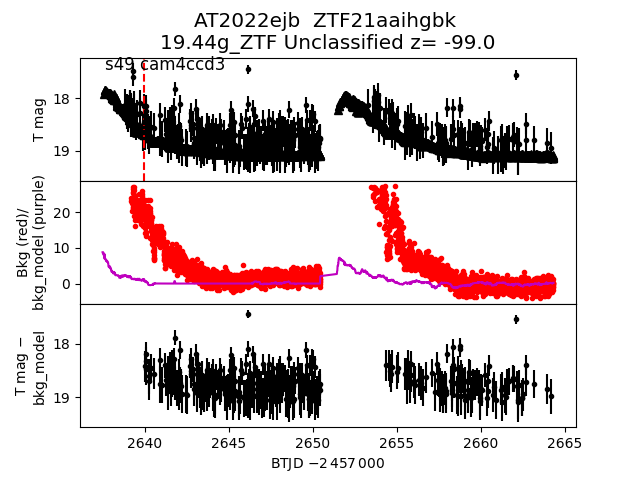
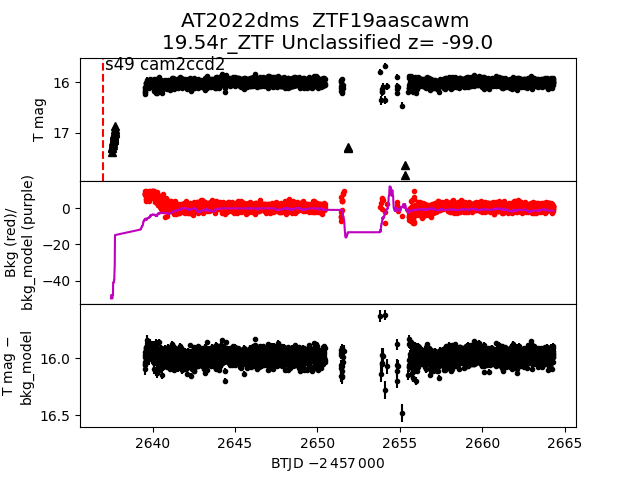
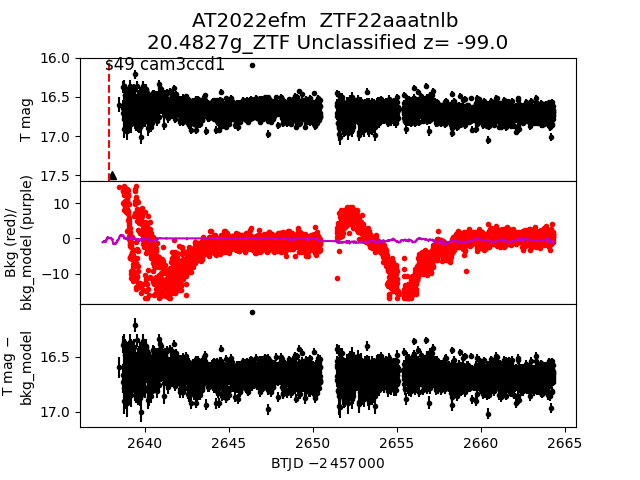
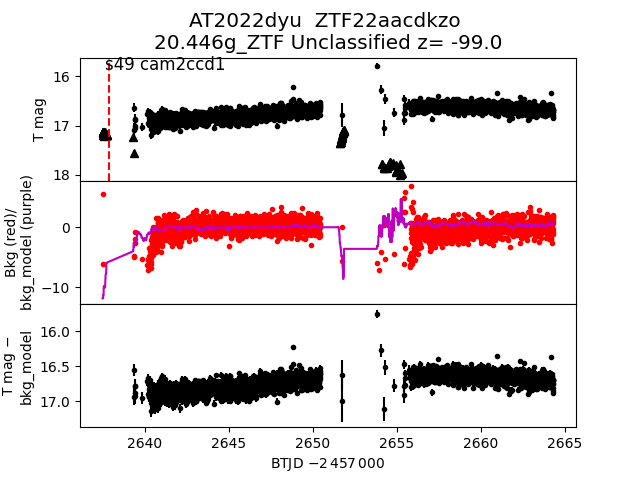
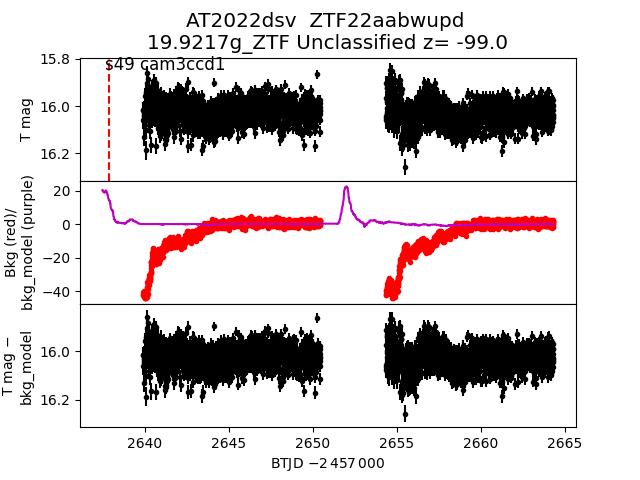
Each figure has three panels. The top panel shows the transient light curve, the middle panel shows the local background (estimated in an annulus), and the bottom panel shows a "background-model corrected" light curve. Details about the background model are in the README.
The vertical red line marks the time of discovery reported to TNS. Other useful metadata from TNS is in the figure title.
Note that the top and bottom panel are in magnitudes, while the middle panel is in differential flux units. The magnitudes are calibrated to the flux in the reference image used for image subtraction. Thus, flux from the host galaxy is included in these magnitudes.
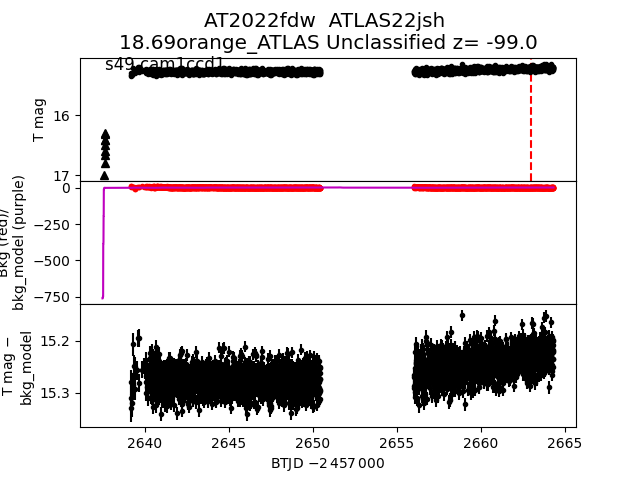
3-sigma upper limits are plotted as triangles with no errorbars. A typical limiting magnitude is 19.6 in 30 minutes or 18.4 in 200 seconds (for low backgrounds).
The links allow you to download the light curve data as a text file.
More details in the README.
2022dhz
 2022efu
 2022dii
 2022doe
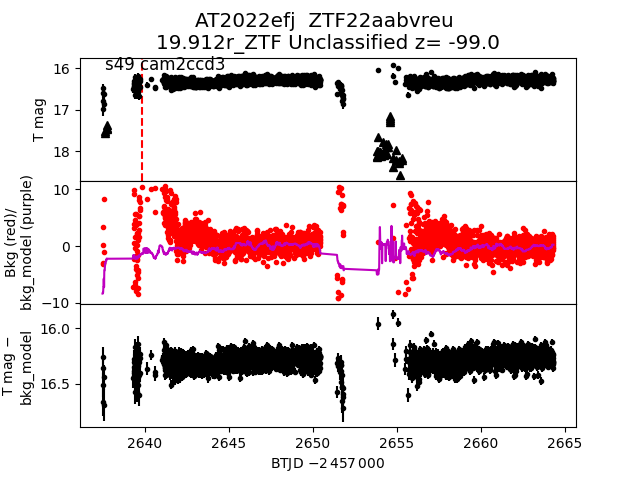
 2022efj
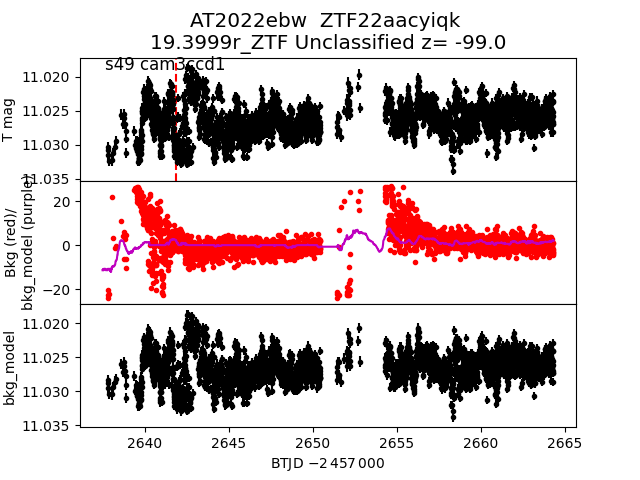
 2022ebw
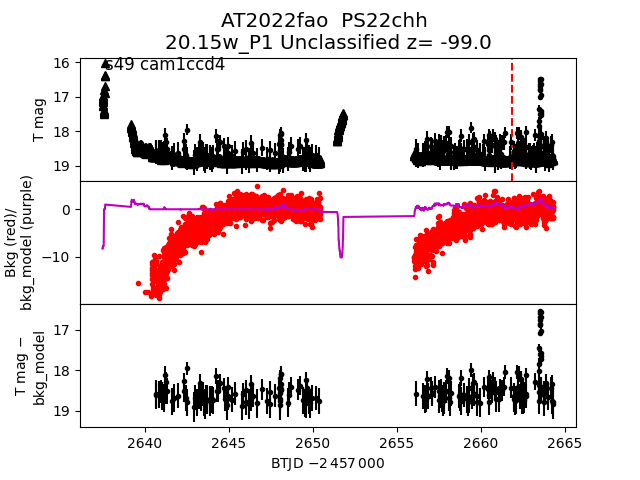
 2022fao
 2022drt
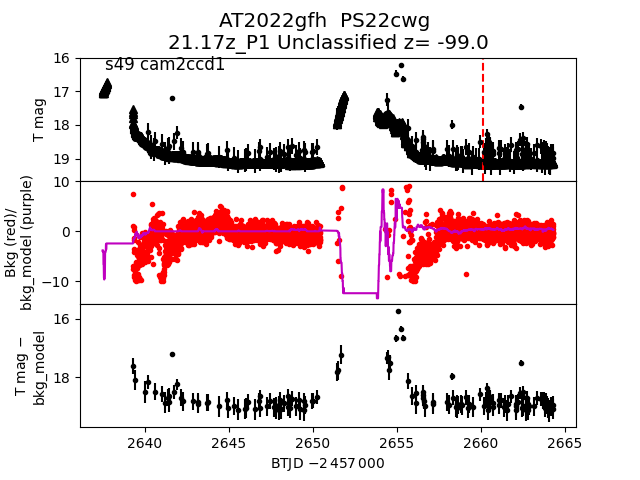
 2022gfh
 2022fdw
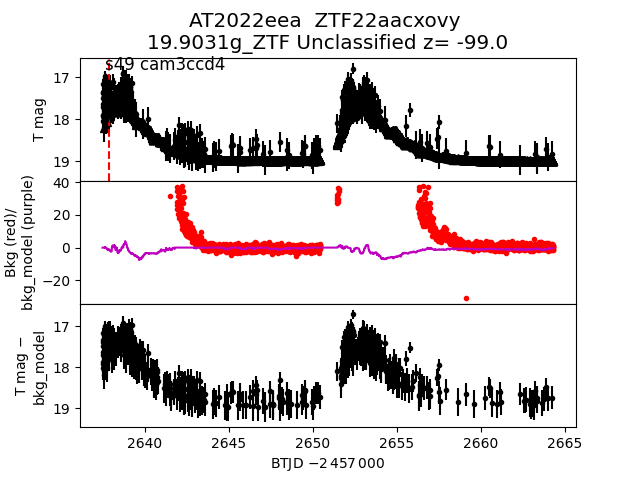
 2022eea
 2022fpn
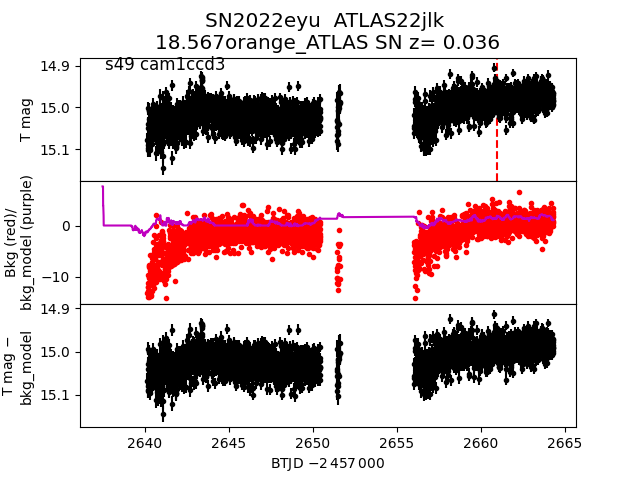
 2022eyu
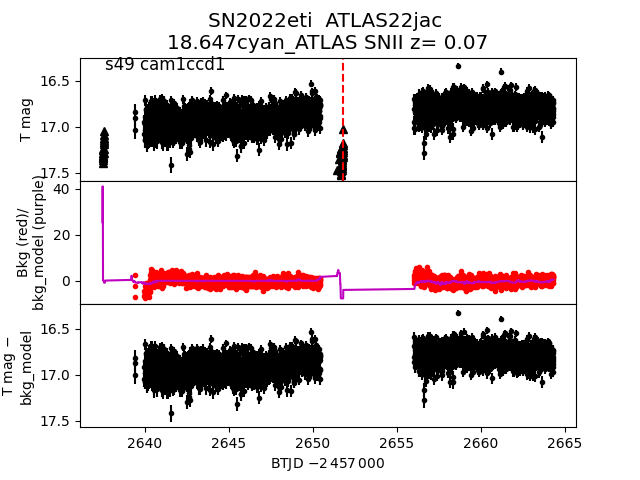
 2022eti
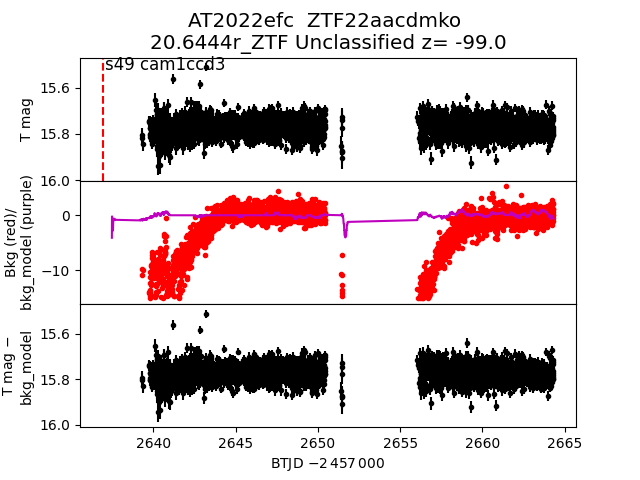
 2022efc
 2022exy
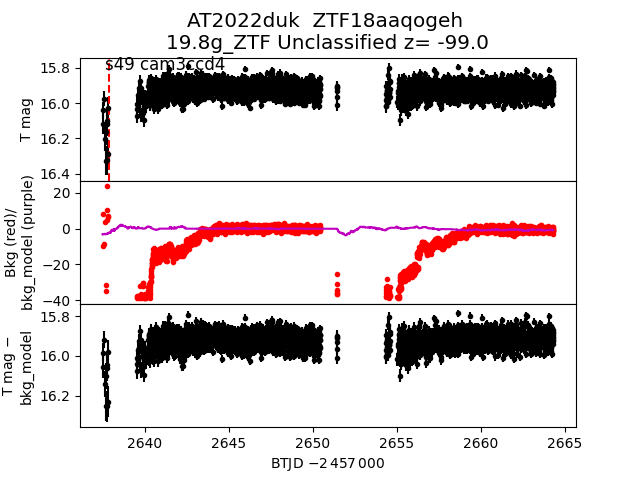
 2022duk
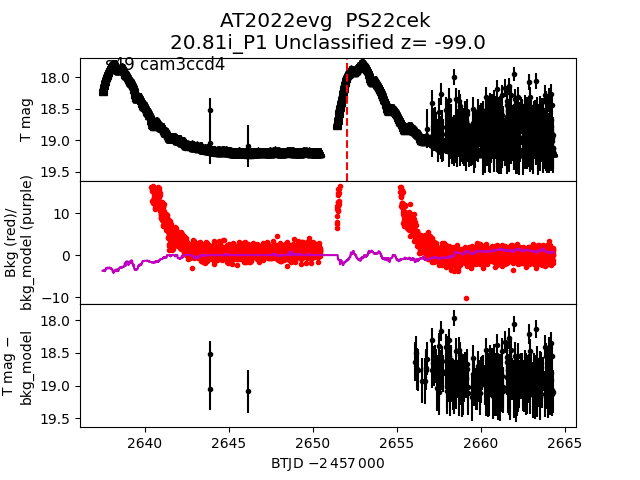
 2022evg
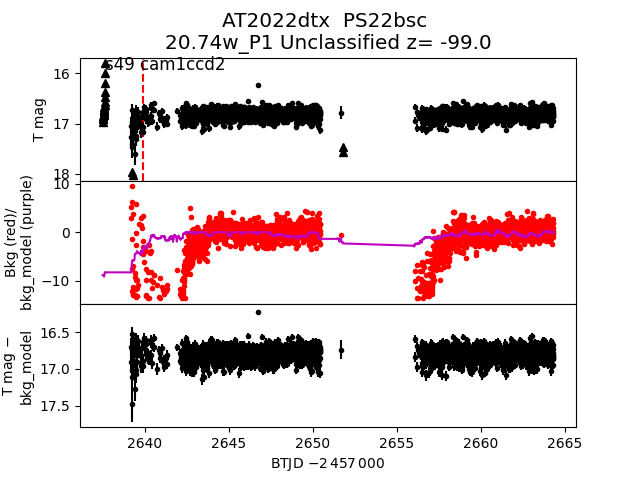
 2022dtx
 2022dsx
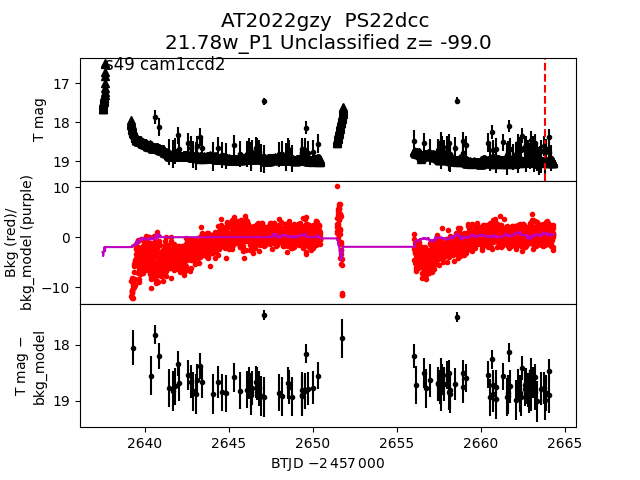
 2022gzy
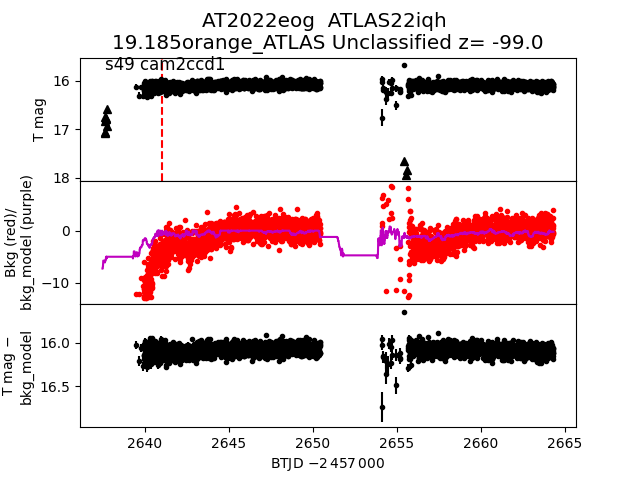
 2022eog
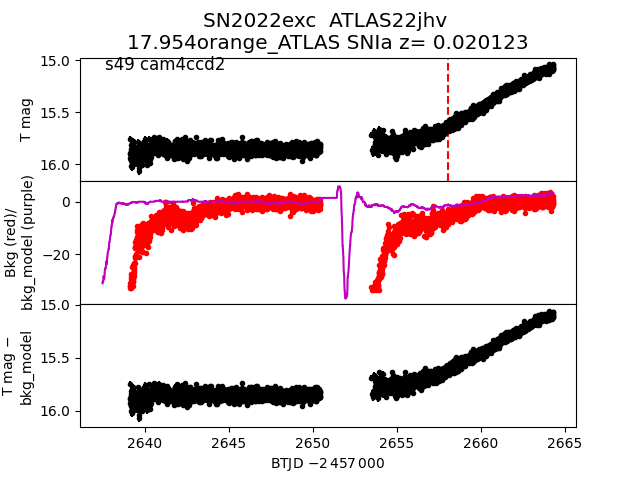
 2022exc
 2022gep
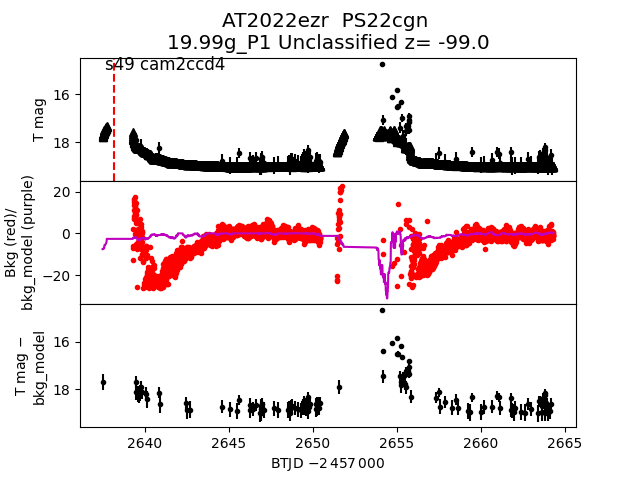
 2022ezr
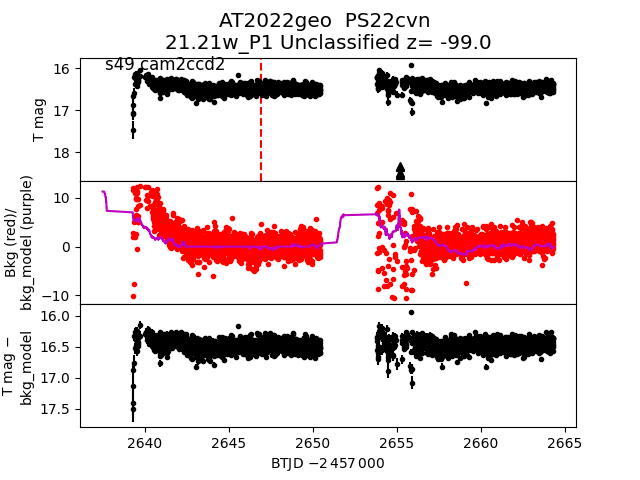
 2022geo
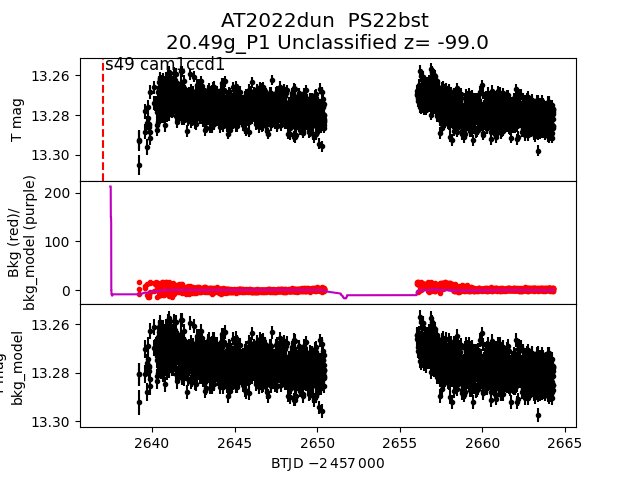
 2022dun
 2022eyy
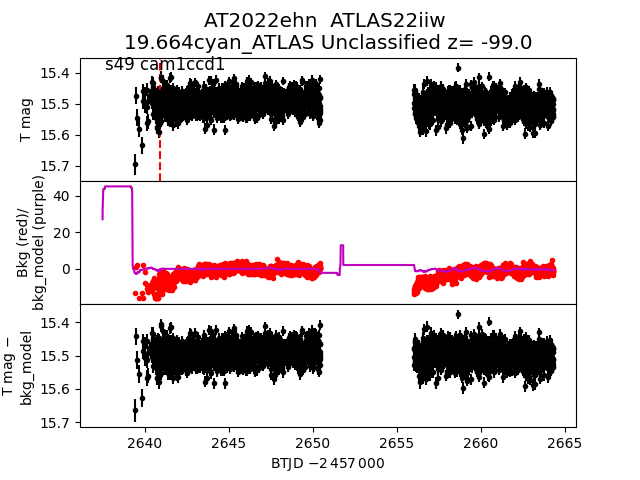
 2022ehn
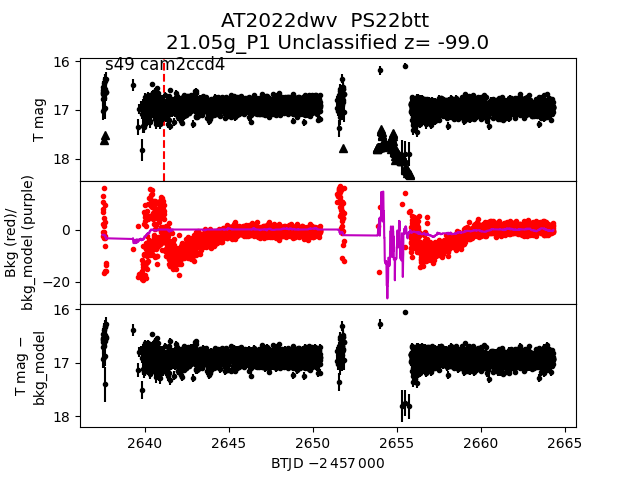
 2022dwv
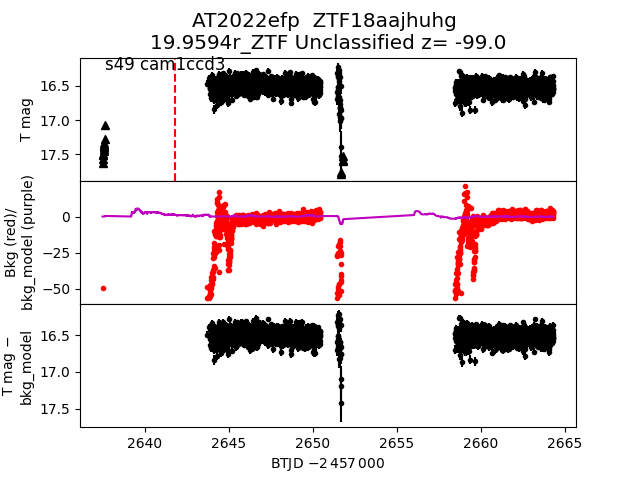
 2022efp
 2022ebm
 2022dtt
 2022ehq
 2022dst
 2022ghe
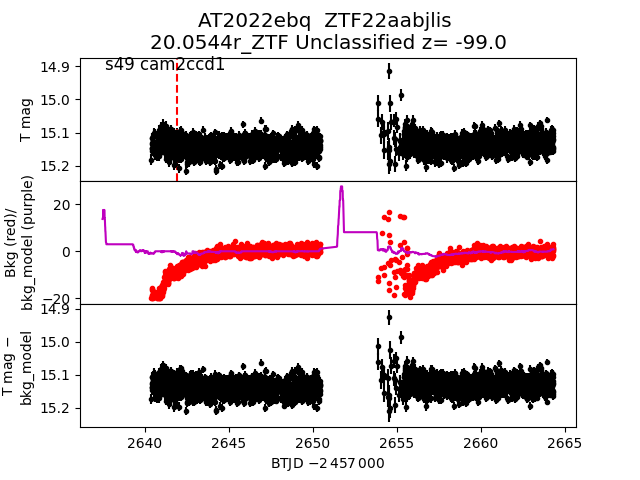
 2022ebq
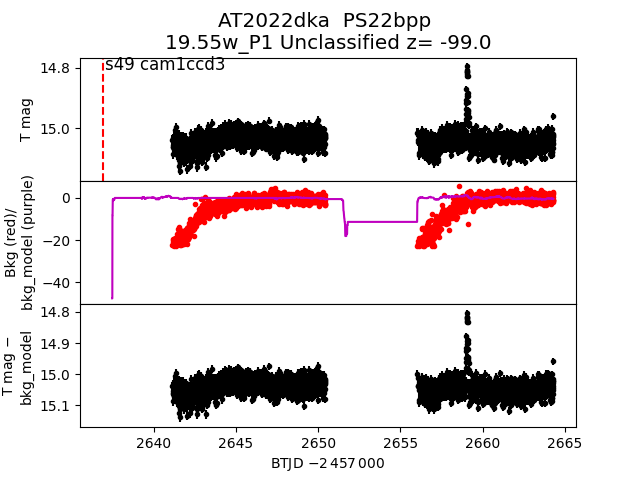
 2022dka
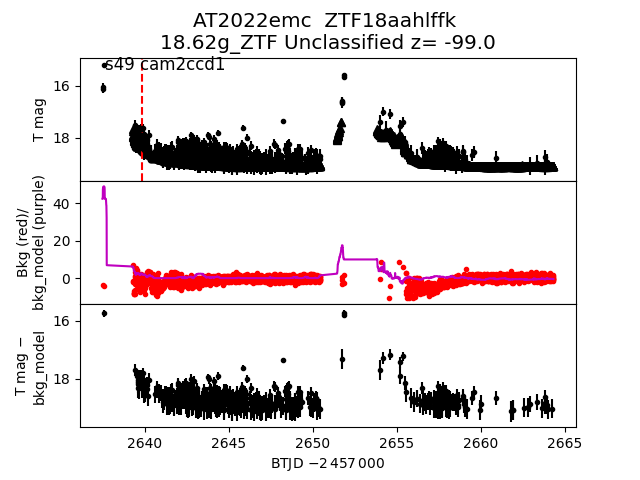
 2022emc
 2022een
 2022euj
 2022eex
 2022doj
 2022egv
 2022eqa
 2022dft
 2022edk
 2022eaz
 2022emj
 2022ely
 2022dta
 2022ery
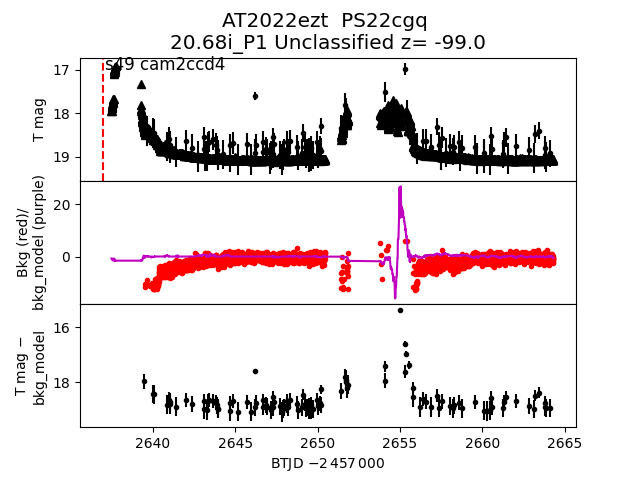
 2022ezt
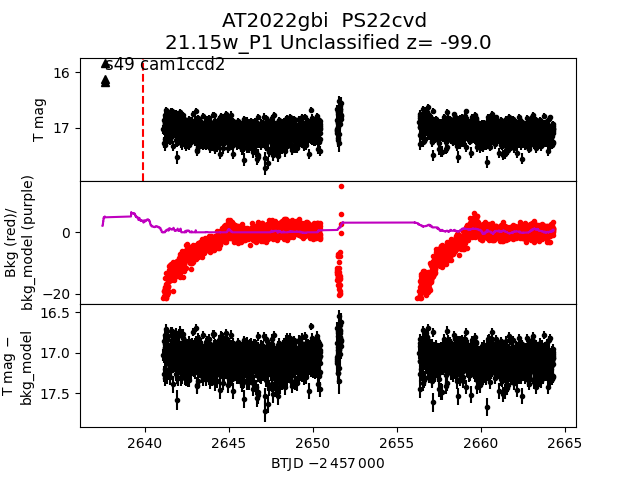
 2022gbi
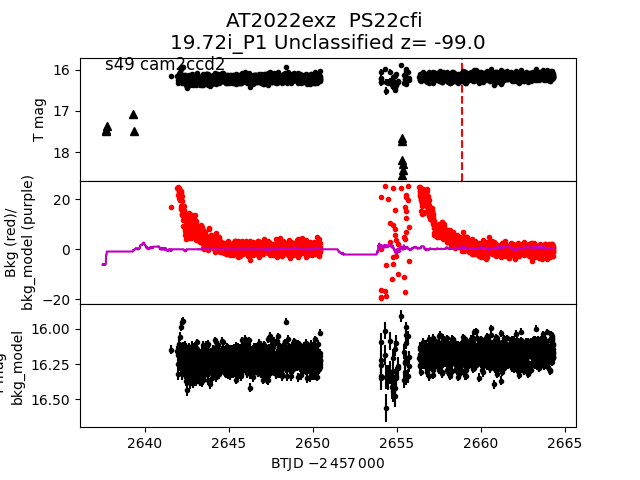
 2022exz
 2022enm
 2022eoa
 2022duw
 2022dhy
 2022dnr
 2022evj
 2022gaz
 2022ees
 2022efn
 2022gfz
 2022ggv
 2022dtj
 2022eja
 2022ebl
 2022fab
 2022dku
 2022dtc
 2022dow
 2022dkj
 2022dup
 2022eee
 2022gal
 2022dom
 2022efb
 2022dkp
 2022gfv
 2022egq
 2022fmw
 2022get
 2022duu
 2022emm
 2022ggz
 2022dtp
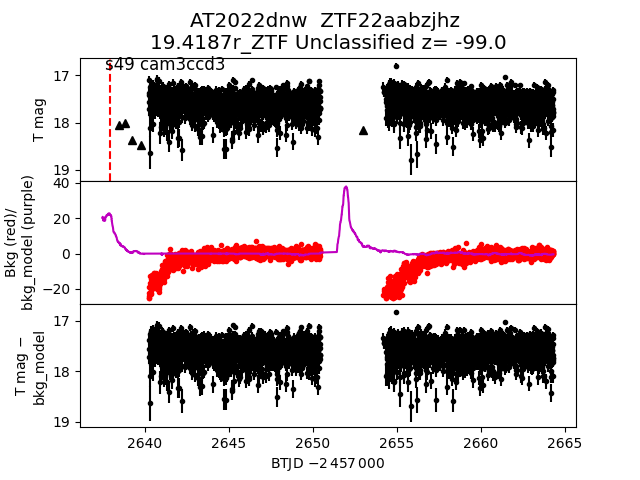
 2022dnw
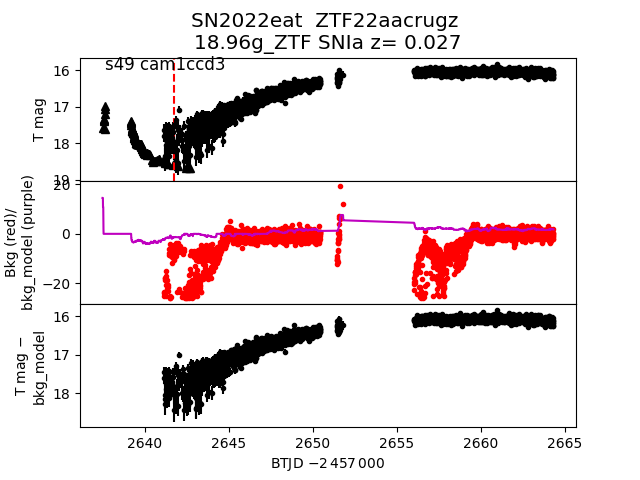
 2022eat
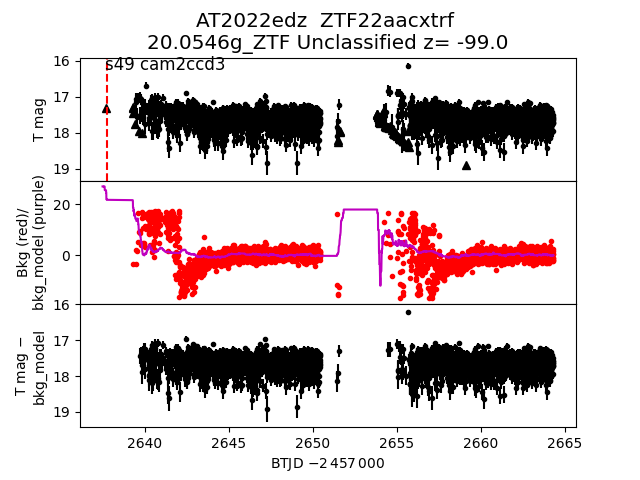
 2022edz
 2022djv
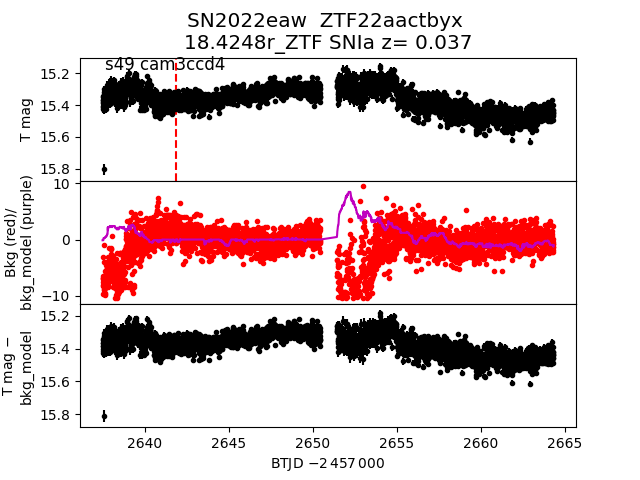
 2022eaw
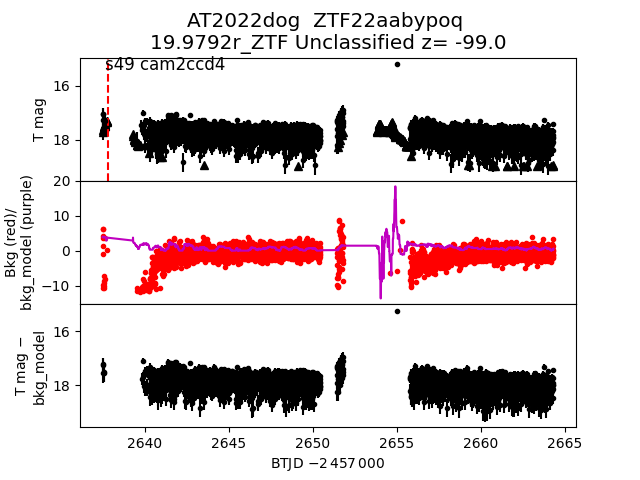
 2022dog
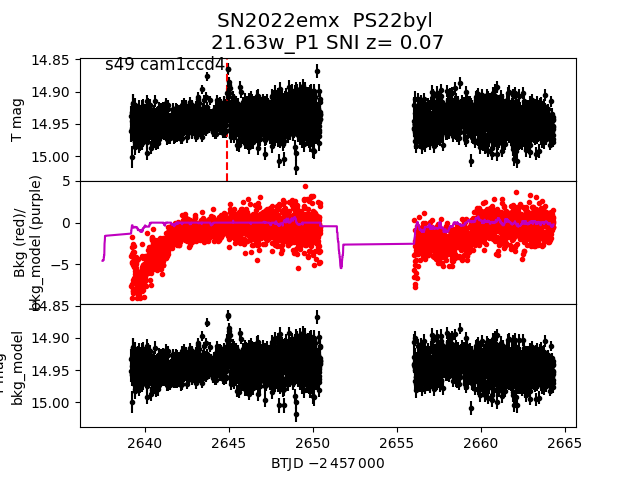
 2022emx
 2022dkz
 2022ejx
 2022eeu
 2022ene
 2022ezj
 2022dte
 2022edp
 2022eyw
 2022est
 2022emn
 2022fkx
 2022drv
 2022doq
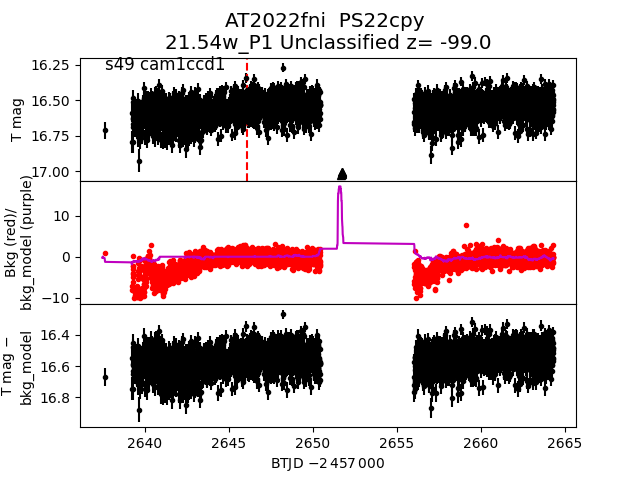
 2022fni
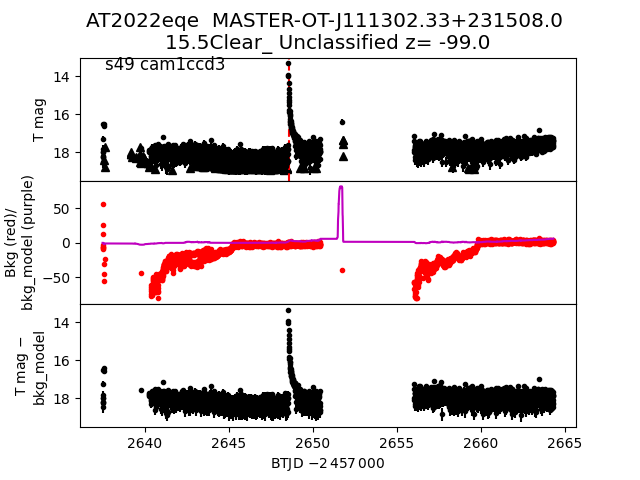
 2022eqe
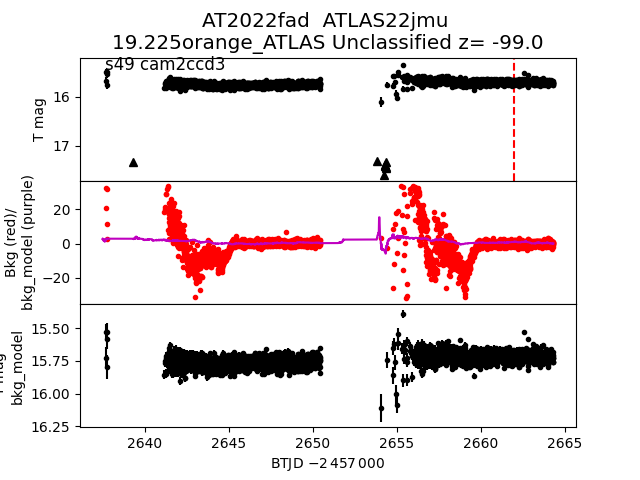
 2022fad
 2022erx
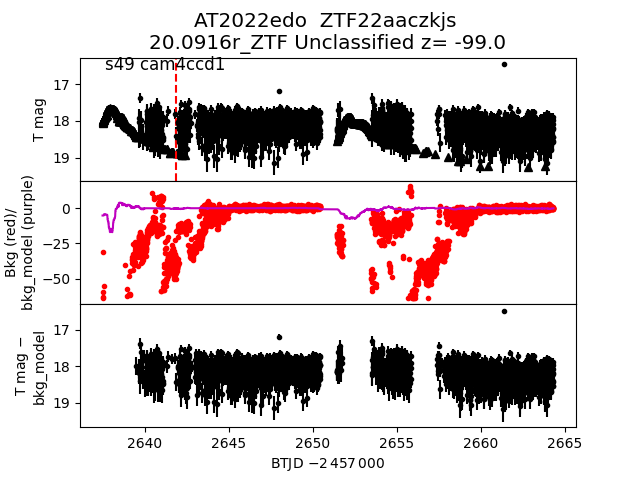
 2022edo
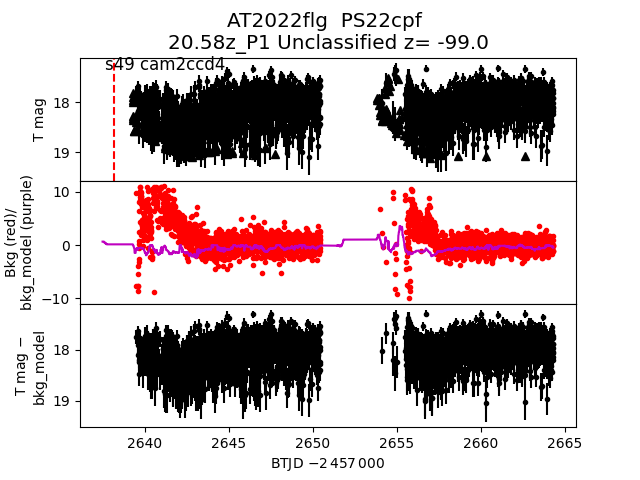
 2022flg
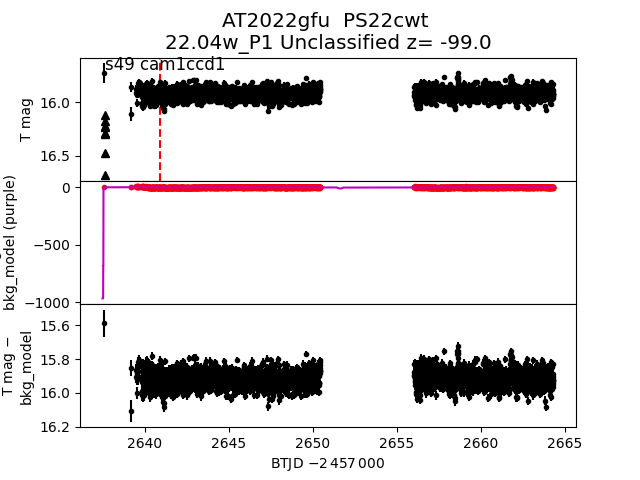
 2022gfu
 2022don
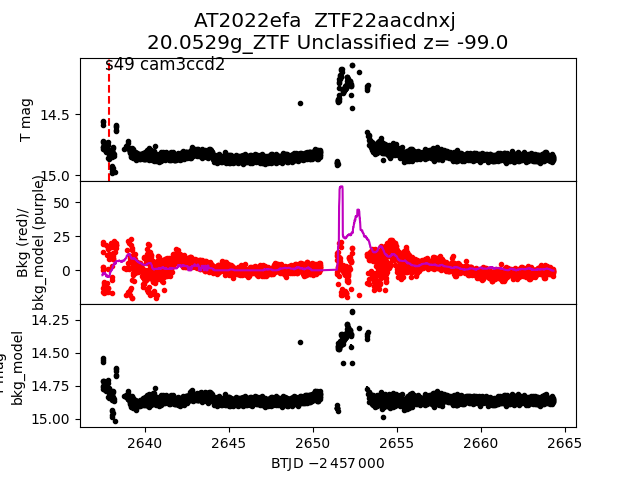
 2022efa
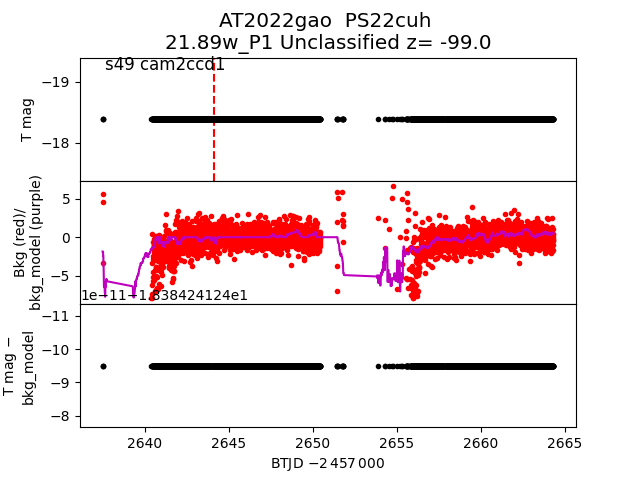
 2022gao
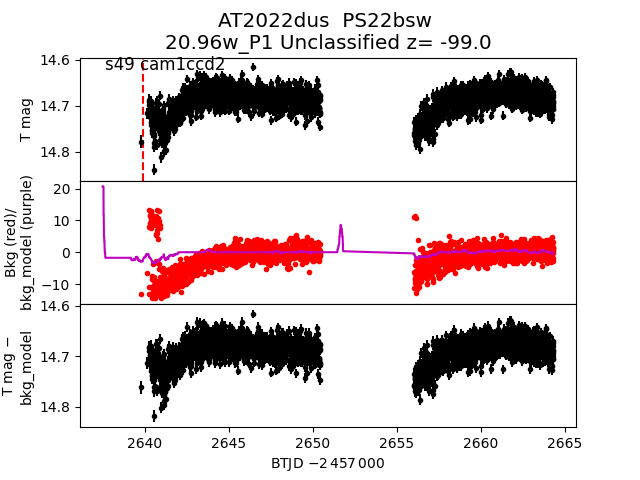
 2022dus
 2022gem
 2022eey
 2022dme
 2022duz
 2022ejb
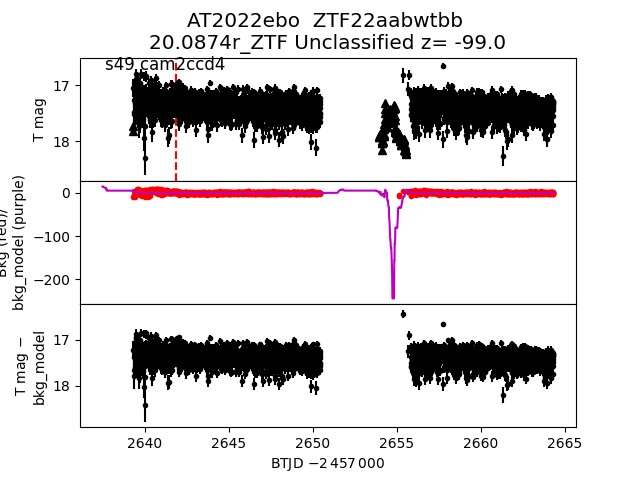
 2022ebo
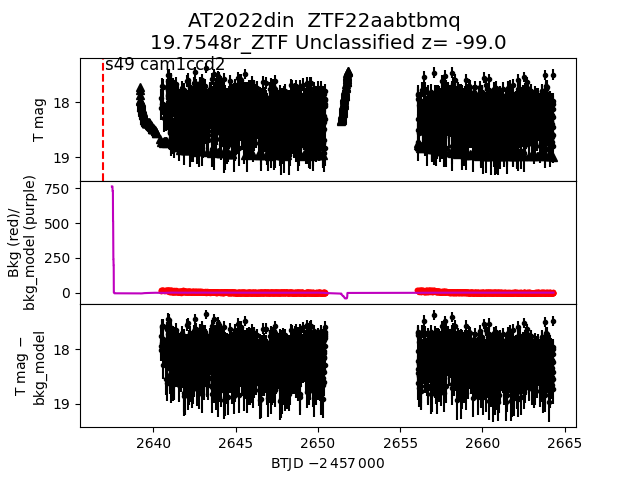
 2022din
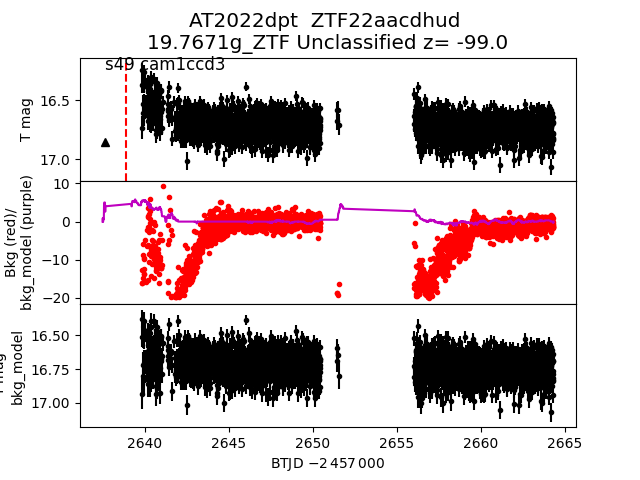
 2022dpt
 2022dms
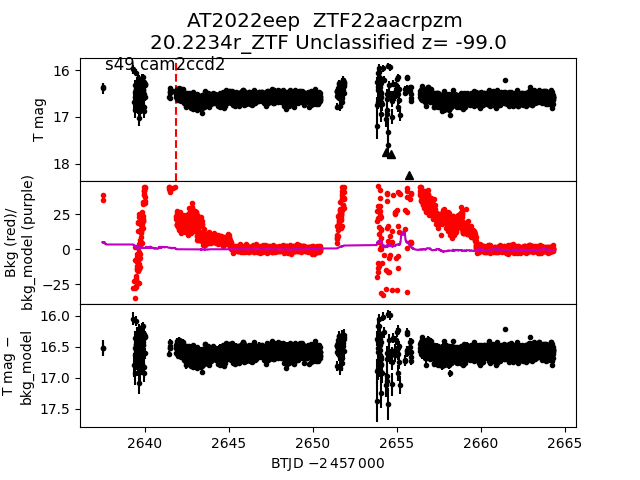
 2022eep
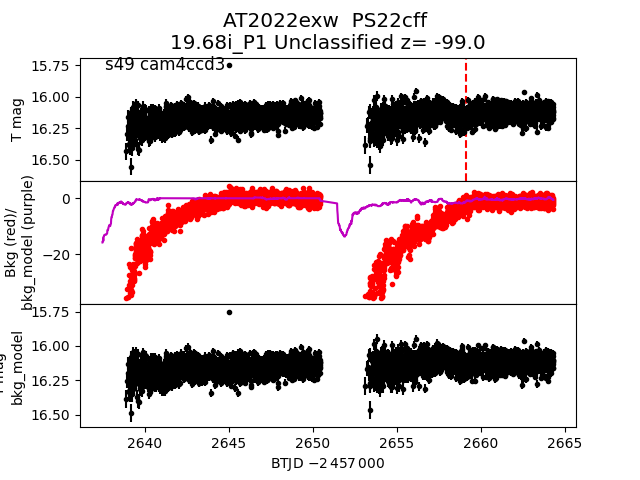
 2022exw
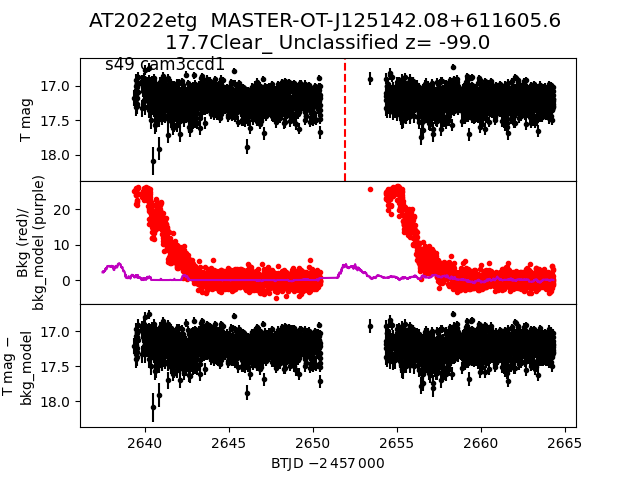
 2022etg
 2022efm
 2022dyu
 2022dsv
 2022evi