all transients in sector47 (119 total)
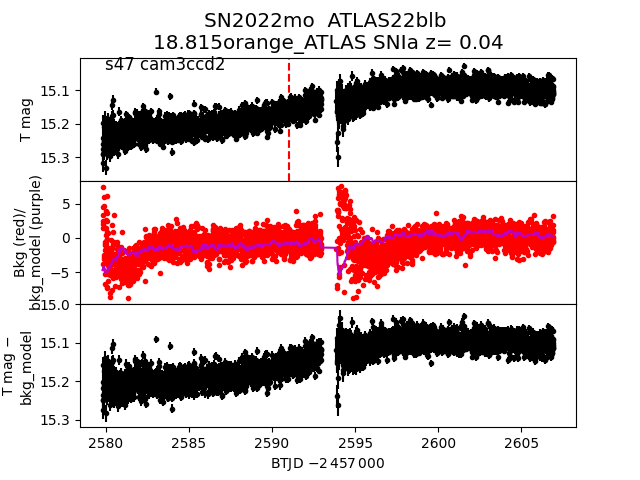
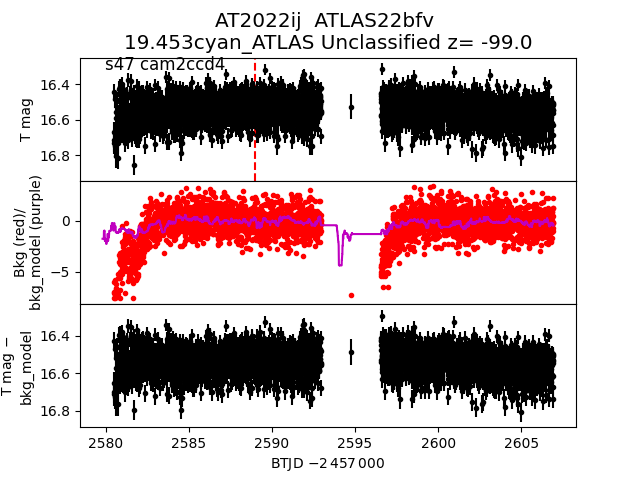
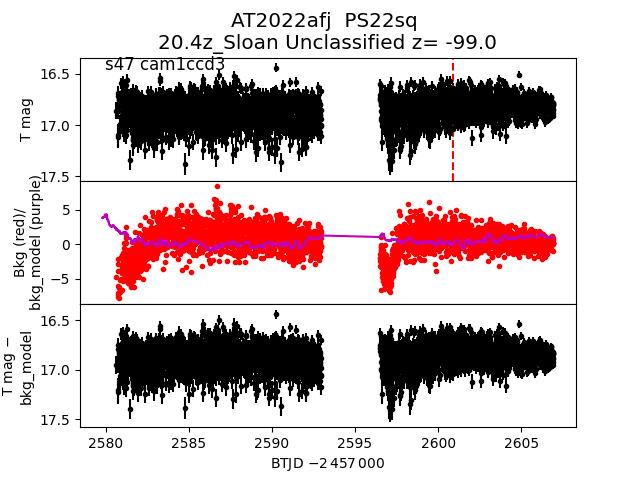
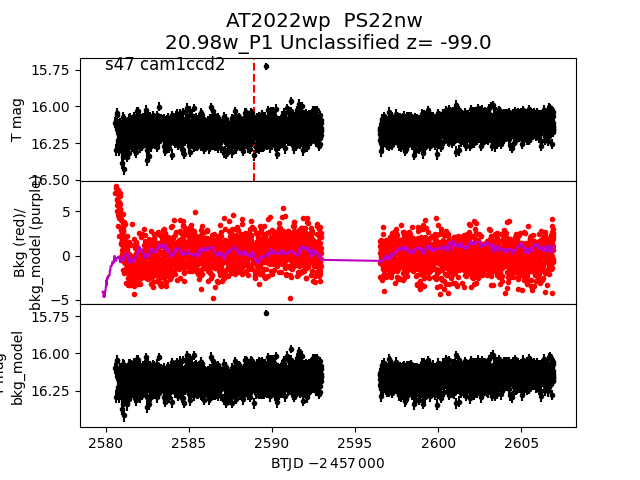
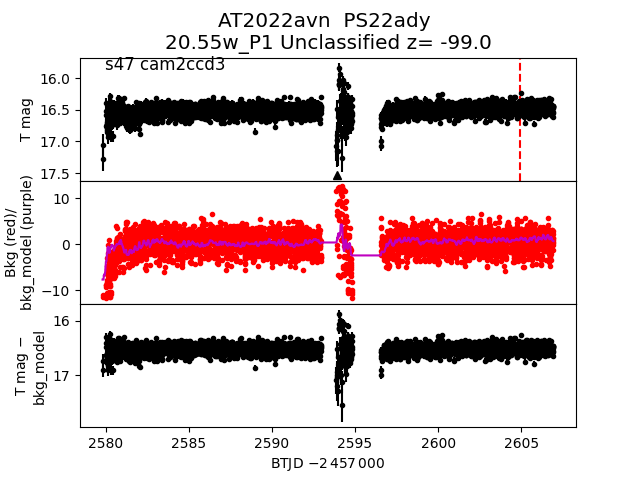
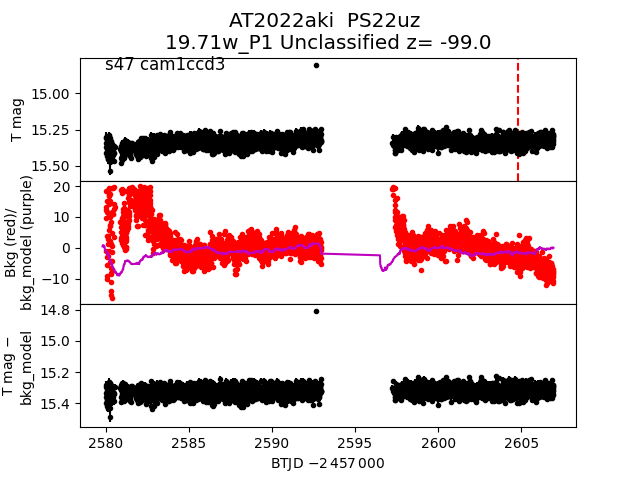
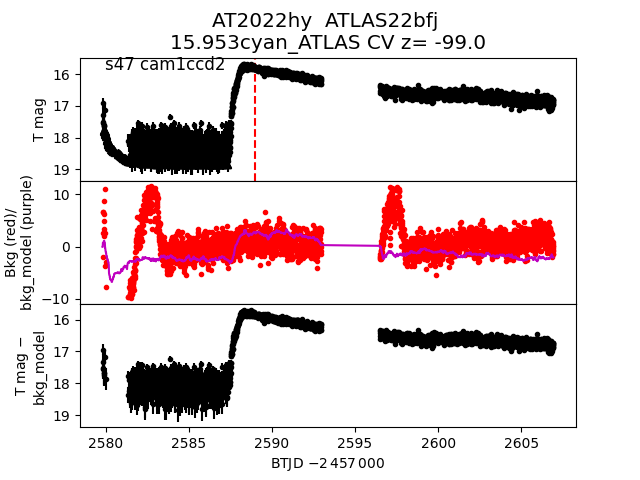
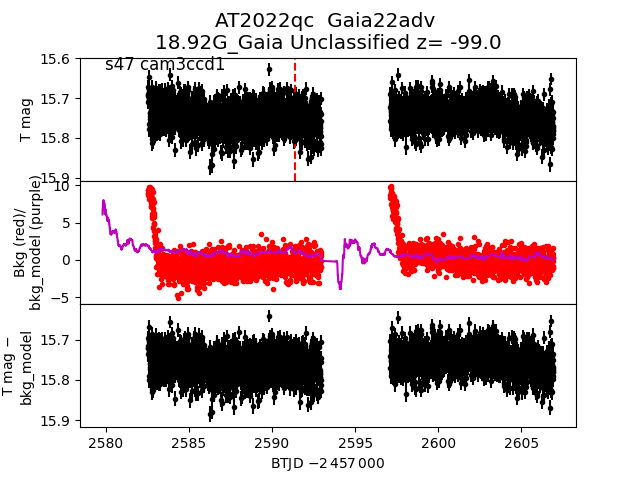
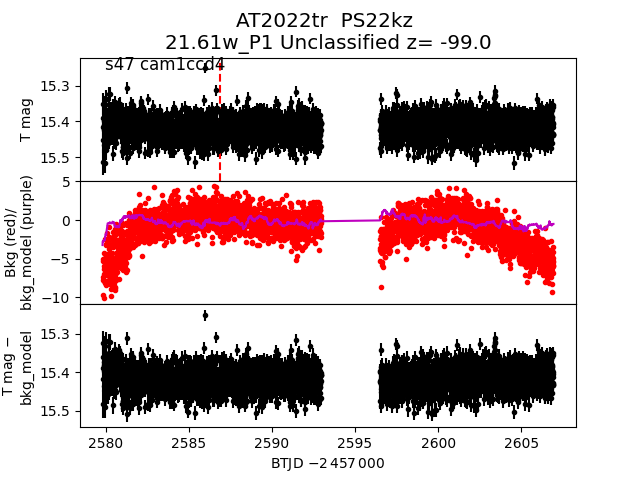
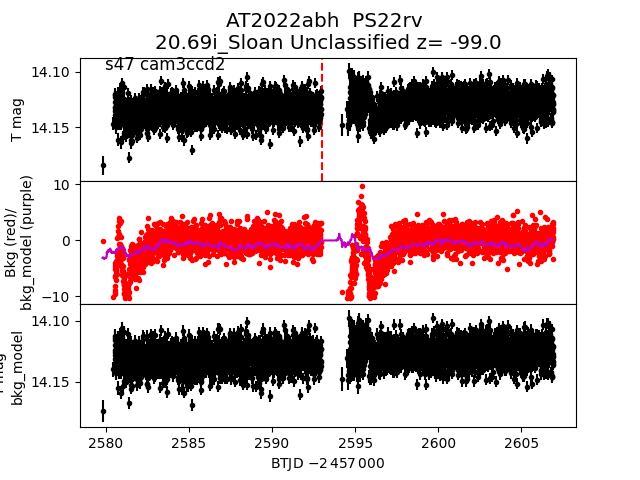
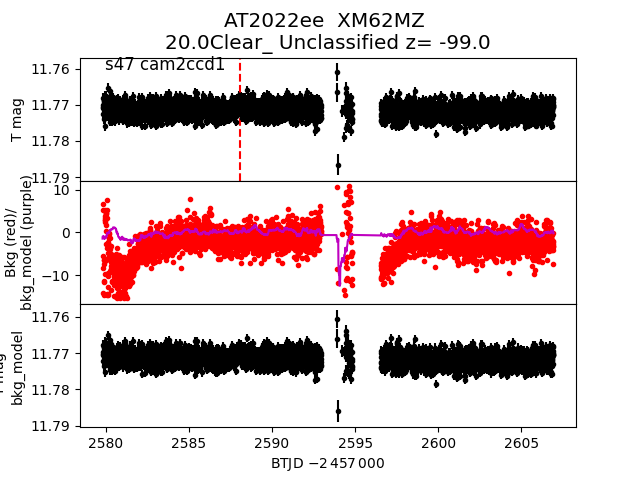
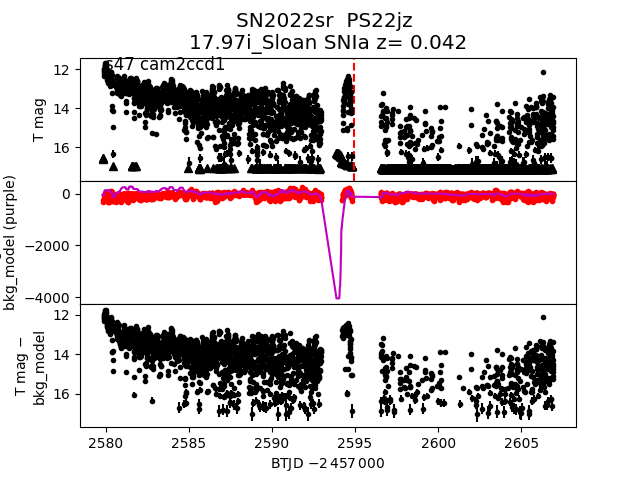
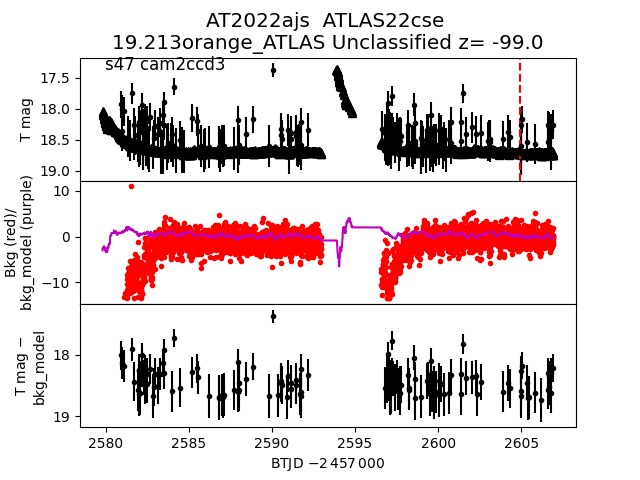
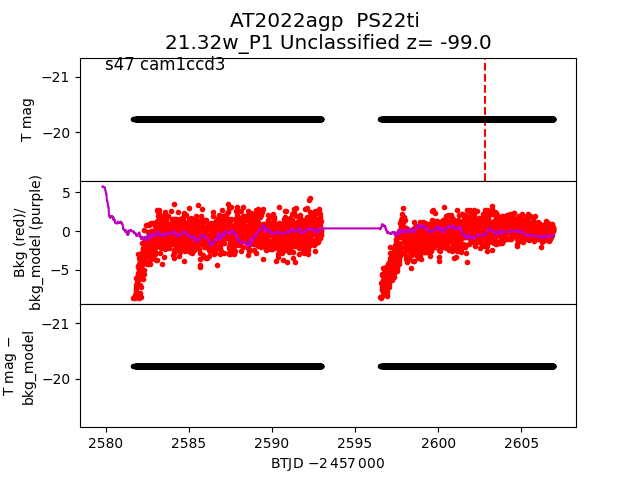
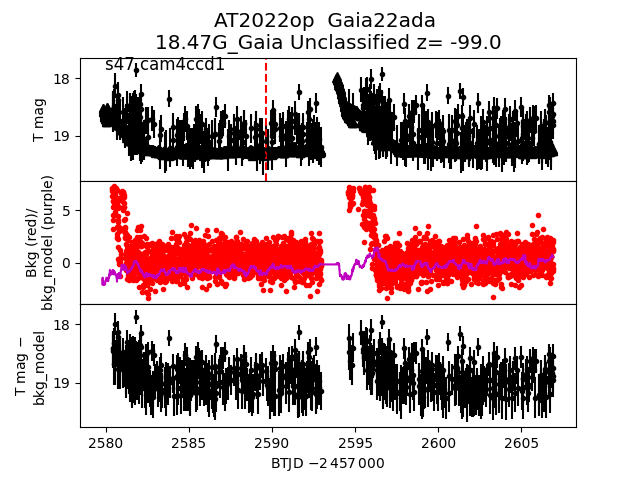
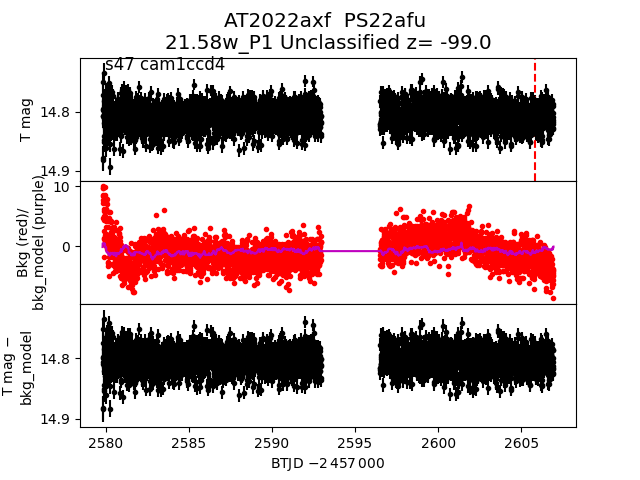
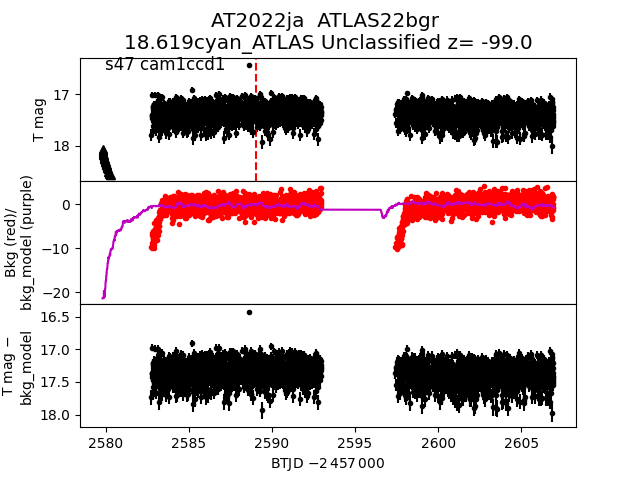
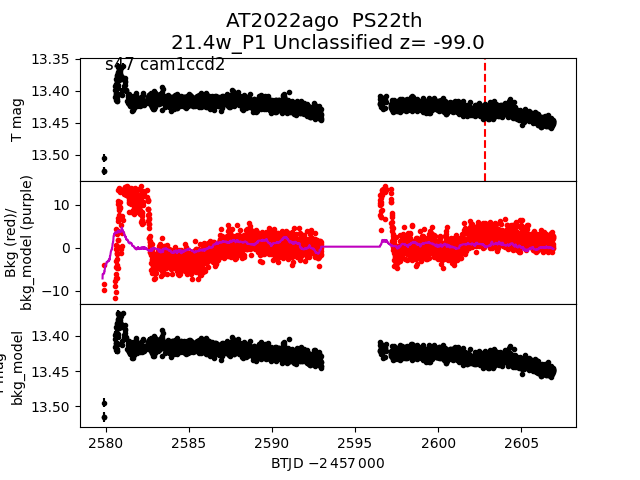
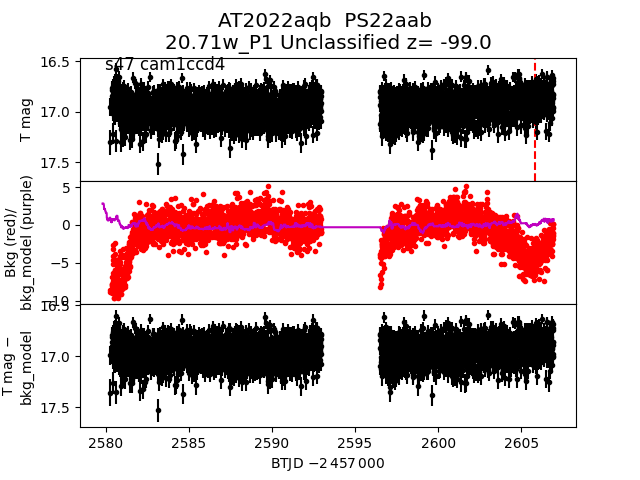
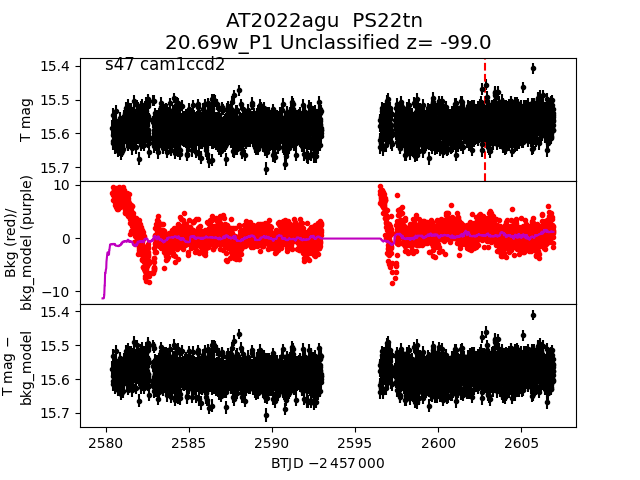
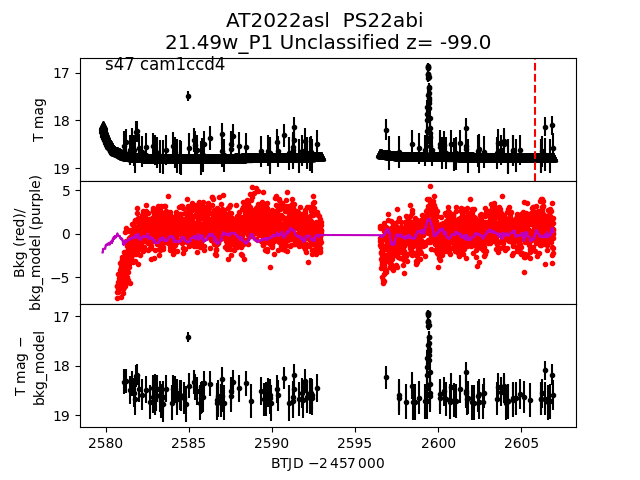
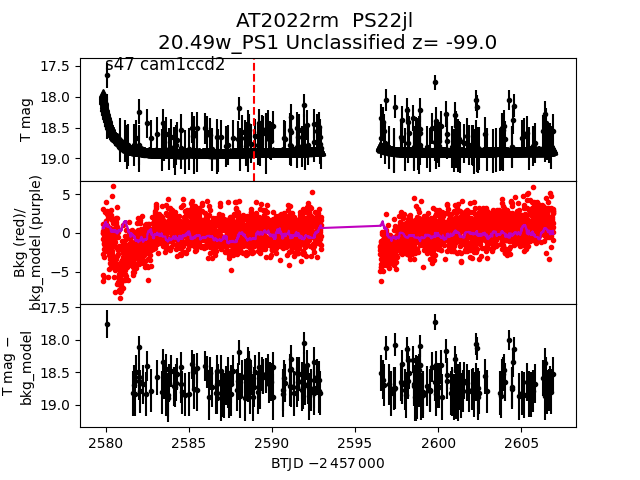
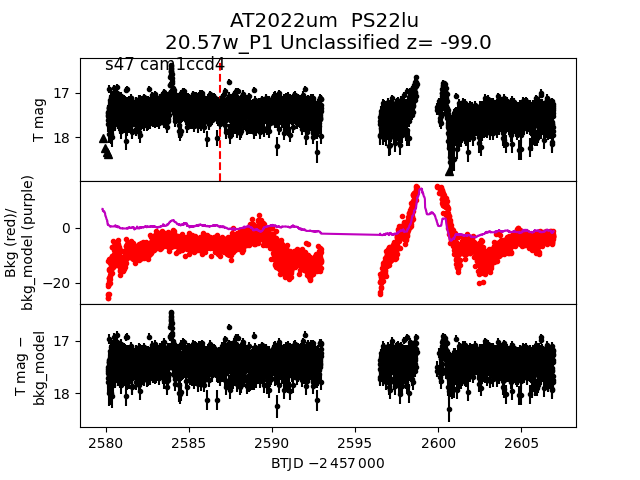
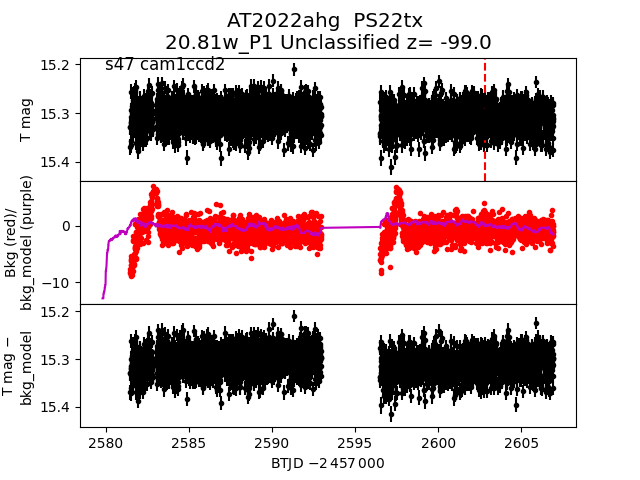
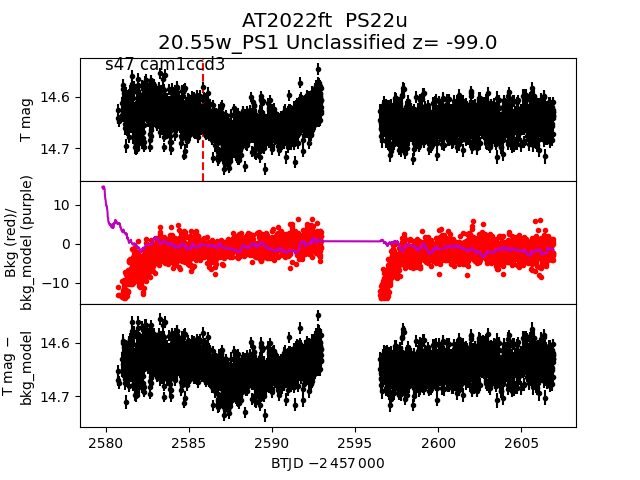
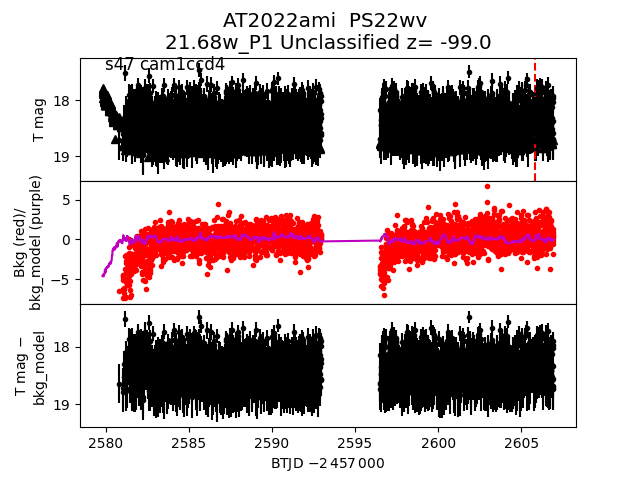
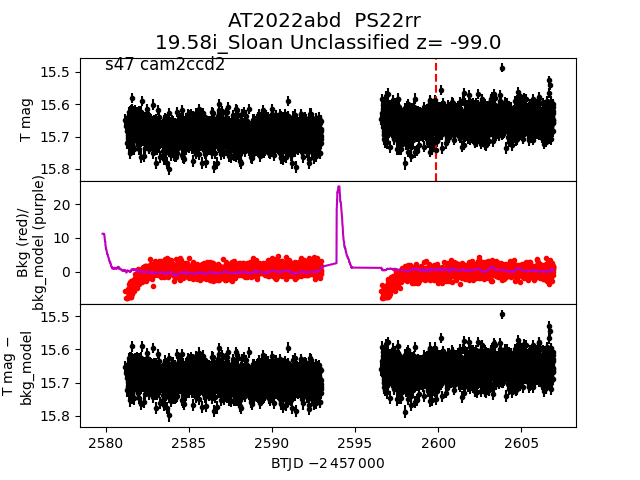
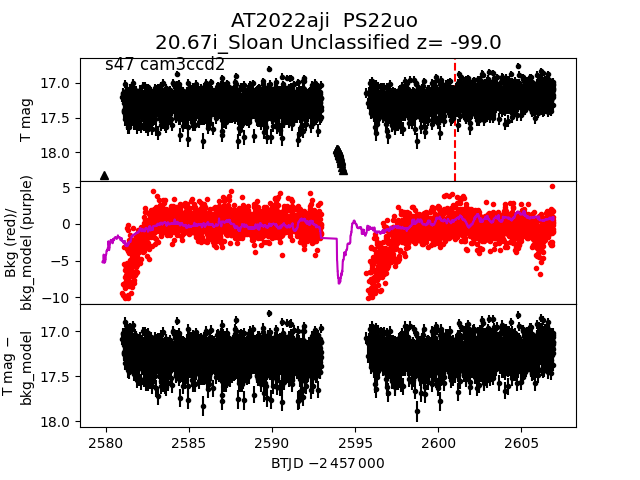
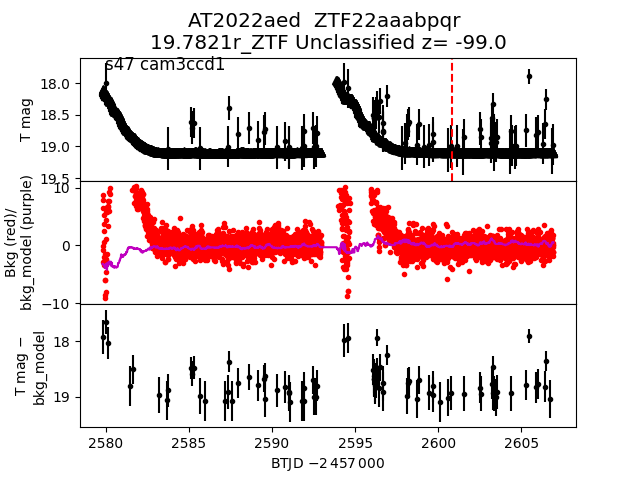
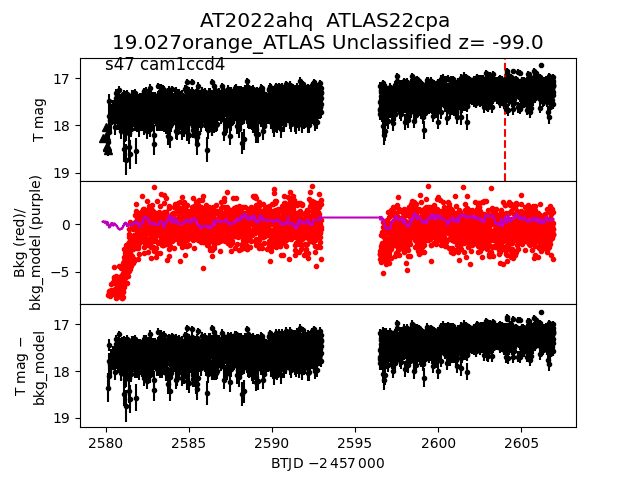
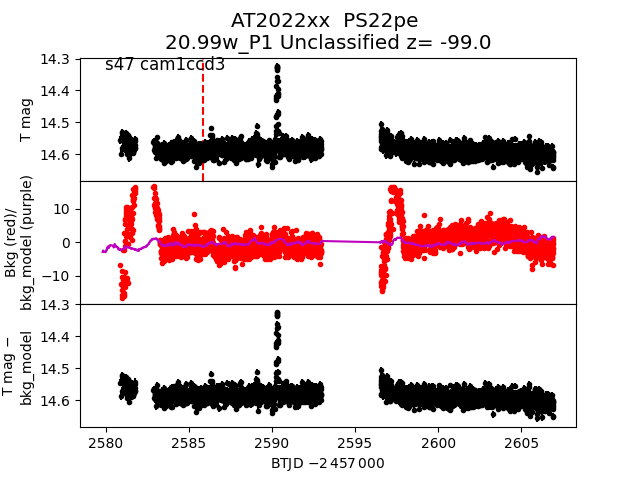
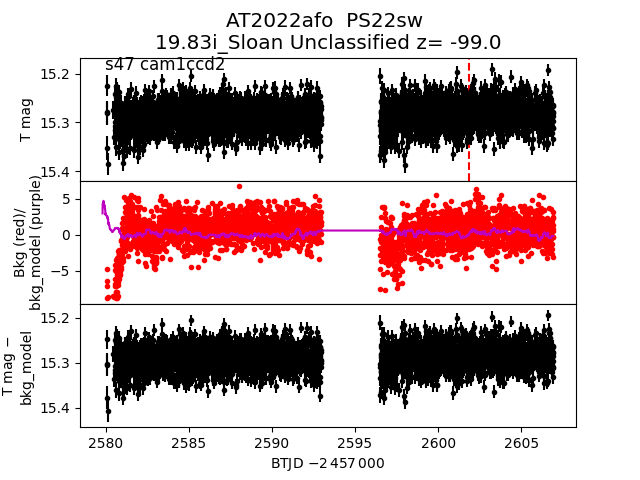
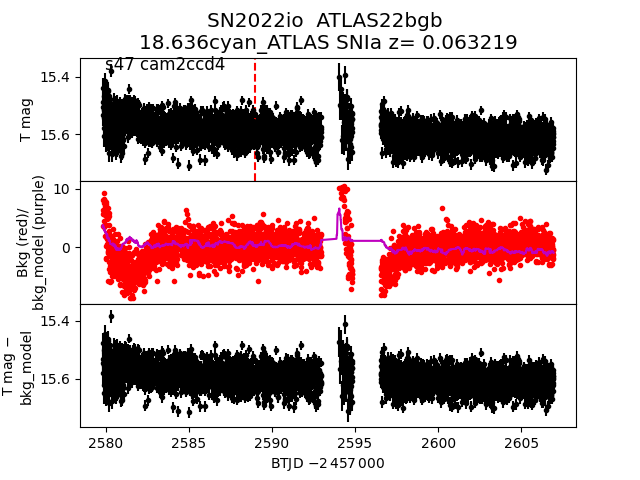
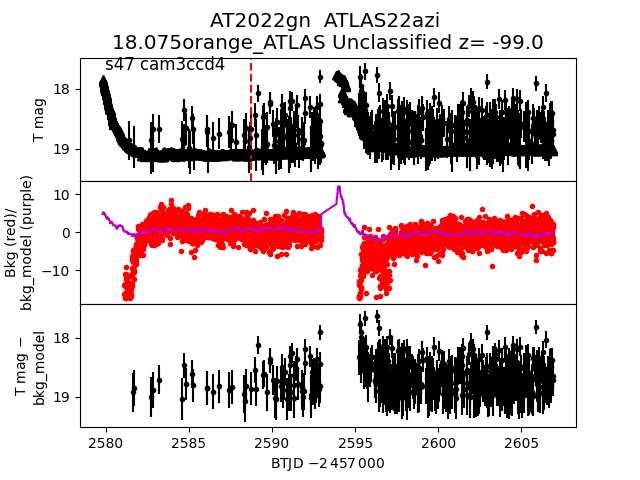
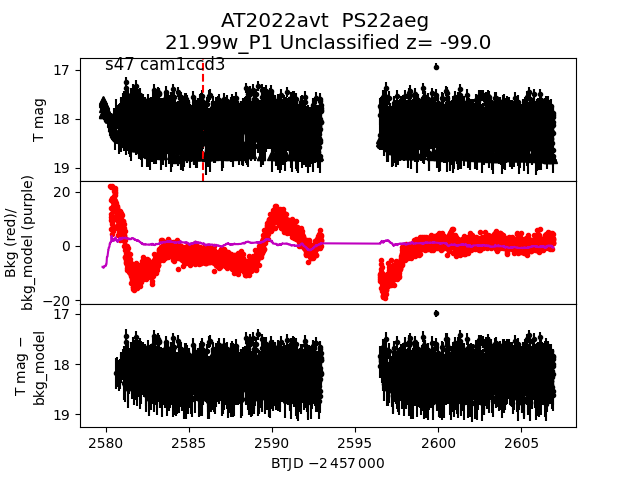
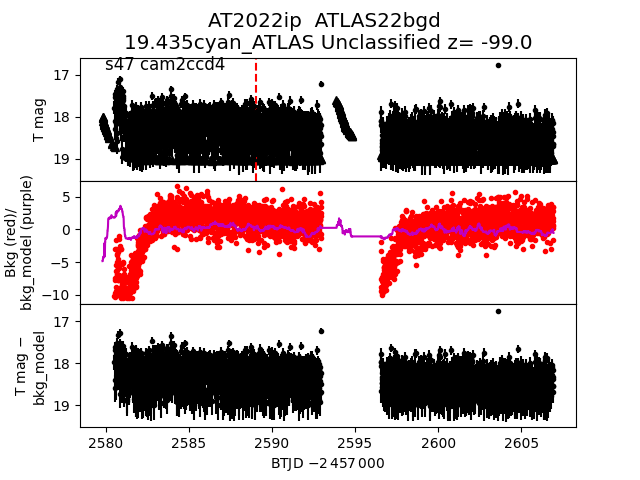
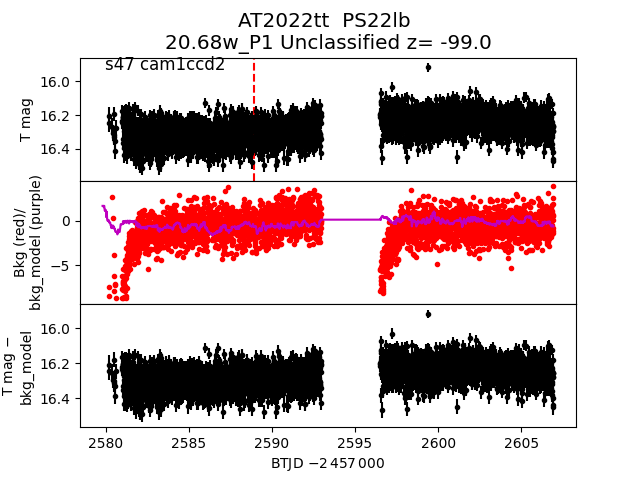
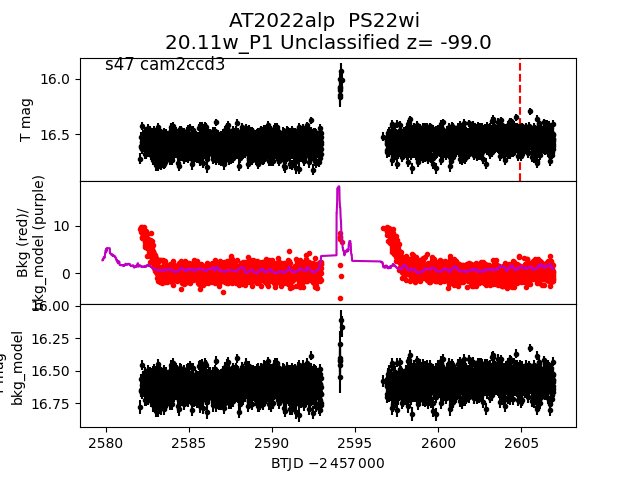
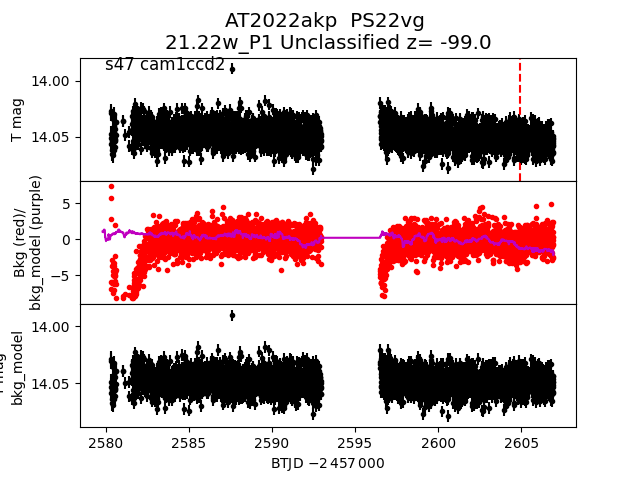
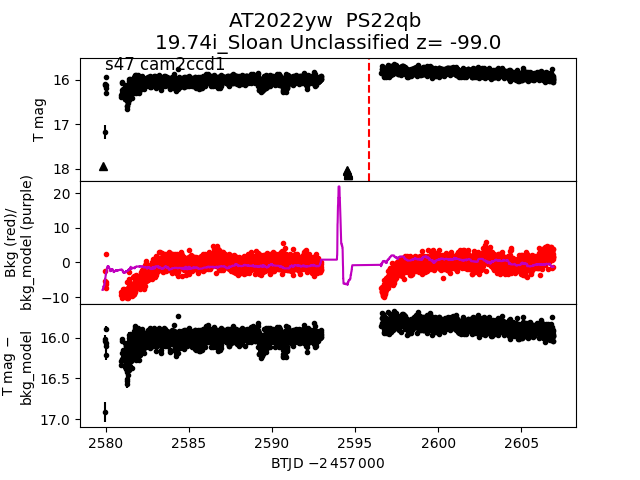
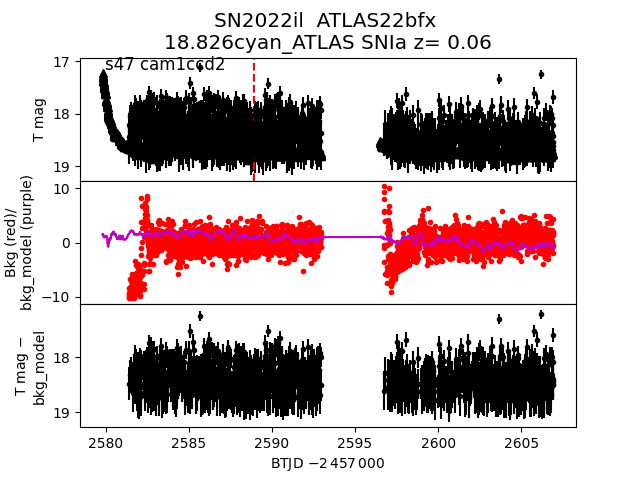
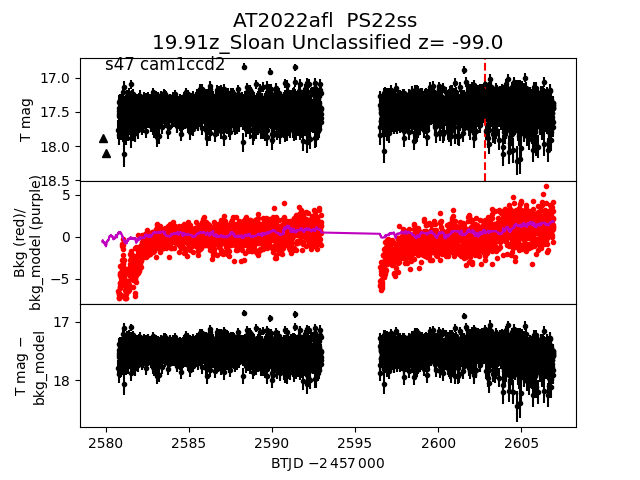
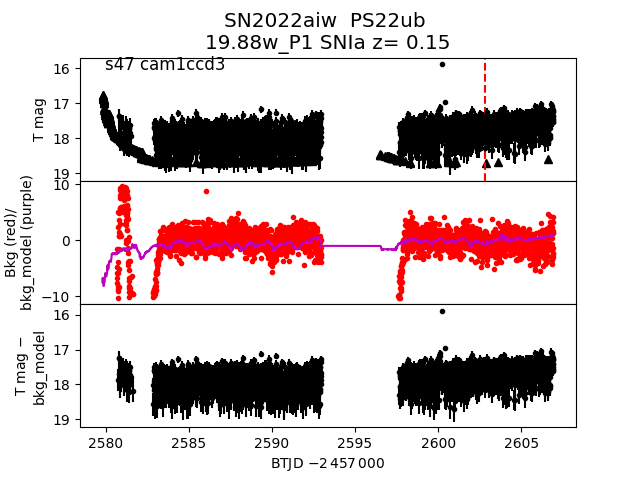
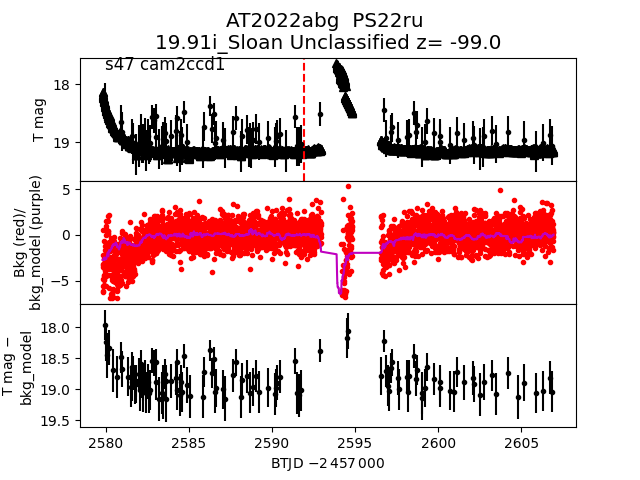
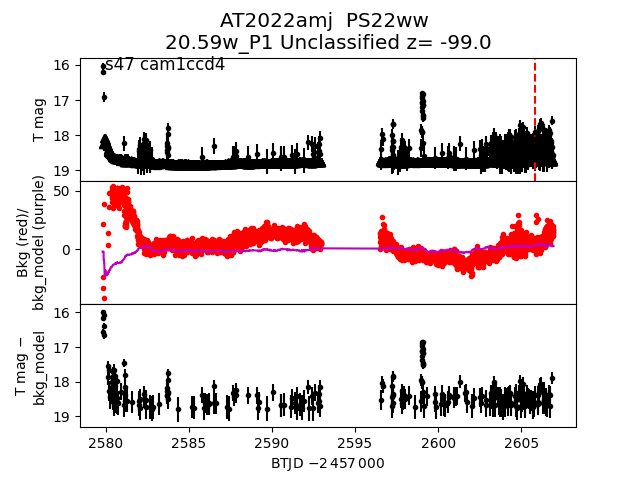
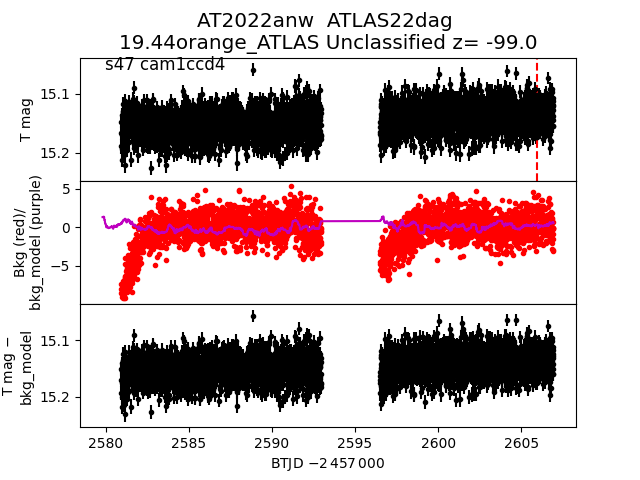
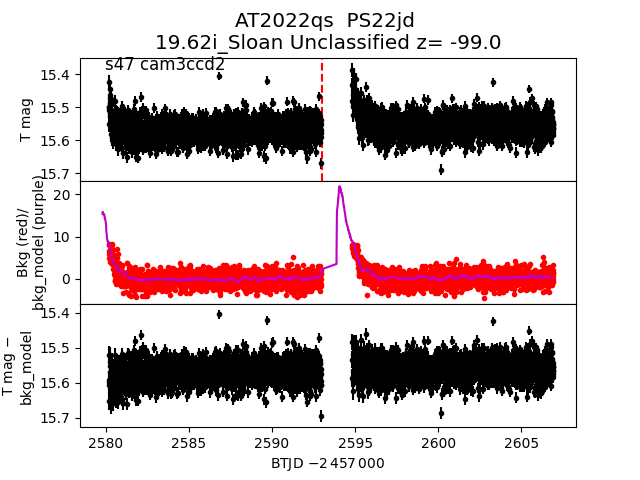
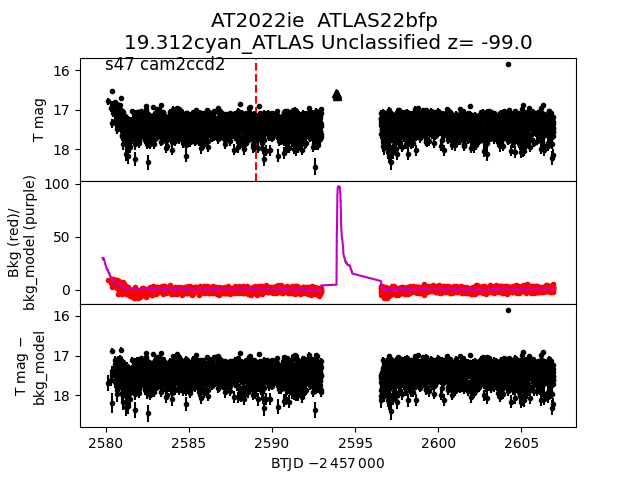
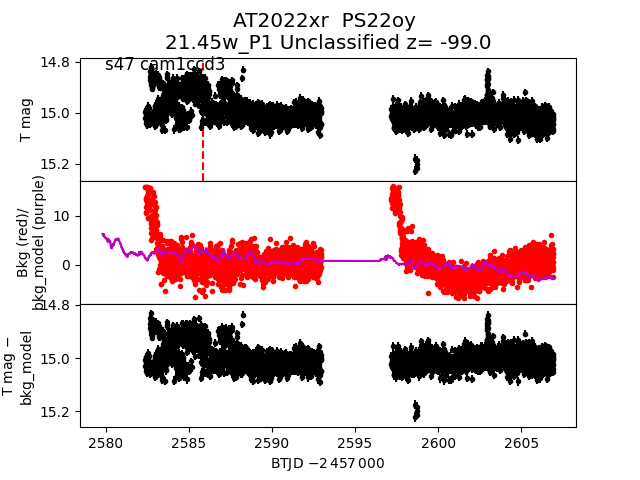
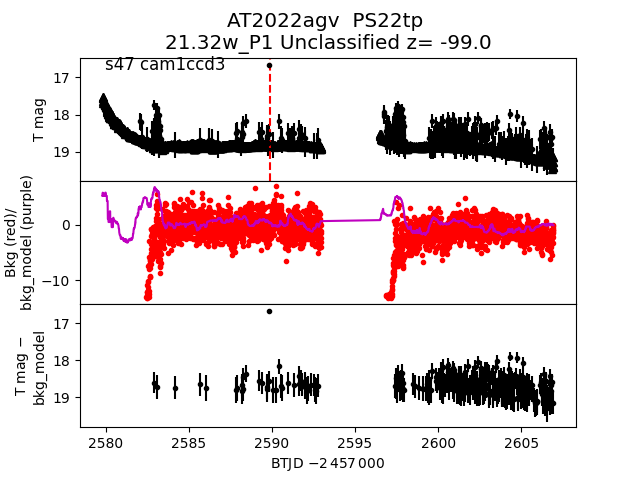
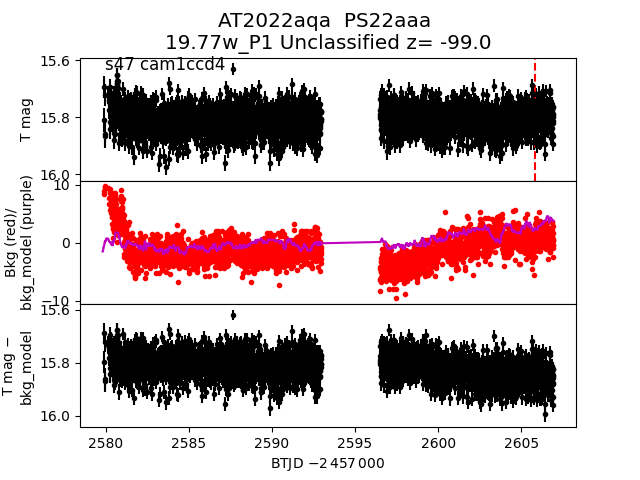
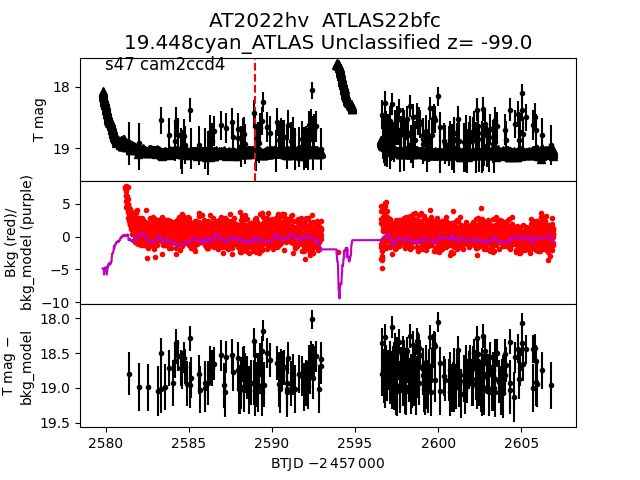
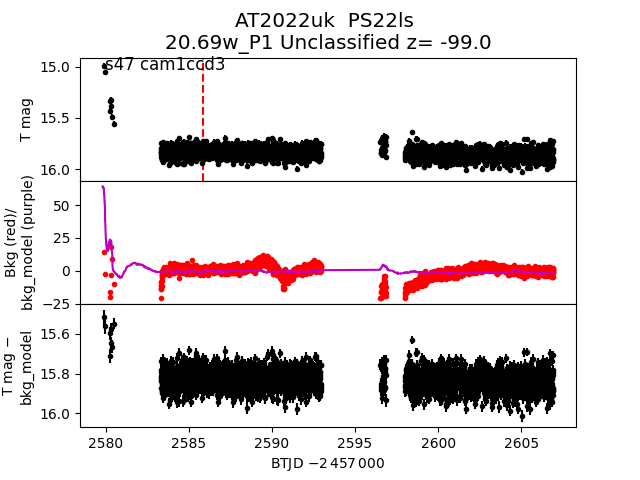
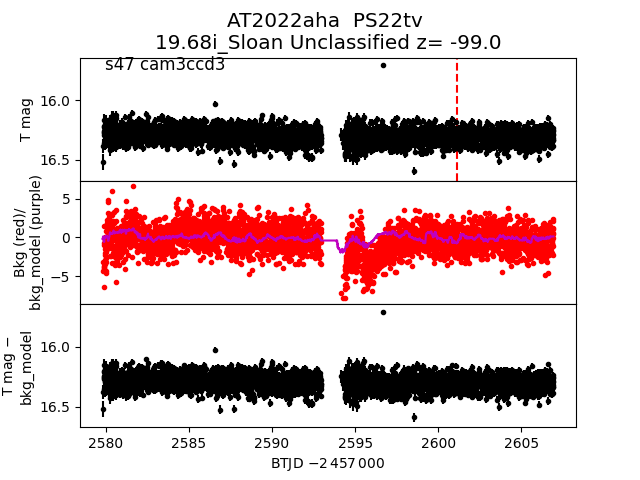
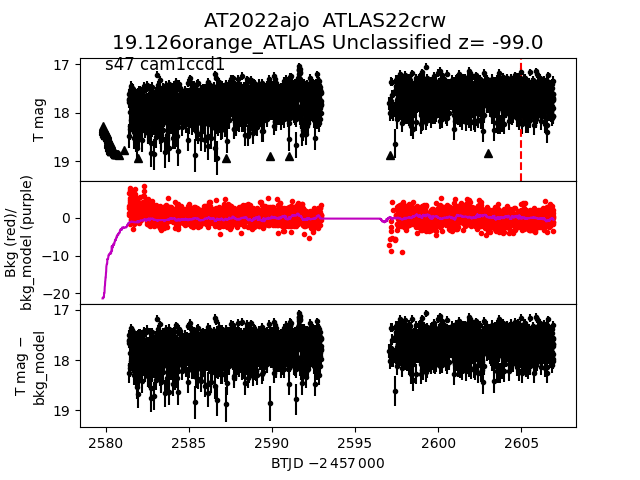
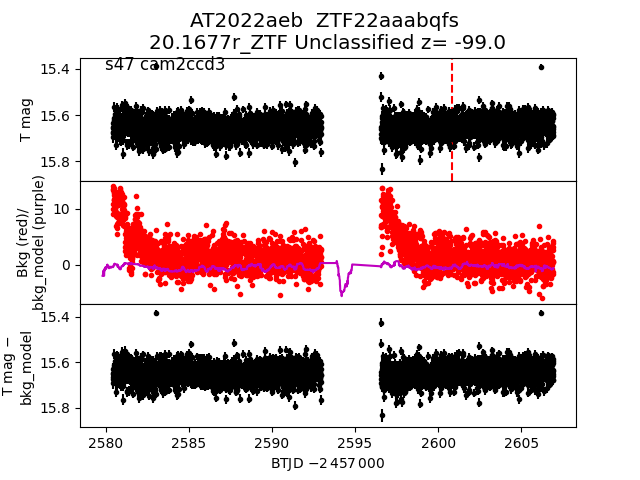
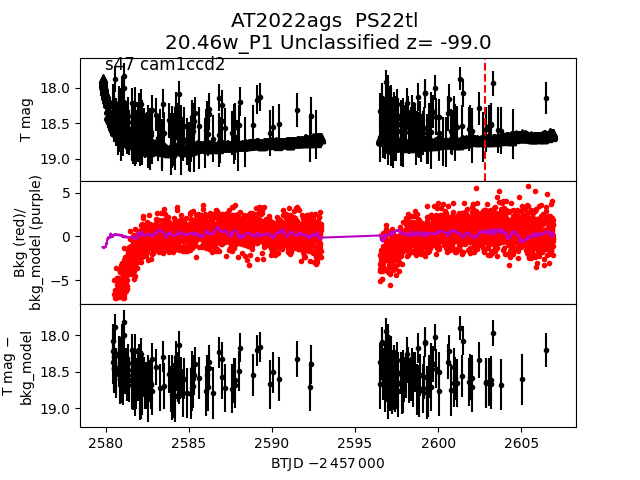
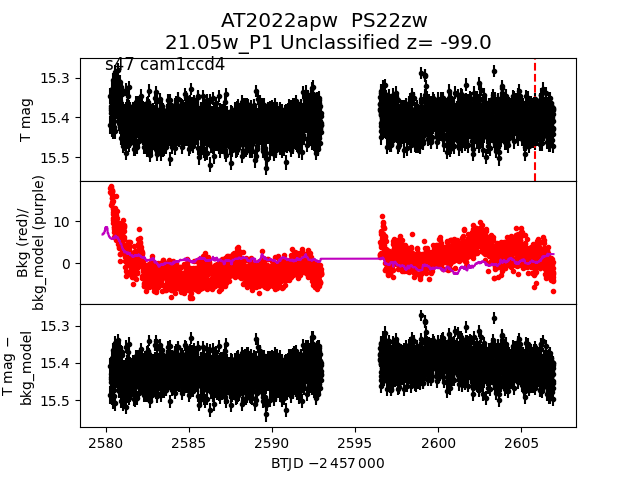
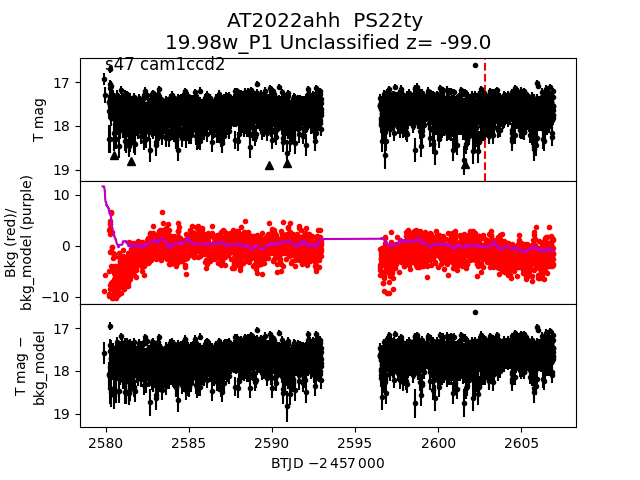
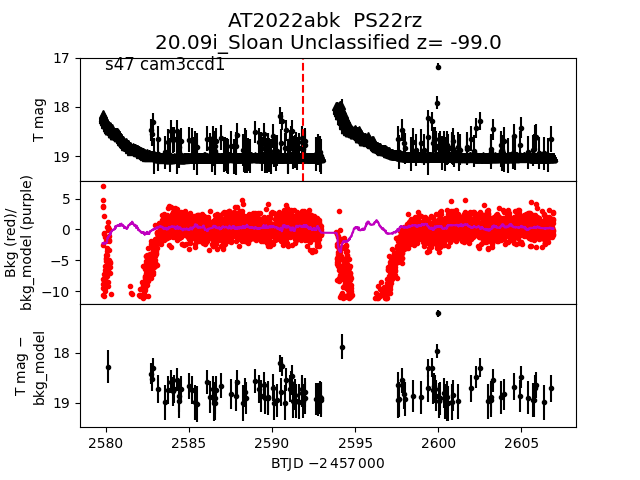
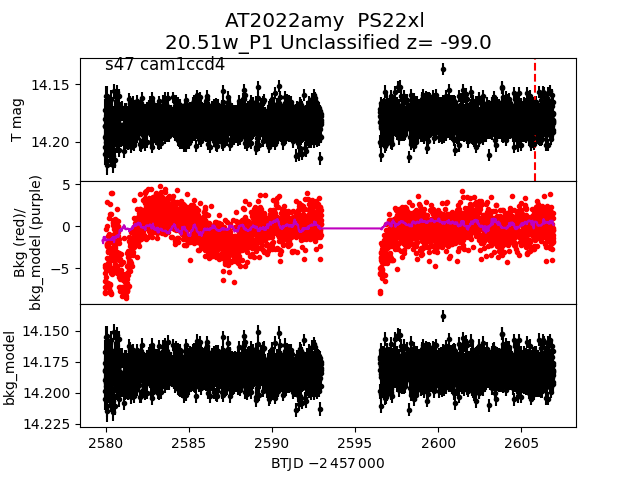
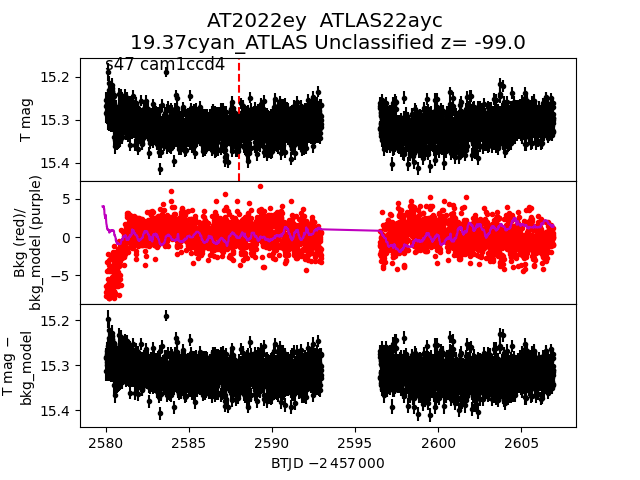
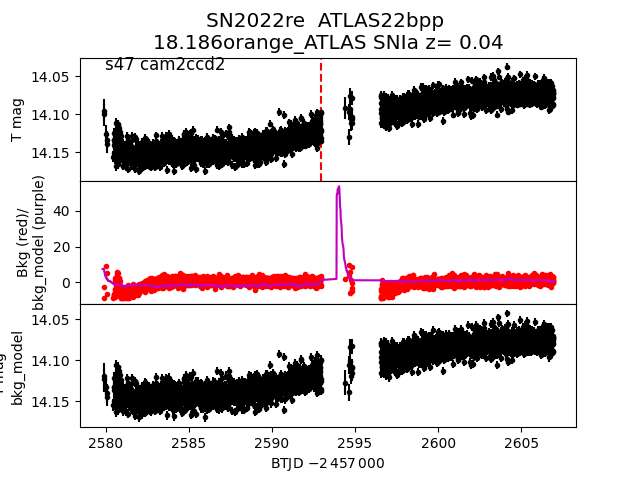
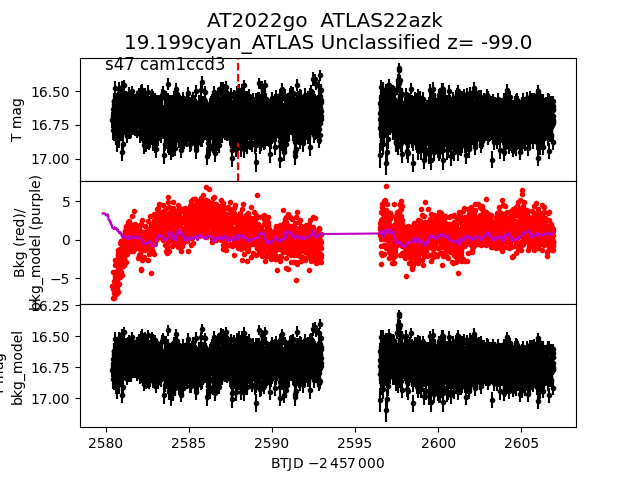
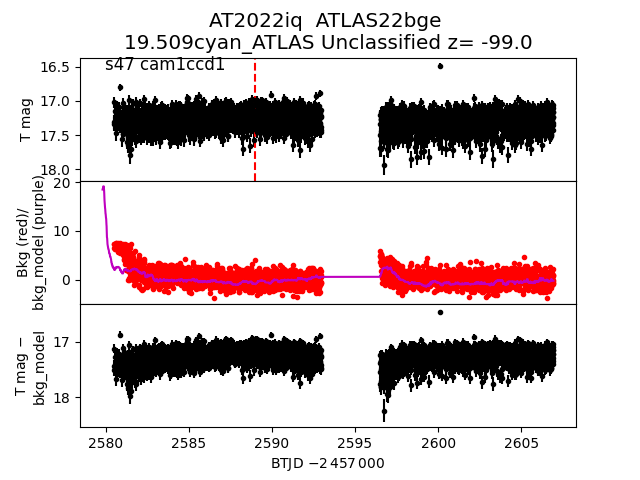
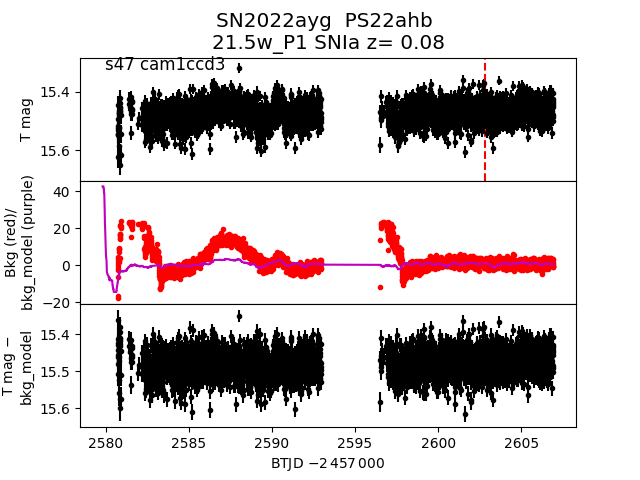
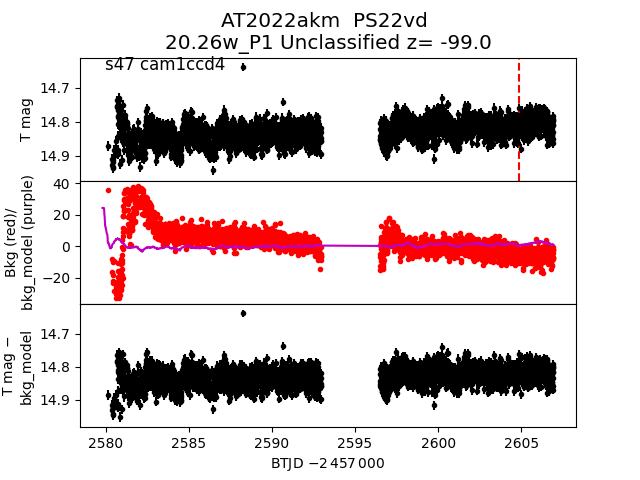
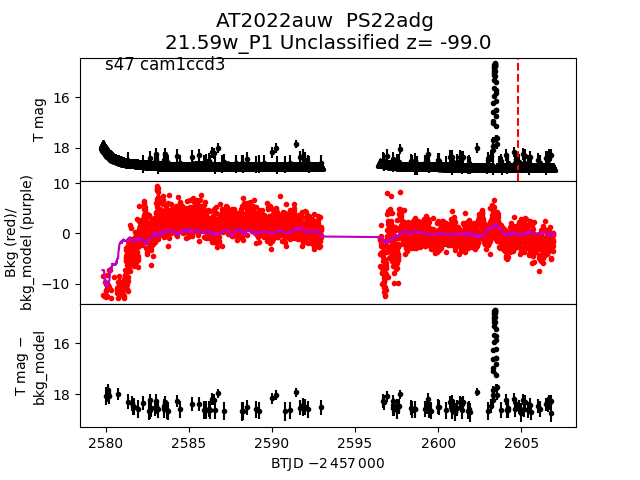
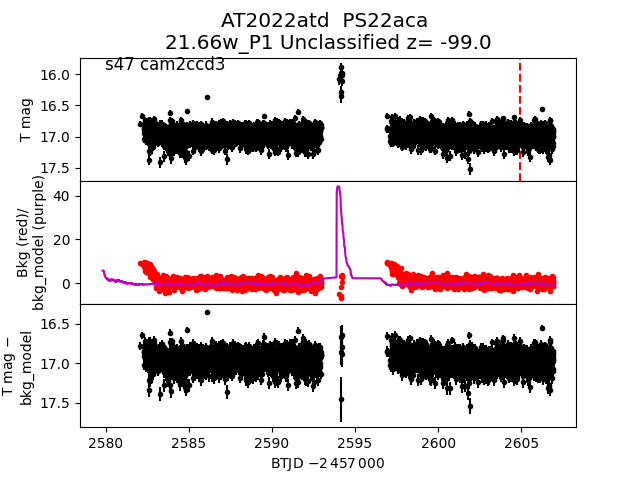
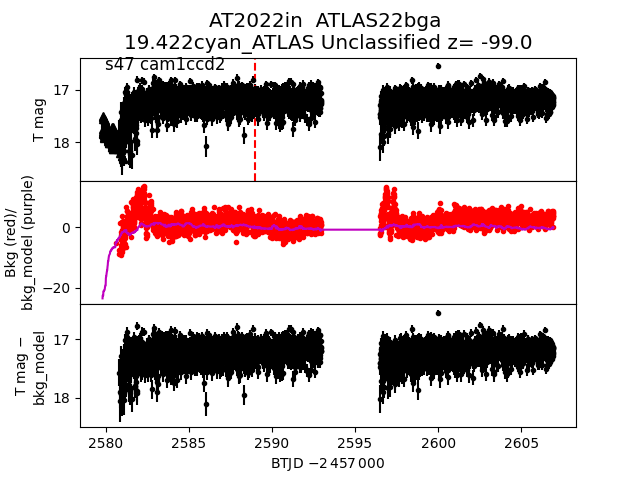
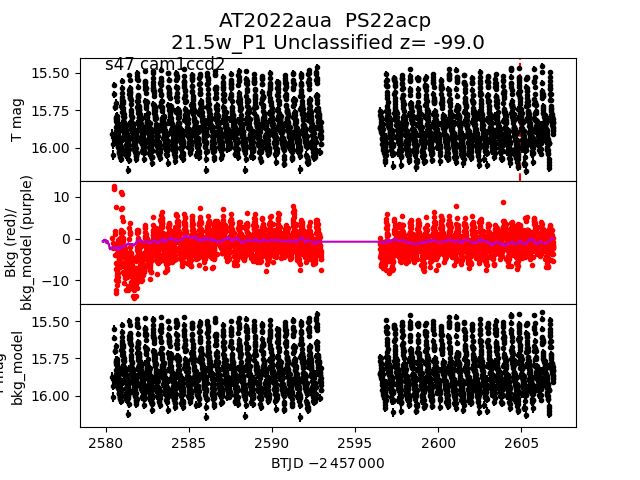
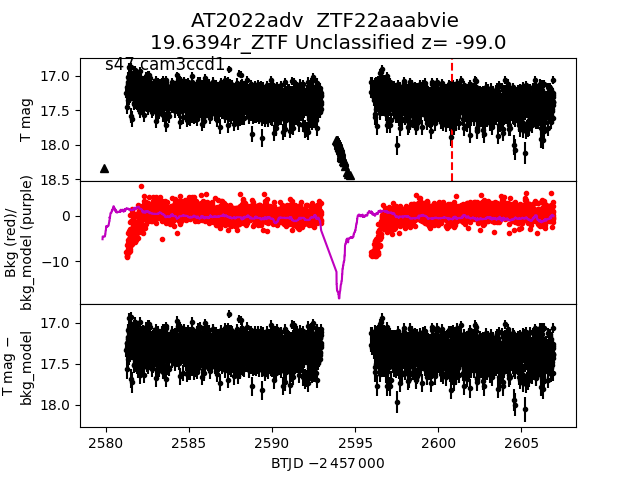
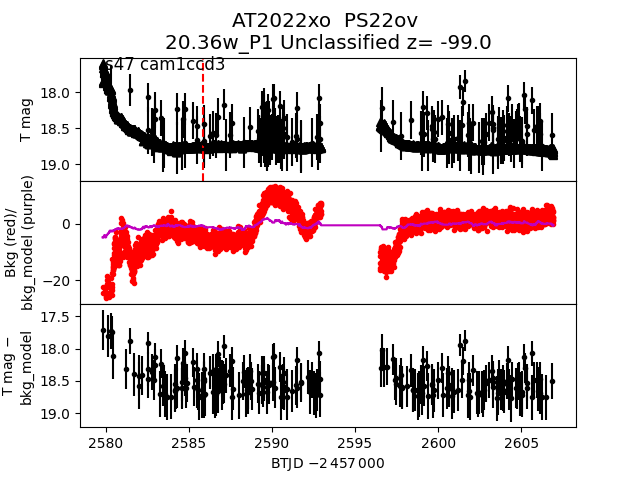
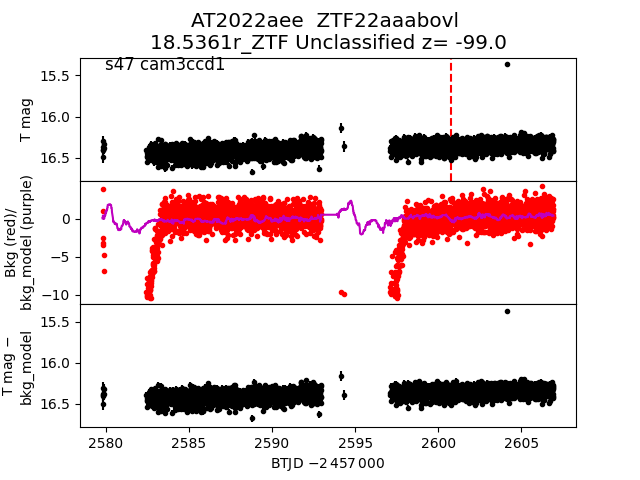
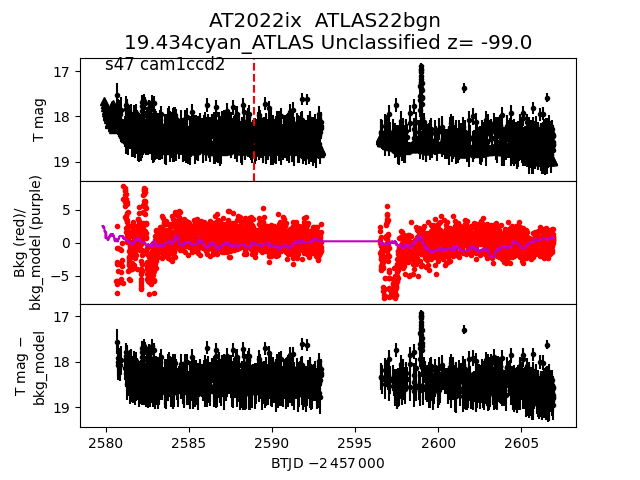
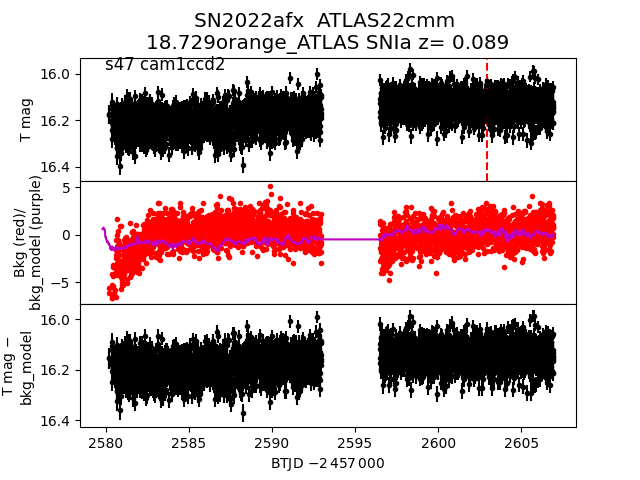
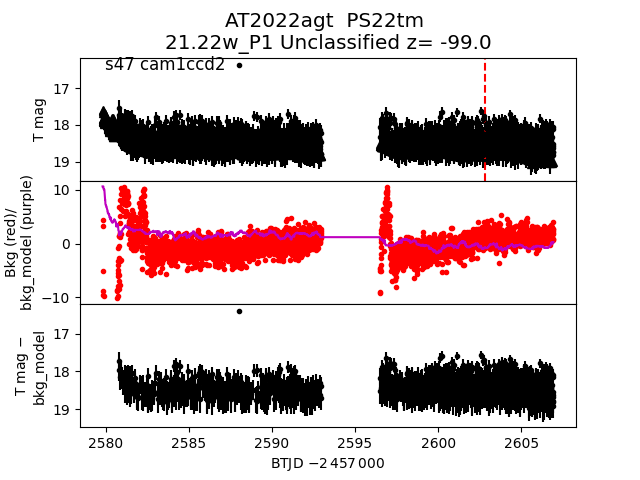
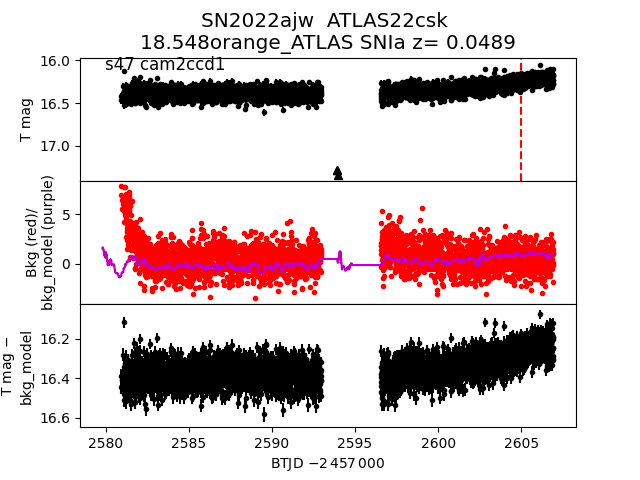
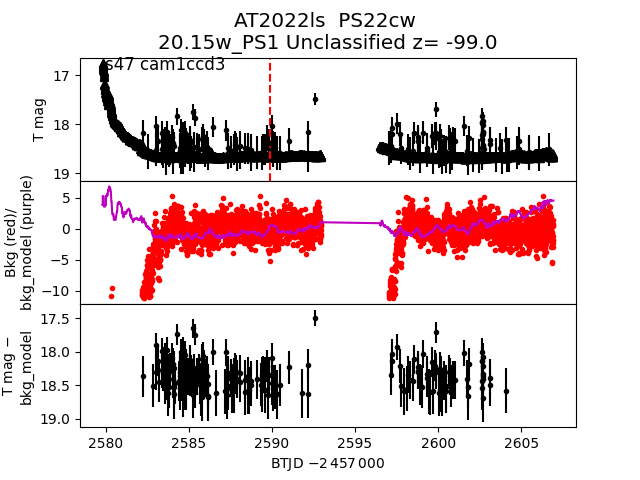
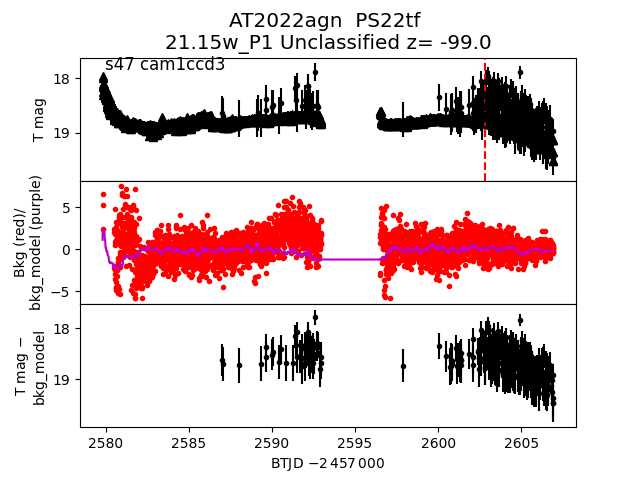
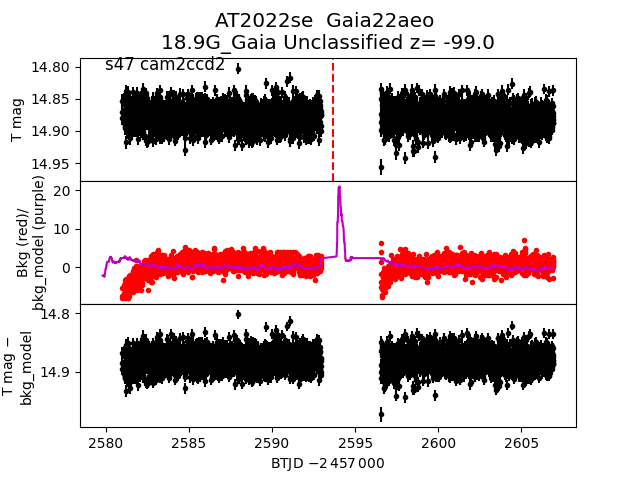
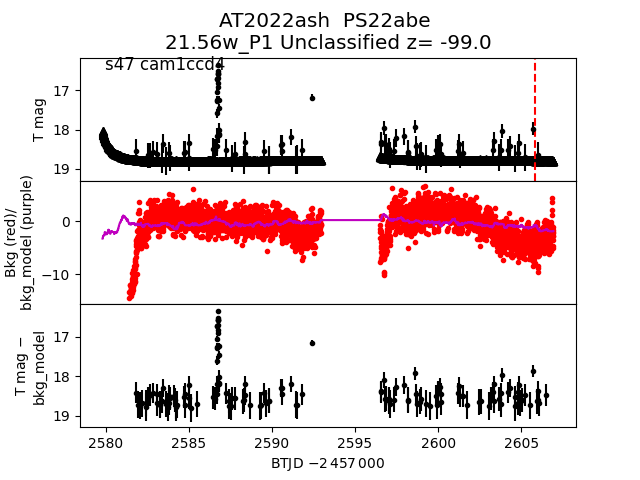
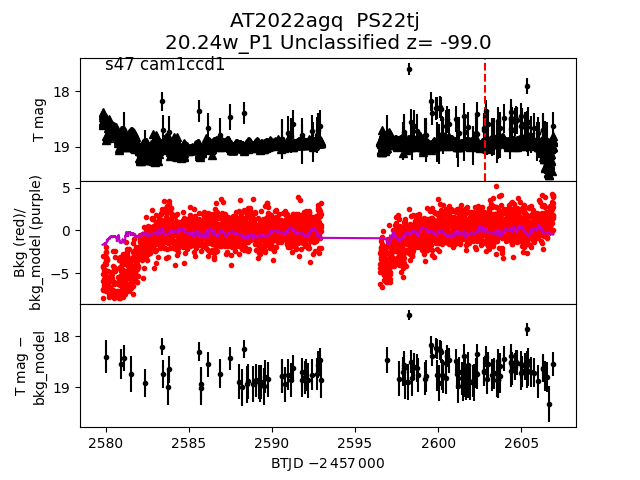
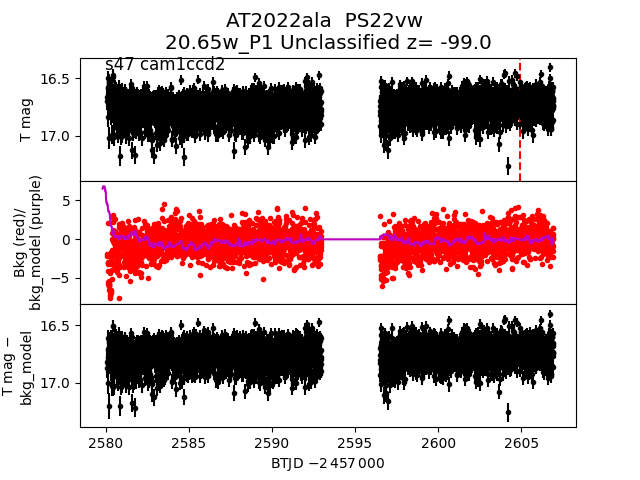
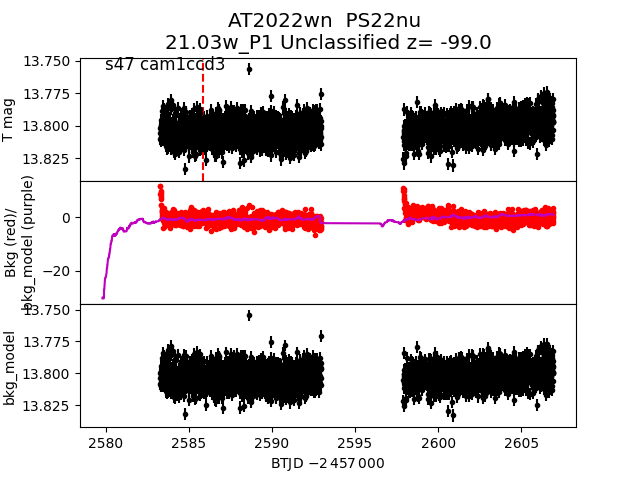
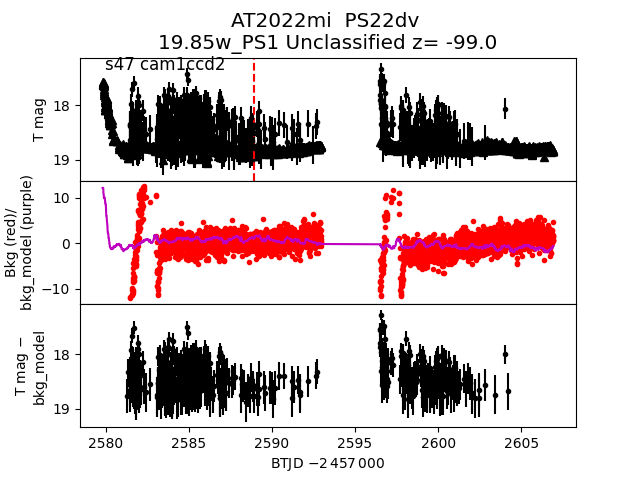
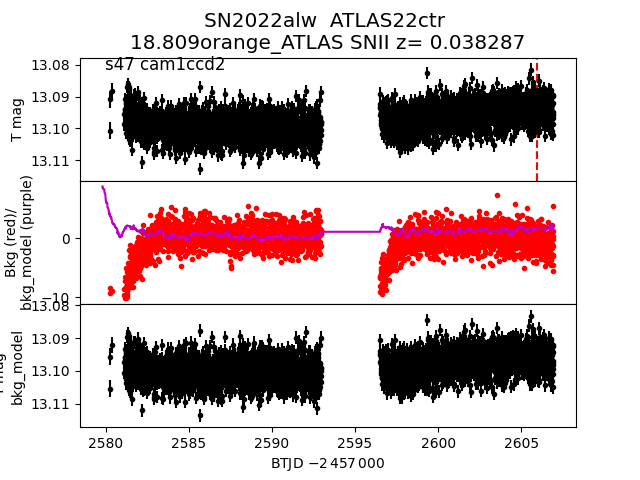
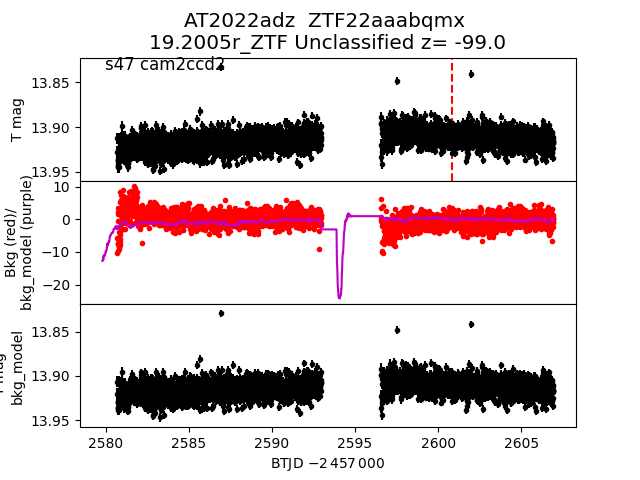
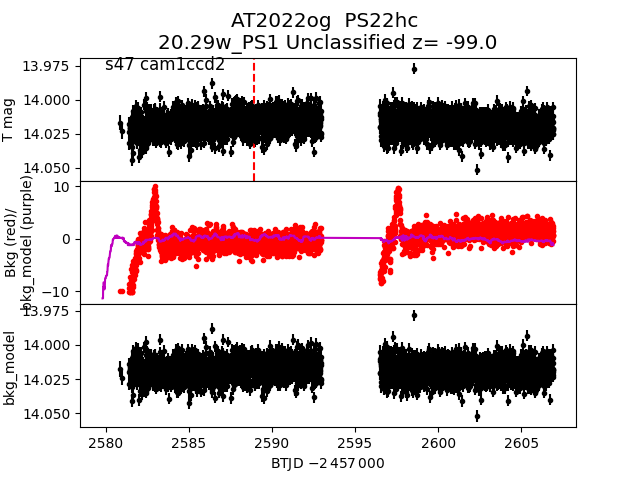
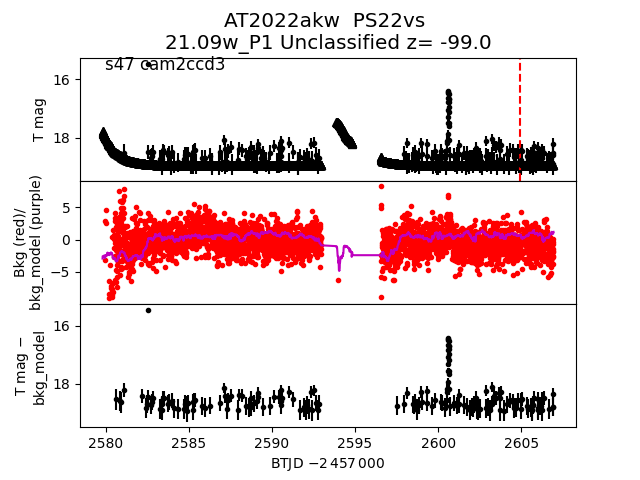
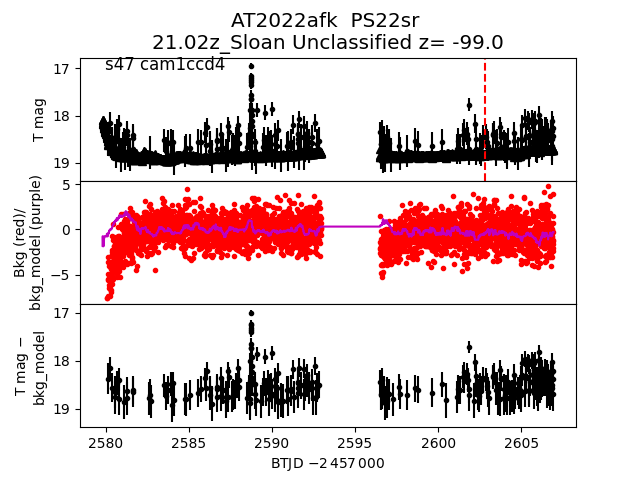
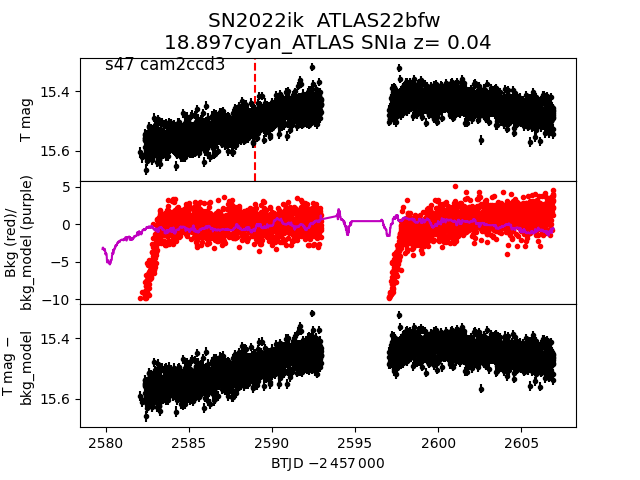
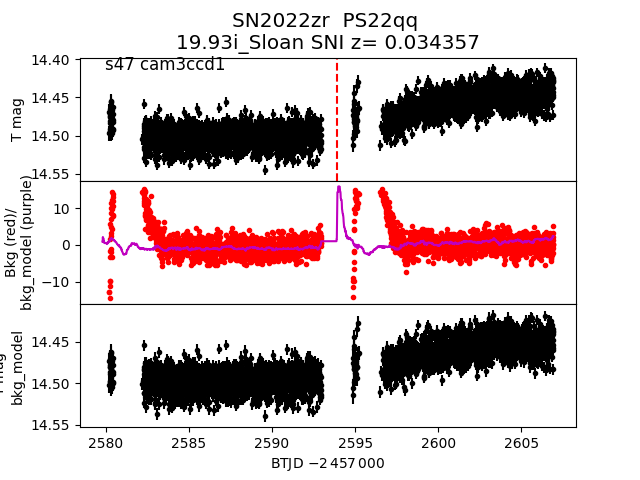
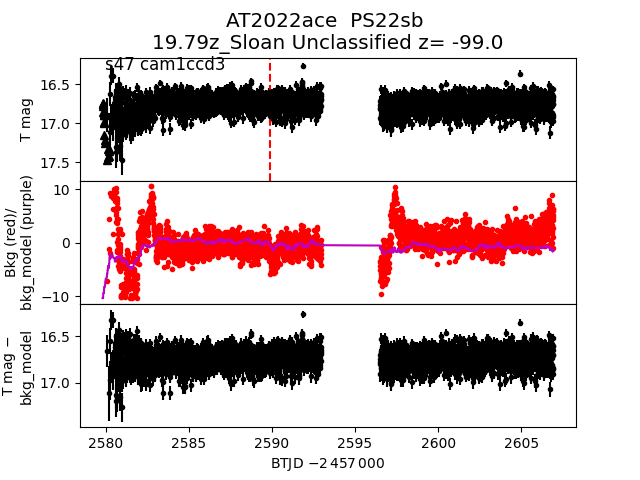
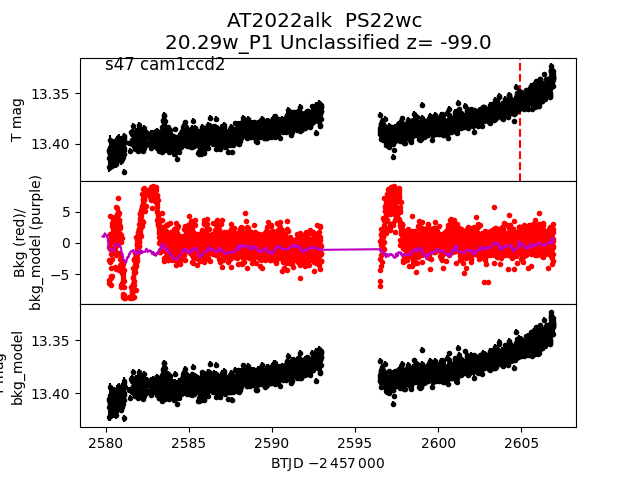
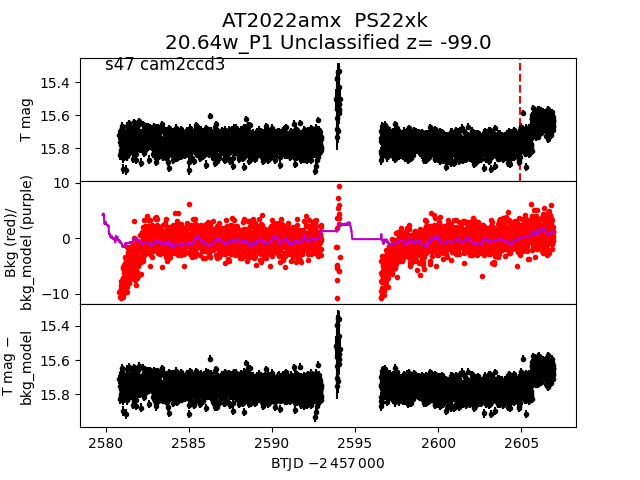
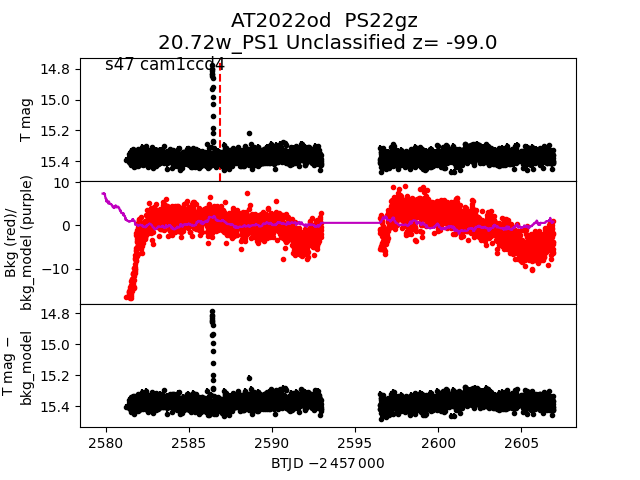
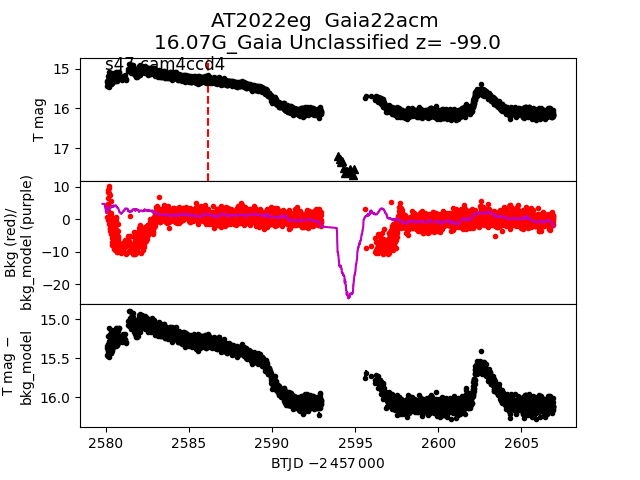
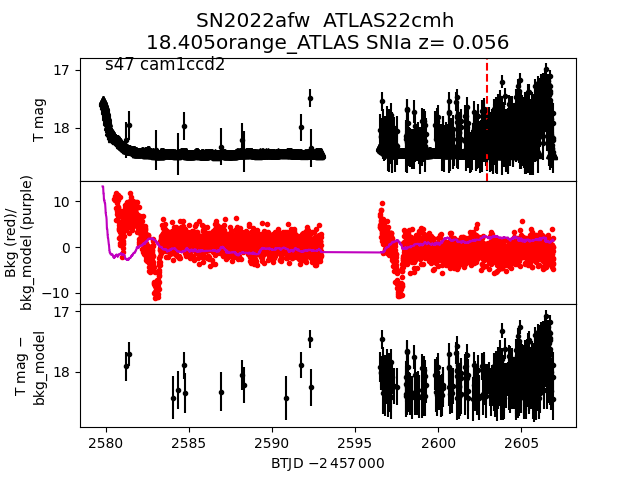
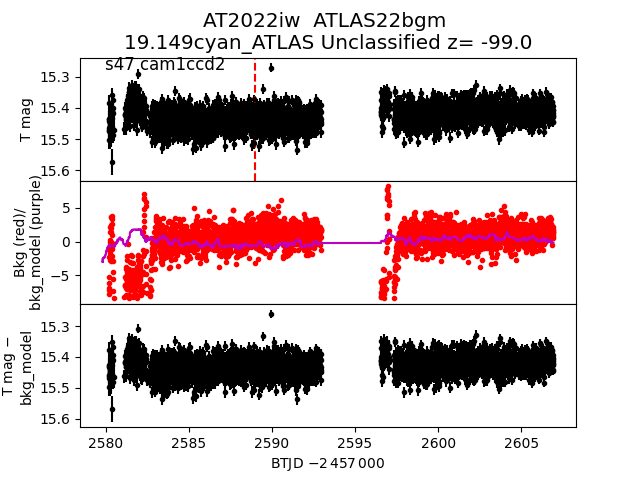
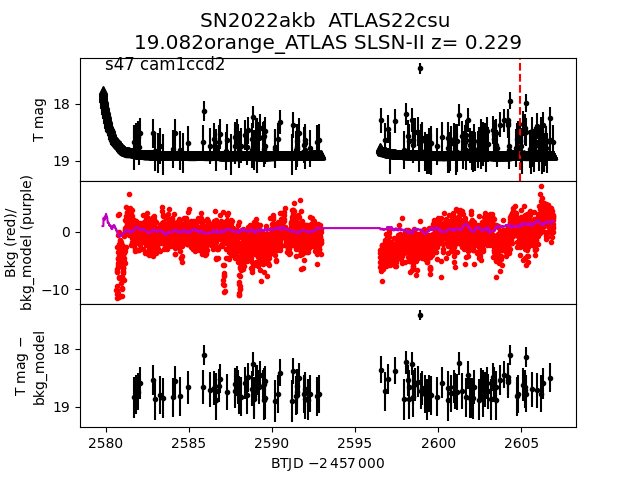
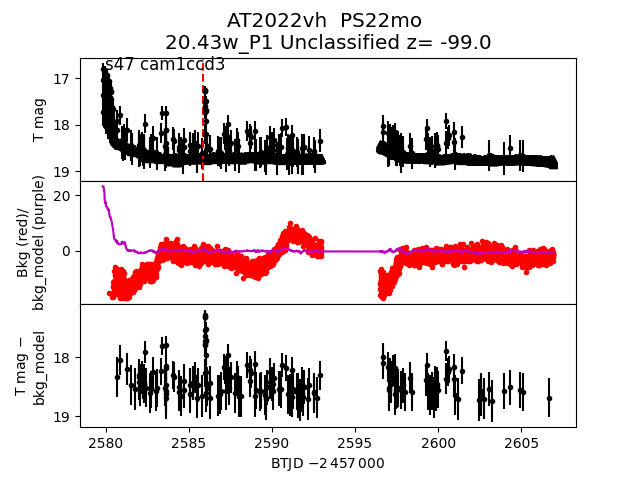
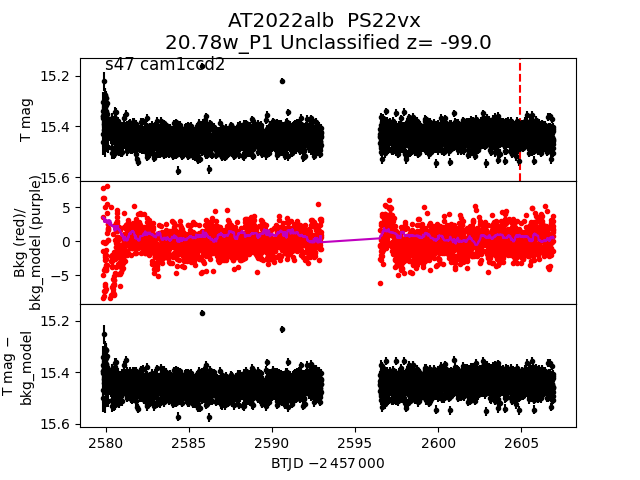
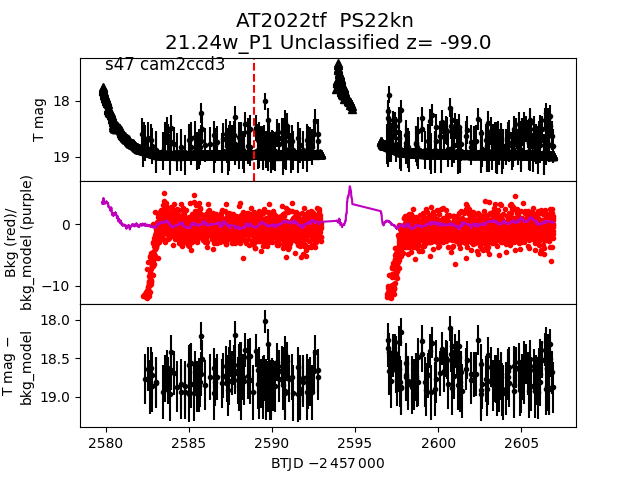
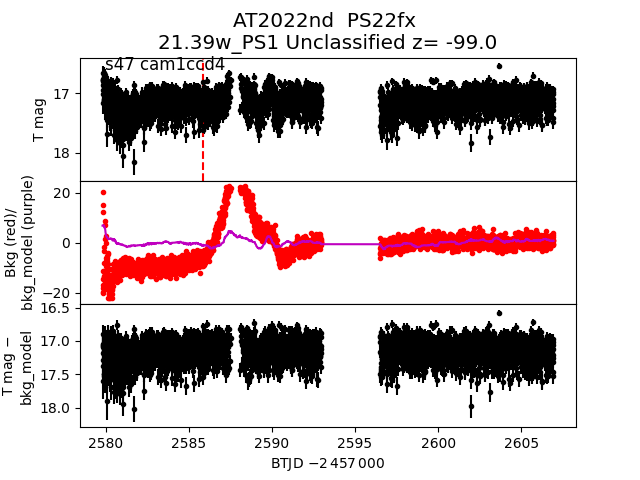
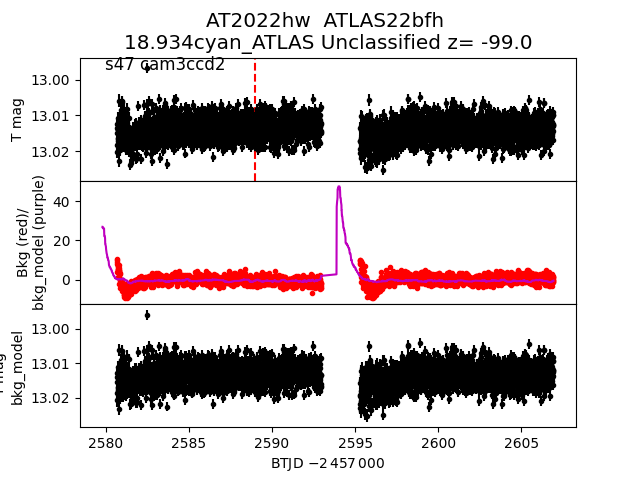
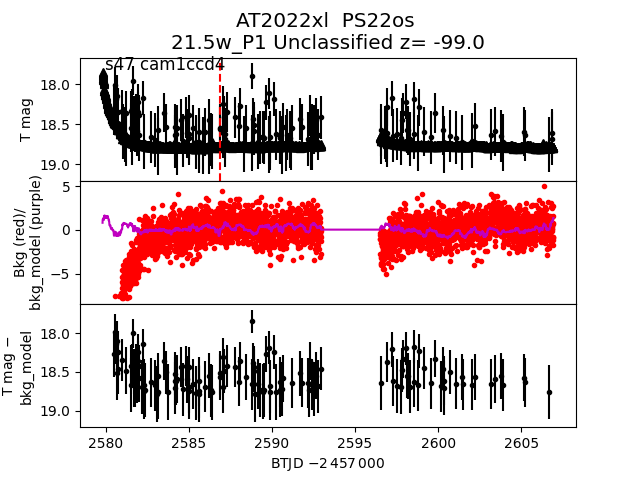
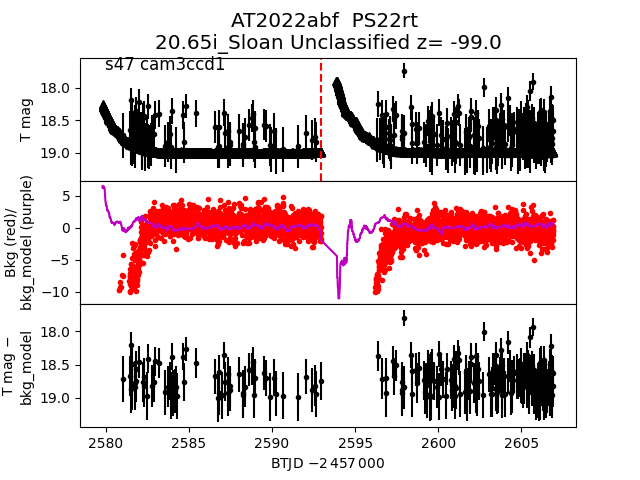
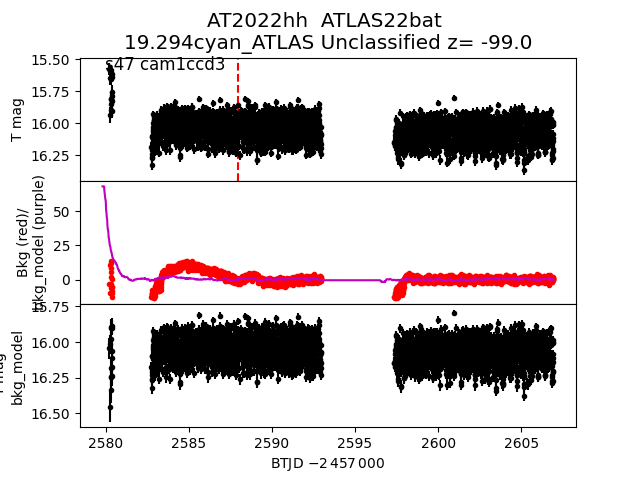
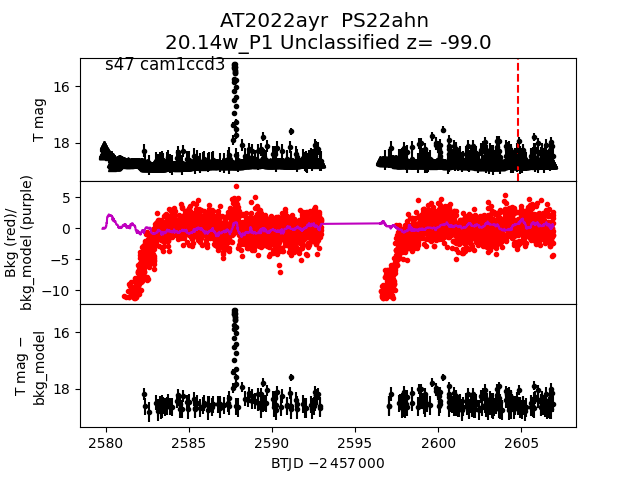
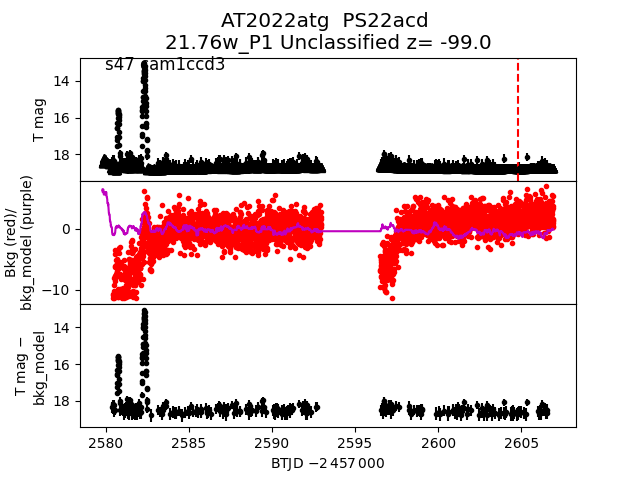
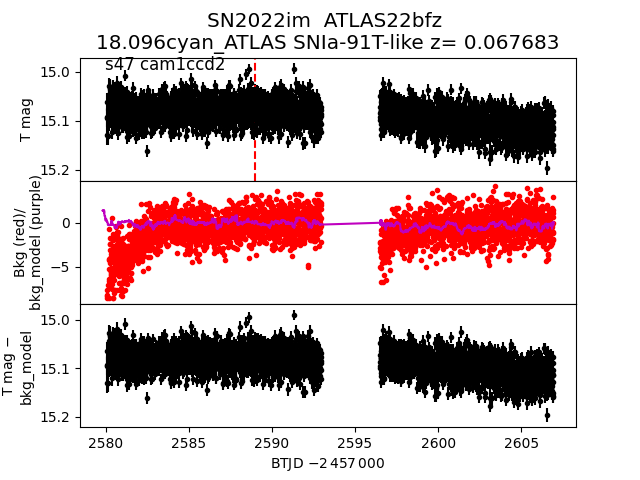
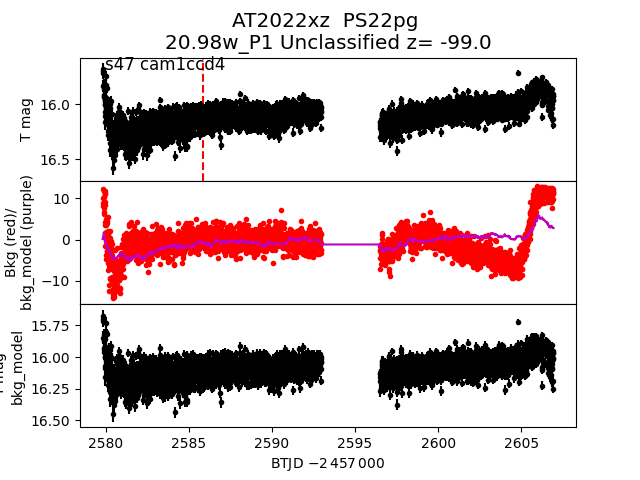
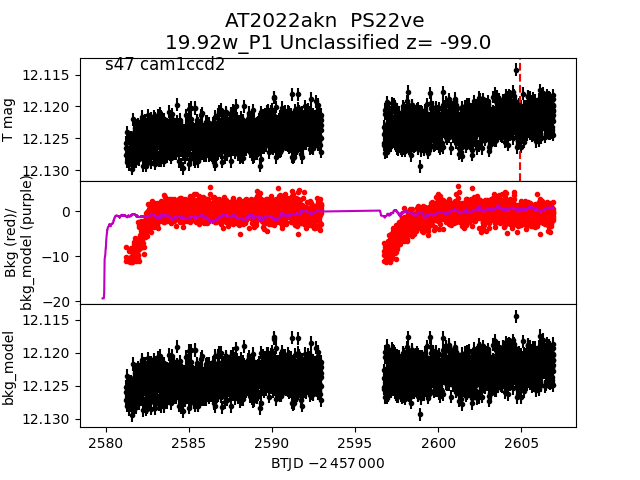
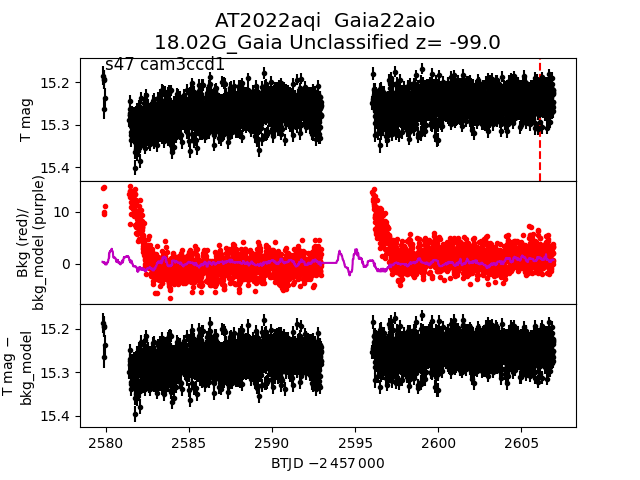
Each figure has three panels. The top panel shows the transient light curve, the middle panel shows the local background (estimated in an annulus), and the bottom panel shows a "background-model corrected" light curve. Details about the background model are in the README.
The vertical red line marks the time of discovery reported to TNS. Other useful metadata from TNS is in the figure title.
Note that the top and bottom panel are in magnitudes, while the middle panel is in differential flux units. The magnitudes are calibrated to the flux in the reference image used for image subtraction. Thus, flux from the host galaxy is included in these magnitudes.
3-sigma upper limits are plotted as triangles with no errorbars. A typical limiting magnitude is 19.6 in 30 minutes or 18.4 in 200 seconds (for low backgrounds).
The links allow you to download the light curve data as a text file.
More details in the README.
2022ij
 2022afj
 2022wp
 2022avn
 2022aki
 2022hy
 2022qc
 2022tr
 2022abh
 2022ee
 2022sr
 2022ajs
 2022agp
 2022op
 2022axf
 2022ja
 2022ago
 2022aqb
 2022agu
 2022asl
 2022rm
 2022um
 2022ahg
 2022ft
 2022ami
 2022abd
 2022aji
 2022aed
 2022ahq
 2022xx
 2022afo
 2022io
 2022gn
 2022avt
 2022ip
 2022tt
 2022alp
 2022akp
 2022yw
 2022il
 2022afl
 2022aiw
 2022abg
 2022amj
 2022anw
 2022qs
 2022ie
 2022xr
 2022agv
 2022aqa
 2022hv
 2022uk
 2022aha
 2022ajo
 2022aeb
 2022ags
 2022apw
 2022ahh
 2022abk
 2022amy
 2022ey
 2022re
 2022go
 2022iq
 2022ayg
 2022akm
 2022auw
 2022atd
 2022in
 2022aua
 2022adv
 2022xo
 2022aee
 2022ix
 2022afx
 2022agt
 2022ajw
 2022ls
 2022agn
 2022se
 2022ash
 2022agq
 2022ala
 2022wn
 2022mi
 2022alw
 2022adz
 2022og
 2022akw
 2022afk
 2022ik
 2022zr
 2022ace
 2022alk
 2022amx
 2022od
 2022eg
 2022afw
 2022iw
 2022akb
 2022vh
 2022alb
 2022tf
 2022vw
 2022uj
 2022fs
 2022ajn
 2022nd
 2022hw
 2022xl
 2022abf
 2022hh
 2022ayr
 2022atg
 2022im
 2022xz
 2022akn
 2022aqi
 2022mo