sector46 supernovae (24 total)
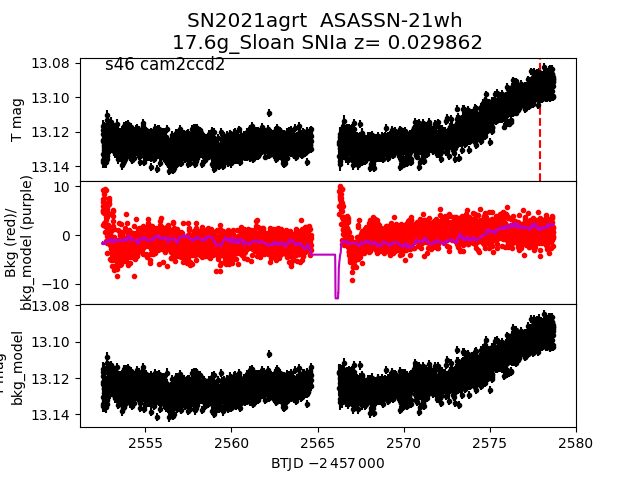
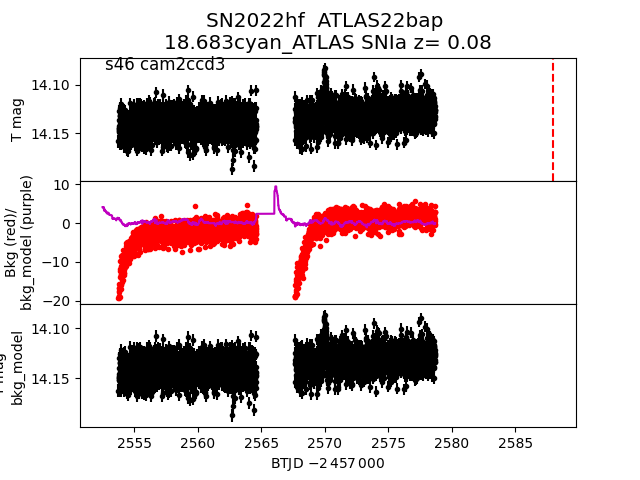
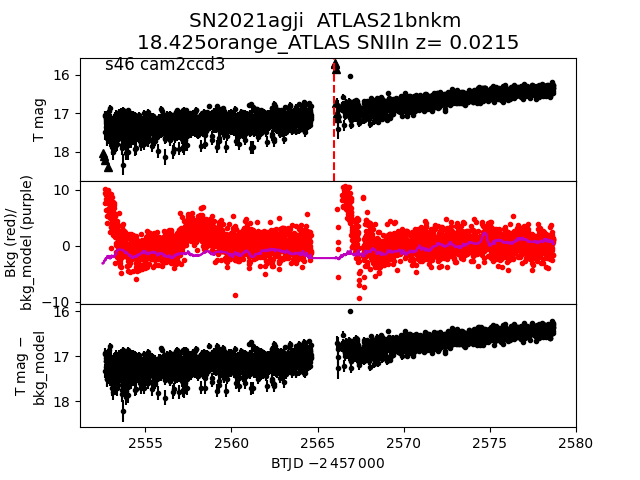
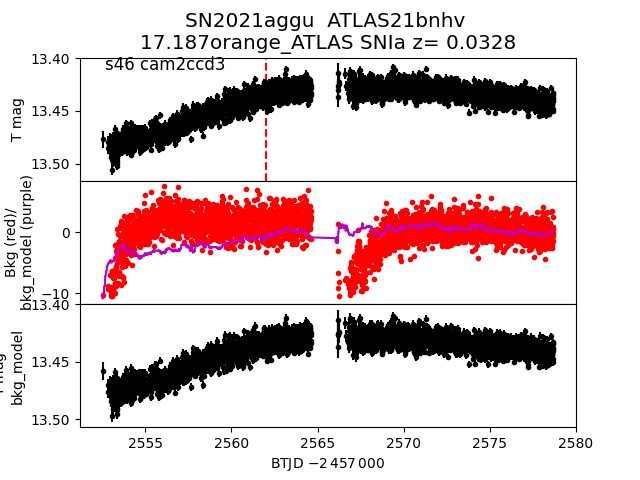
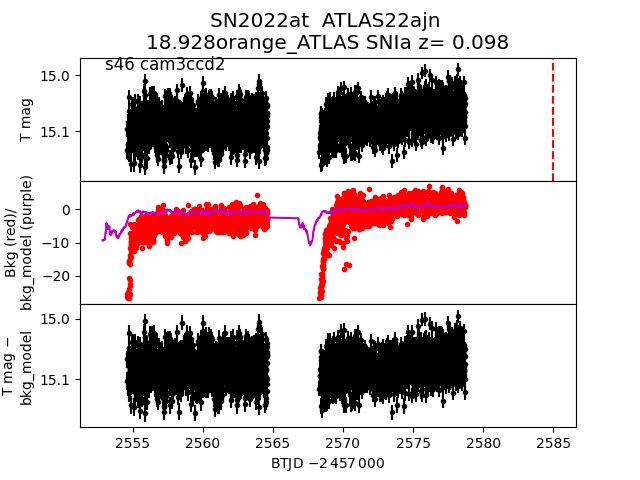
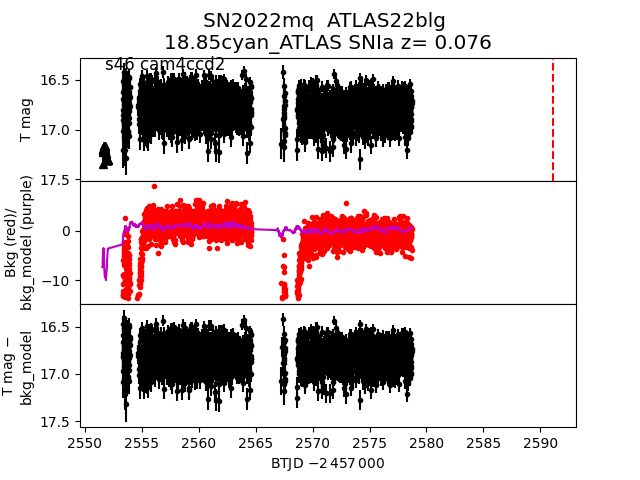
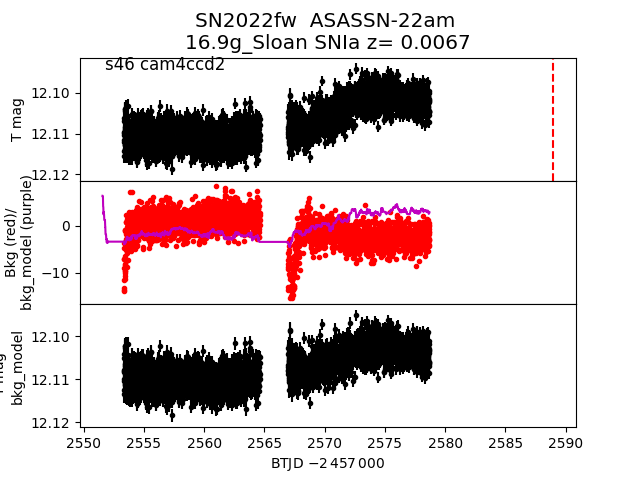
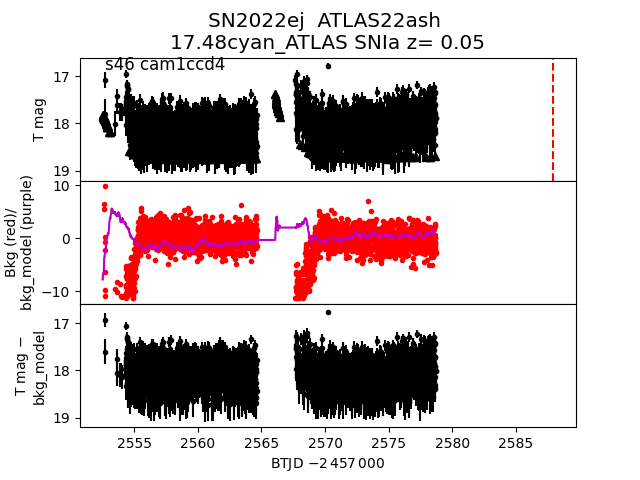
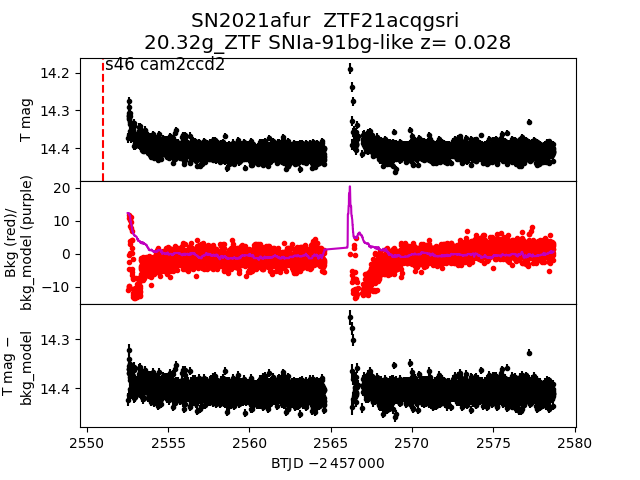
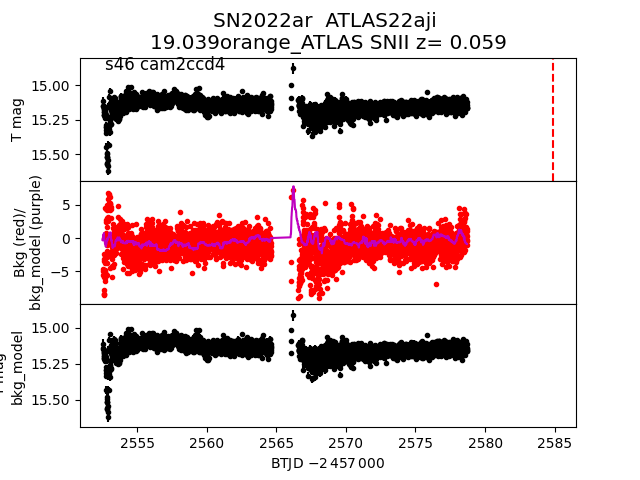
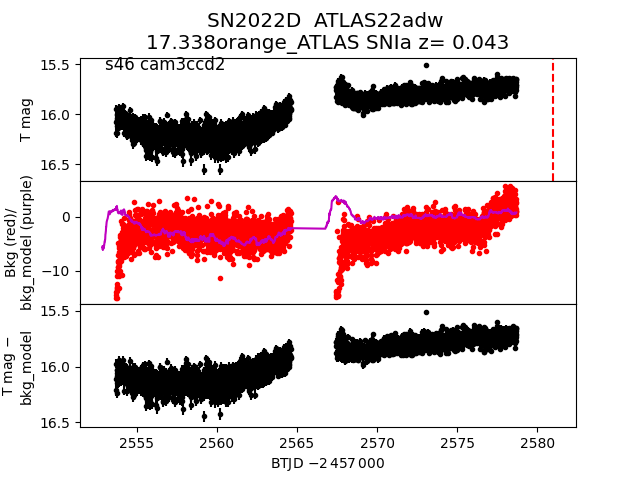
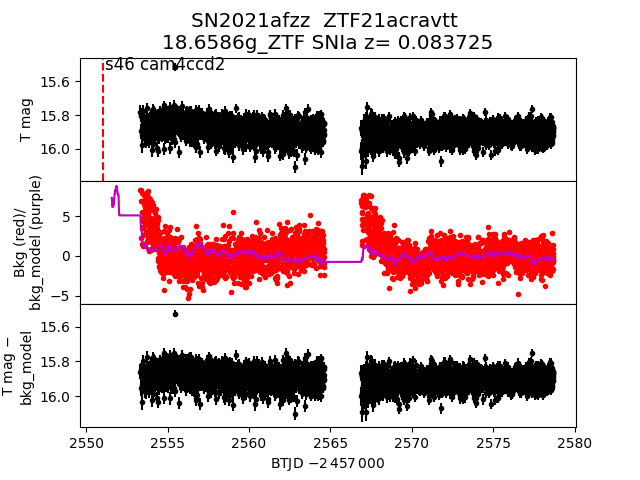
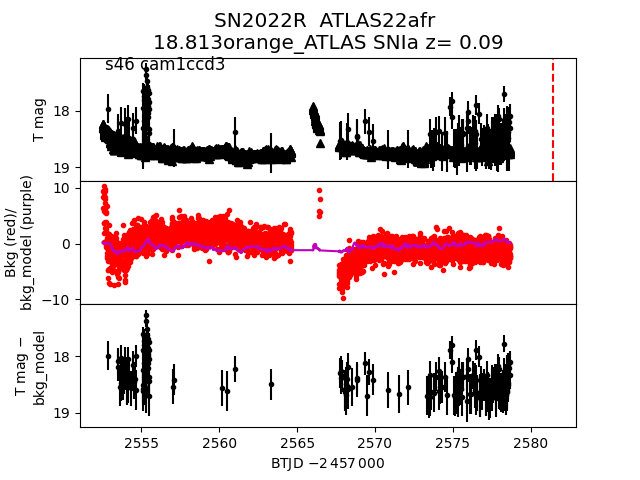
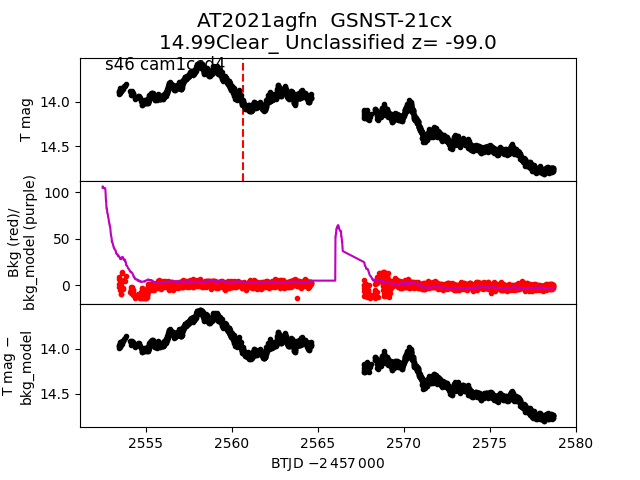
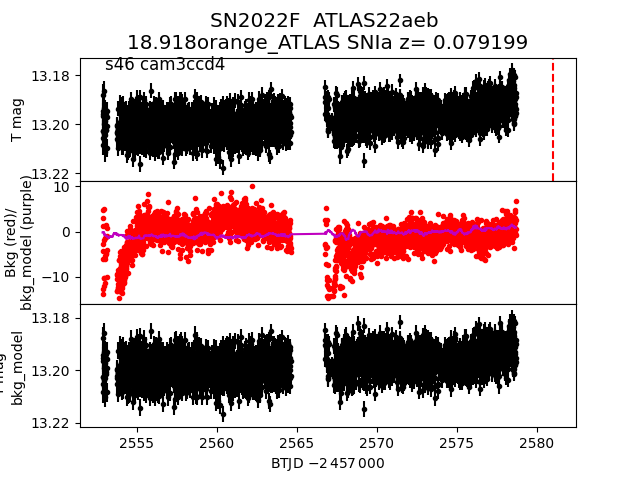
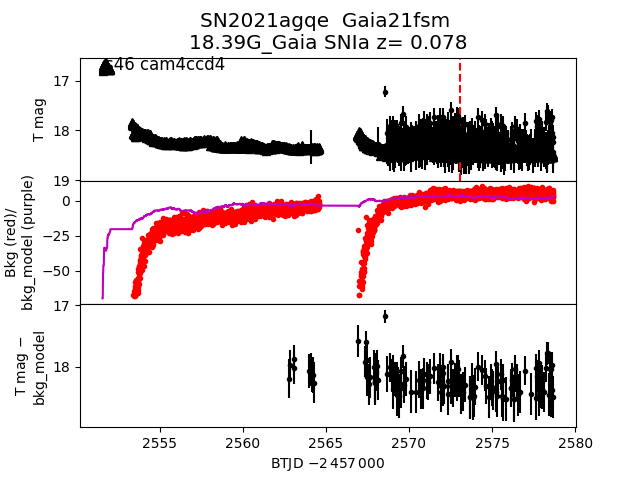
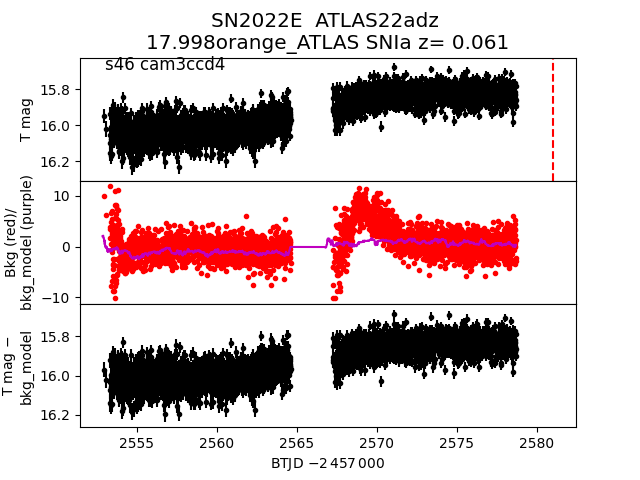
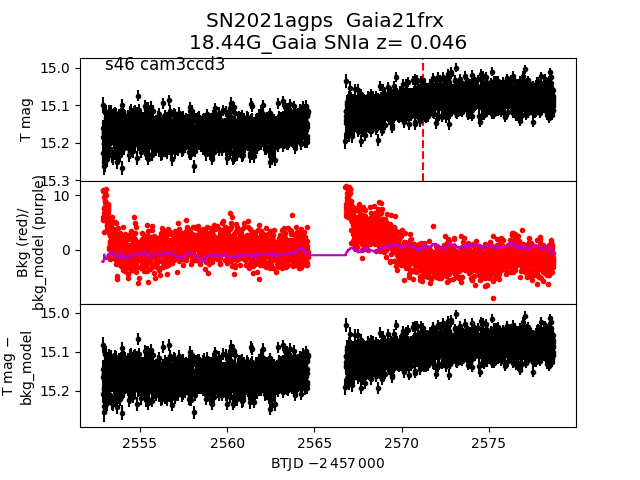
Each figure has three panels. The top panel shows the transient light curve, the middle panel shows the local background (estimated in an annulus), and the bottom panel shows a "background-model corrected" light curve. Details about the background model are in the README.
The vertical red line marks the time of discovery reported to TNS. Other useful metadata from TNS is in the figure title.
Note that the top and bottom panel are in magnitudes, while the middle panel is in differential flux units. The magnitudes are calibrated to the flux in the reference image used for image subtraction. Thus, flux from the host galaxy is included in these magnitudes.
3-sigma upper limits are plotted as triangles with no errorbars. A typical limiting magnitude is 19.6 in 30 minutes or 18.4 in 200 seconds (for low backgrounds).
The links allow you to download the light curve data as a text file.
More details in the README.
2022hf
 2021agji
 2021aggu
 2022at
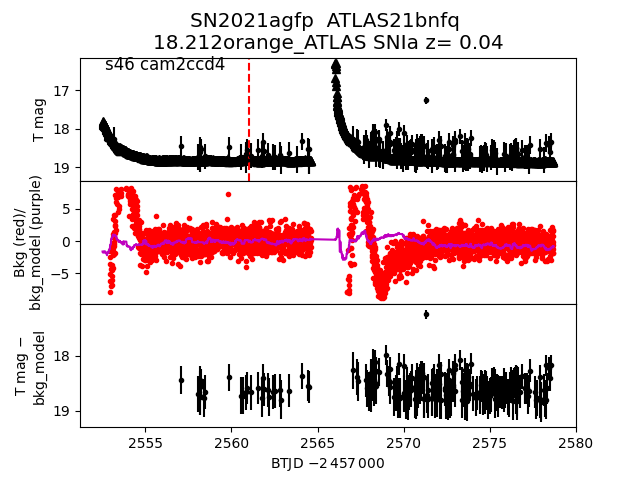
 2021agfp
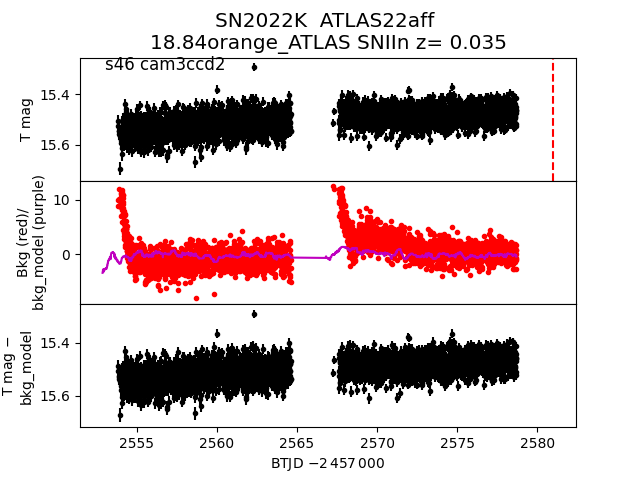
 2022K
2022K
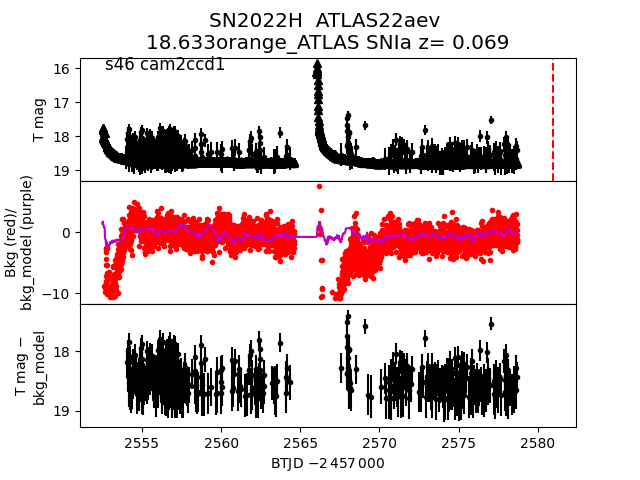
 2022H
2022H
 2022mq
 2022fw
 2022ej
 2021afur
 2022ar
 2022D
2022D
 2021afzz
 2022R
2022R
 2021agfn
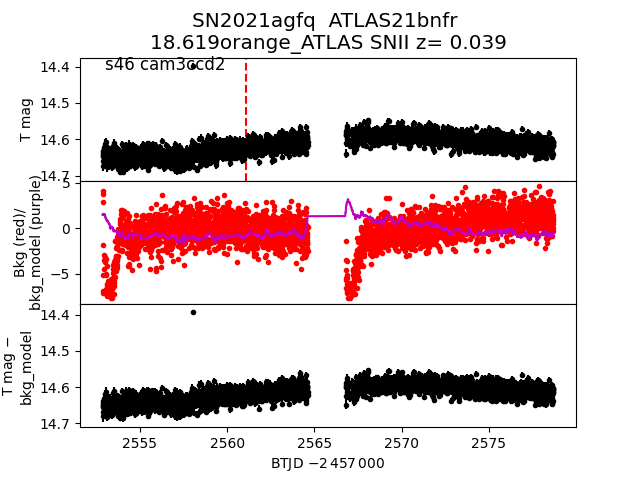
 2021agfq
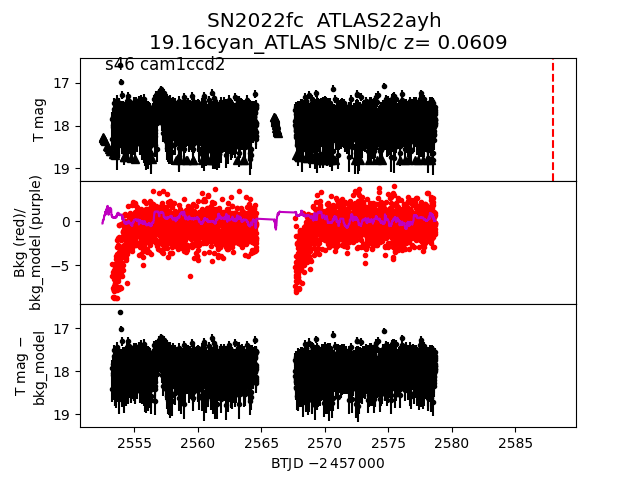
 2022fc
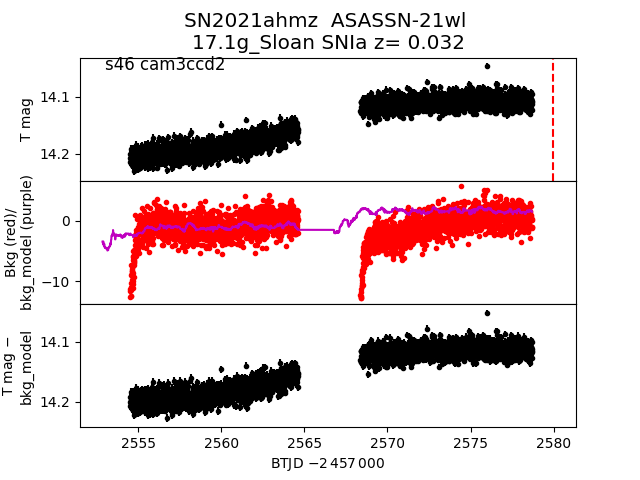
 2021ahmz
 2022F
2022F
 2021agqe
 2022E
2022E
 2021agps
 2021agrt