all transients in sector46 (135 total)
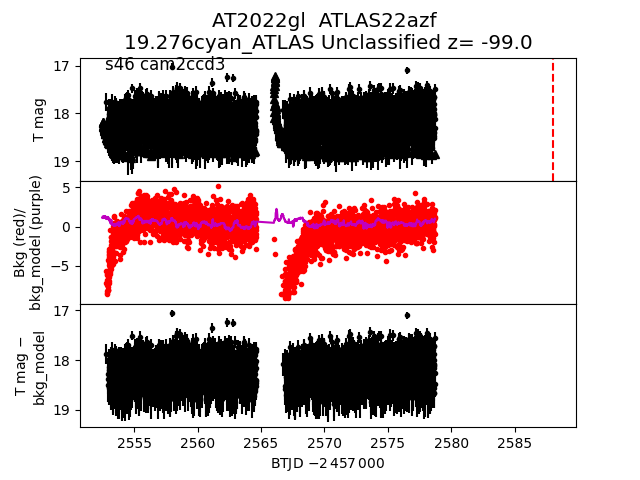
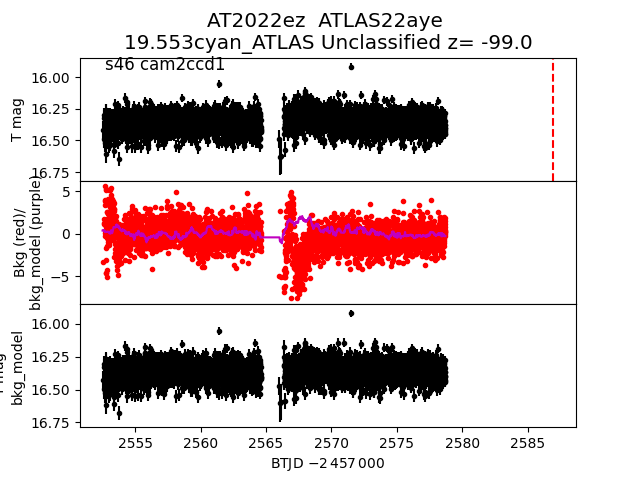
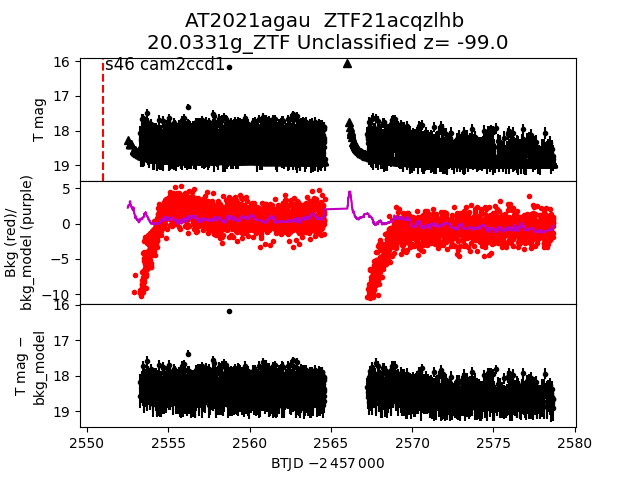
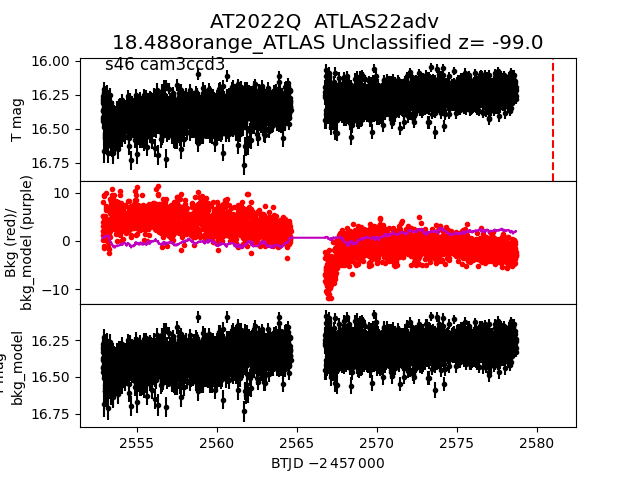
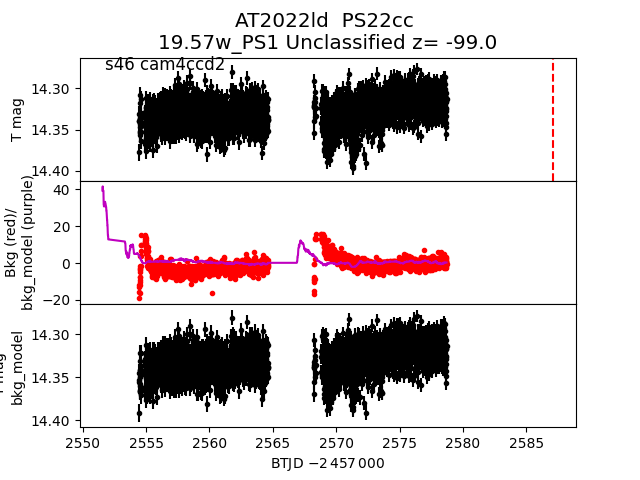
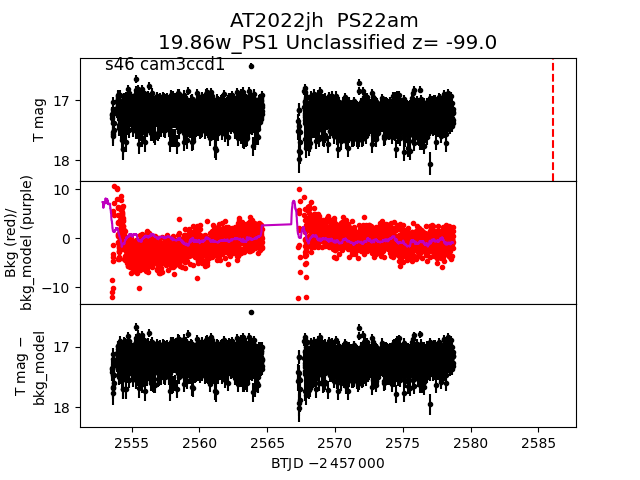
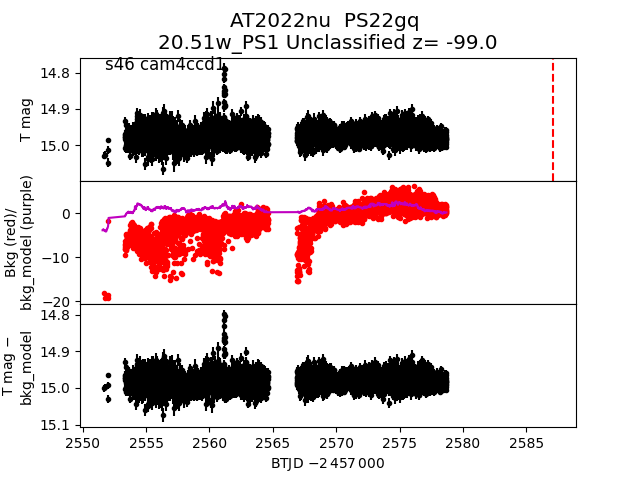
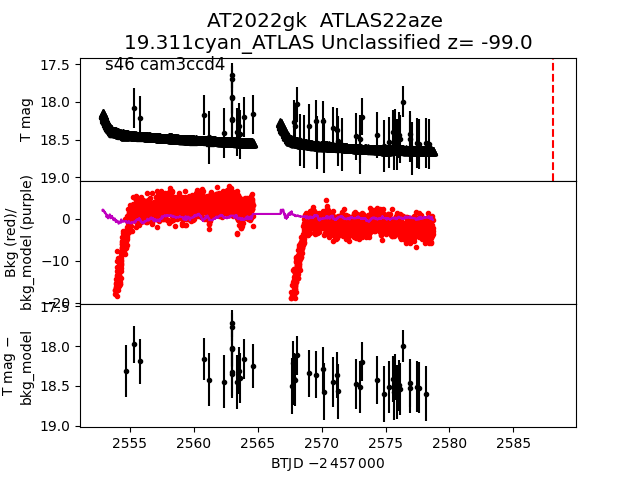
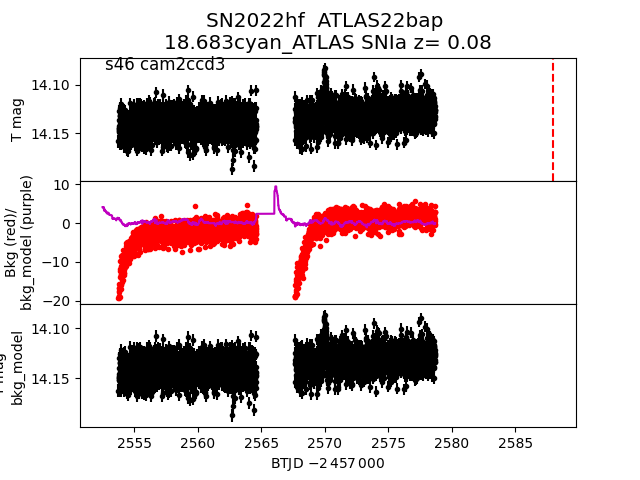
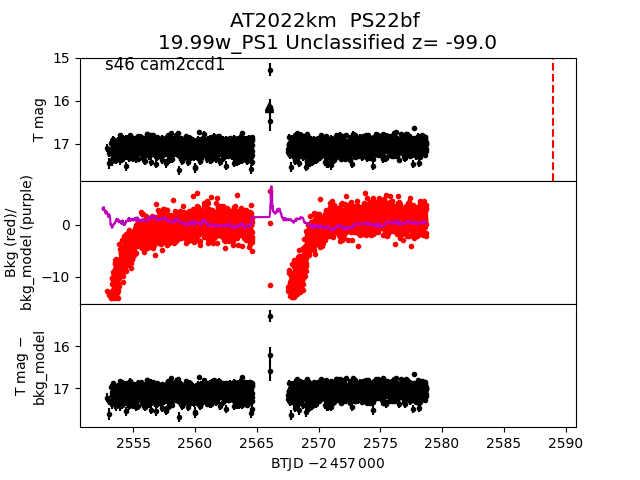
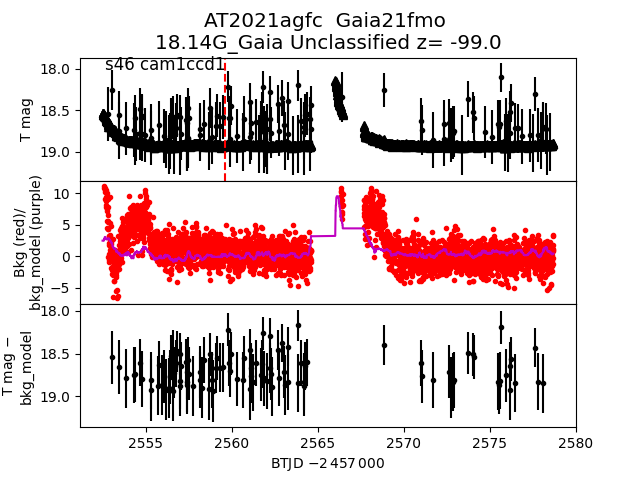
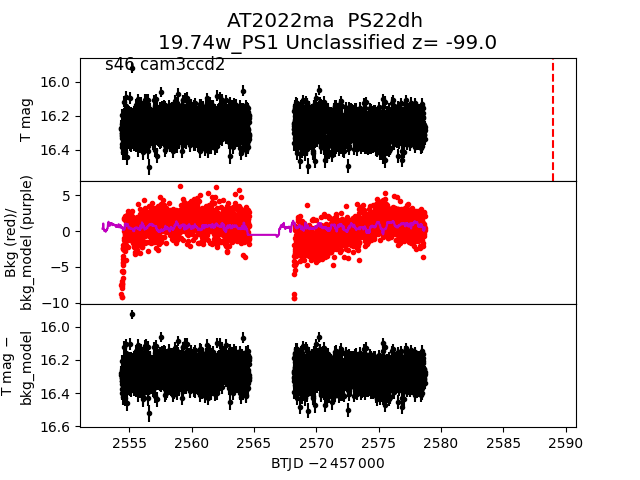
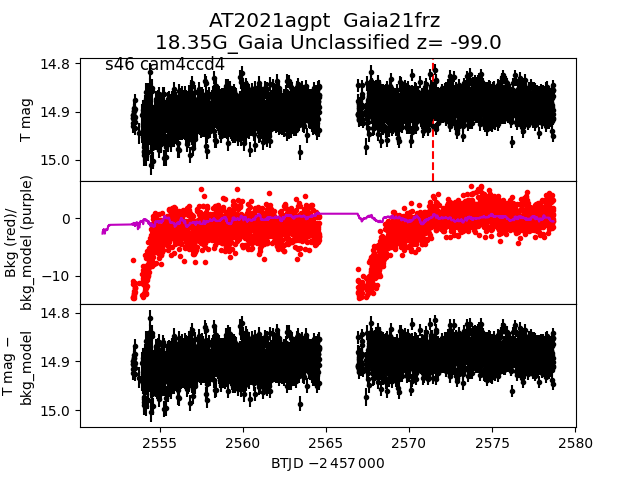
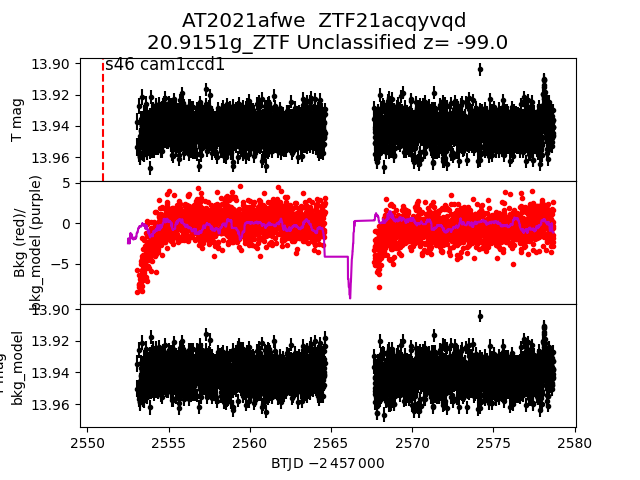
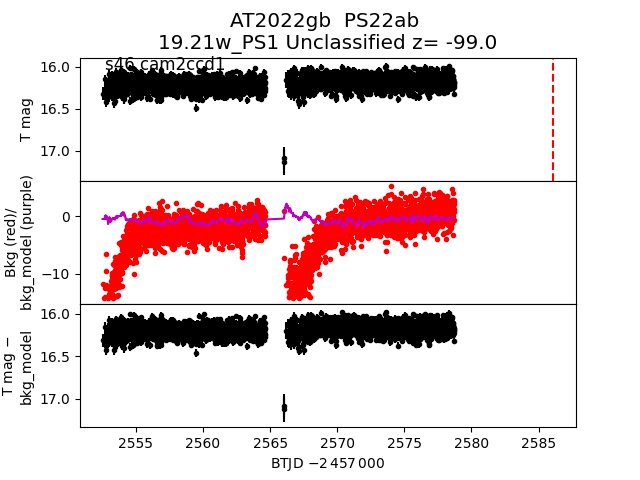
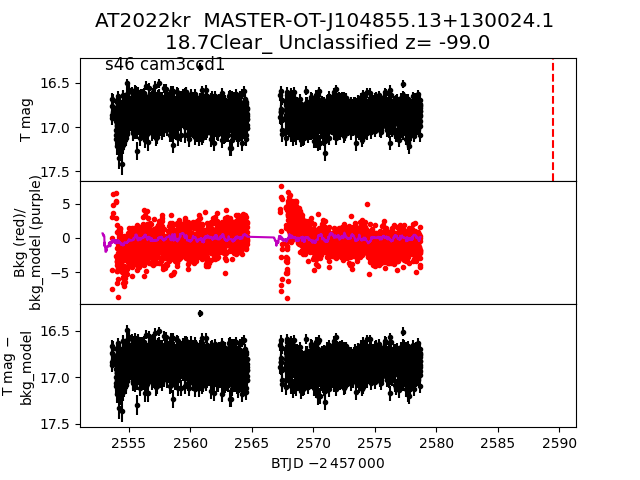
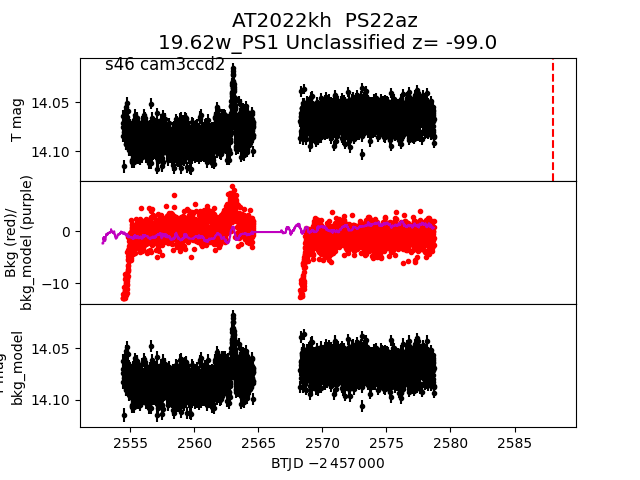
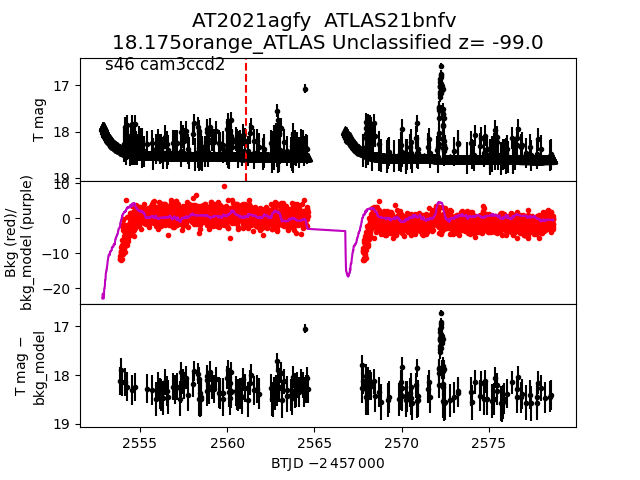
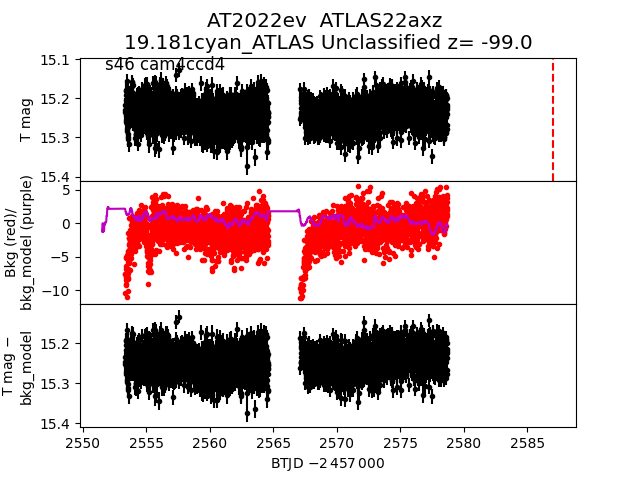
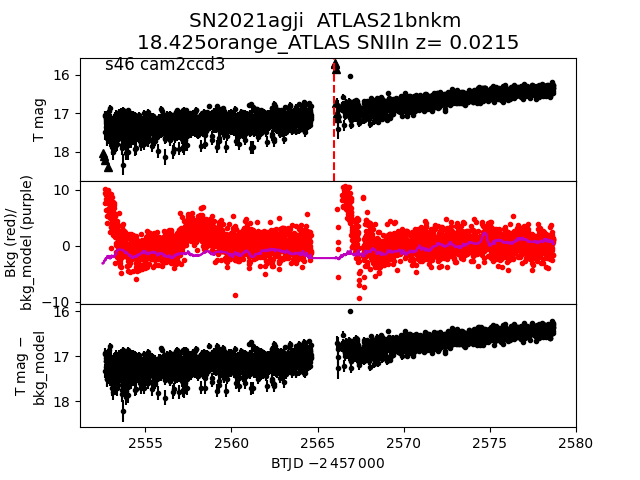
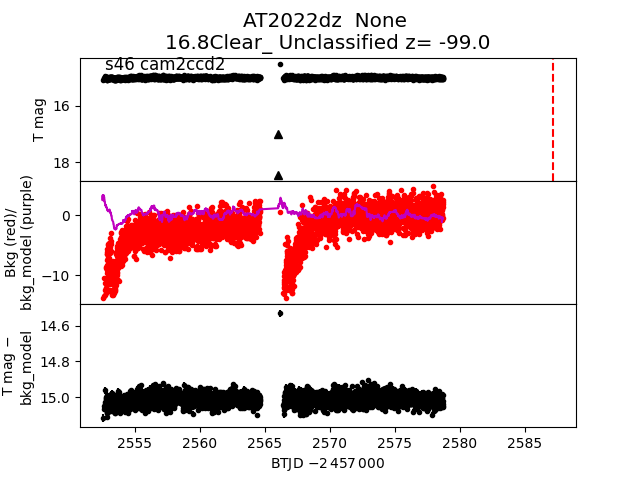
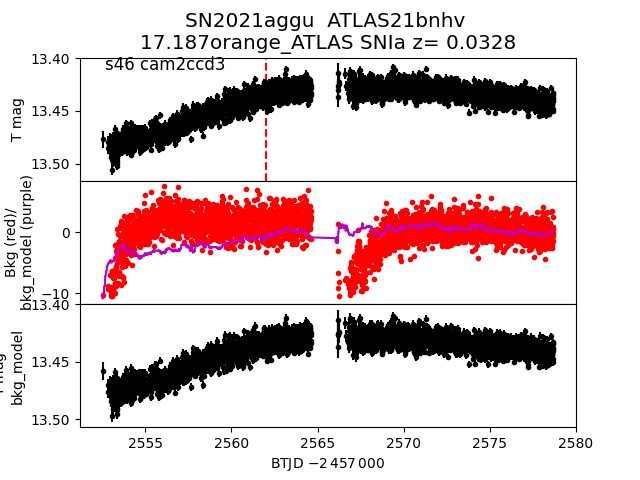
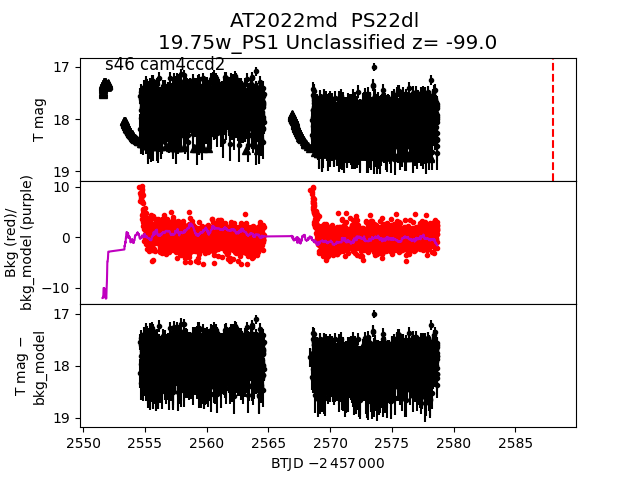
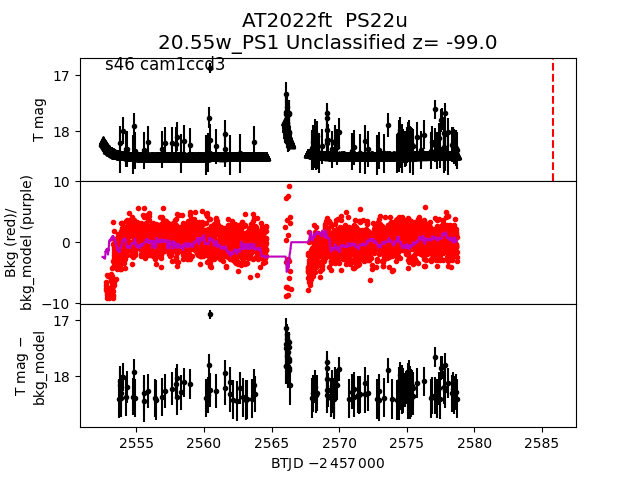
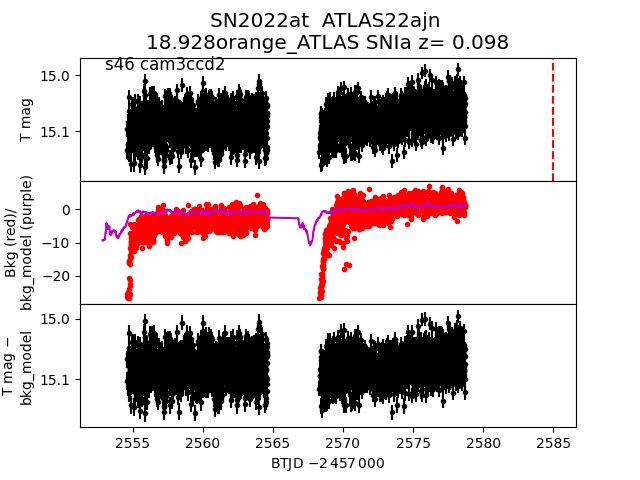
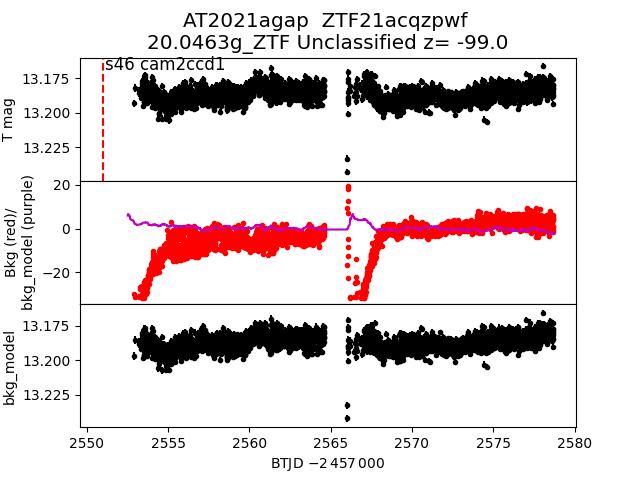
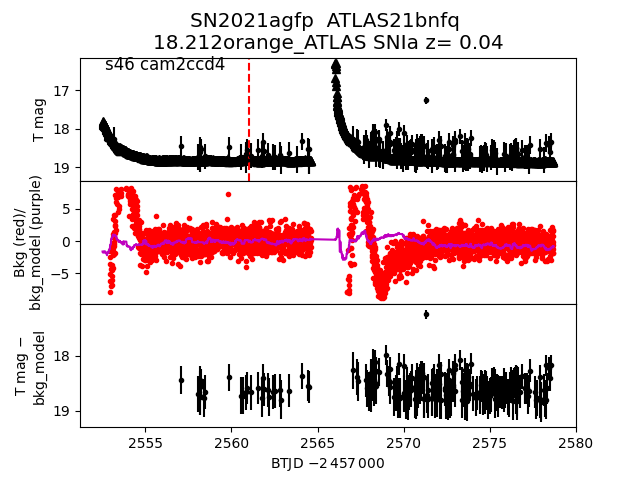
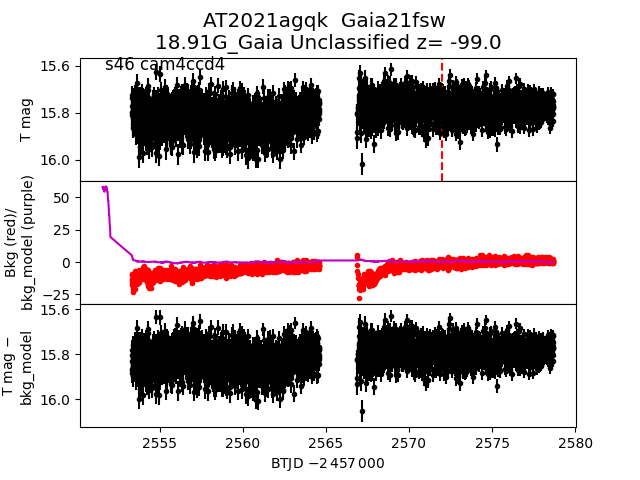
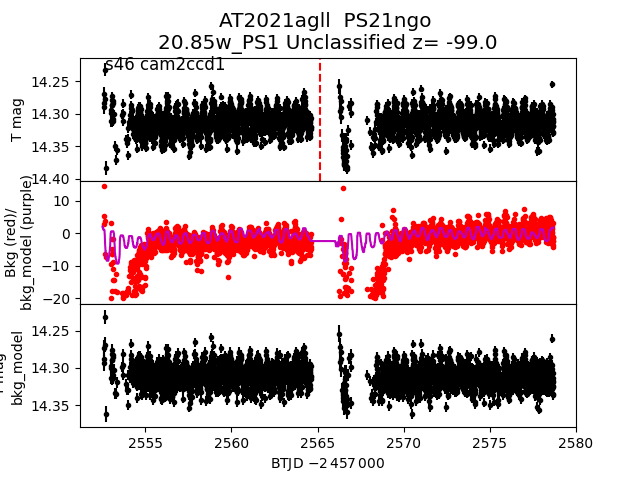
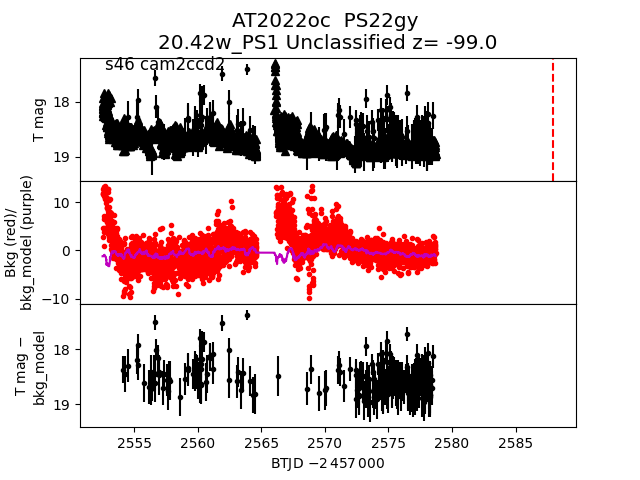
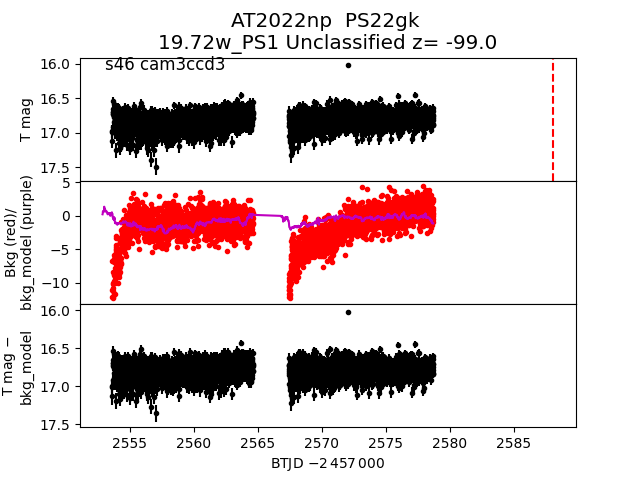
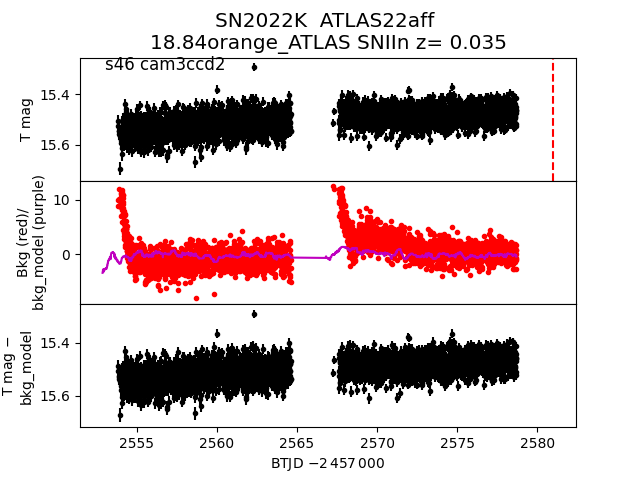
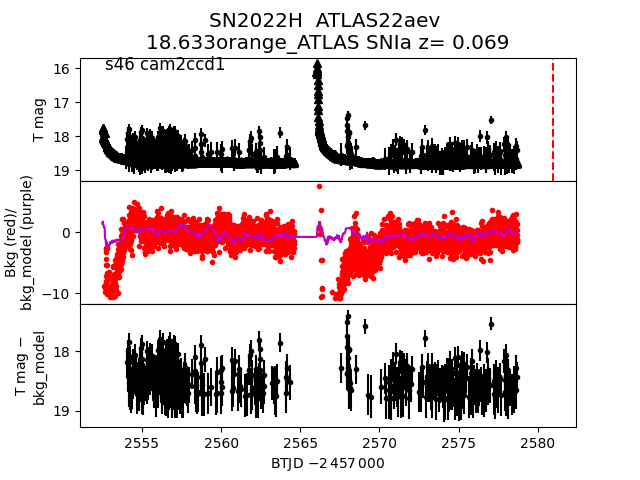
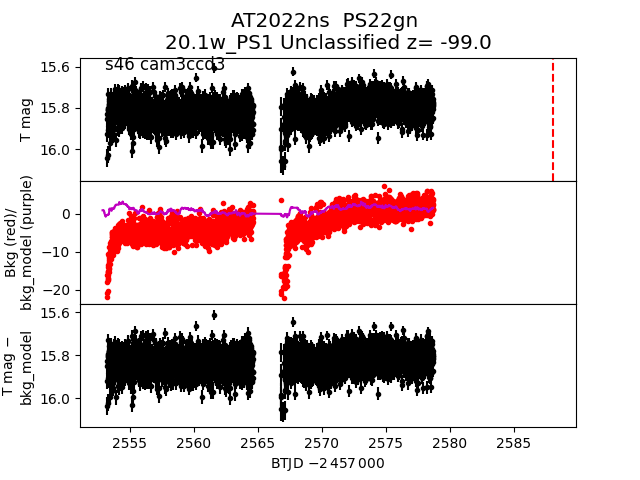
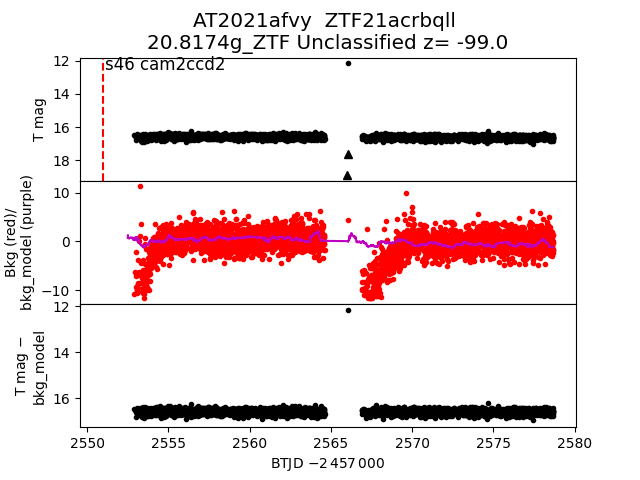
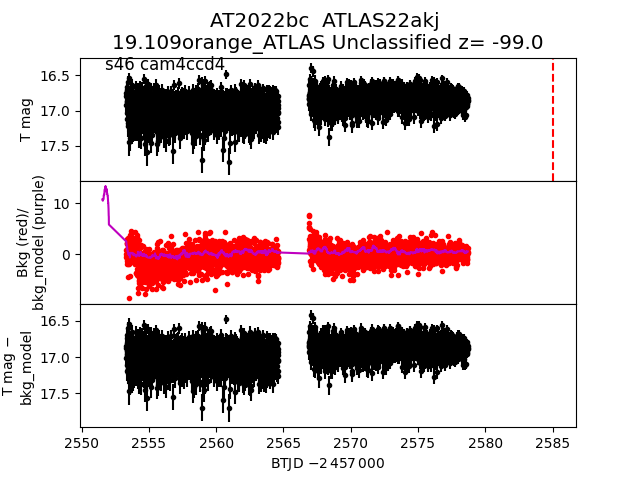
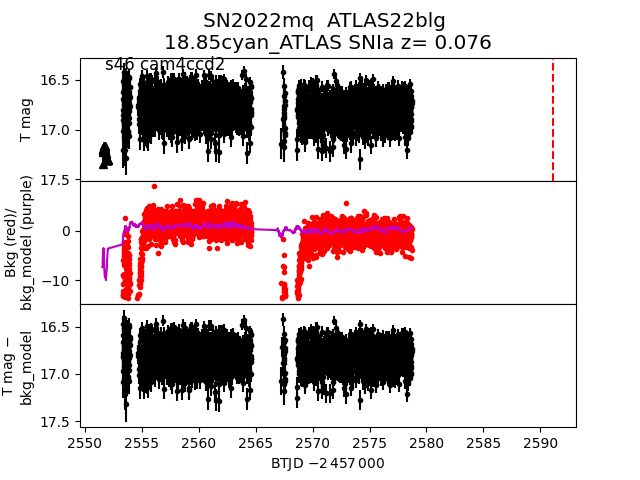
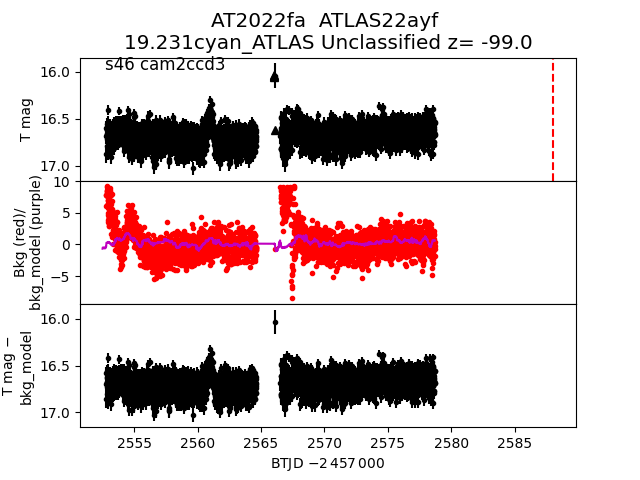
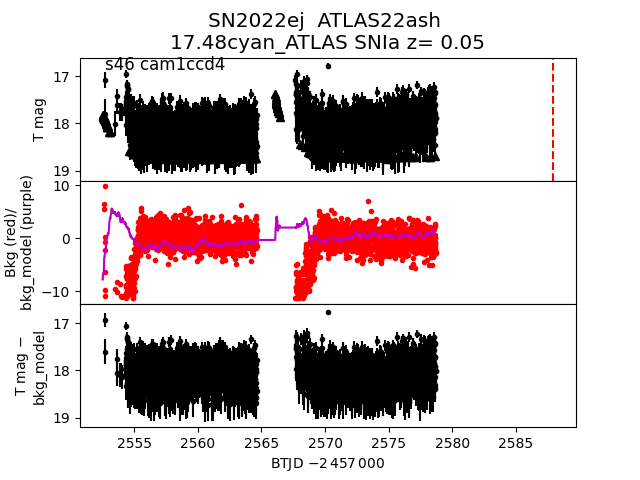
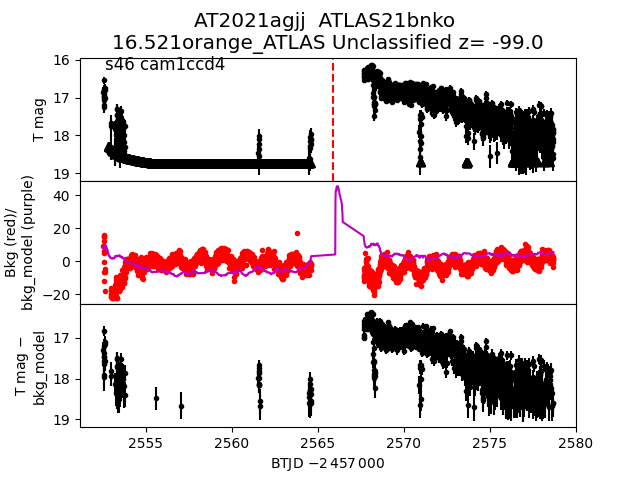
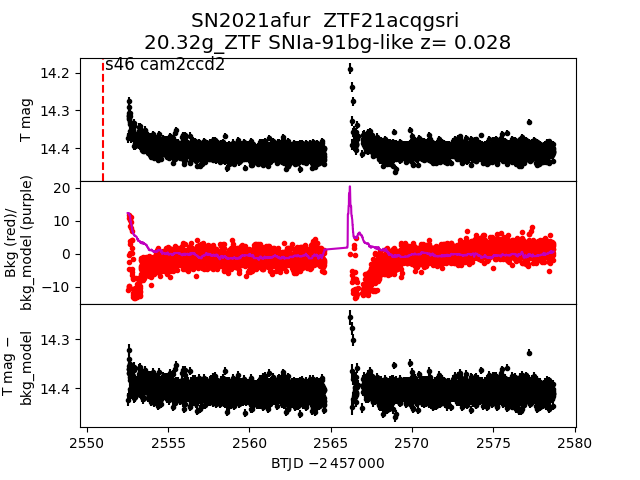
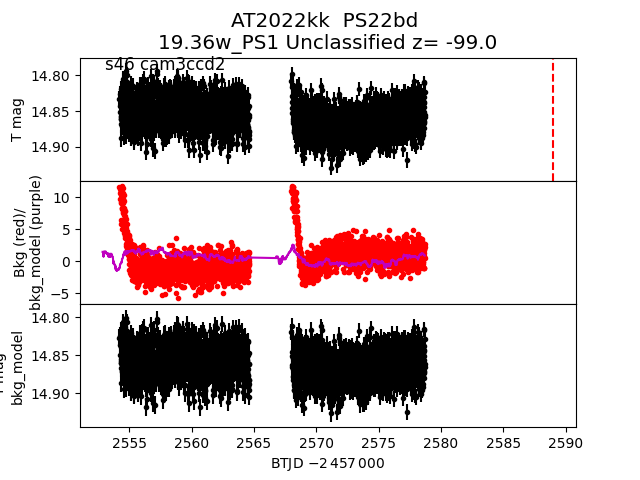
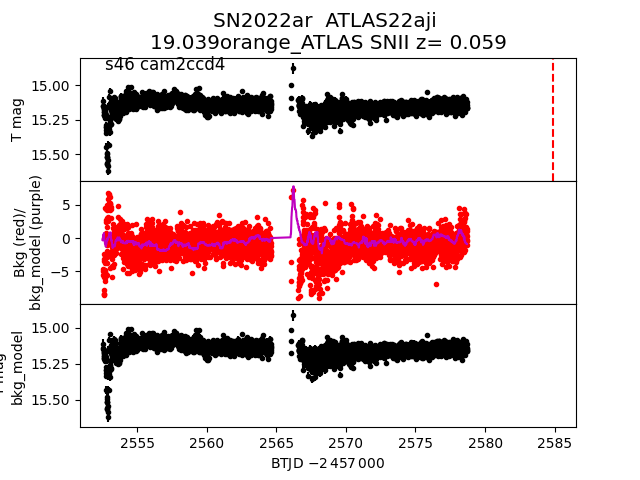
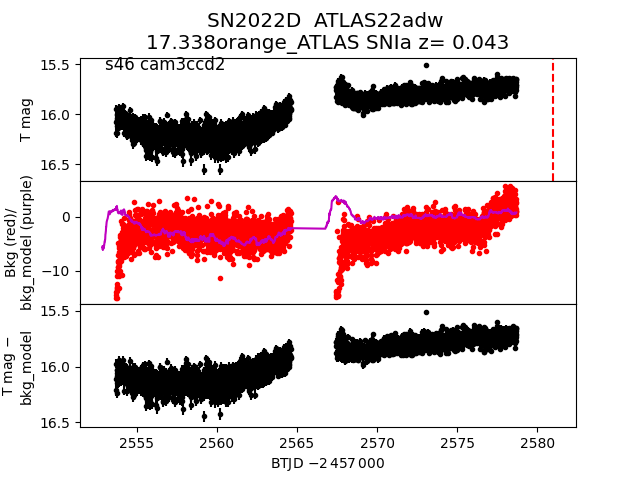
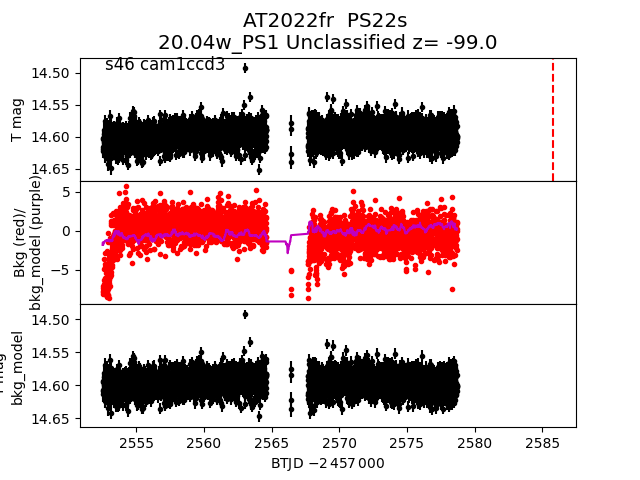
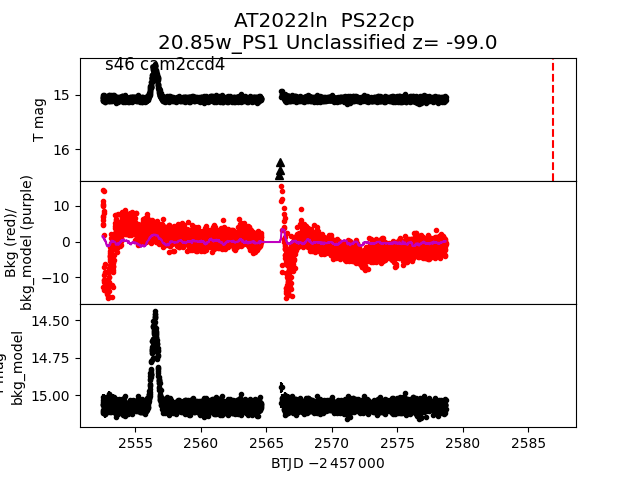
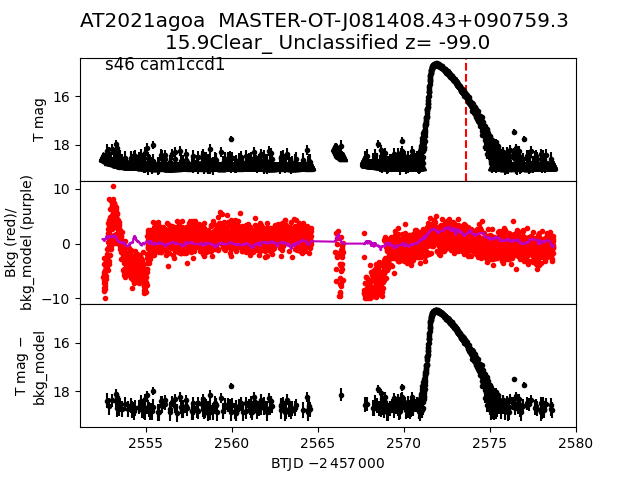
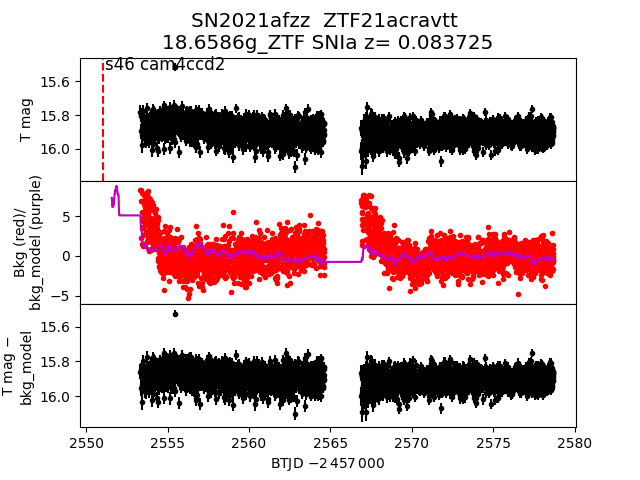
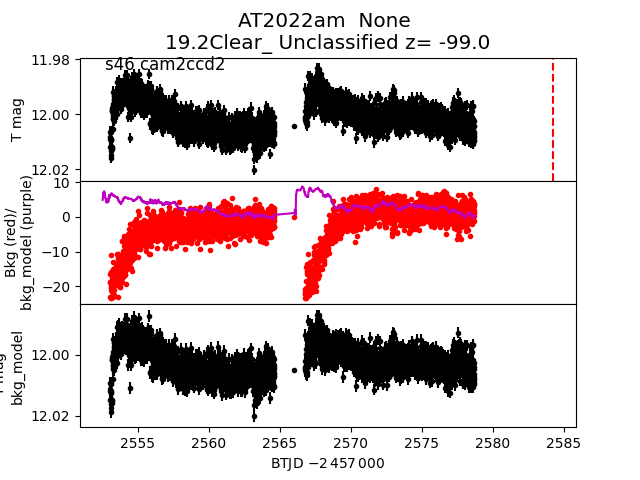
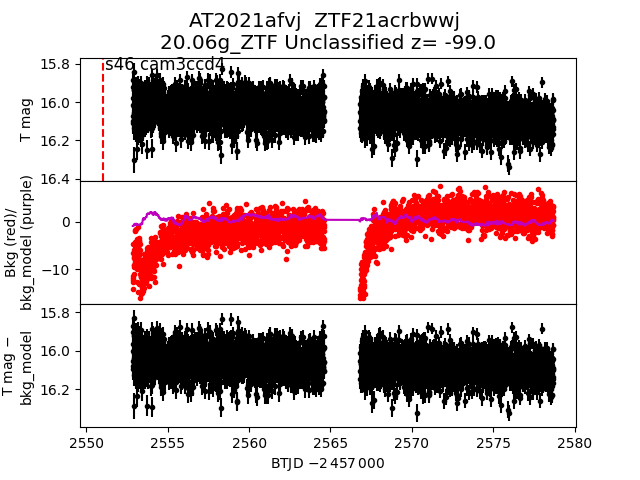
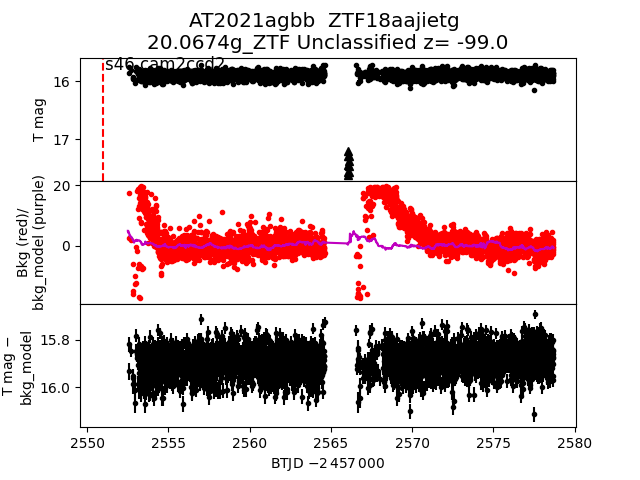
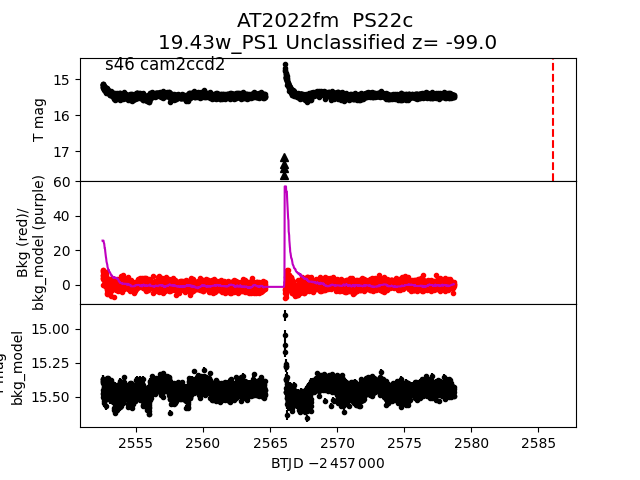
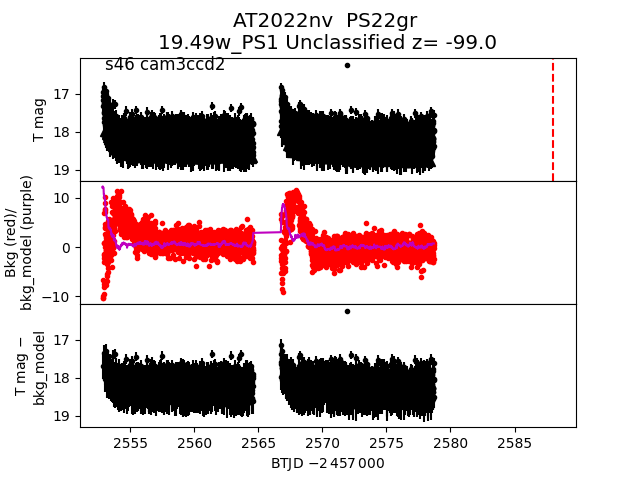
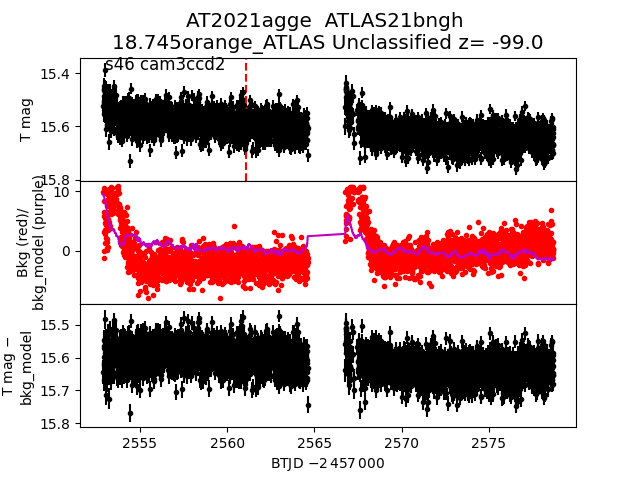
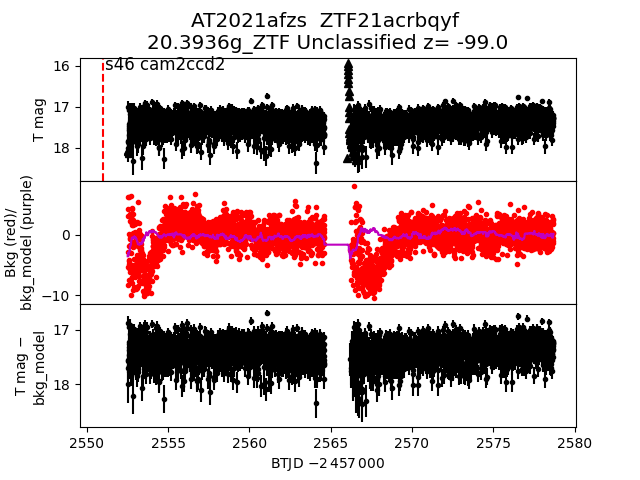
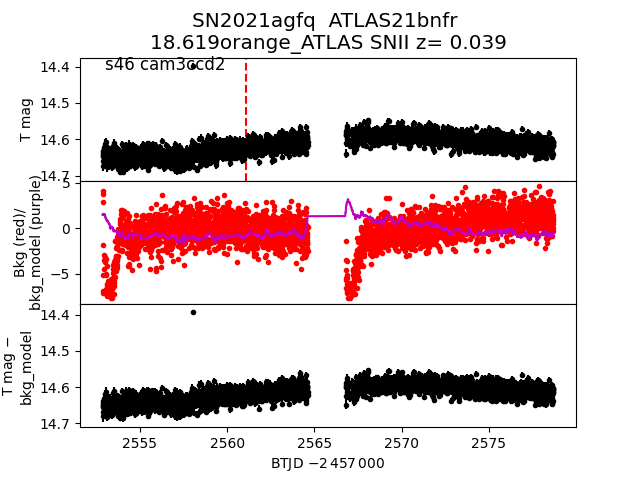
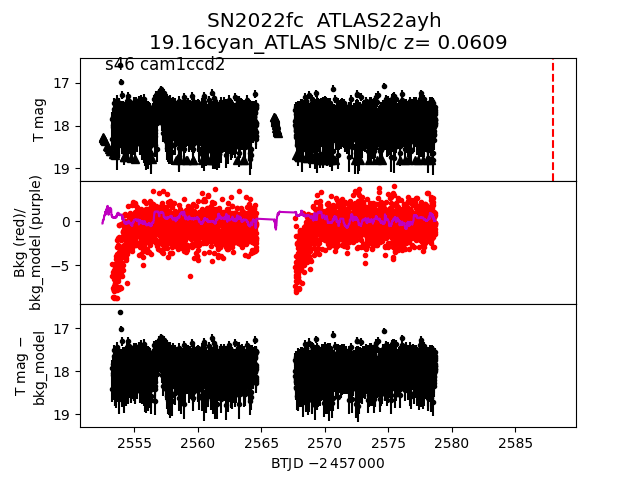
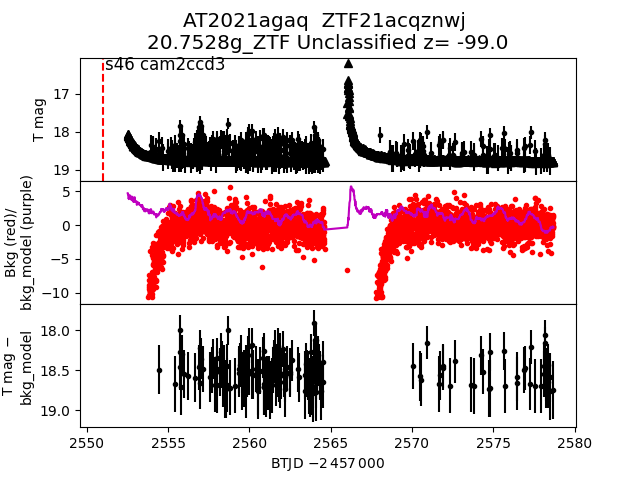
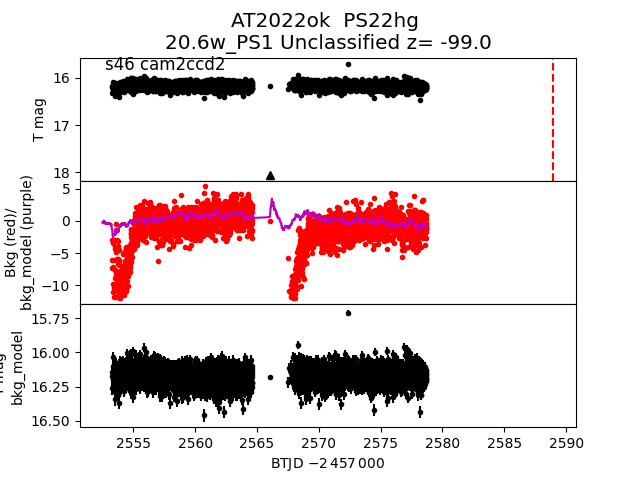
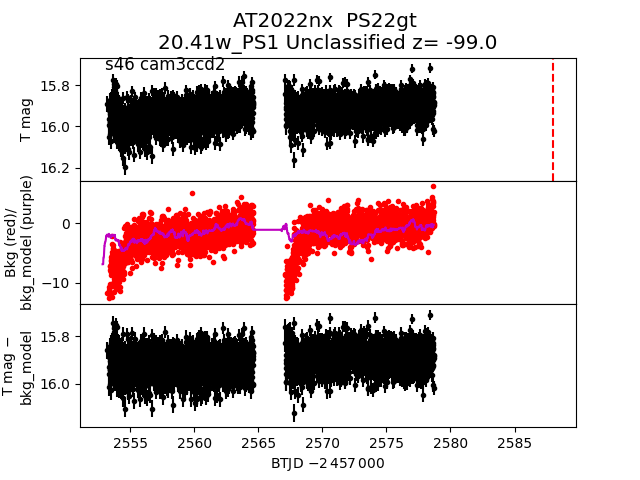
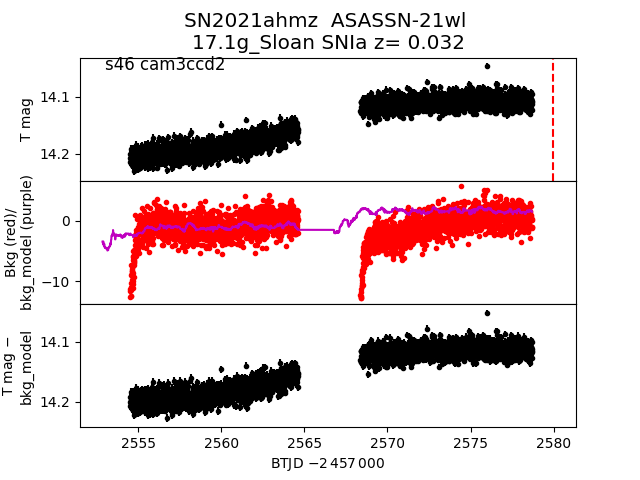
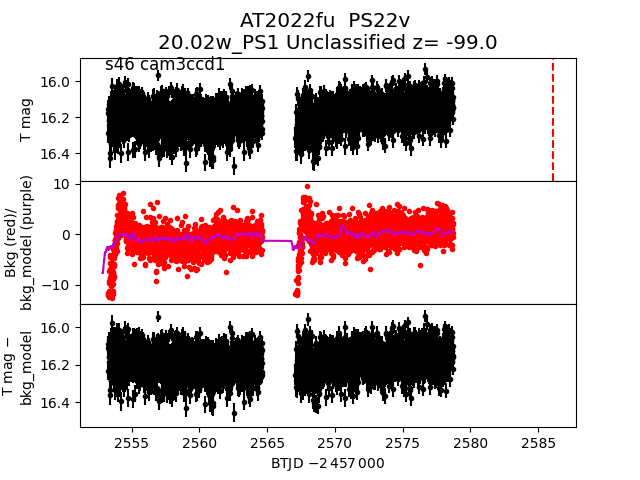
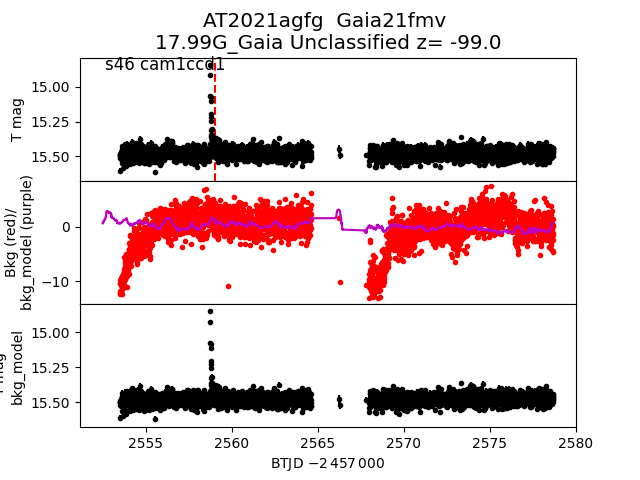
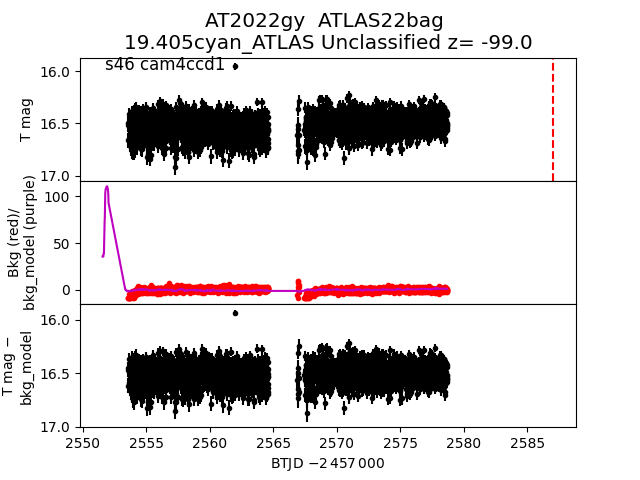
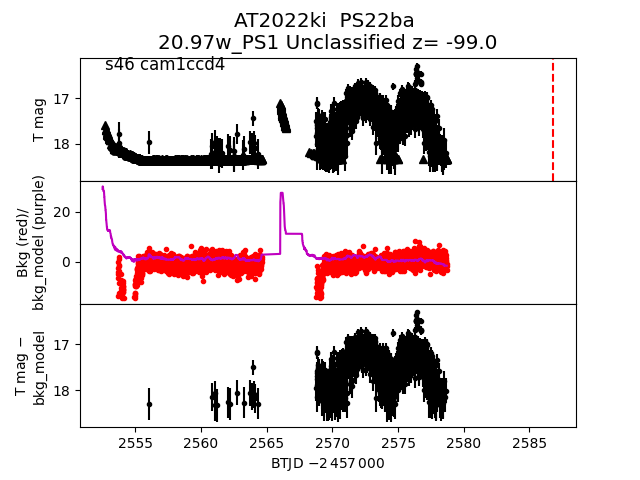
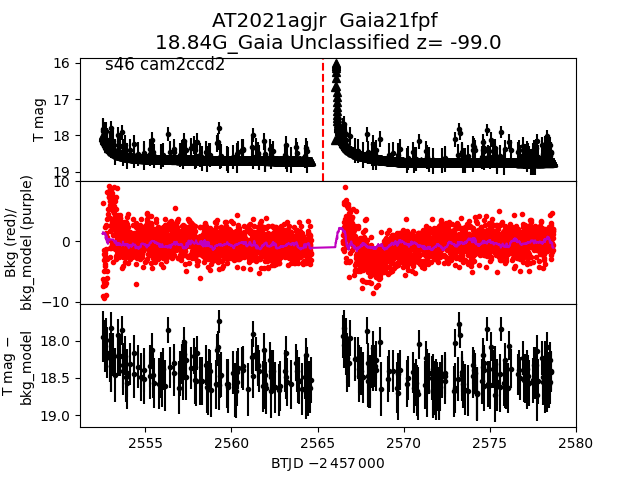
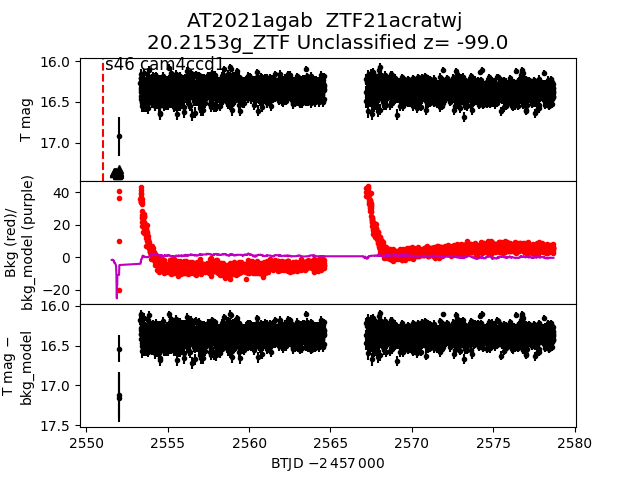
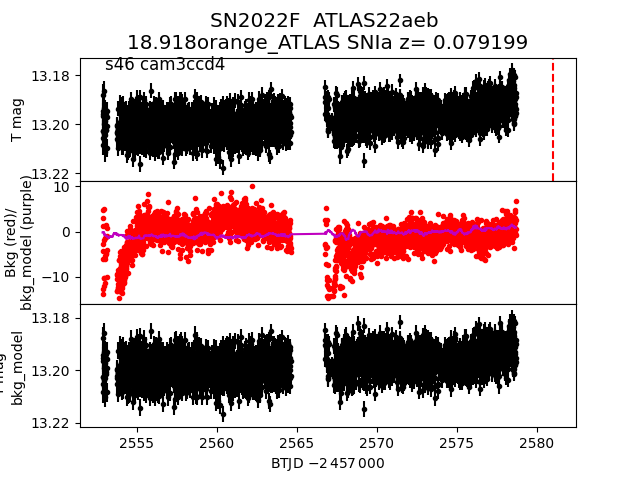
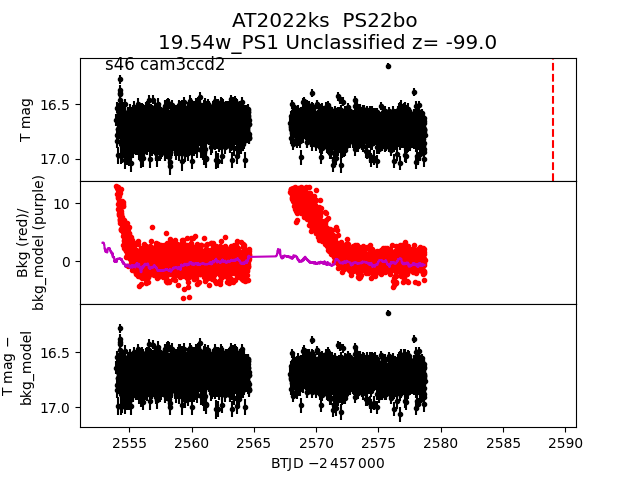
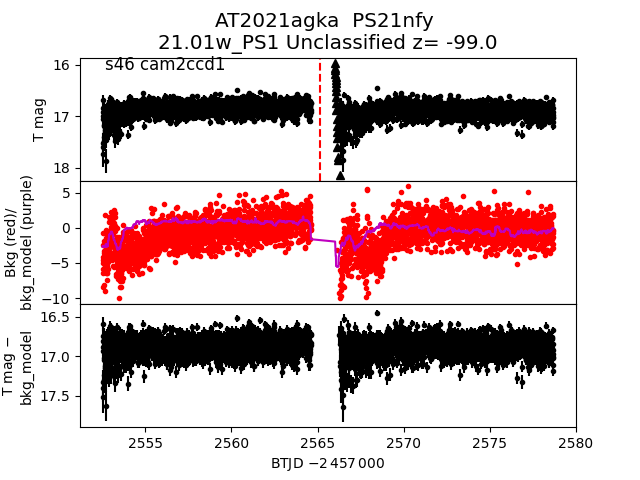
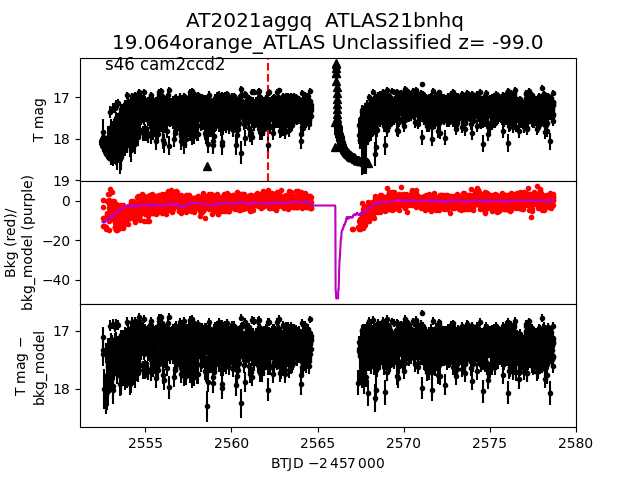
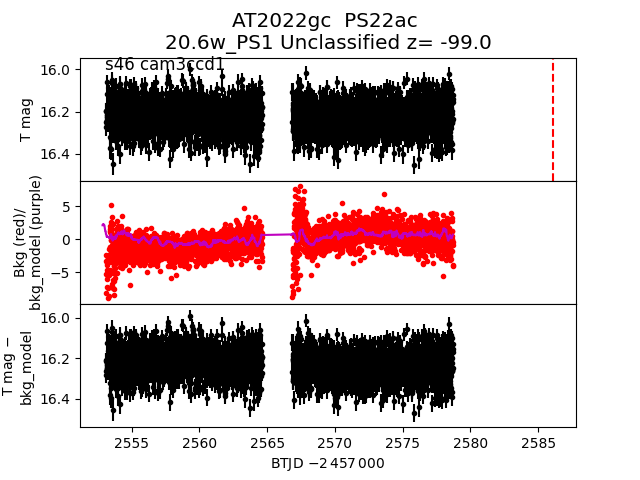
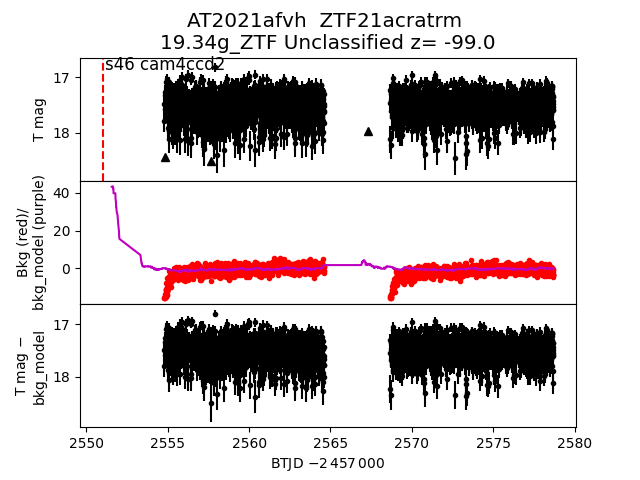
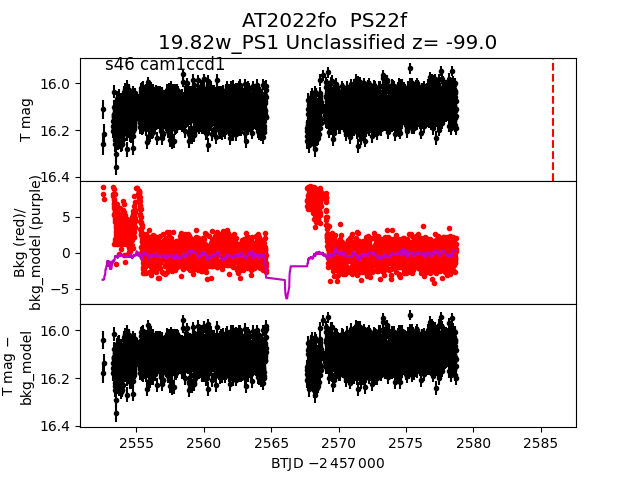
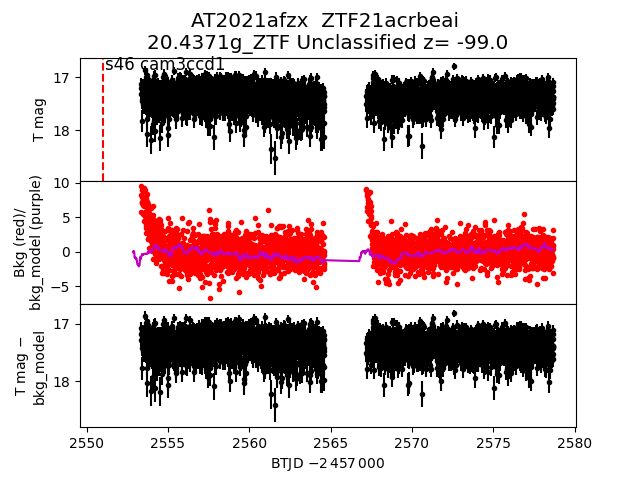
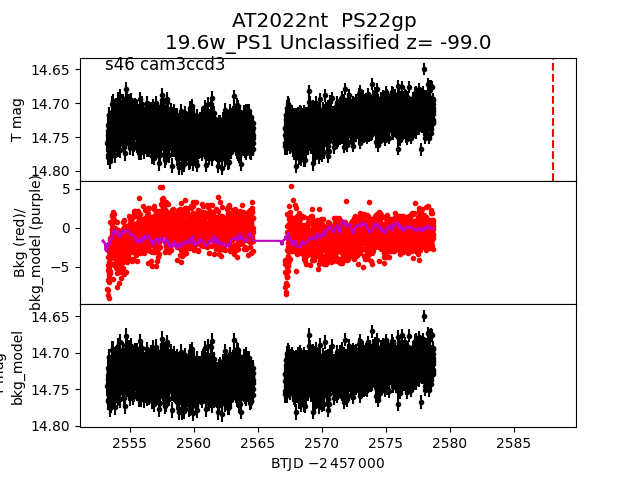
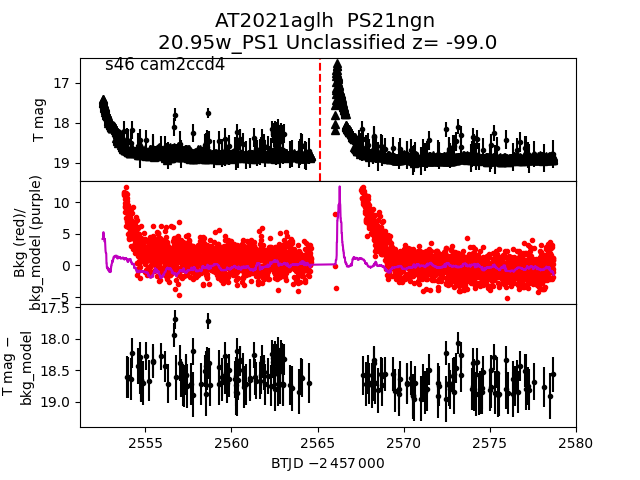
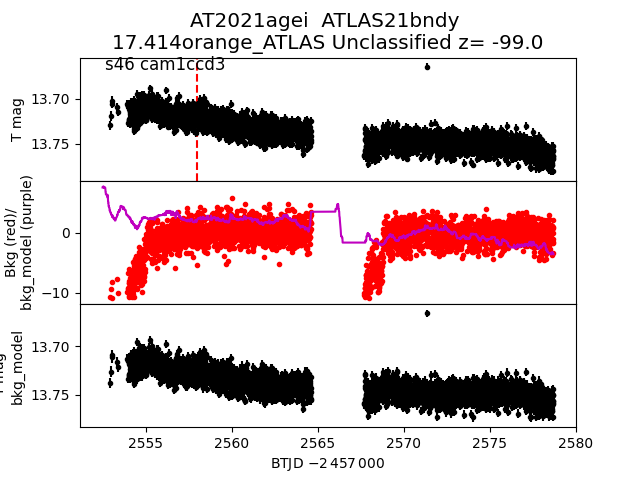
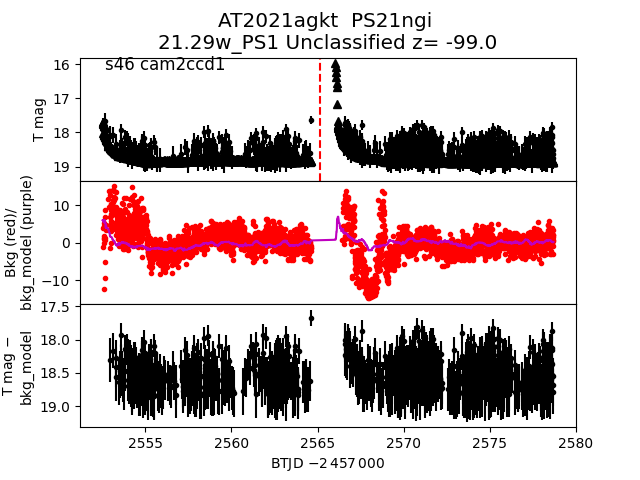
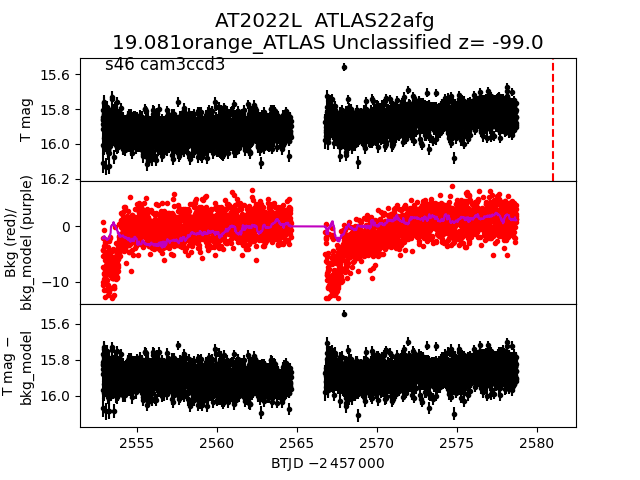
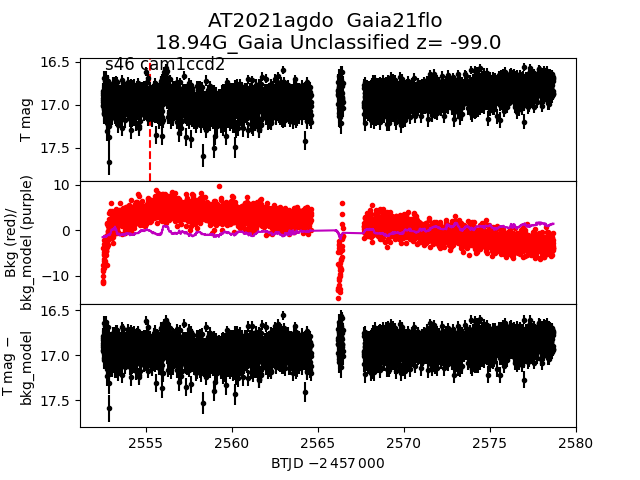
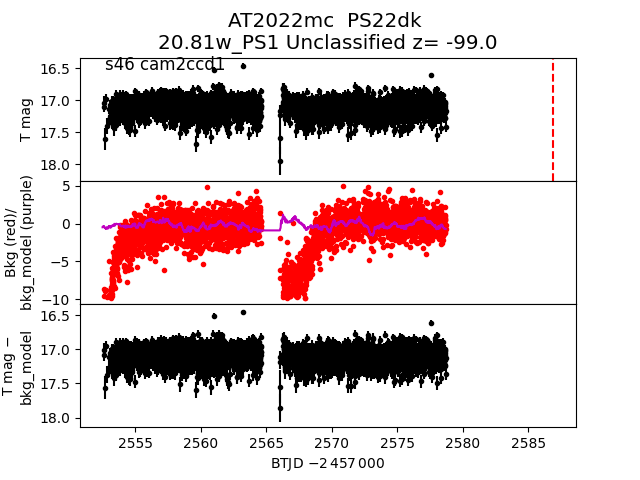
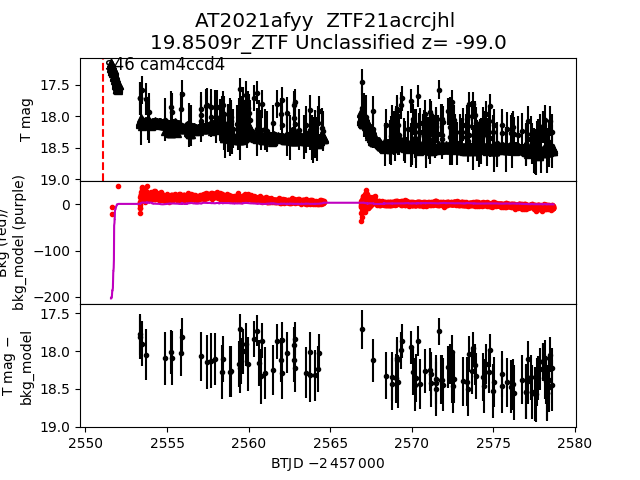
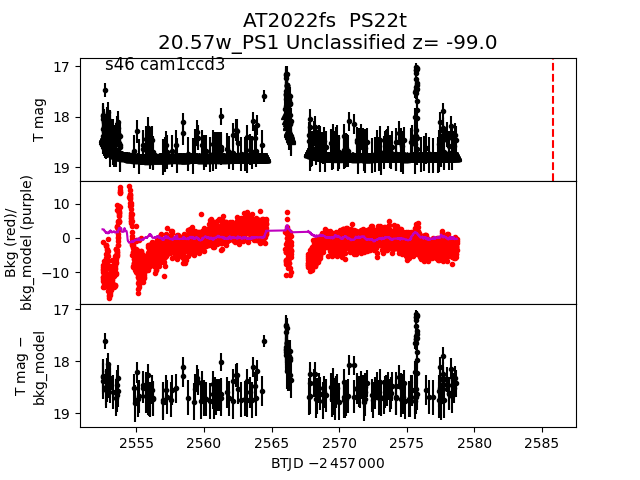
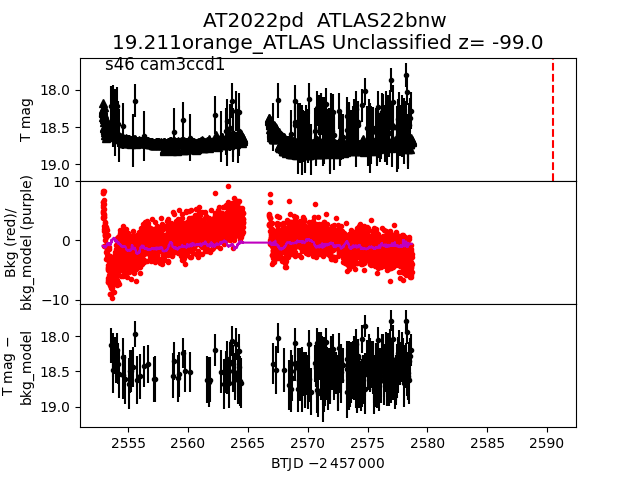
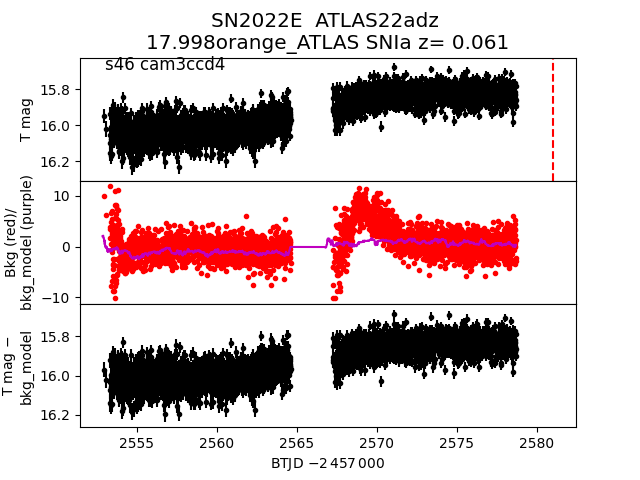
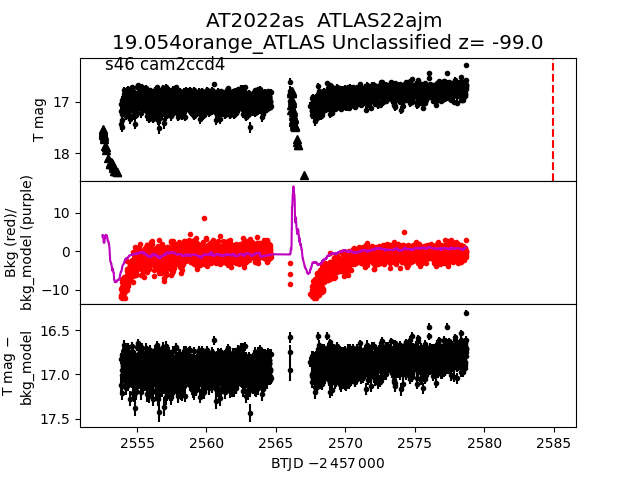
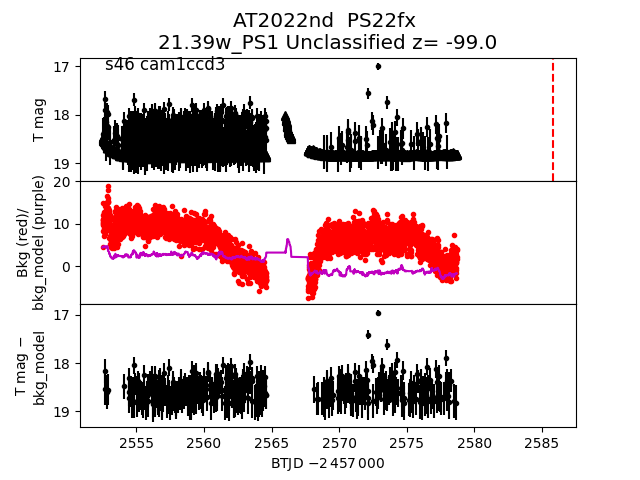
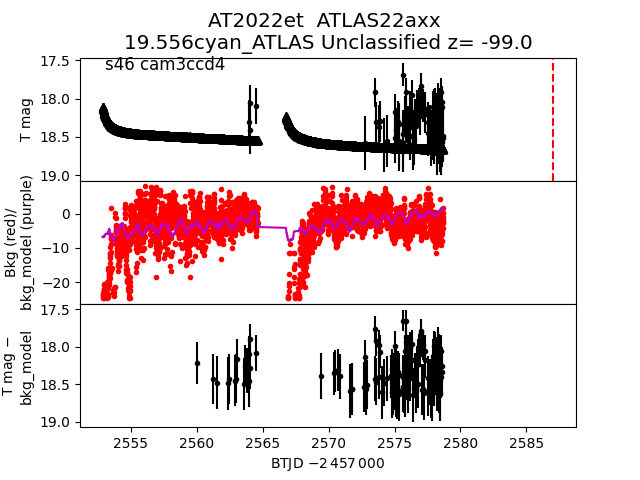
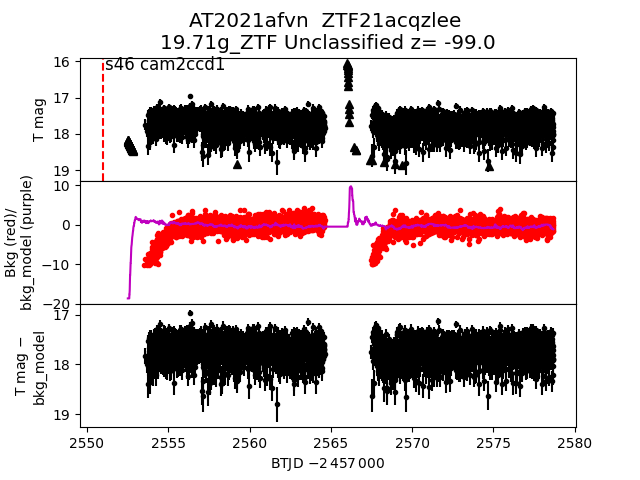
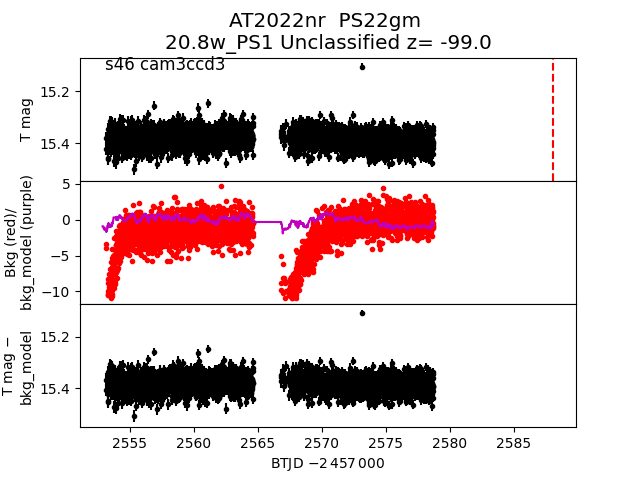
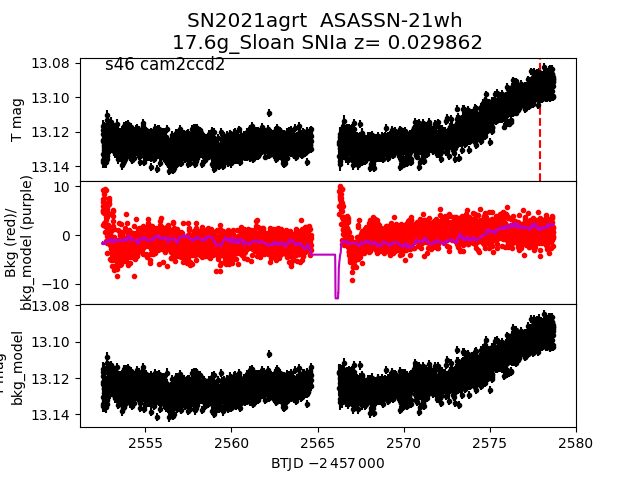
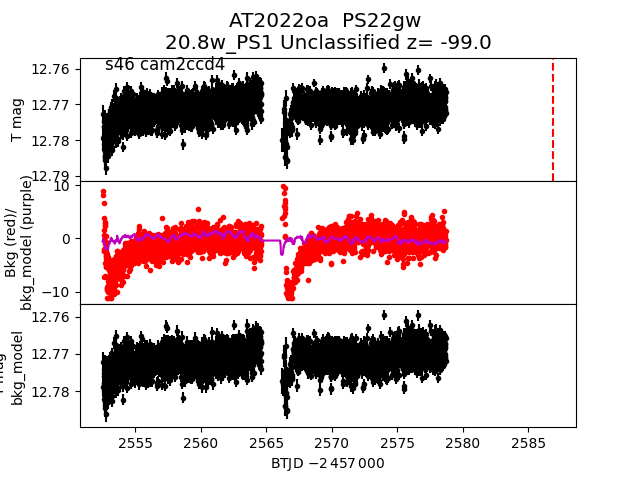
Each figure has three panels. The top panel shows the transient light curve, the middle panel shows the local background (estimated in an annulus), and the bottom panel shows a "background-model corrected" light curve. Details about the background model are in the README.
The vertical red line marks the time of discovery reported to TNS. Other useful metadata from TNS is in the figure title.
Note that the top and bottom panel are in magnitudes, while the middle panel is in differential flux units. The magnitudes are calibrated to the flux in the reference image used for image subtraction. Thus, flux from the host galaxy is included in these magnitudes.
3-sigma upper limits are plotted as triangles with no errorbars. A typical limiting magnitude is 19.6 in 30 minutes or 18.4 in 200 seconds (for low backgrounds).
The links allow you to download the light curve data as a text file.
More details in the README.
2022ez
 2021agau
 2022Q
2022Q
 2022ld
 2022jh
 2022nu
 2022gk
 2022hf
 2022km
 2021agfc
 2022ma
 2021agpt
 2021afwe
 2022gb
 2022kr
 2022kh
 2021agfy
 2022ev
 2021agji
 2022dz
 2021aggu
 2022md
 2022ft
 2022at
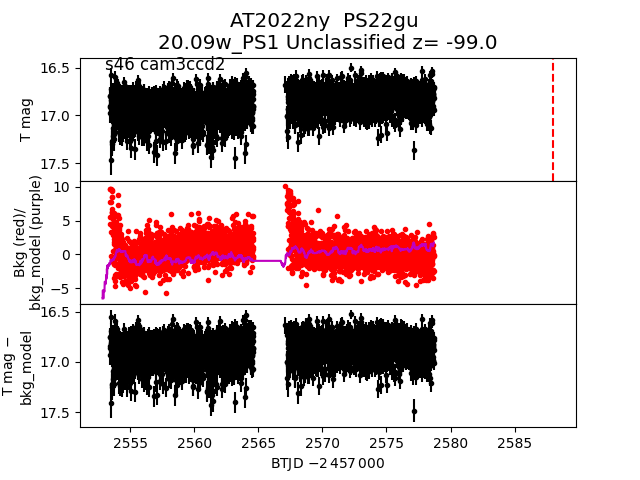
 2022ny
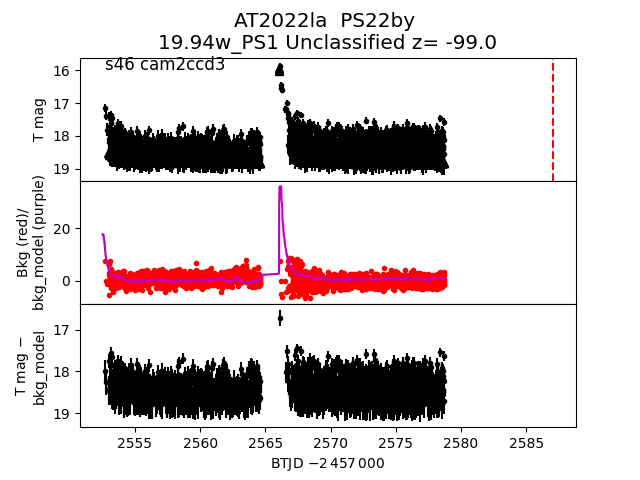
 2022la
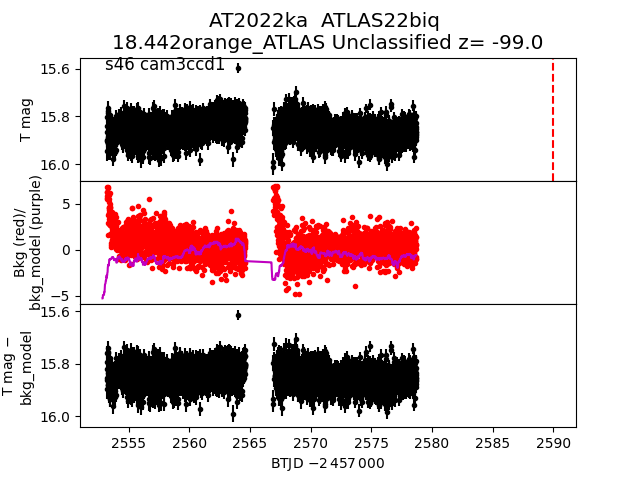
 2022ka
 2021agap
 2021agfp
 2021agqk
 2021agll
 2022oc
 2022np
 2022K
2022K
 2022H
2022H
 2022ns
 2021afvy
 2022bc
 2022mq
 2022fa
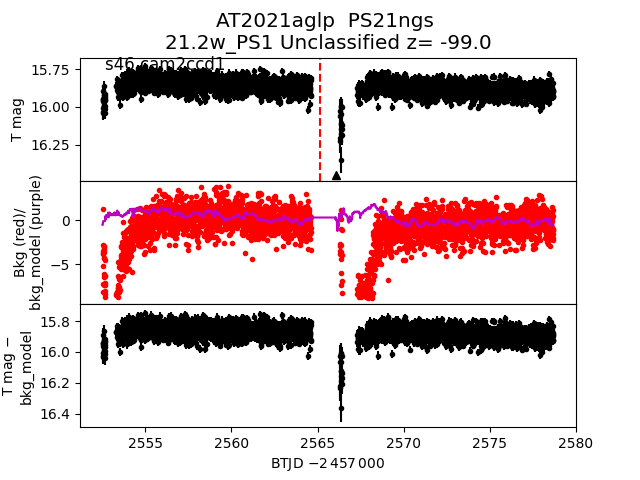
 2021aglp
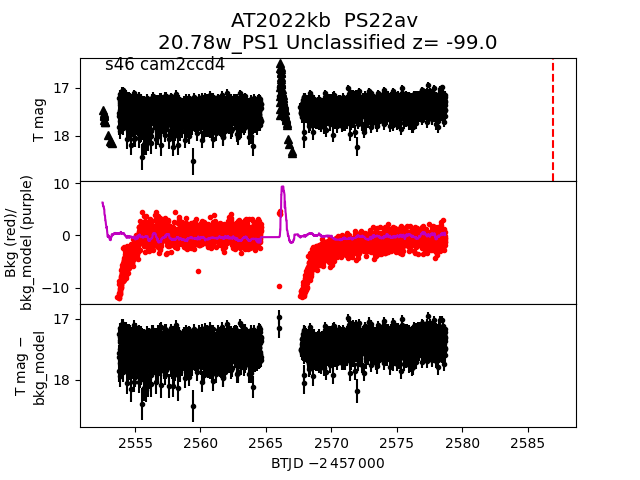
 2022kb
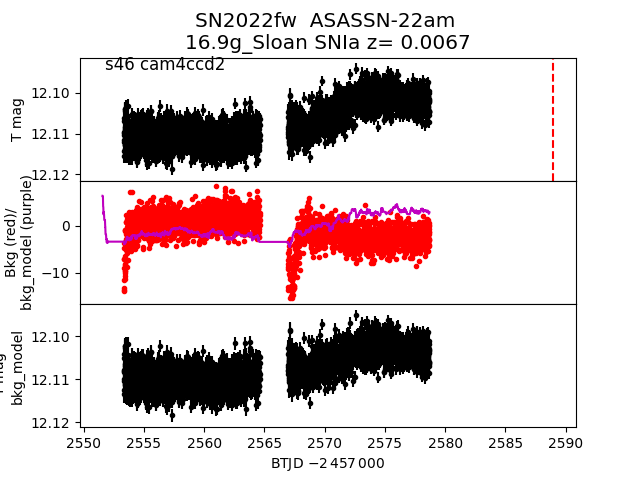
 2022fw
 2022ej
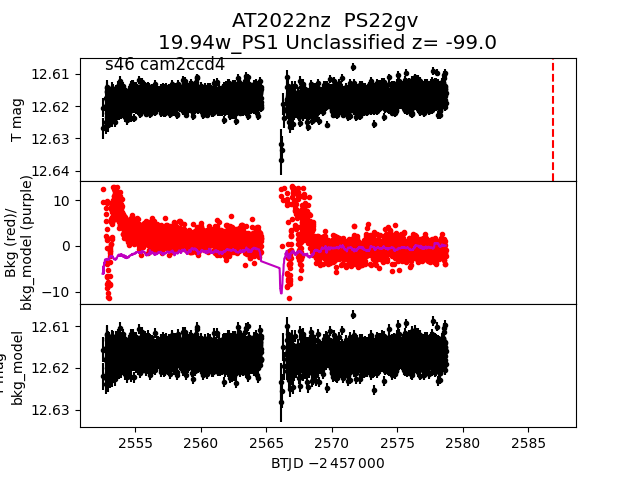
 2022nz
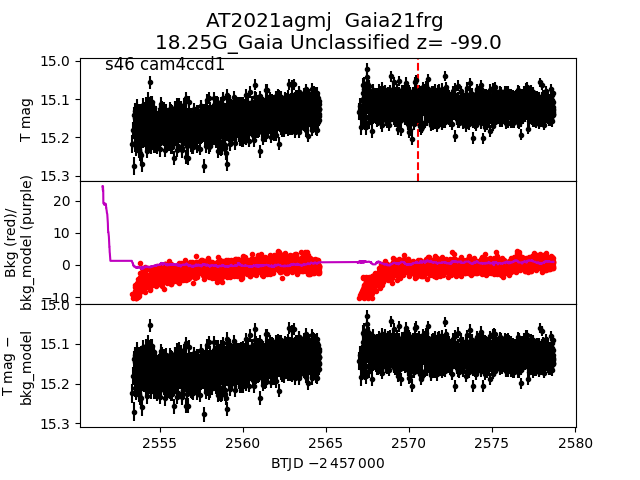
 2021agmj
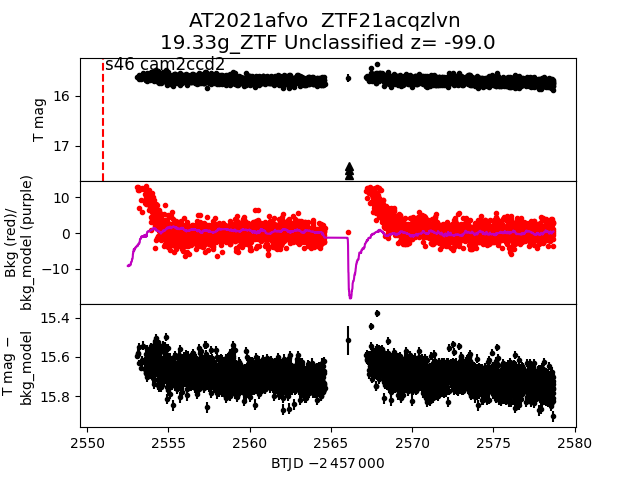
 2021afvo
 2021agjj
 2021afur
 2022kk
 2022ar
 2022D
2022D
 2022fr
 2022ln
 2021agoa
 2021afzz
 2022am
 2021afvj
 2021agbb
 2022fm
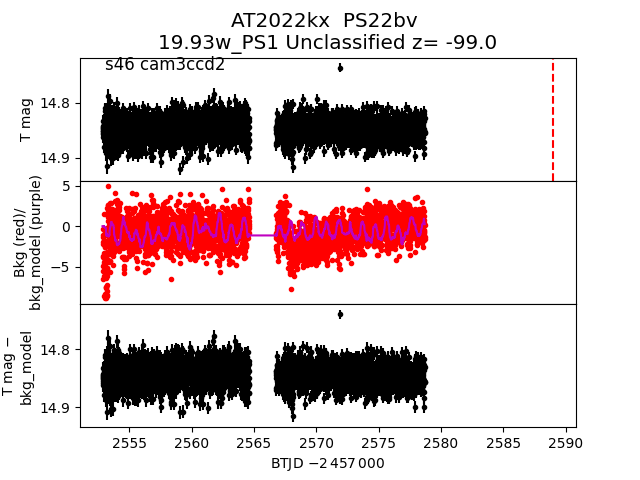
 2022kx
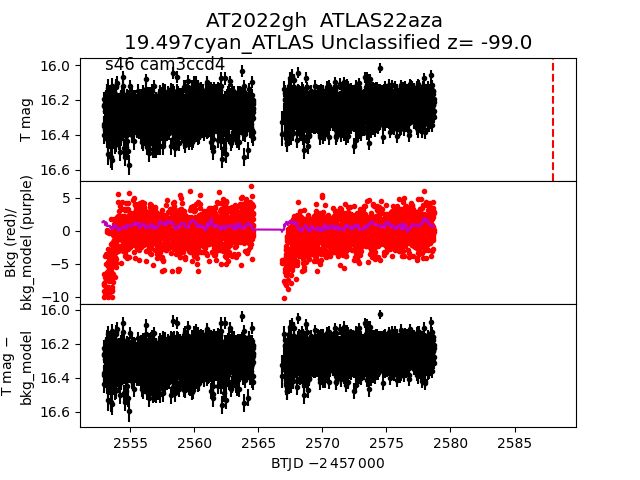
 2022gh
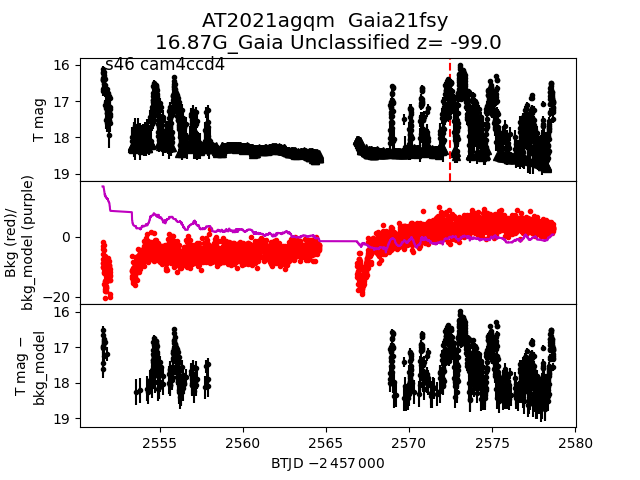
 2021agqm
 2022nv
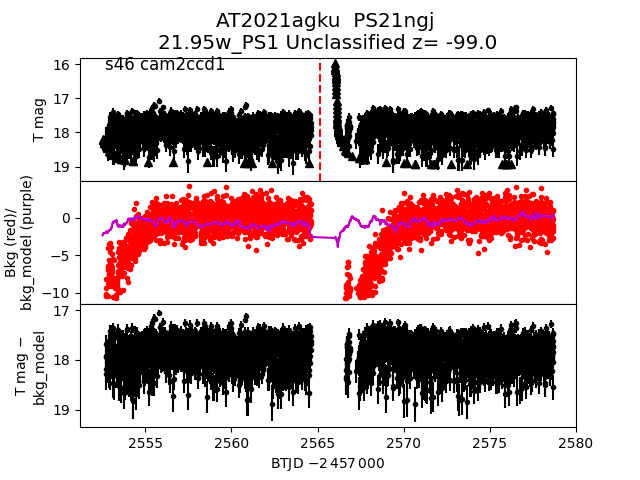
 2021agku
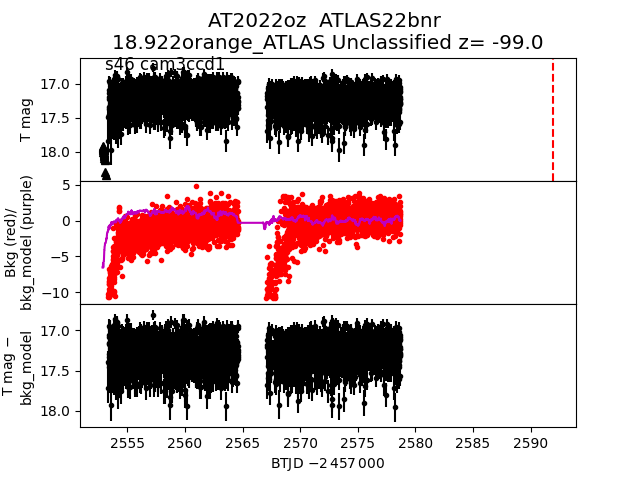
 2022oz
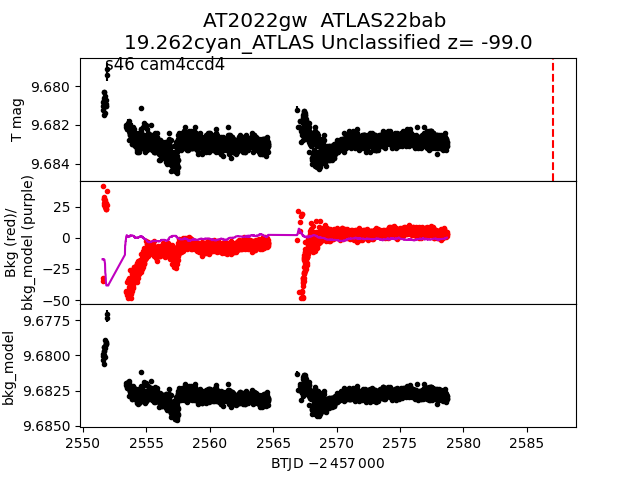
 2022gw
 2021agge
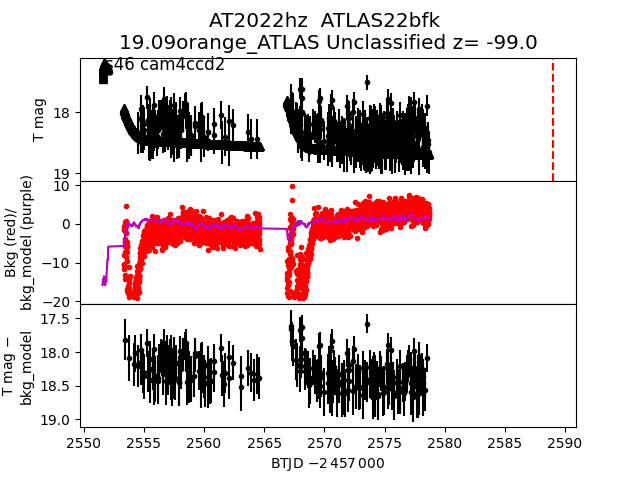
 2022hz
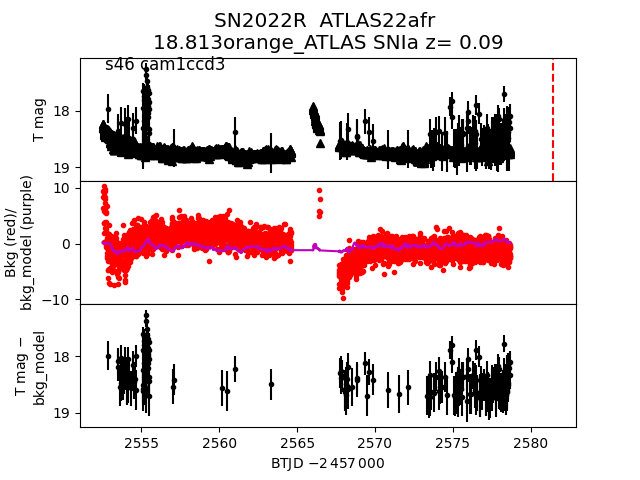
 2022R
2022R
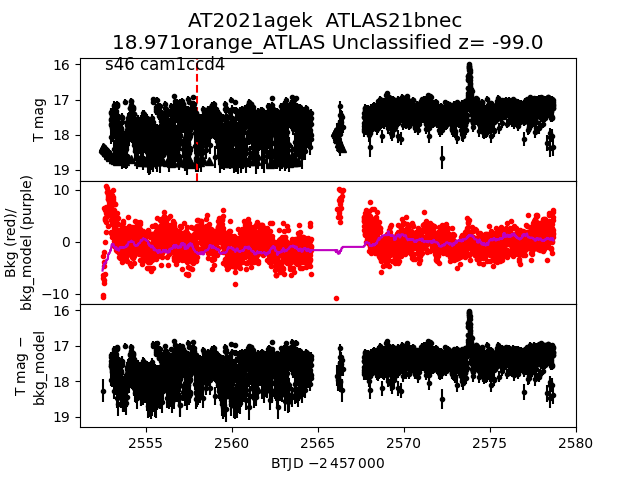
 2021agek
 2021afzs
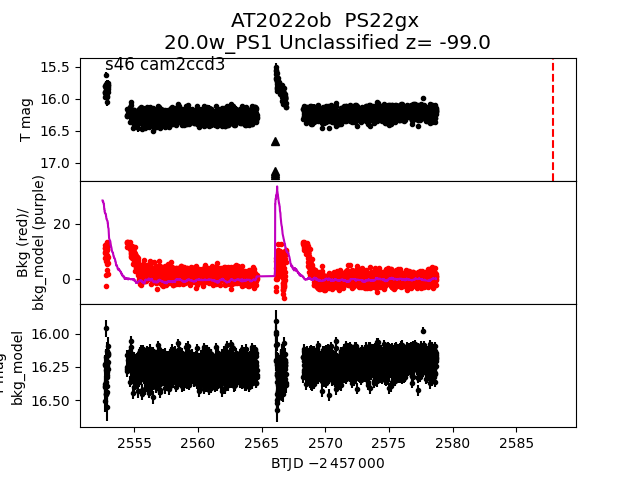
 2022ob
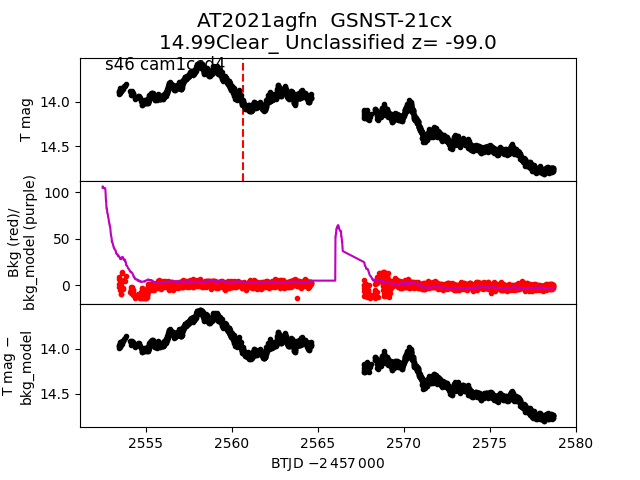
 2021agfn
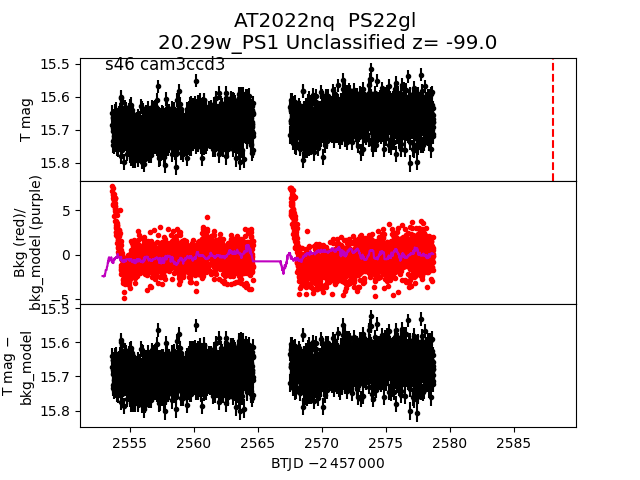
 2022nq
 2021agfq
 2022fc
 2021agaq
 2022ok
 2022nx
 2021ahmz
 2022fu
 2021agfg
 2022gy
 2022ki
 2021agjr
 2021agab
 2022F
2022F
 2022ks
 2021agka
 2021aggq
 2022gc
 2021afvh
 2022fo
 2021afzx
 2022nt
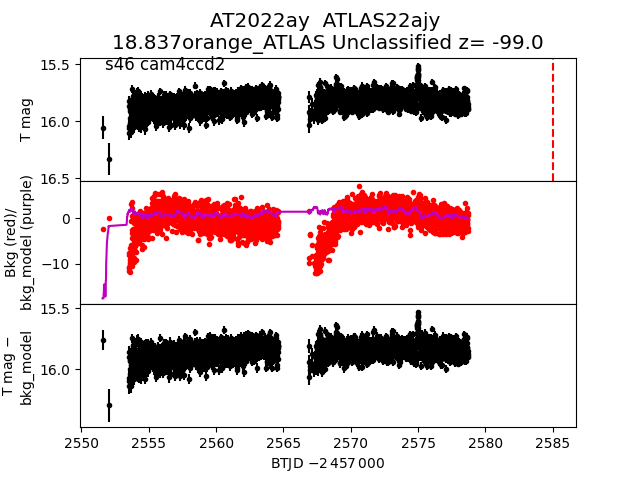
 2022ay
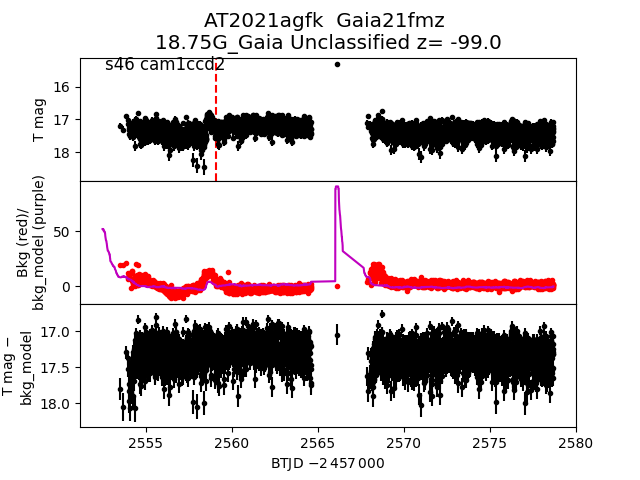
 2021agfk
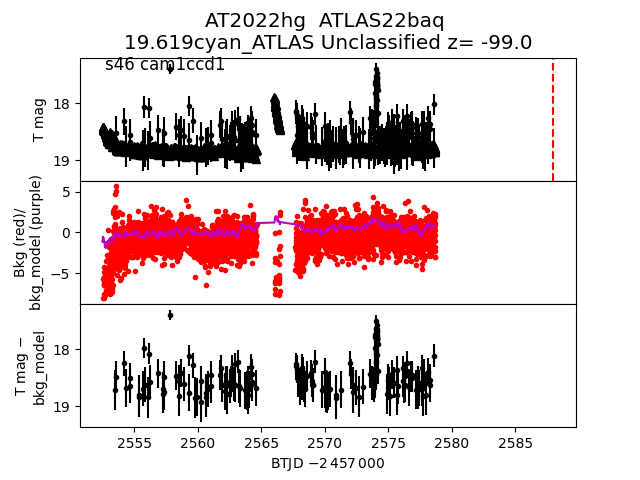
 2022hg
 2021aglh
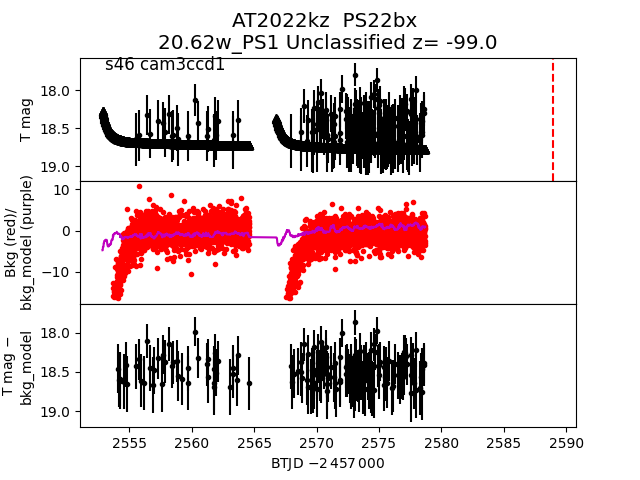
 2022kz
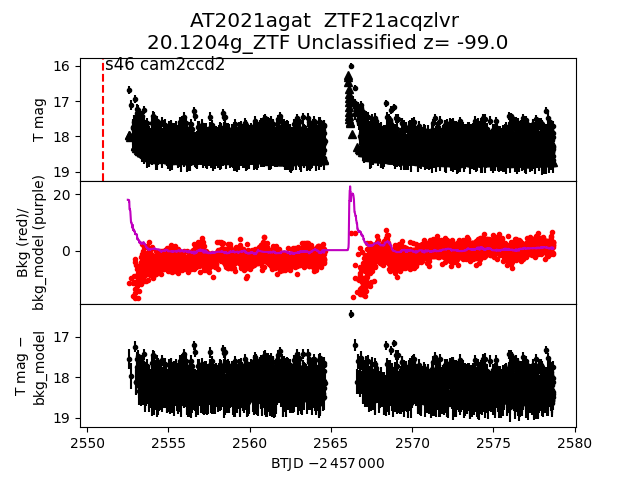
 2021agat
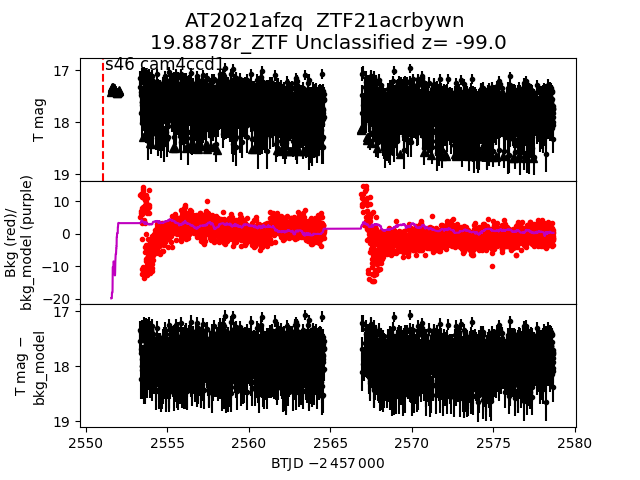
 2021afzq
 2021agei
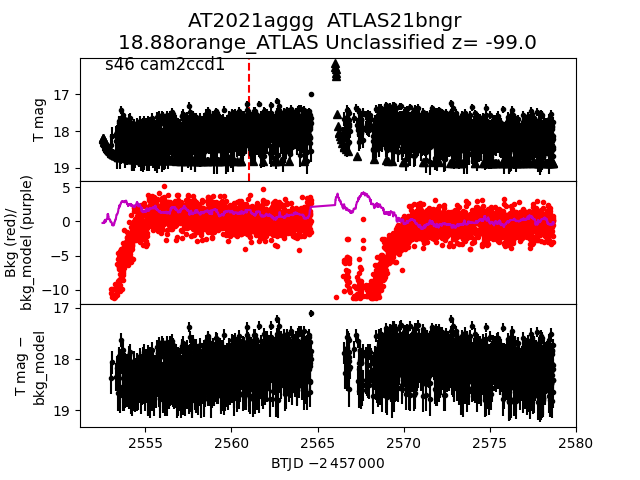
 2021aggg
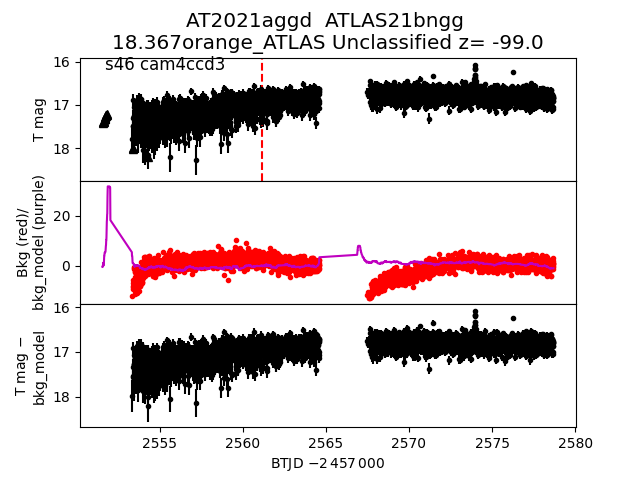
 2021aggd
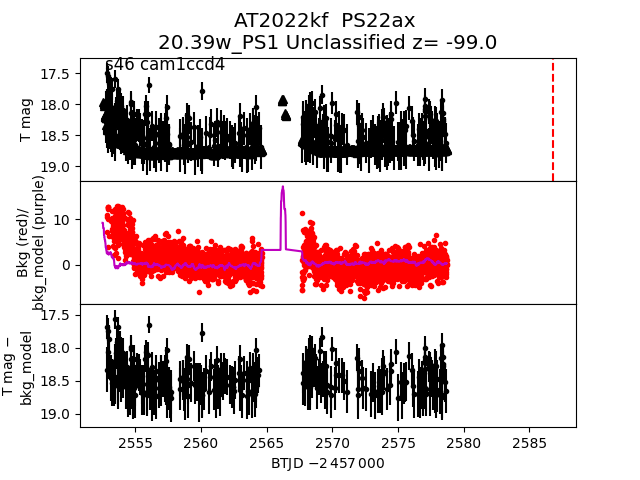
 2022kf
 2021agkt
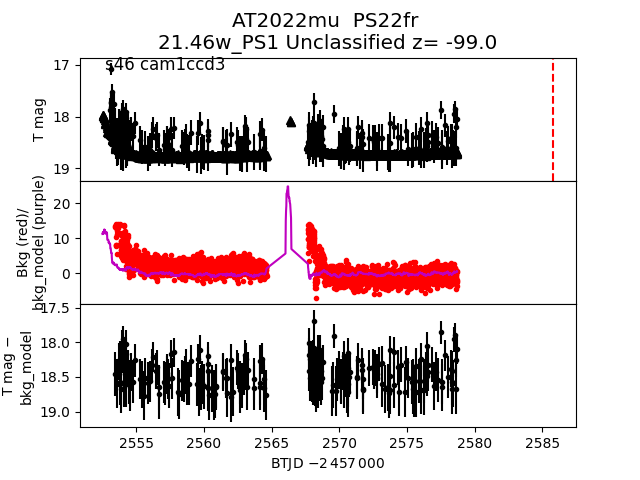
 2022mu
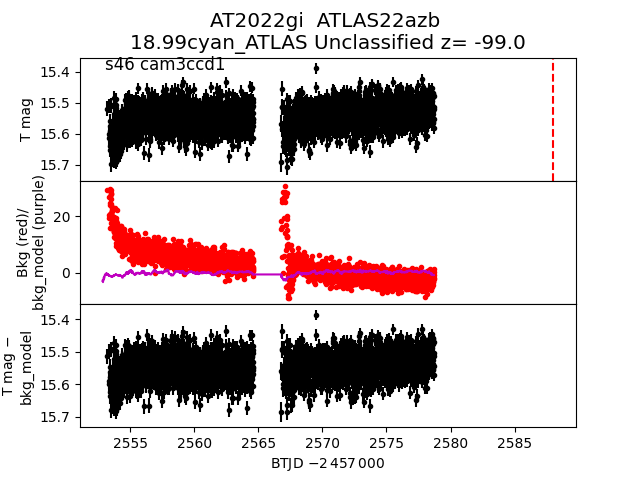
 2022gi
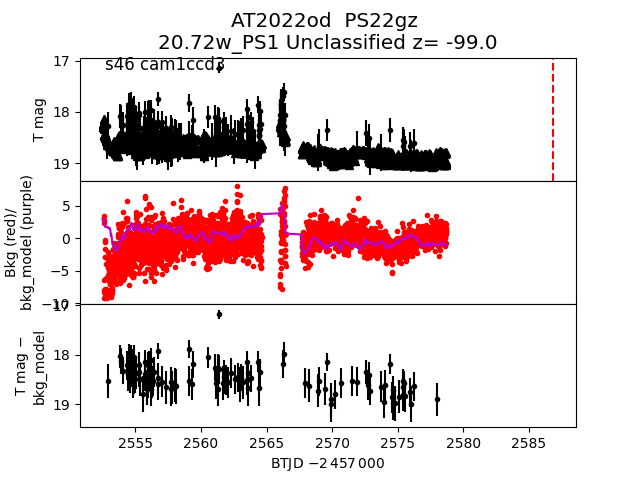
 2022od
 2022L
2022L
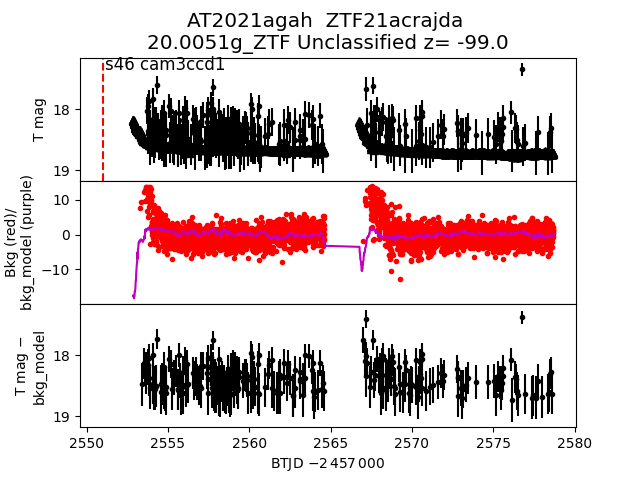
 2021agah
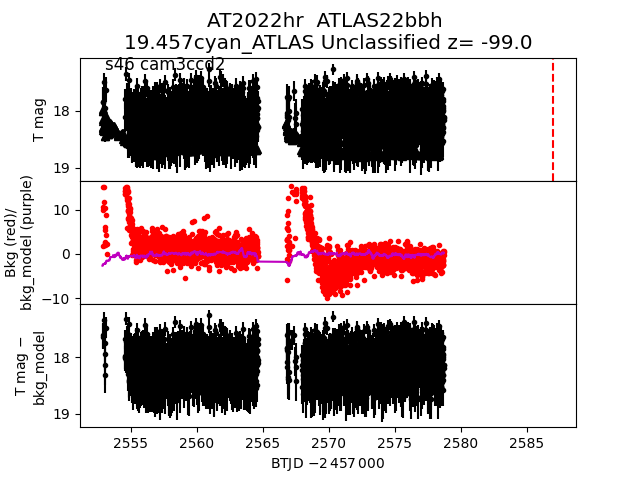
 2022hr
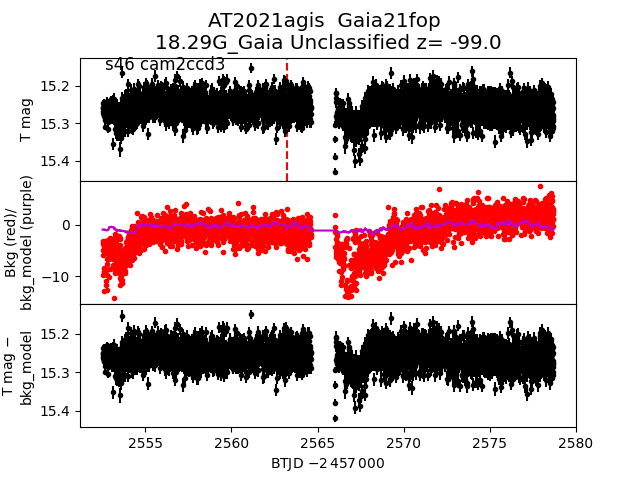
 2021agis
 2021agdo
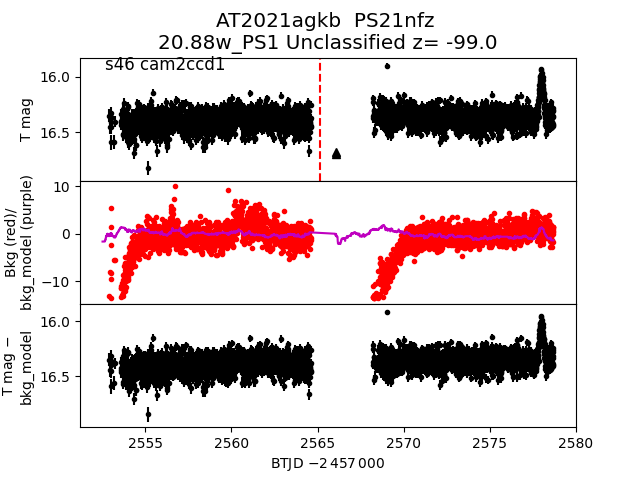
 2021agkb
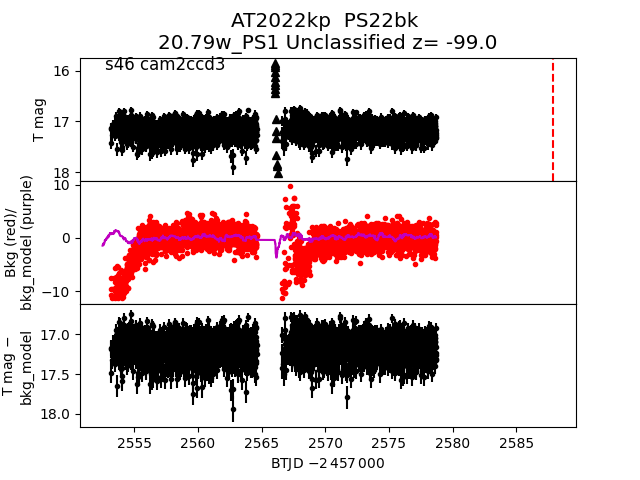
 2022kp
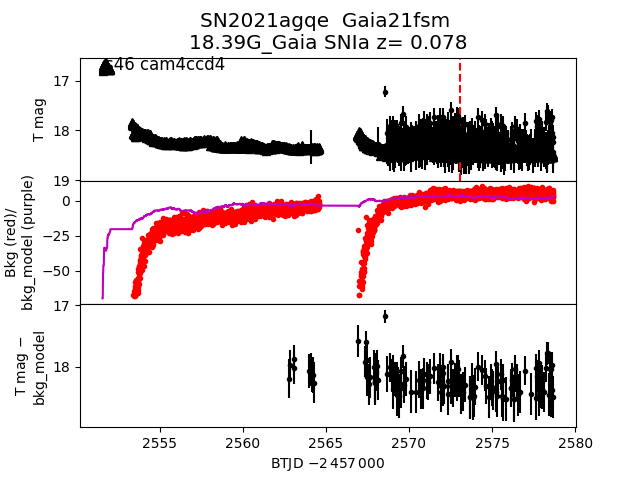
 2021agqe
 2022mc
 2021afyy
 2022fs
 2022pd
 2022E
2022E
 2022as
 2022nd
 2022et
 2021afvn
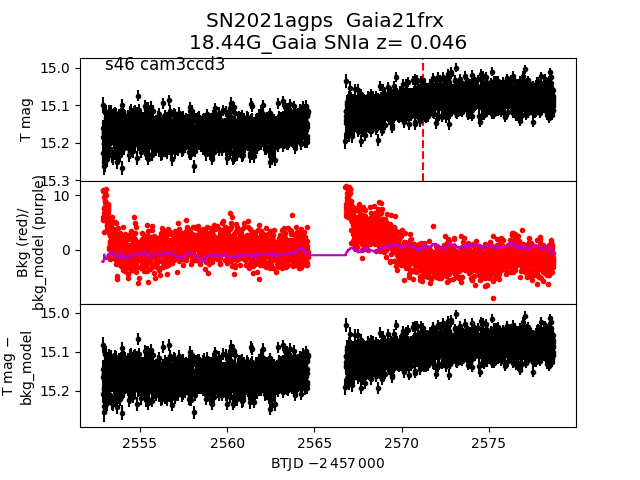
 2021agps
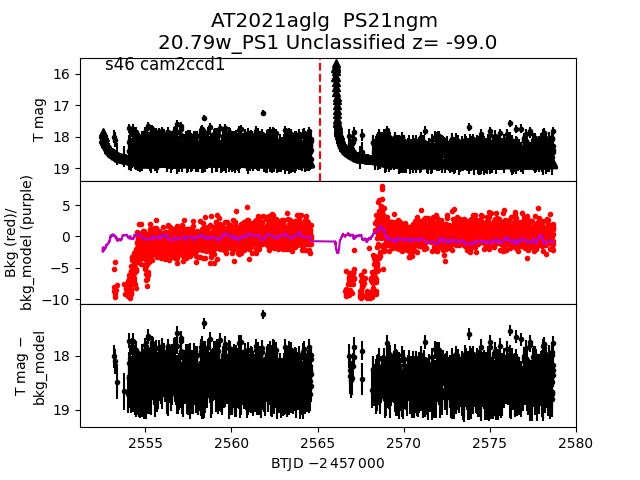
 2021aglg
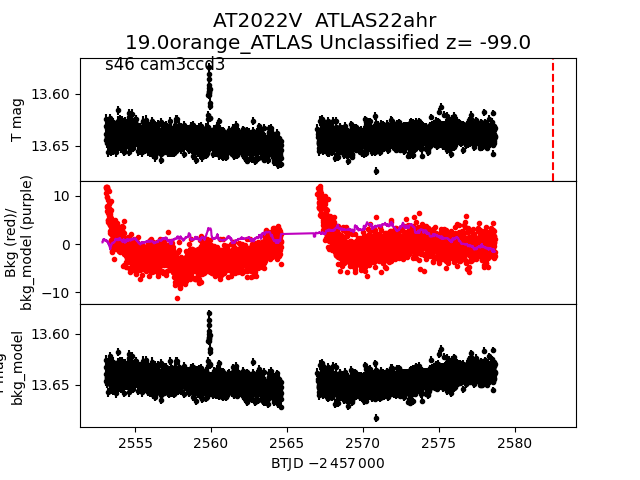
 2022V
2022V
 2022nr
 2021agrt
 2022oa
 2022gl