all transients in sector45 (116 total)
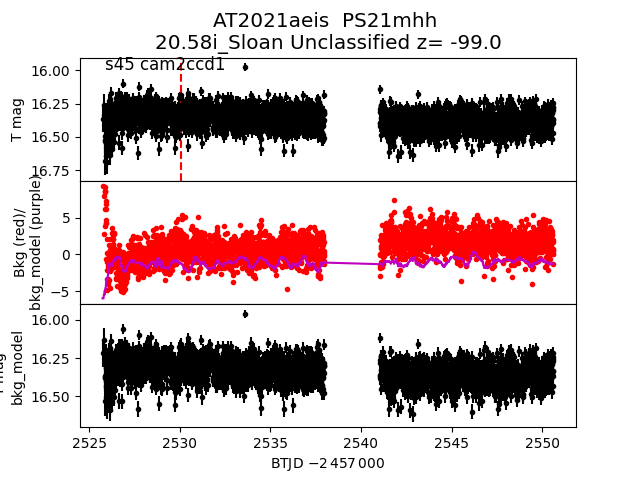
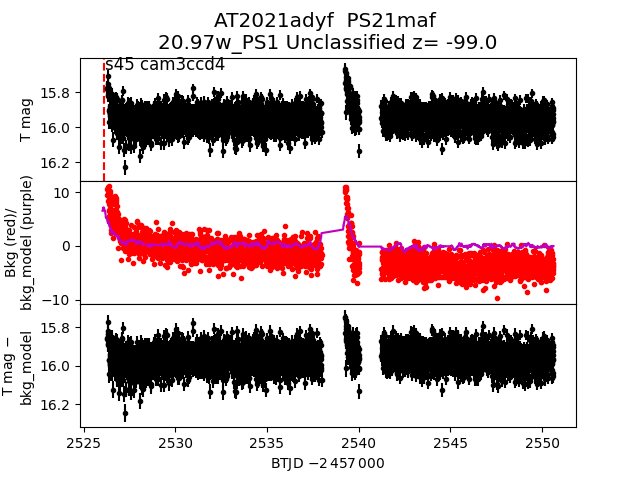
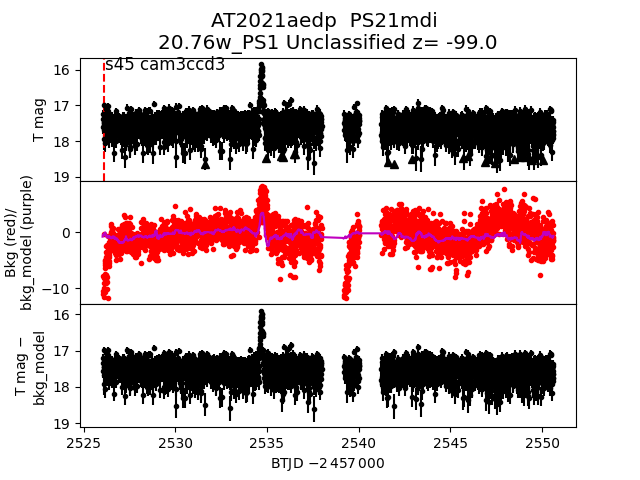
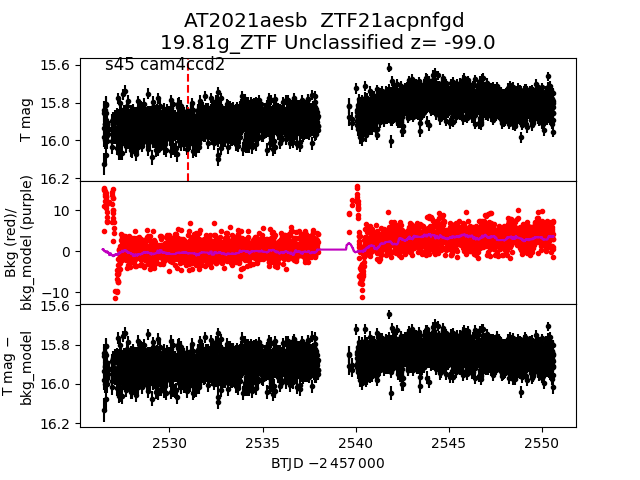
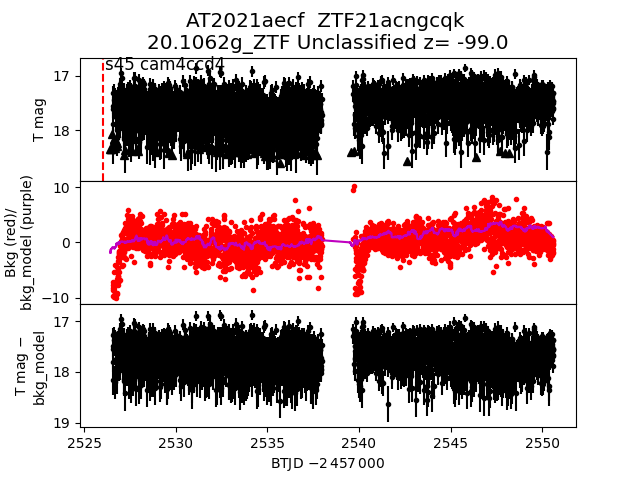
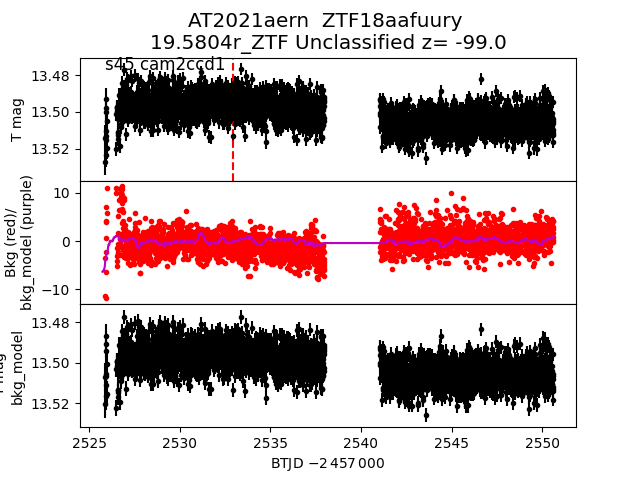
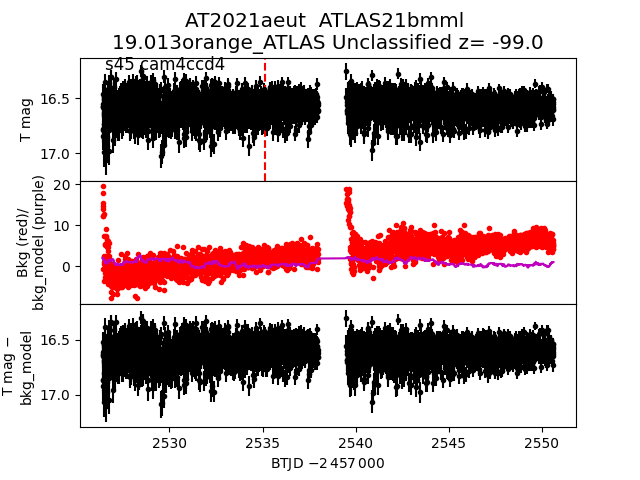
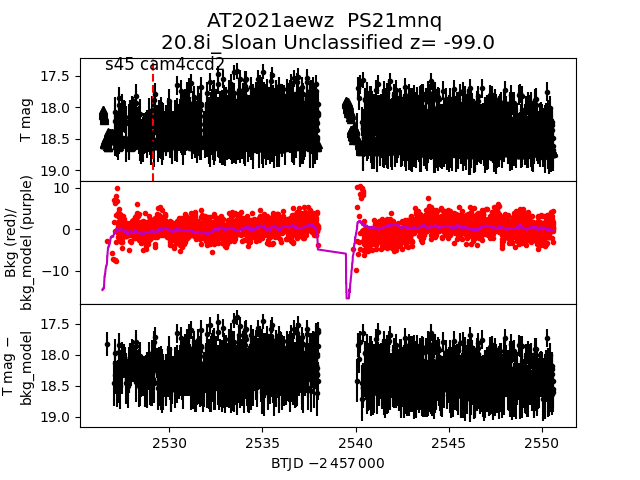
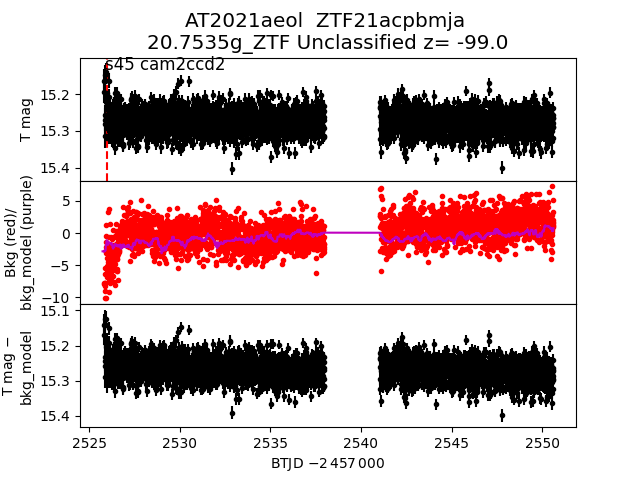
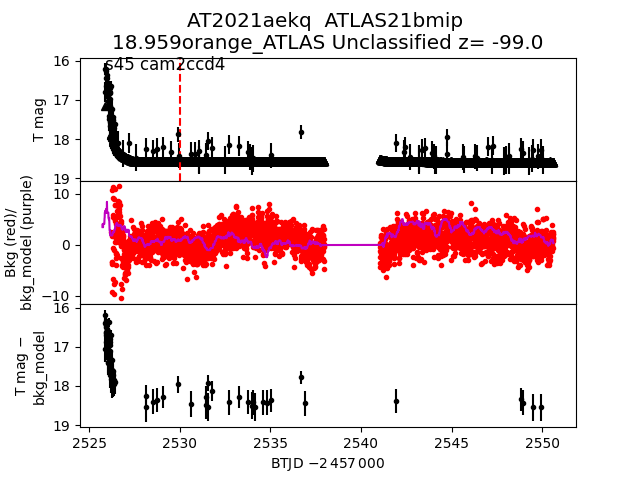
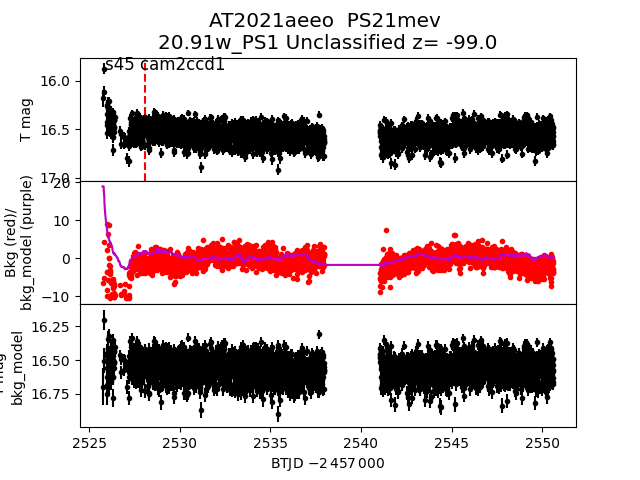
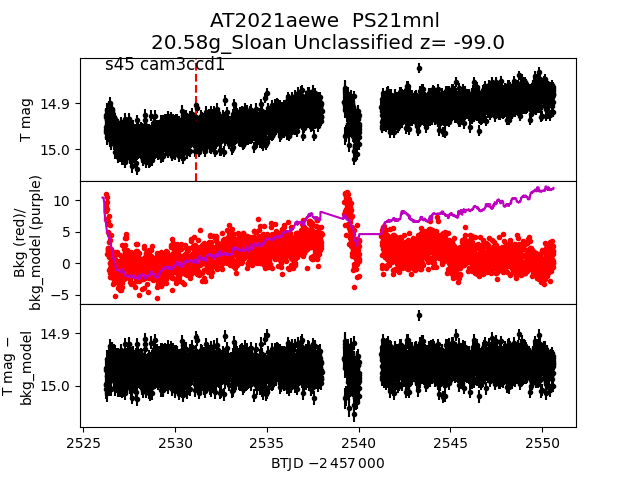
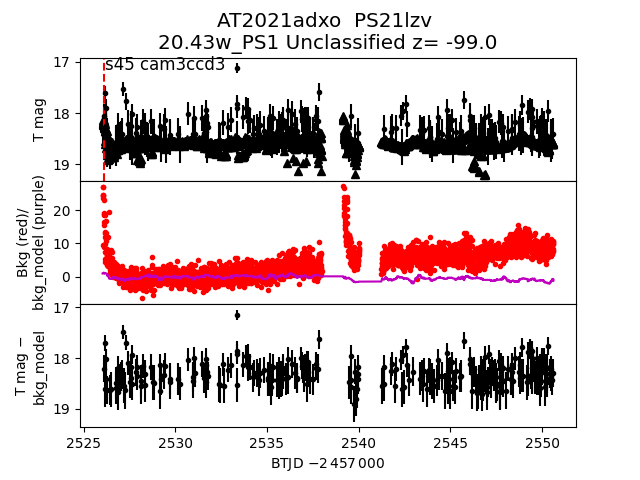
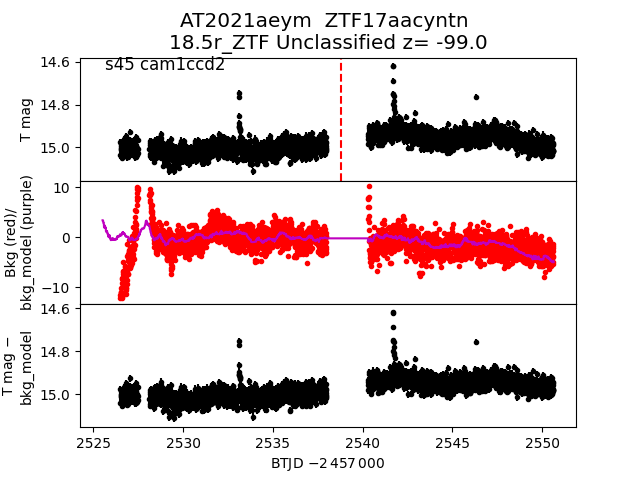
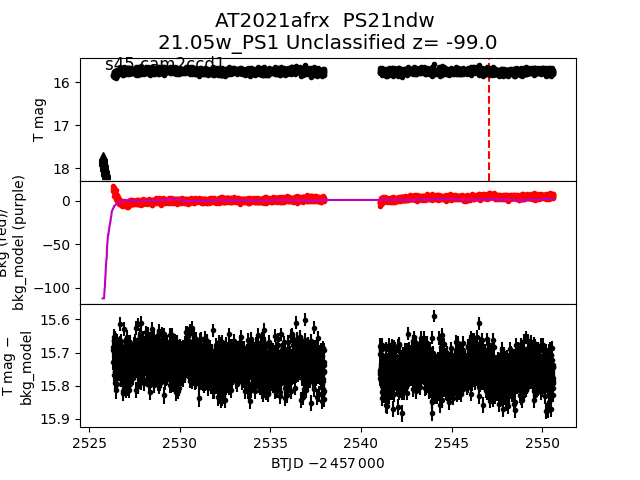
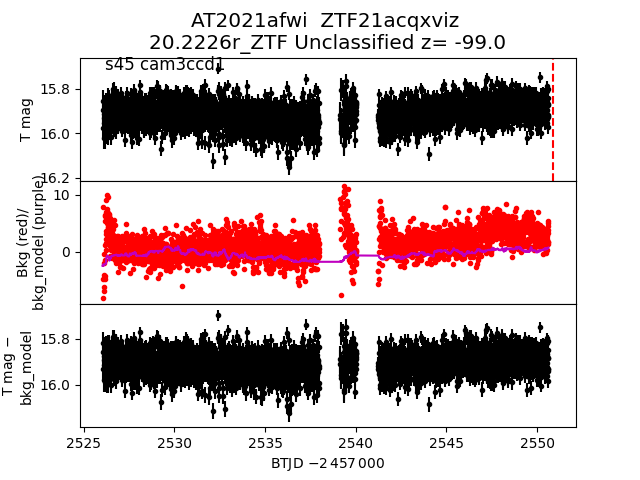
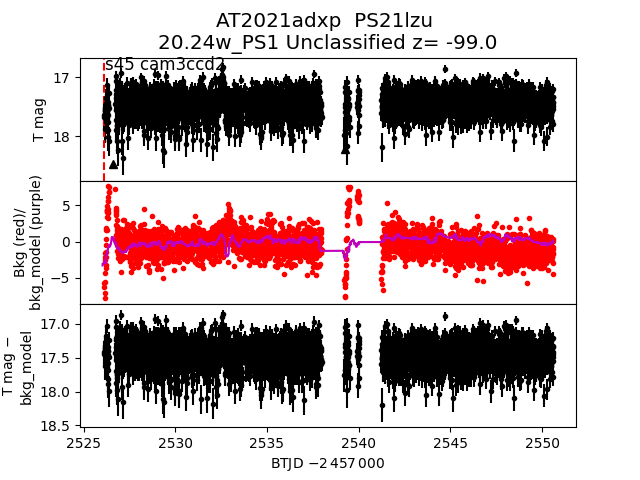
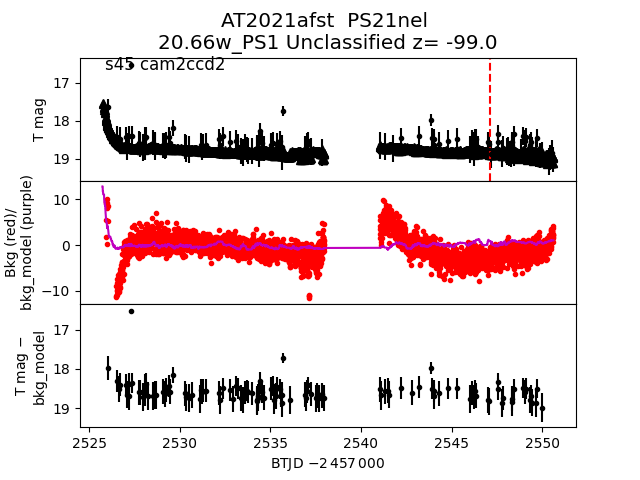
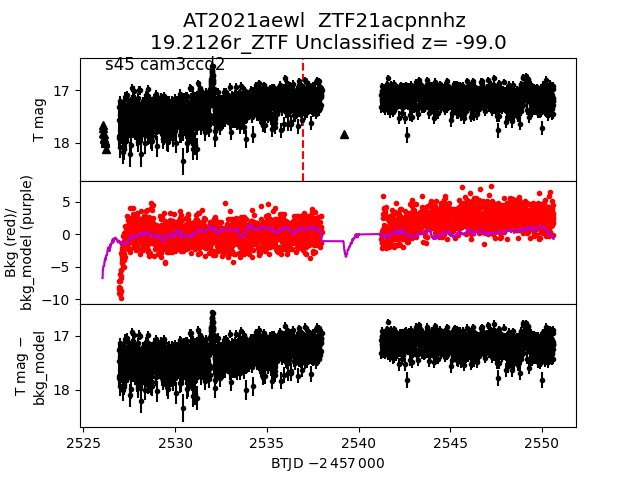
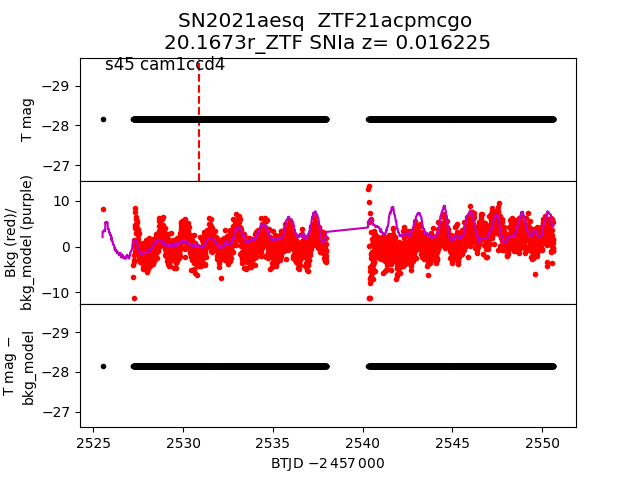
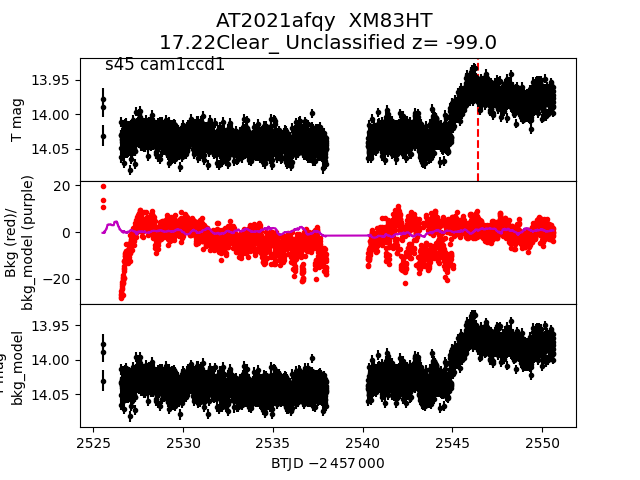
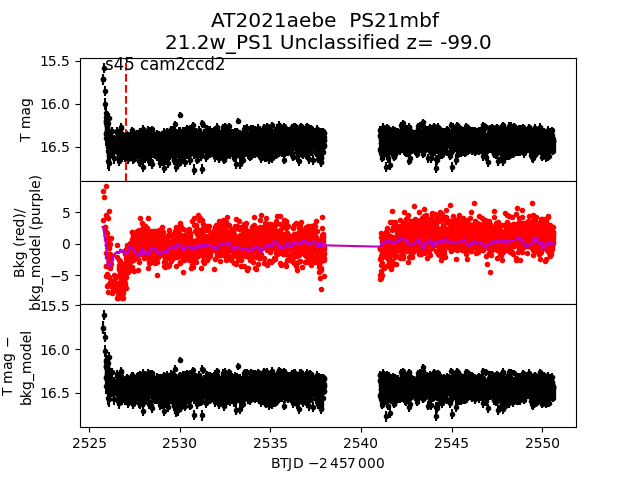
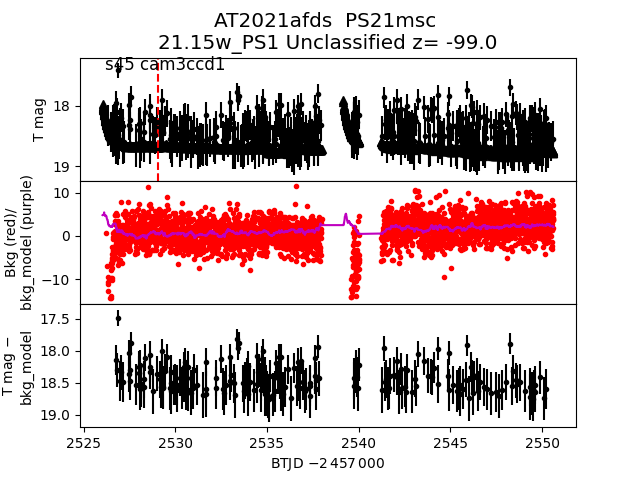
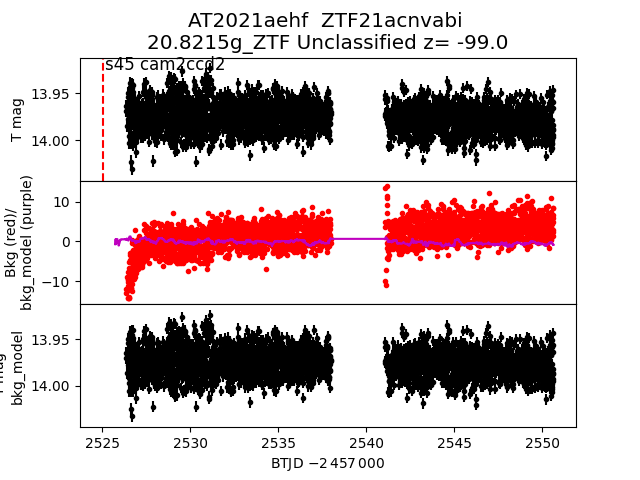
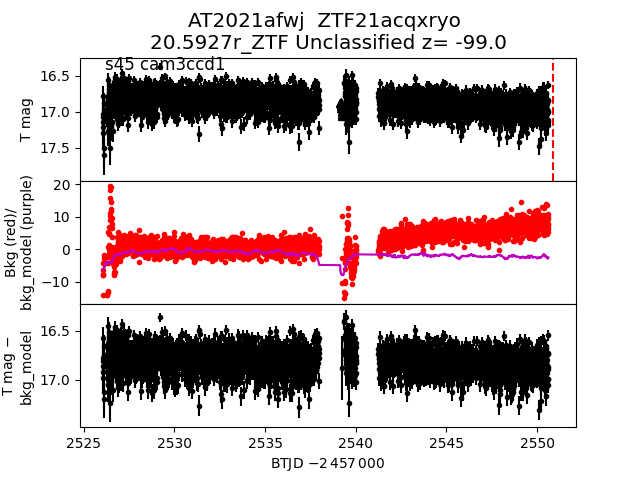
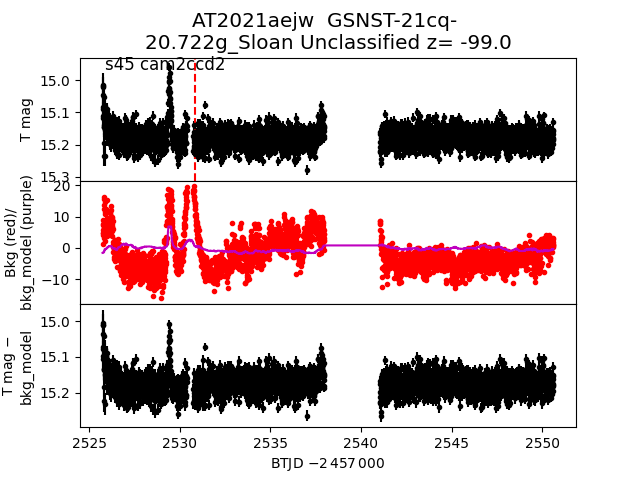
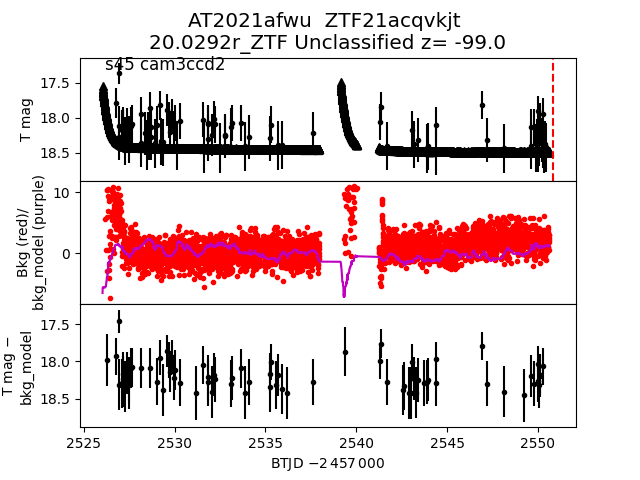
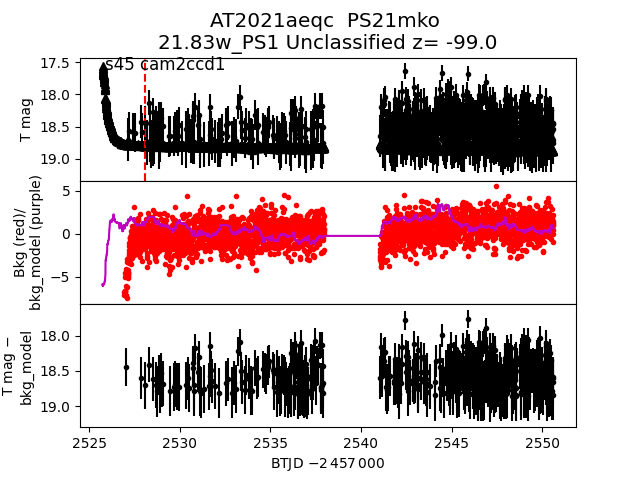
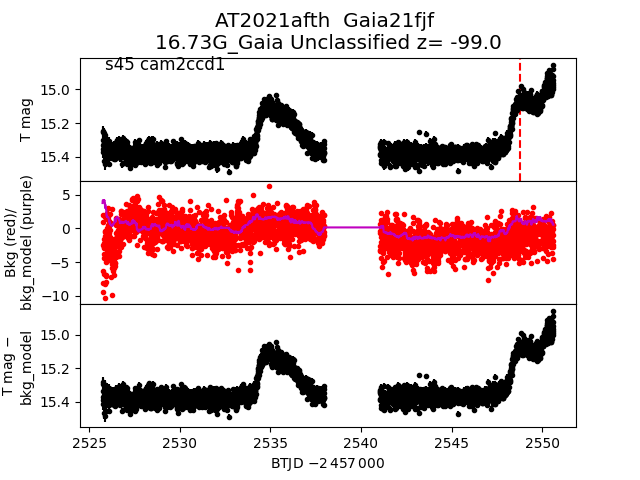
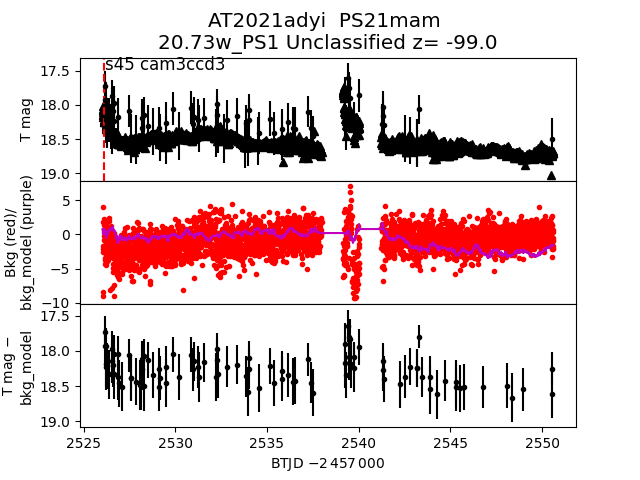
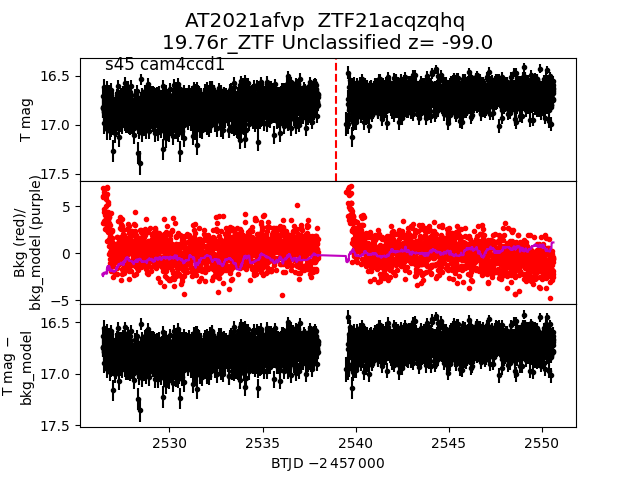
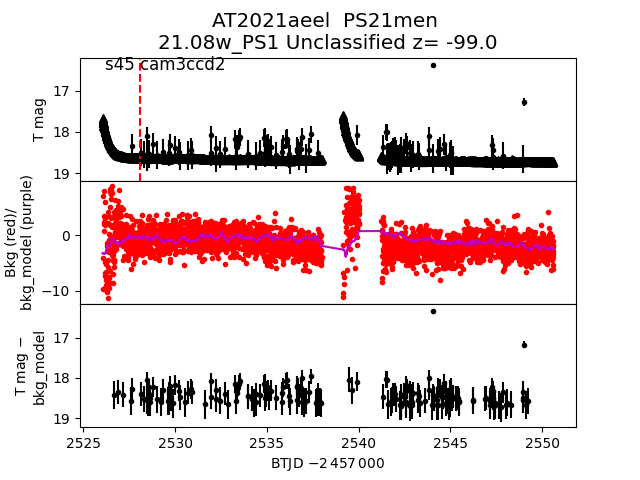
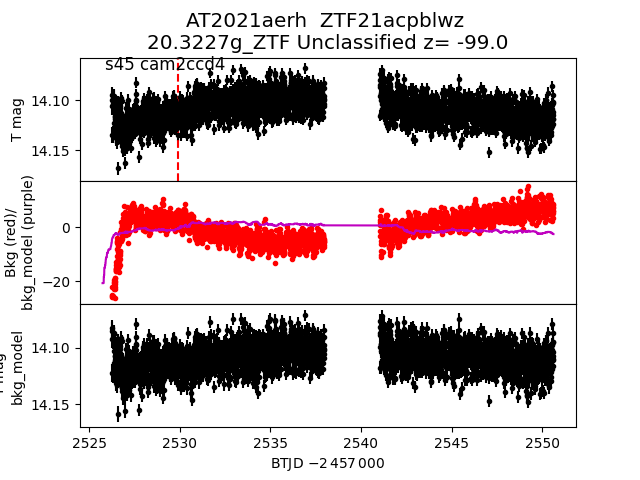
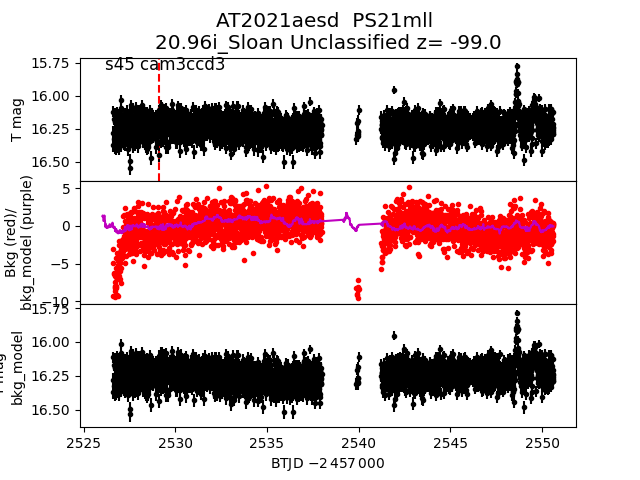
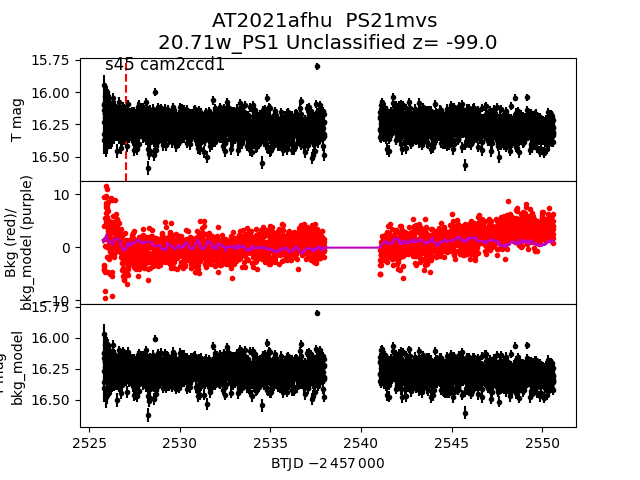
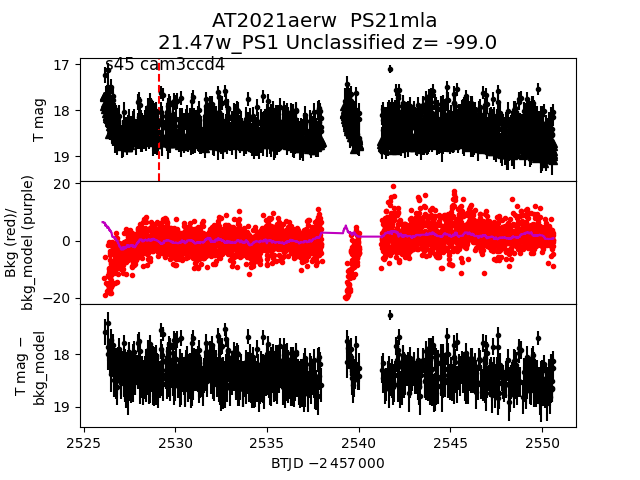
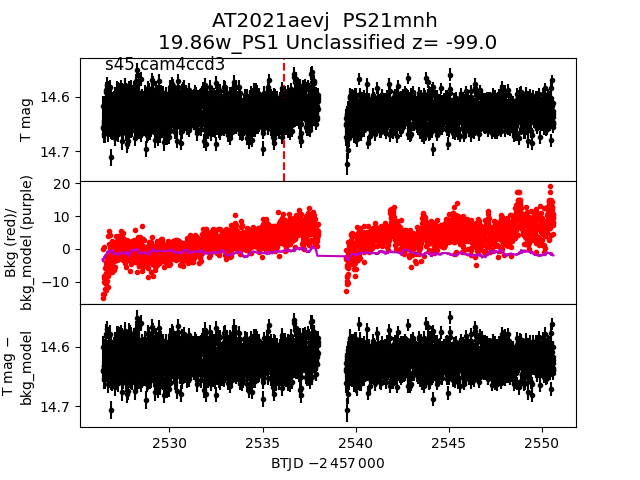
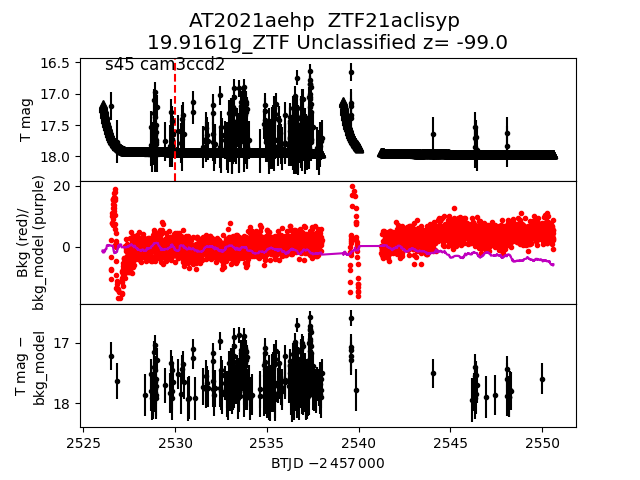
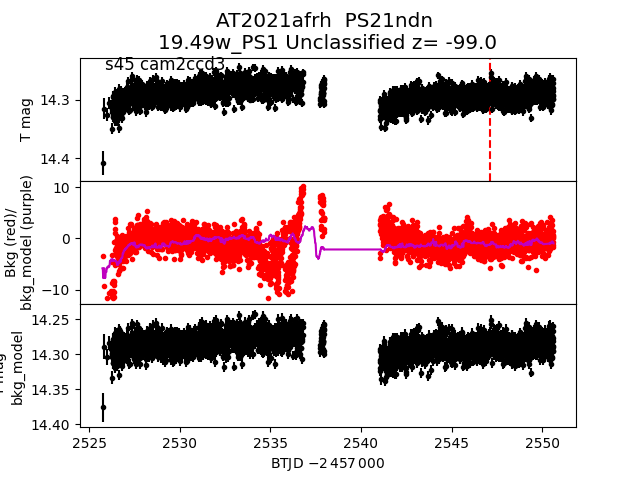
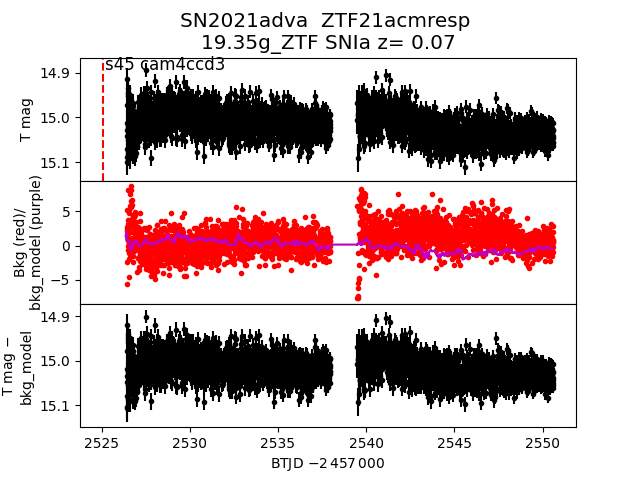
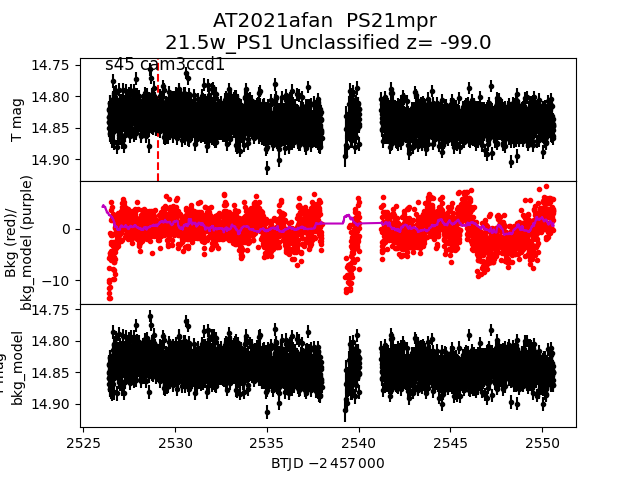
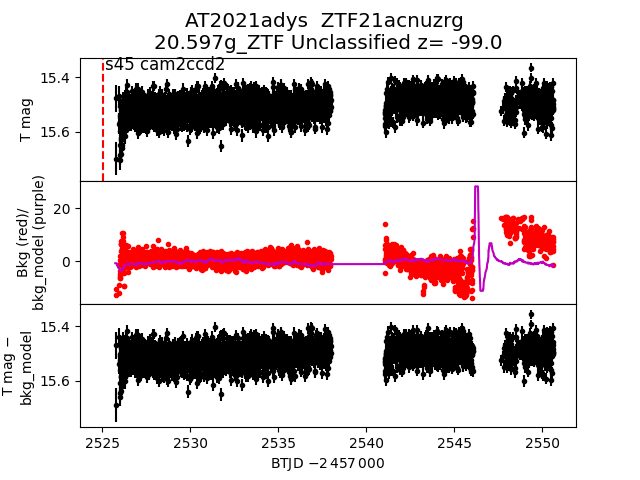
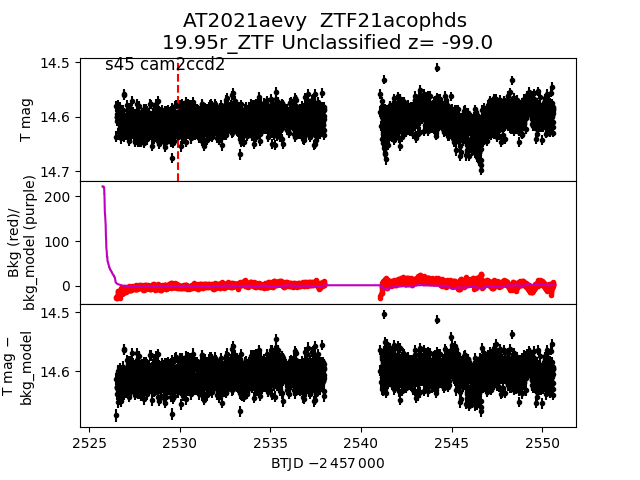
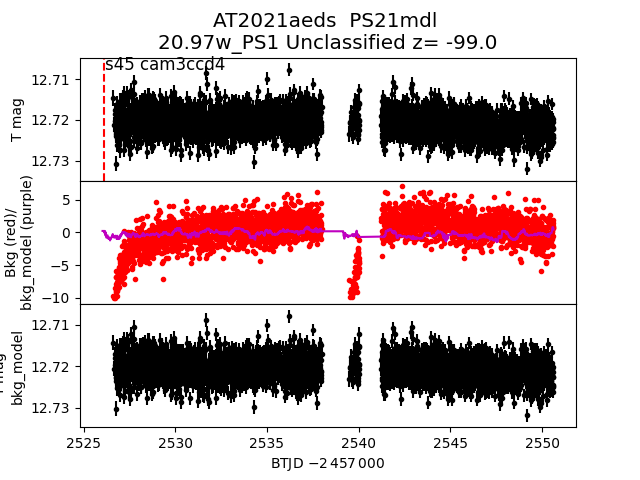
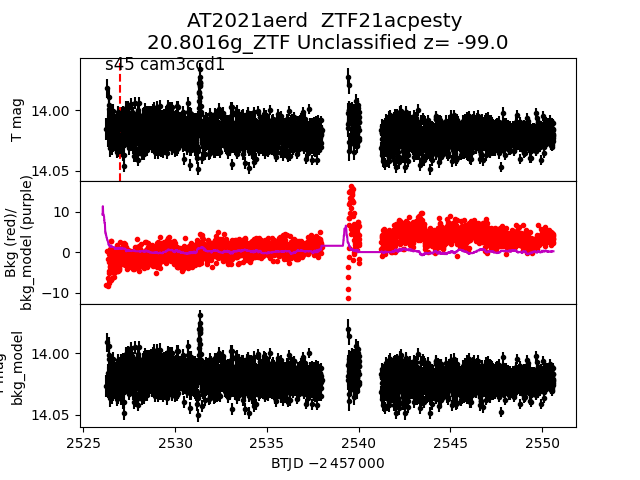
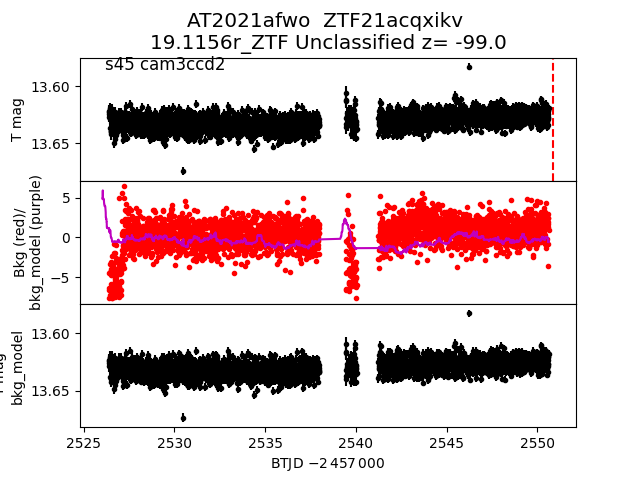
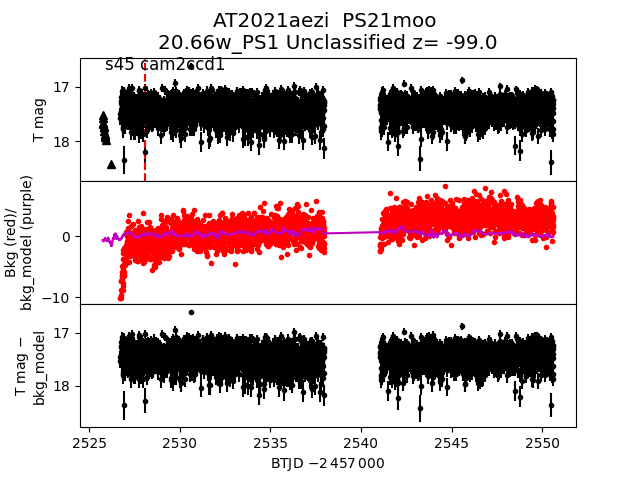
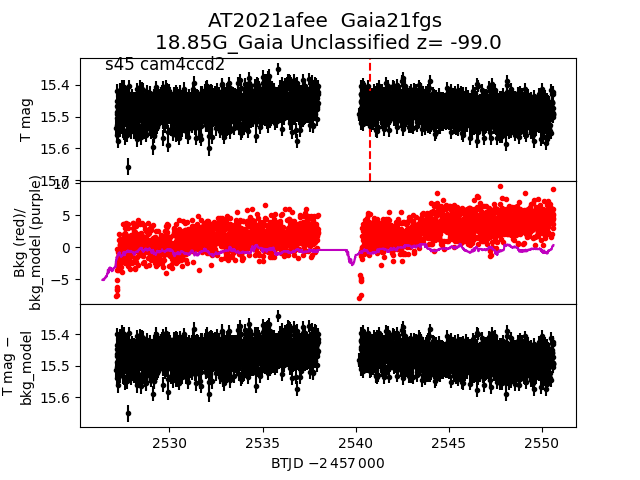
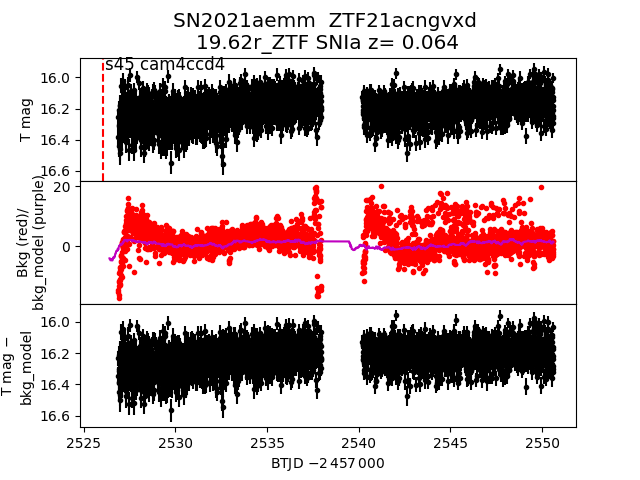
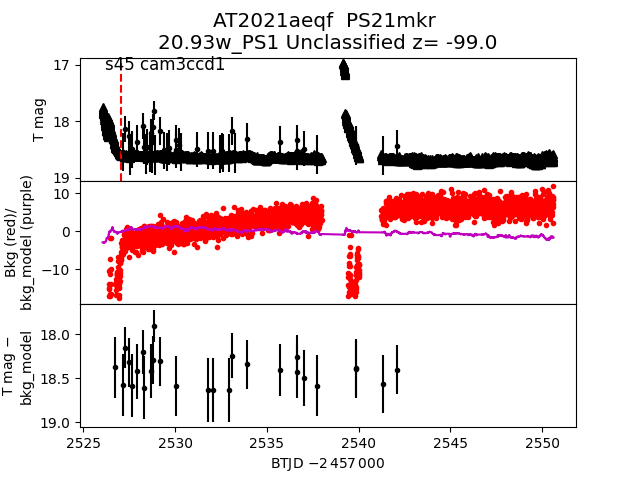
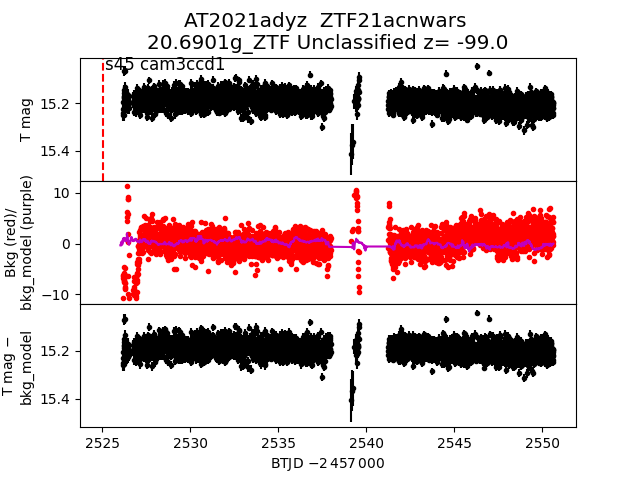
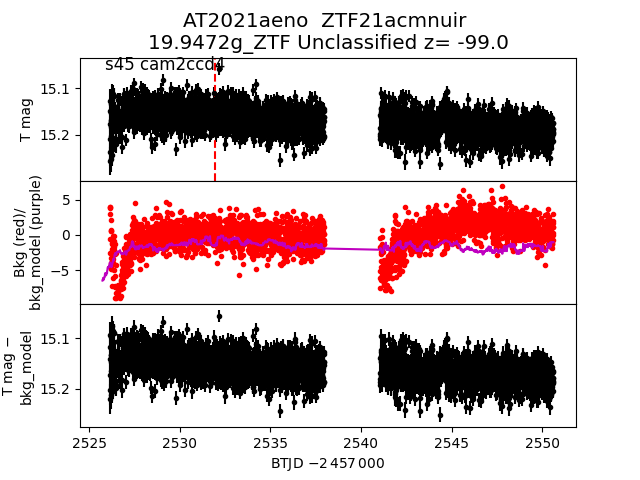
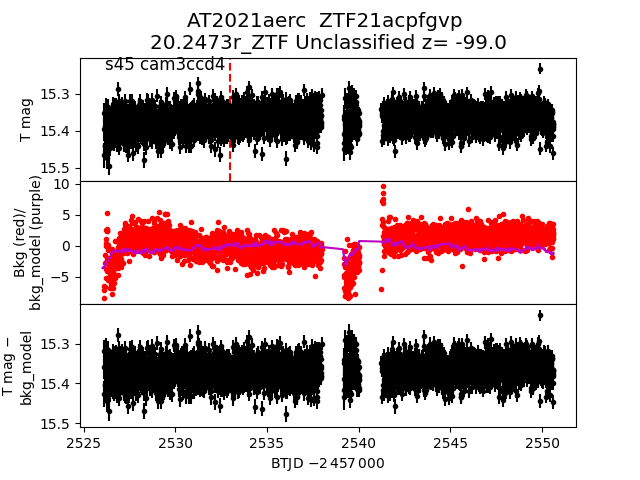
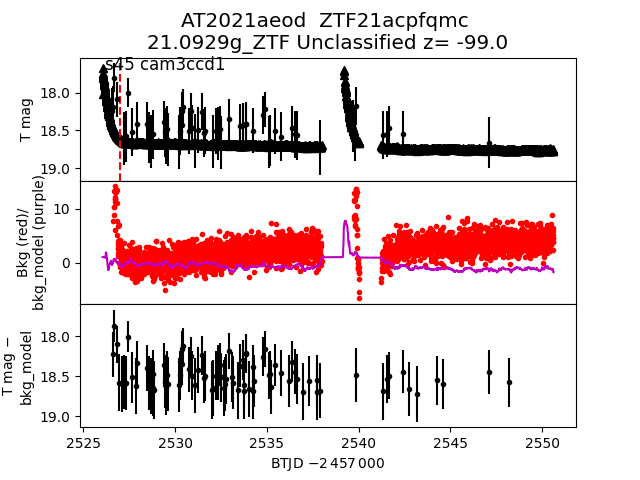
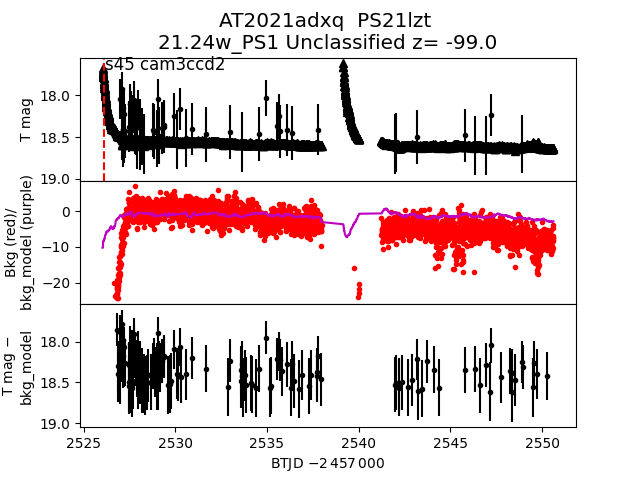
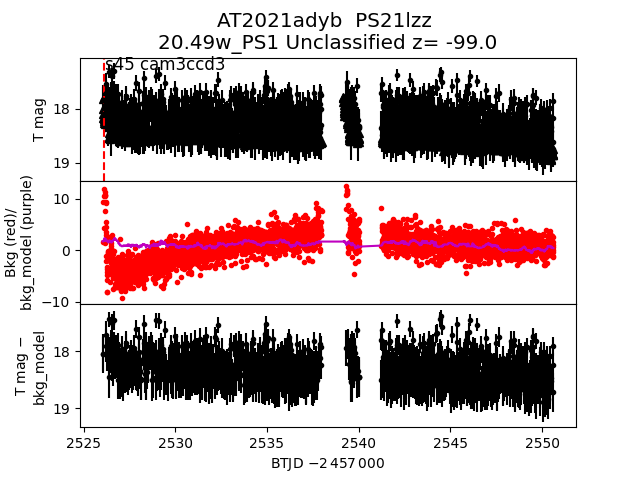
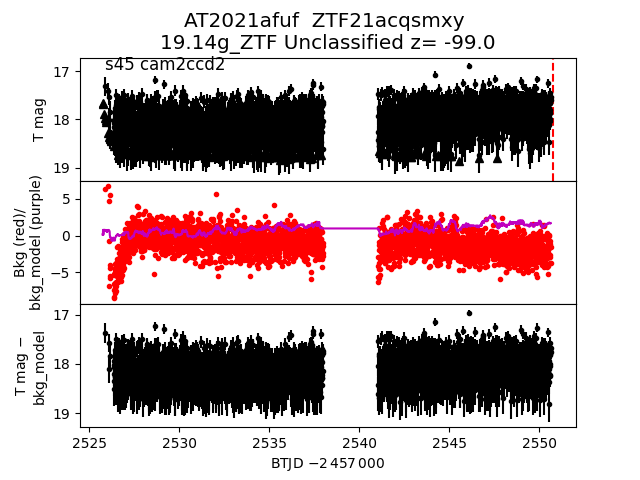
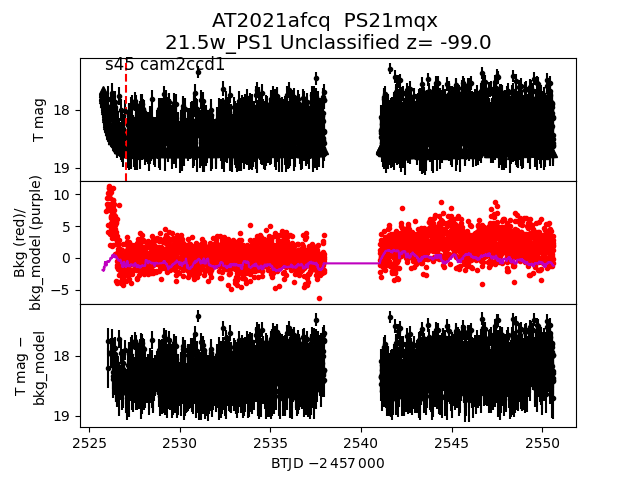
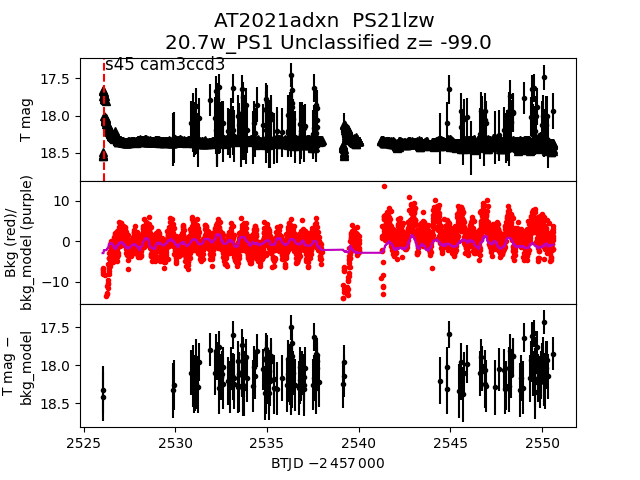
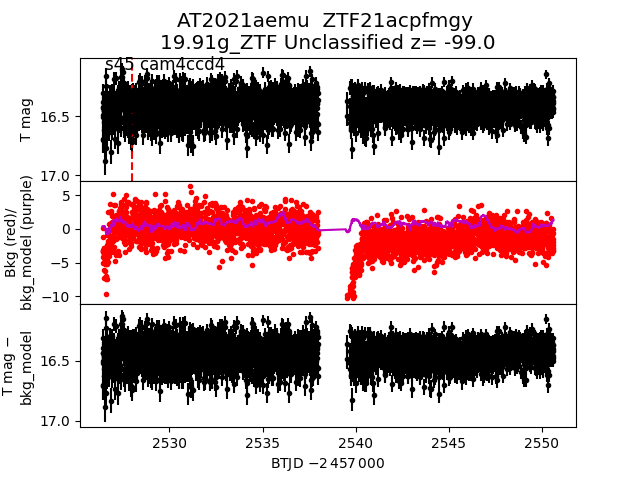
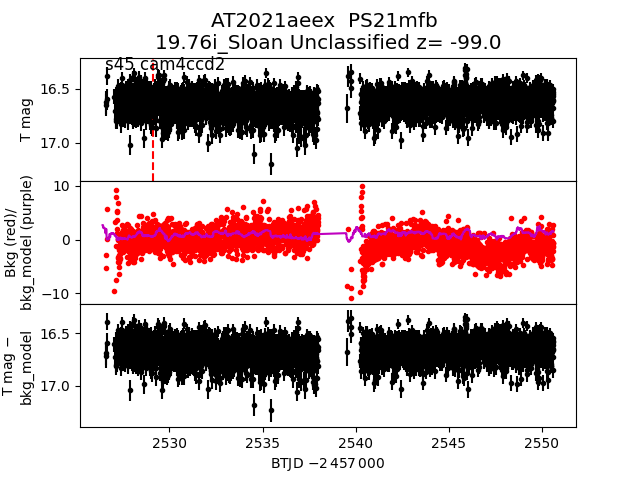
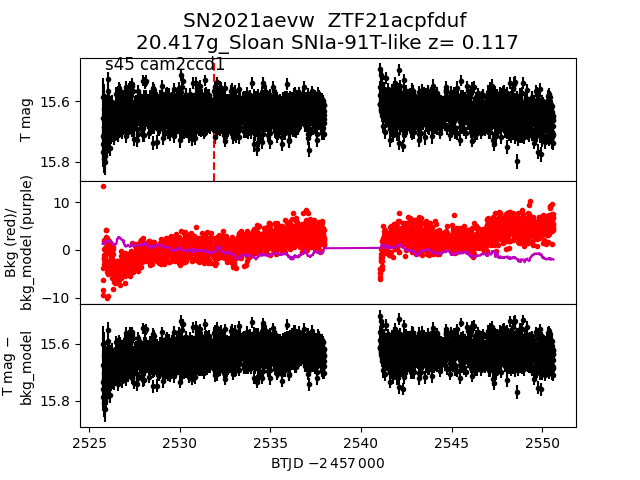
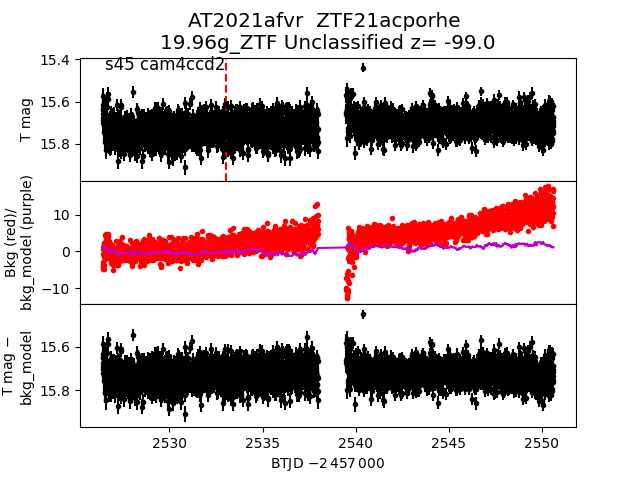
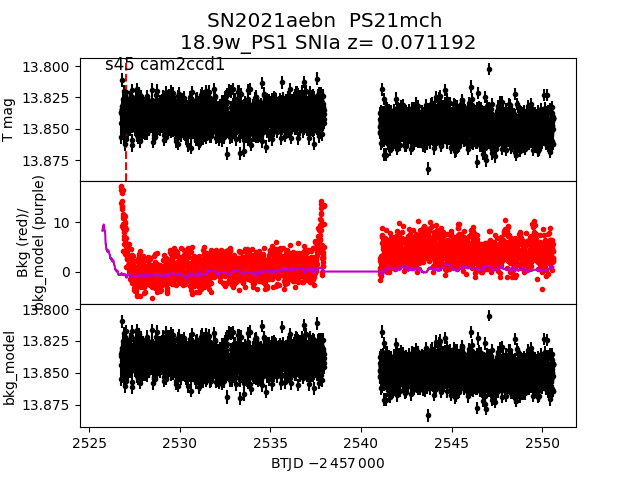
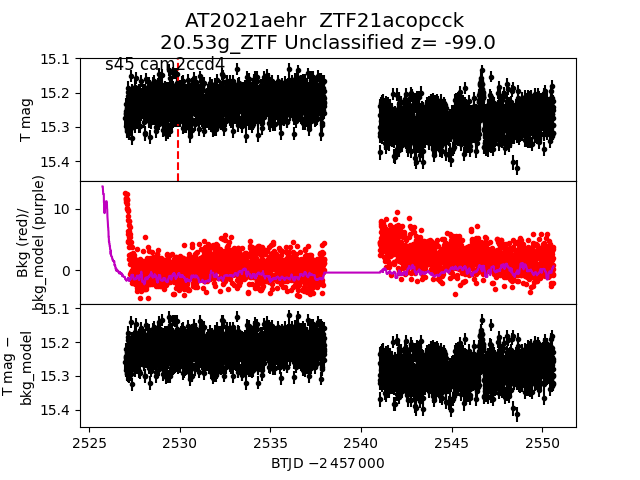
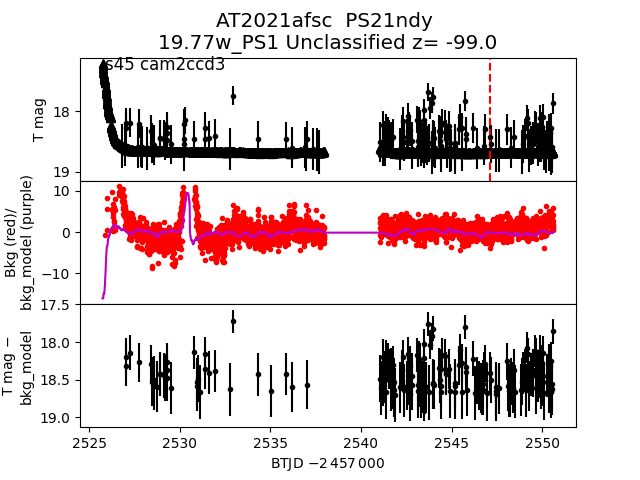
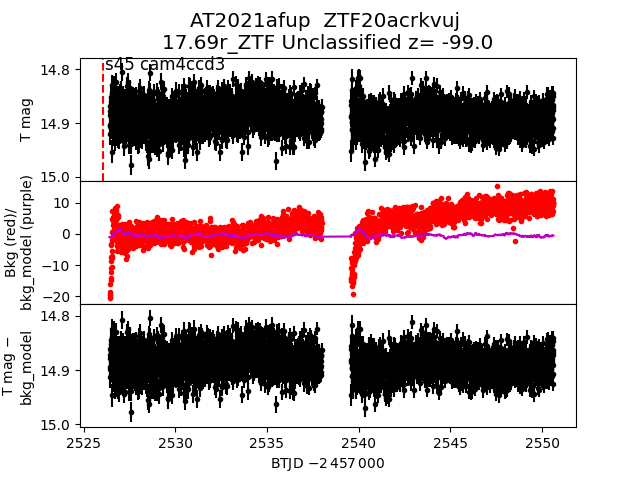
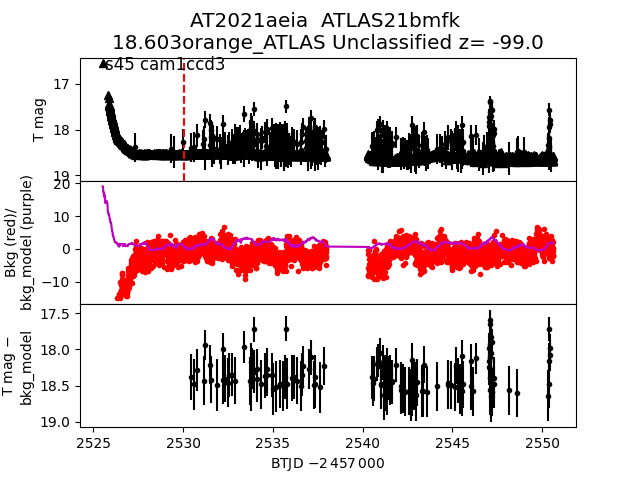
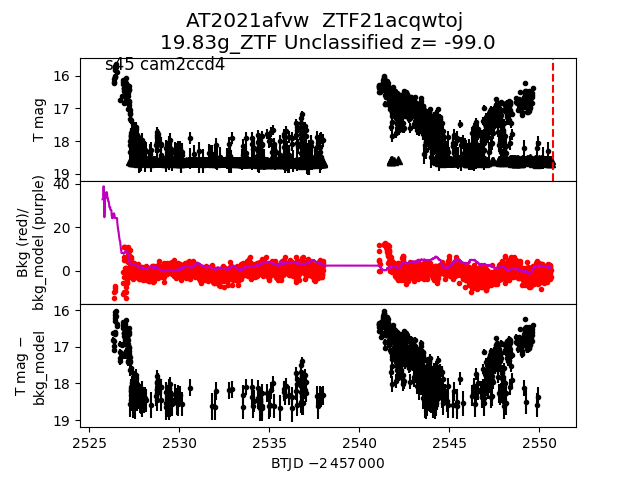
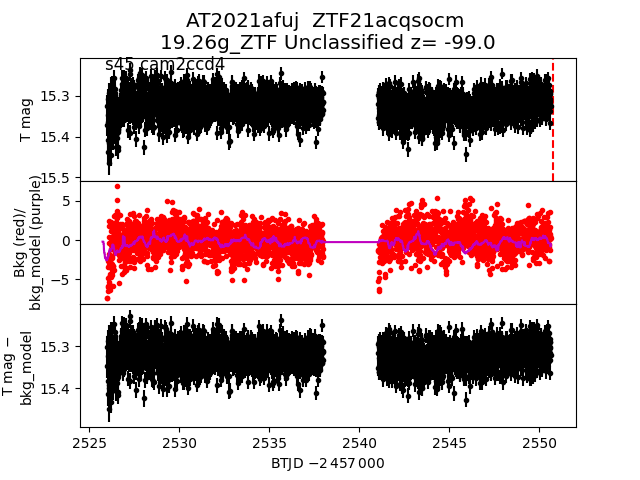
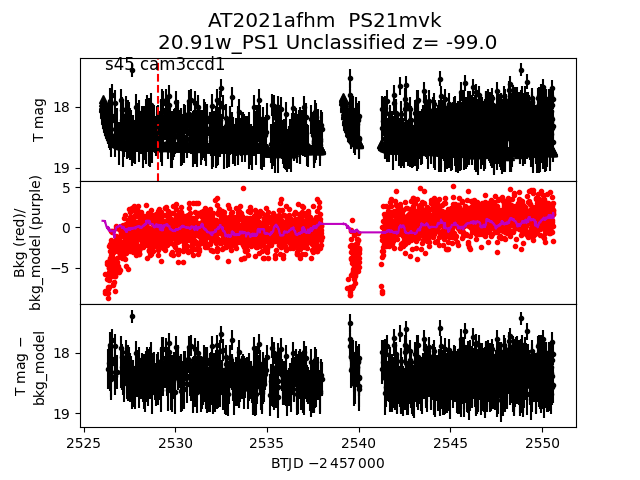
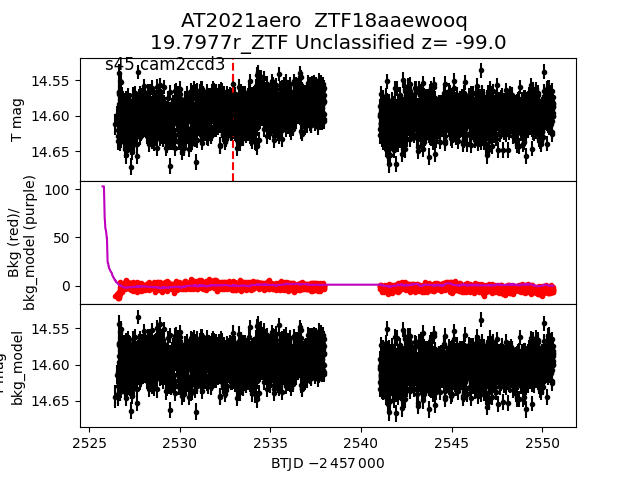
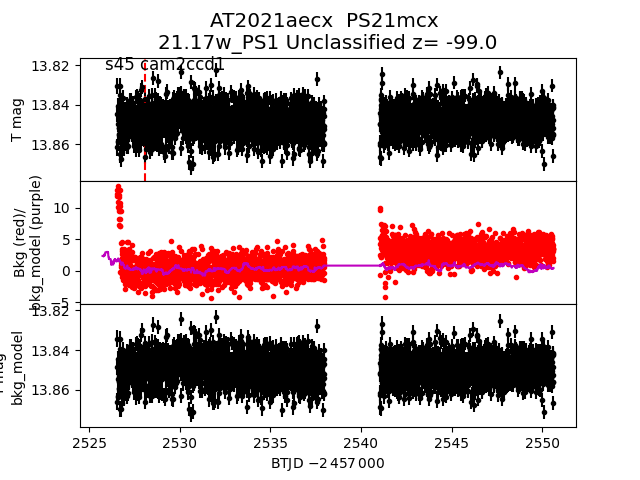
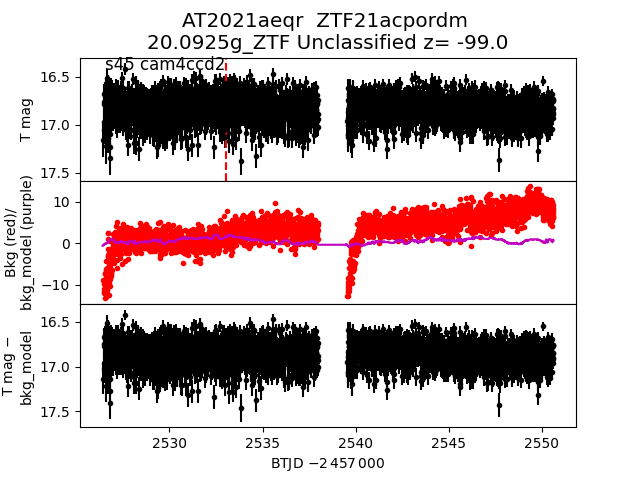
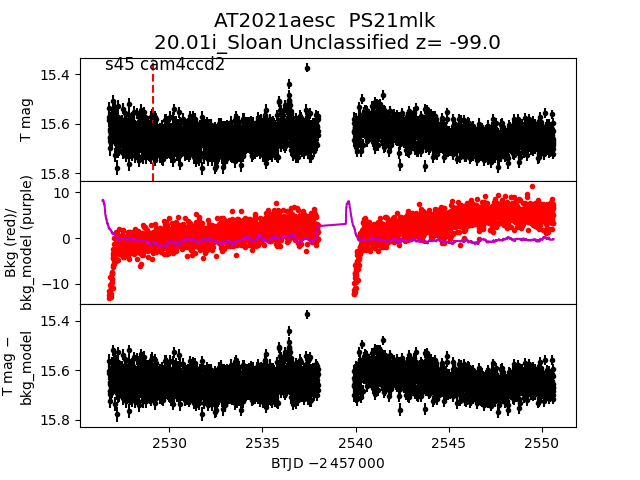
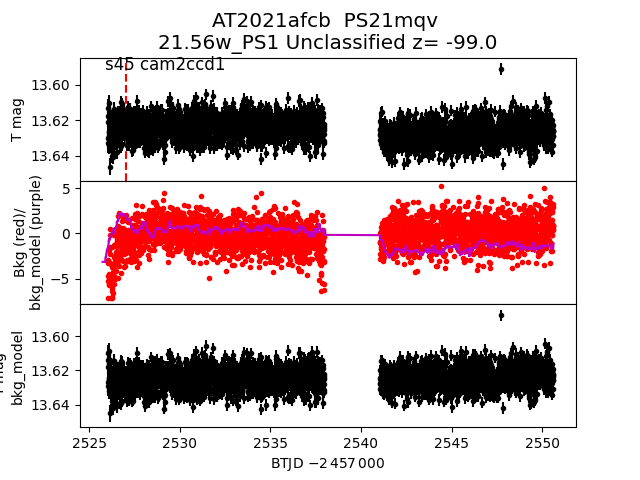
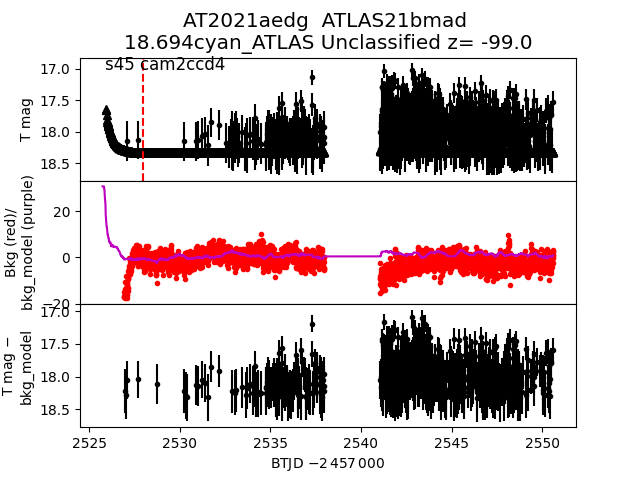
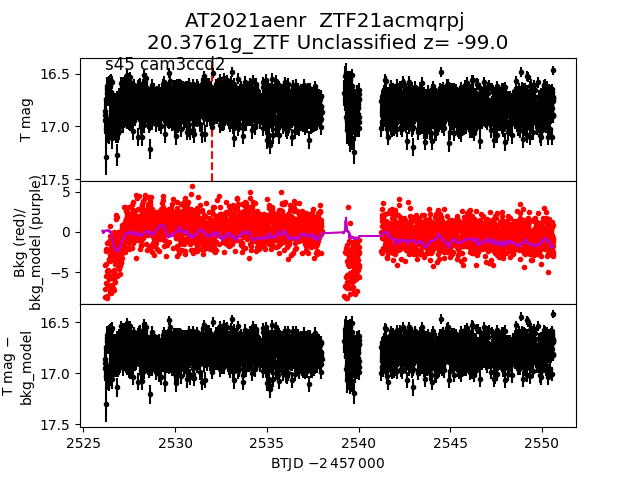
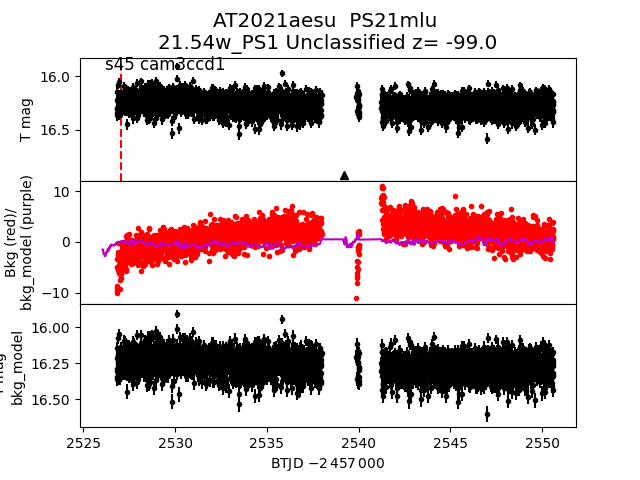
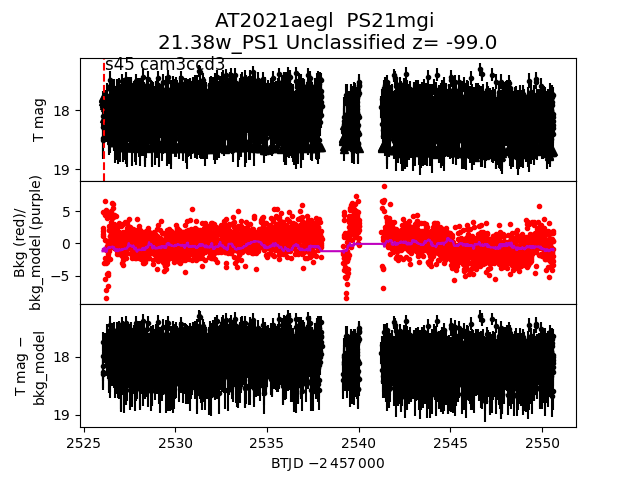
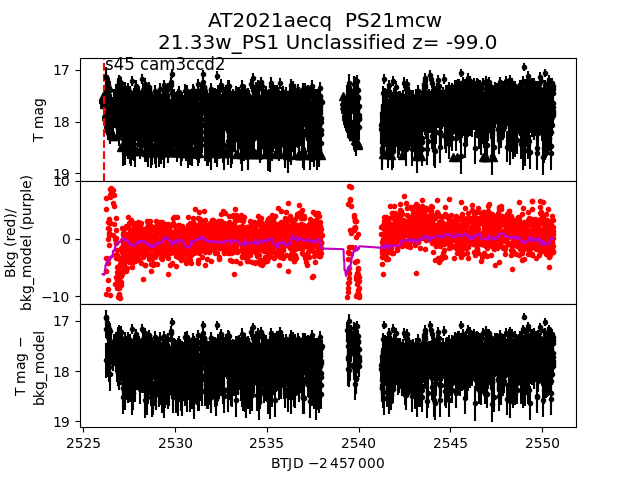
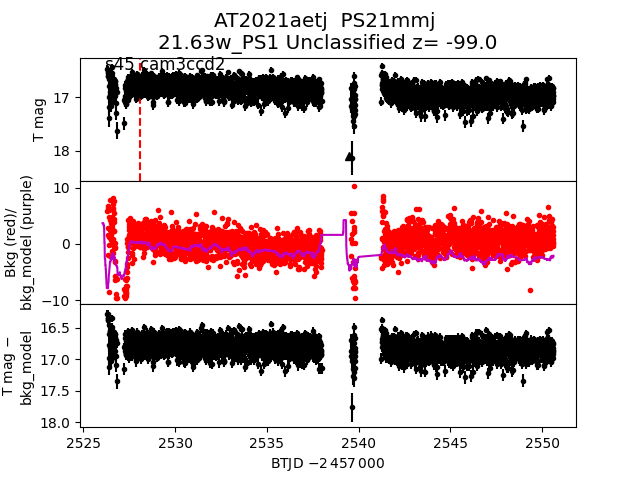
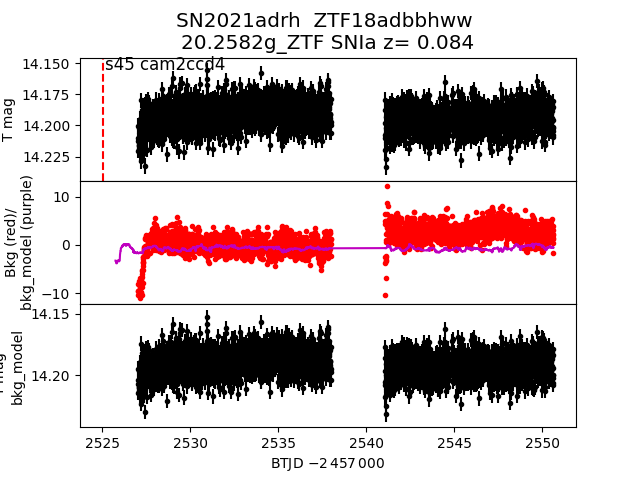
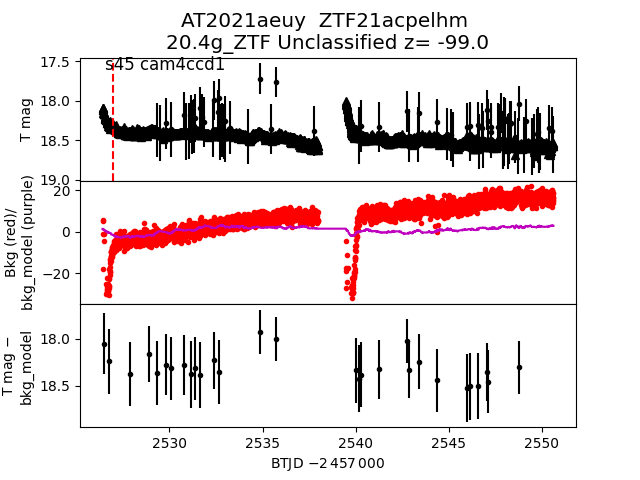
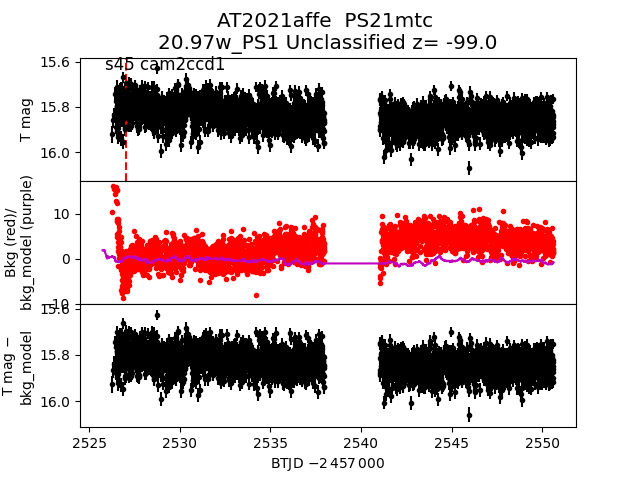
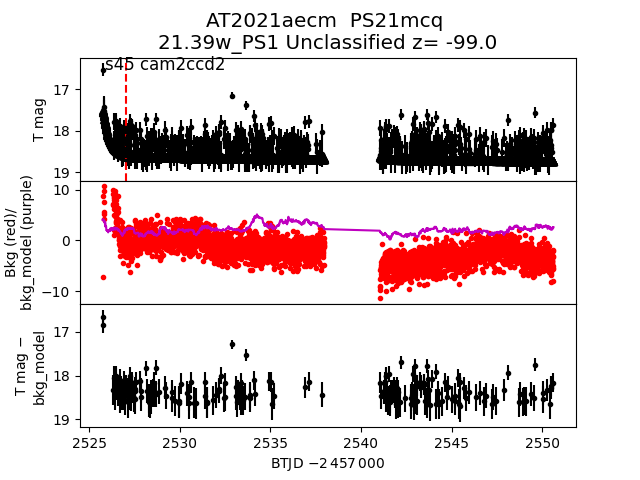
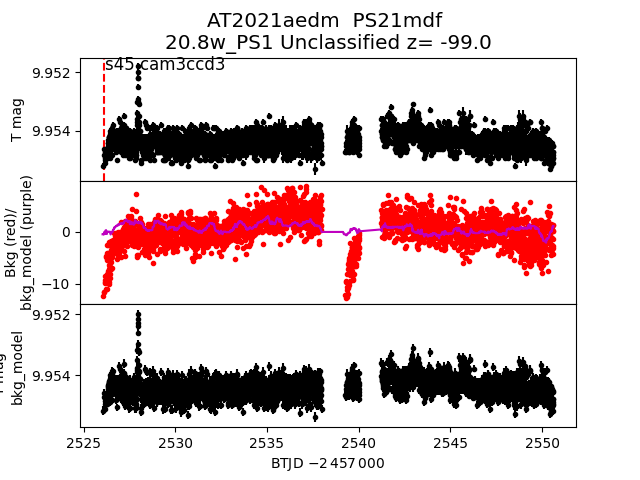
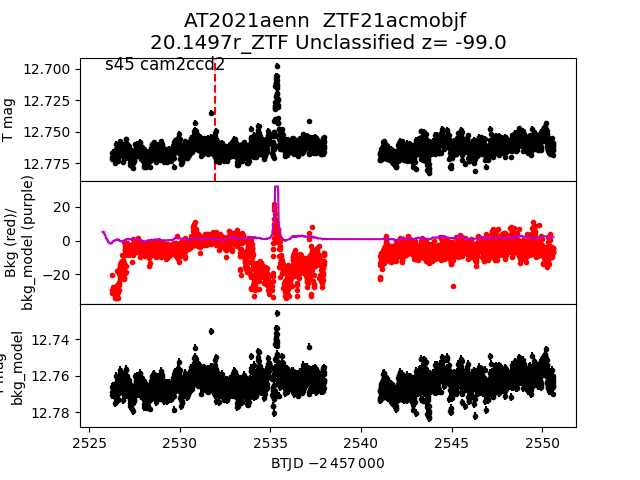
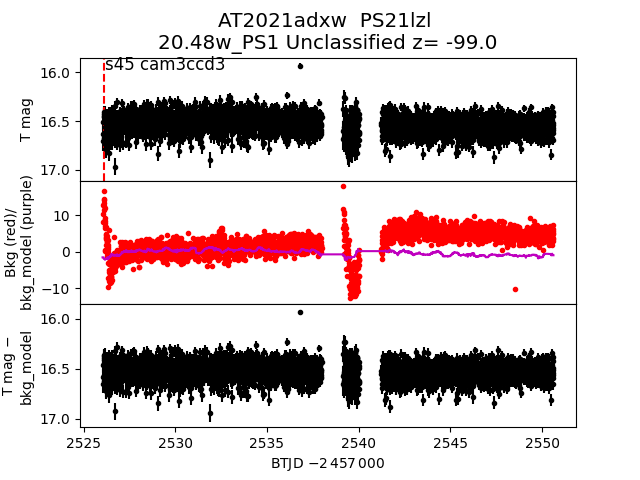
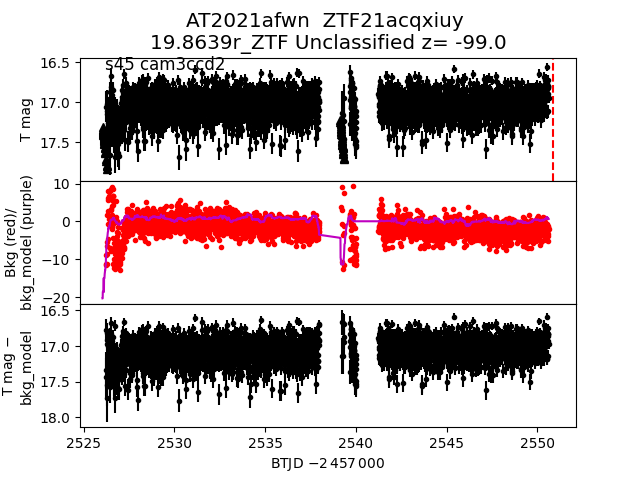
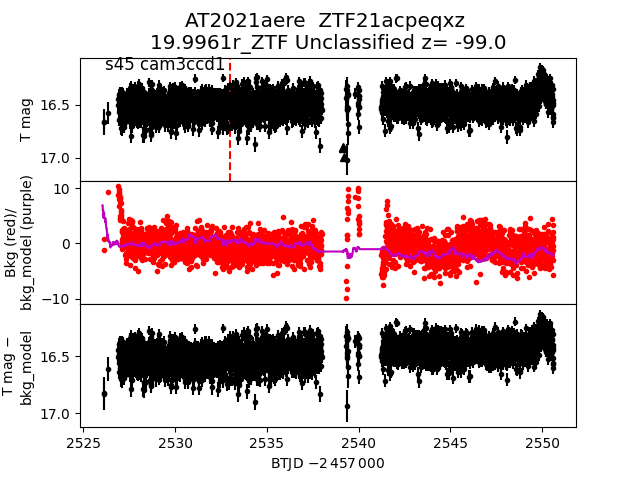
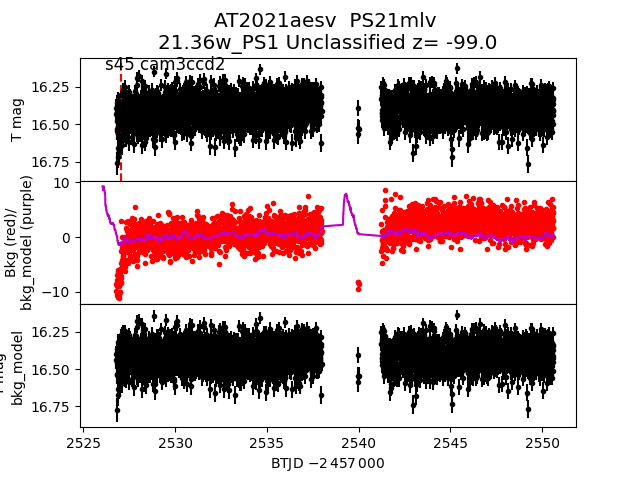
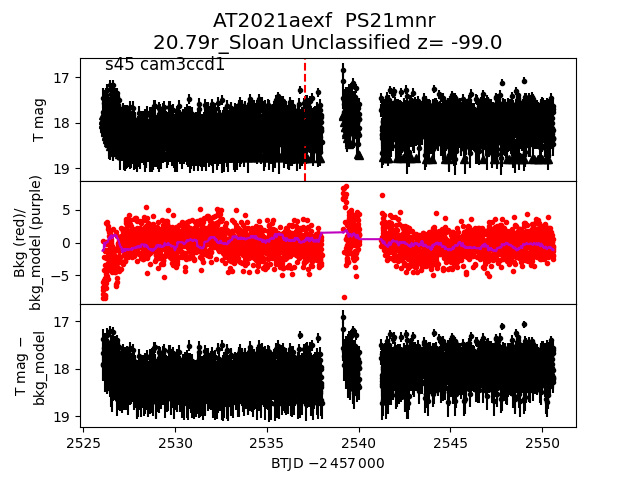
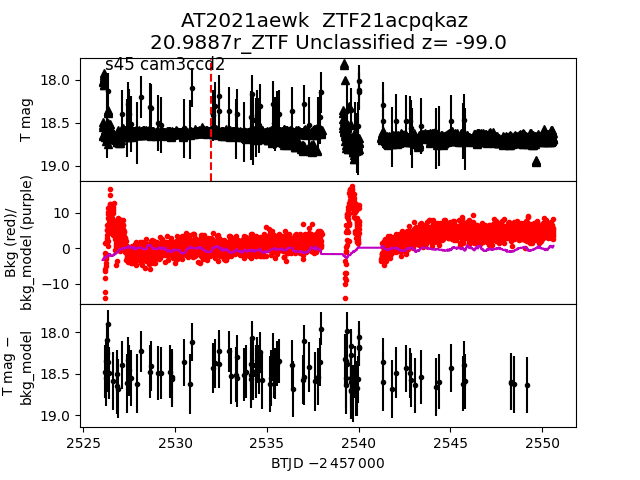
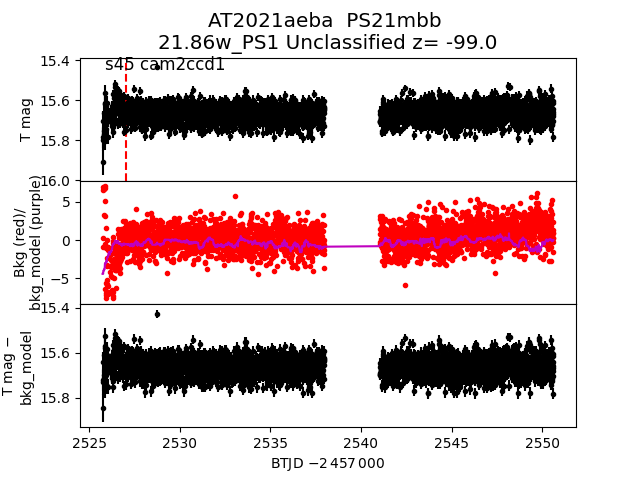
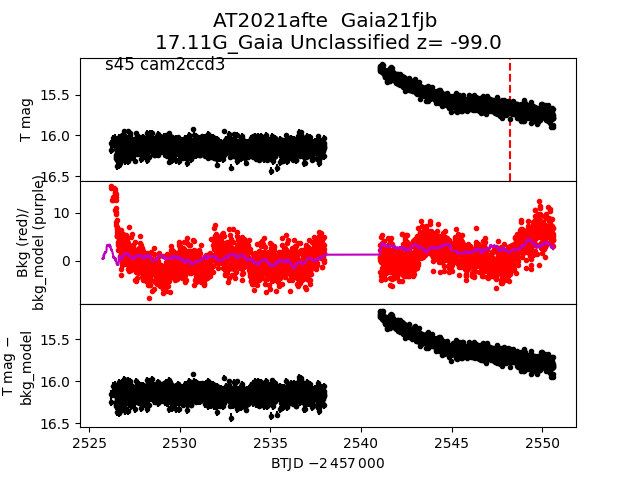
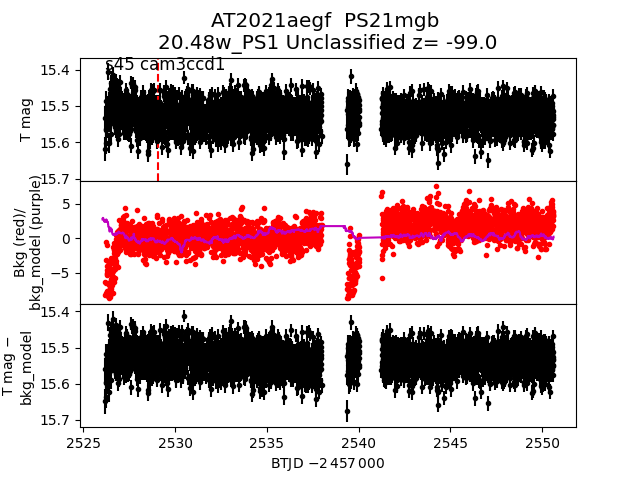
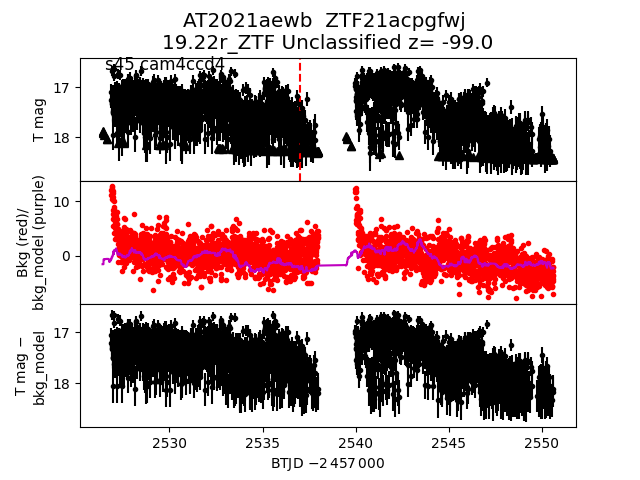
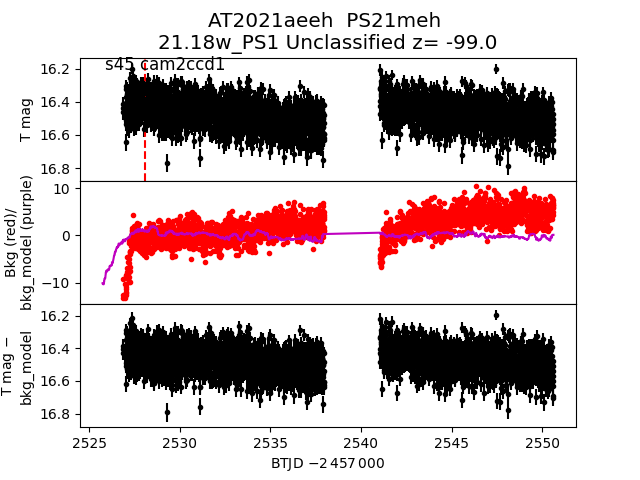
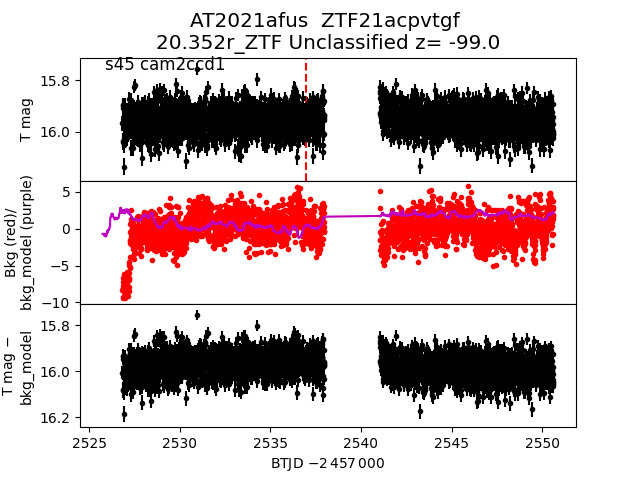
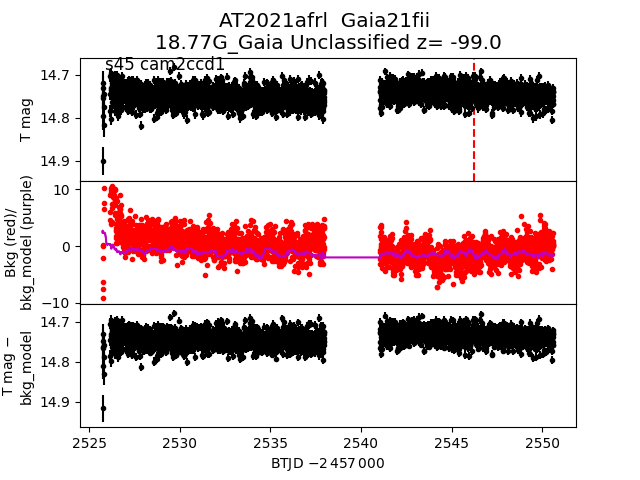
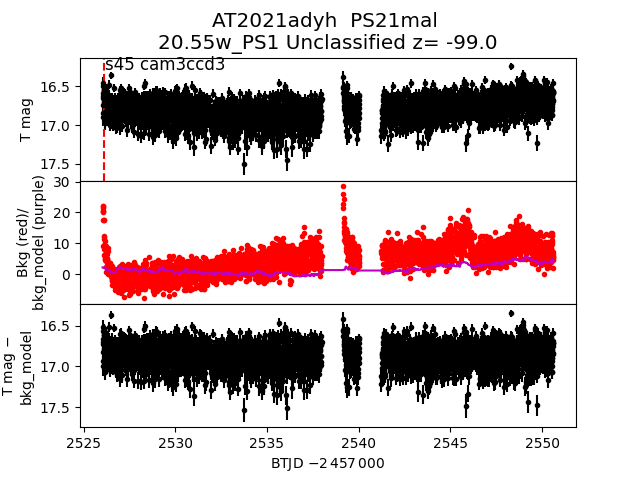
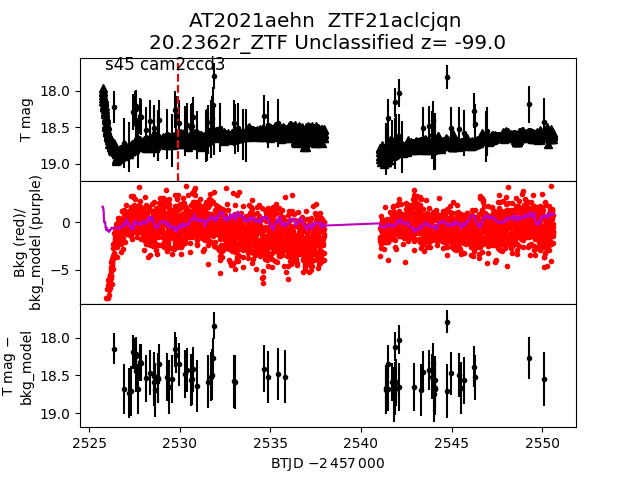
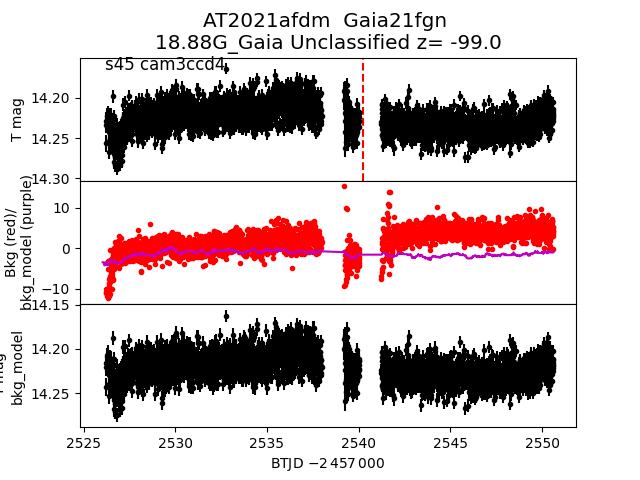
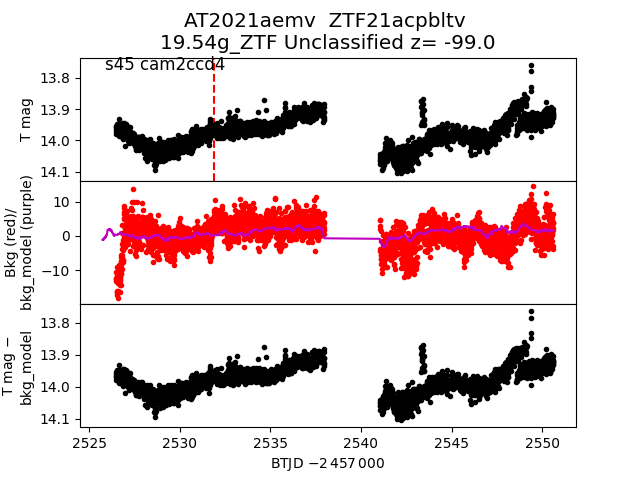
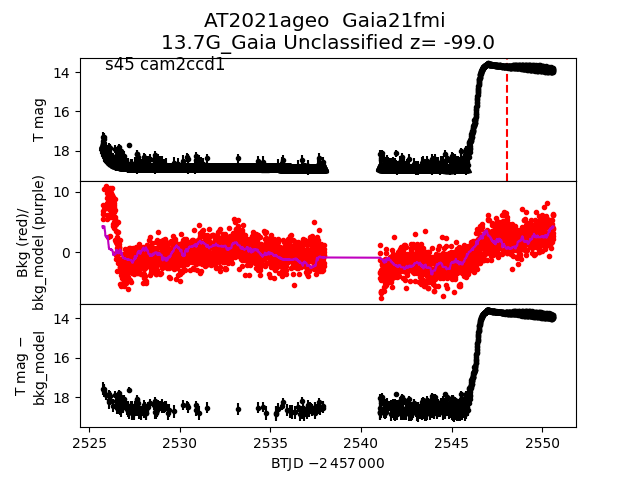
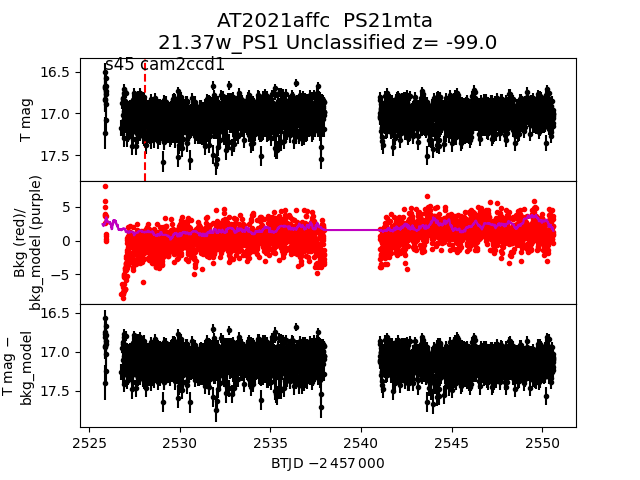
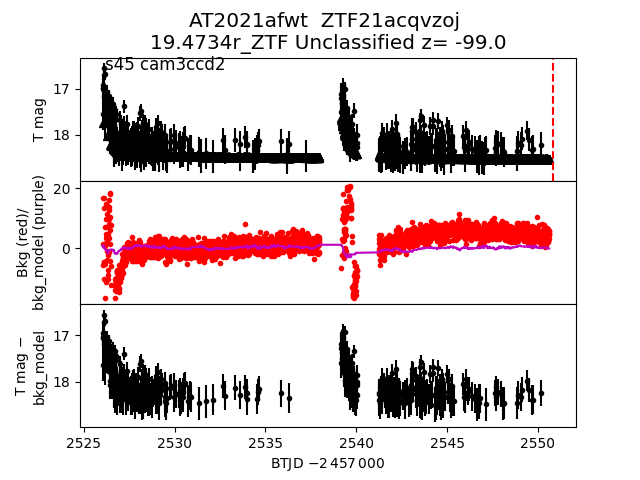
Each figure has three panels. The top panel shows the transient light curve, the middle panel shows the local background (estimated in an annulus), and the bottom panel shows a "background-model corrected" light curve. Details about the background model are in the README.
The vertical red line marks the time of discovery reported to TNS. Other useful metadata from TNS is in the figure title.
Note that the top and bottom panel are in magnitudes, while the middle panel is in differential flux units. The magnitudes are calibrated to the flux in the reference image used for image subtraction. Thus, flux from the host galaxy is included in these magnitudes.
3-sigma upper limits are plotted as triangles with no errorbars. A typical limiting magnitude is 19.6 in 30 minutes or 18.4 in 200 seconds (for low backgrounds).
The links allow you to download the light curve data as a text file.
More details in the README.
2021afkg
 2021aeaa
 2021aeux
 2021aeis
 2021adyf
 2021aedp
 2021aesb
 2021aecf
 2021aern
 2021aeut
 2021aewz
 2021aeol
 2021aekq
 2021aeeo
 2021aewe
 2021adxo
 2021aeym
 2021afrx
 2021afwi
 2021adxp
 2021afst
 2021aewl
 2021aesq
 2021afqy
 2021aebe
 2021afds
 2021aehf
 2021afwj
 2021aejw
 2021afwu
 2021aeqc
 2021afth
 2021adyi
 2021afvp
 2021aeel
 2021aerh
 2021aesd
 2021afhu
 2021aerw
 2021aevj
 2021aehp
 2021afrh
 2021adva
 2021afan
 2021adys
 2021aevy
 2021aeds
 2021aerd
 2021afwo
 2021aezi
 2021afee
 2021aemm
 2021aeqf
 2021adyz
 2021aeno
 2021aerc
 2021aeod
 2021adxq
 2021adyb
 2021afuf
 2021afcq
 2021adxn
 2021aemu
 2021aeex
 2021aevw
 2021afvr
 2021aebn
 2021aehr
 2021afsc
 2021afup
 2021aeia
 2021afvw
 2021afuj
 2021afhm
 2021aero
 2021aecx
 2021aeqr
 2021aesc
 2021afcb
 2021aedg
 2021aenr
 2021aesu
 2021aegl
 2021aecq
 2021aetj
 2021adrh
 2021aeuy
 2021affe
 2021aecm
 2021aedm
 2021aenn
 2021adxw
 2021afwn
 2021aere
 2021aesv
 2021aexf
 2021aewk
 2021aeba
 2021afte
 2021aeus
 2021aebw
 2021aftz
 2021afap
 2021aegf
 2021aewb
 2021aeeh
 2021afus
 2021afrl
 2021adyh
 2021aehn
 2021afdm
 2021aemv
 2021ageo
 2021affc
 2021afwt
 2021afxf