all transients in sector44 (107 total)
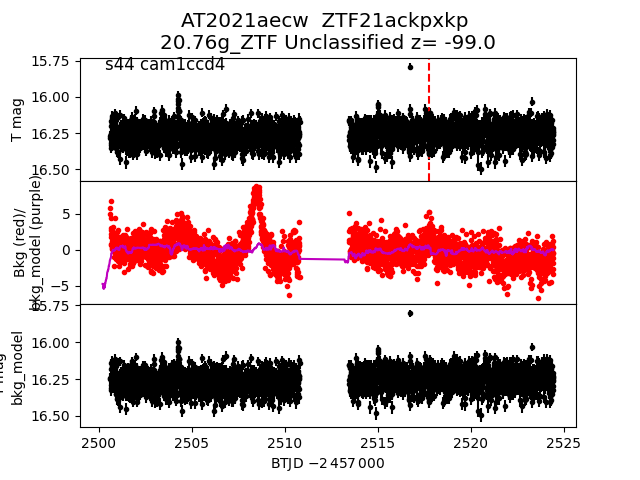
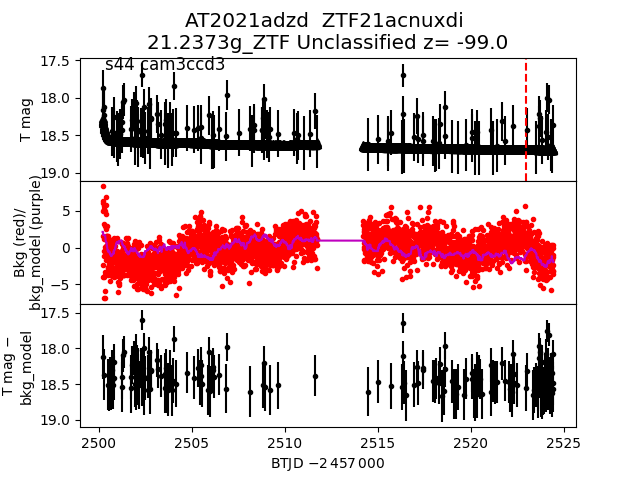
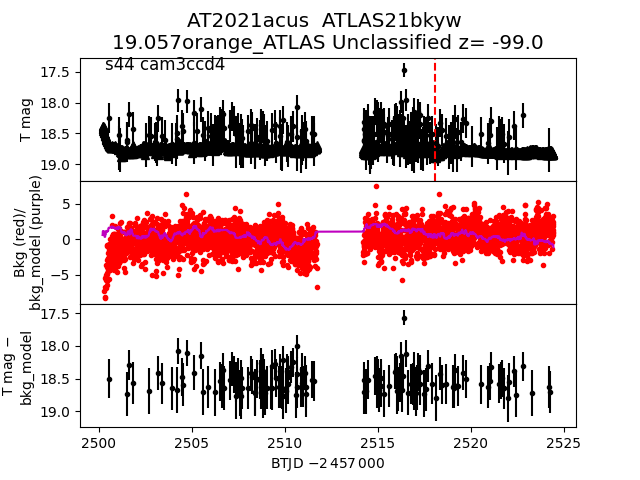
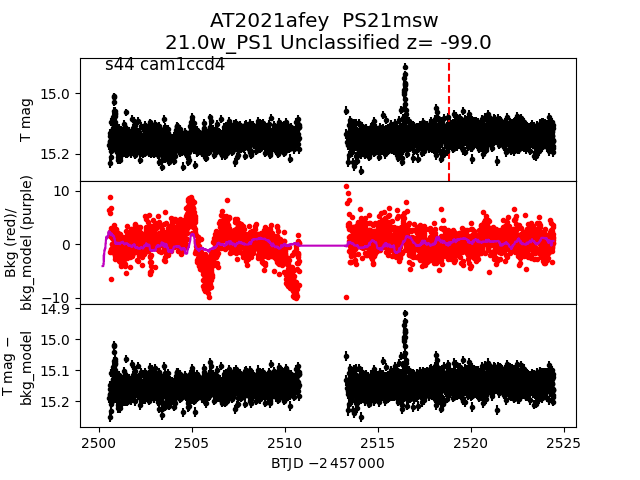
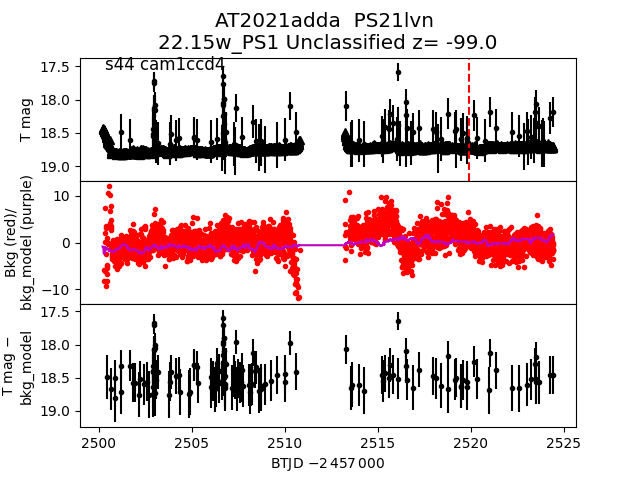
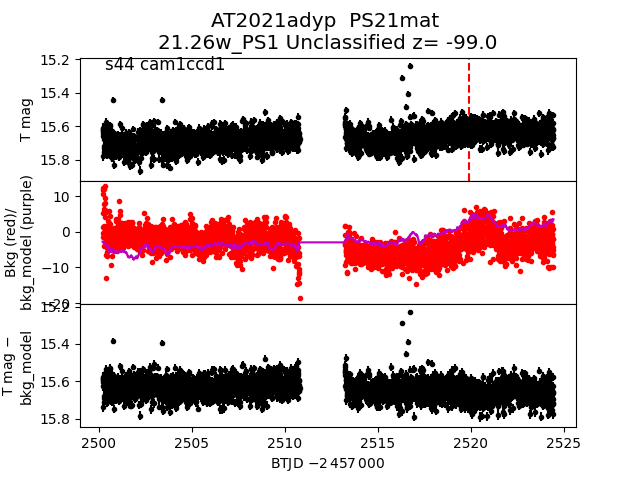
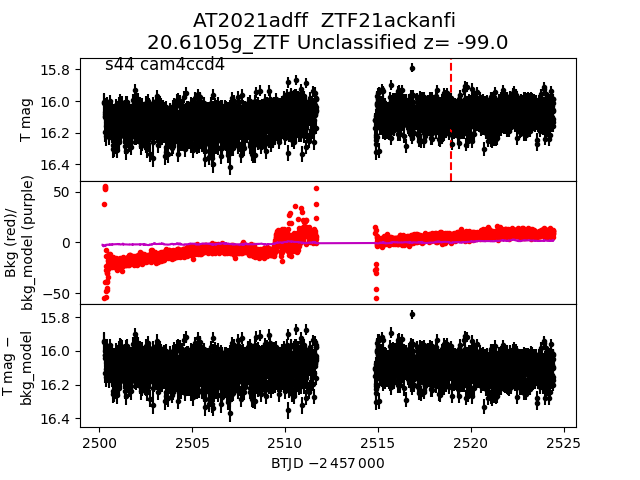
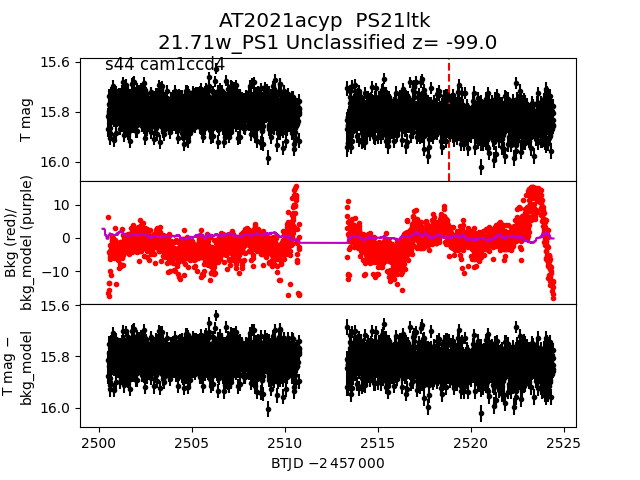
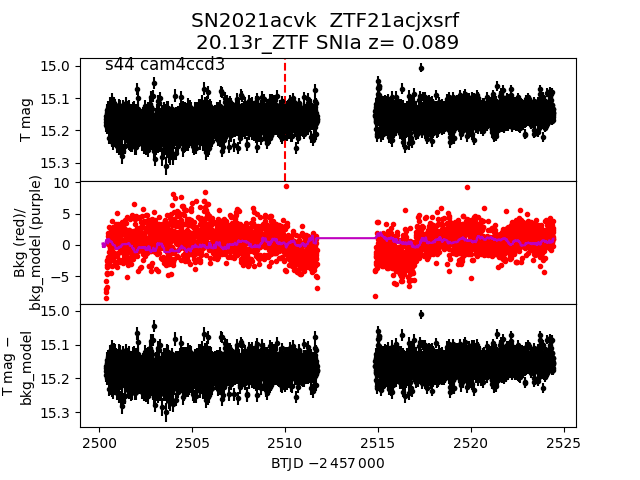
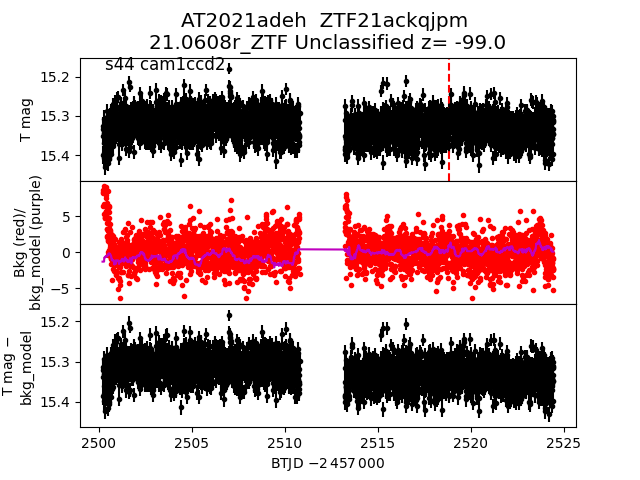
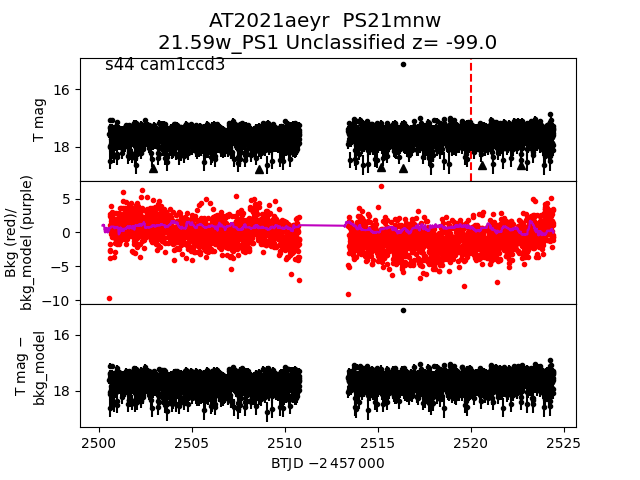
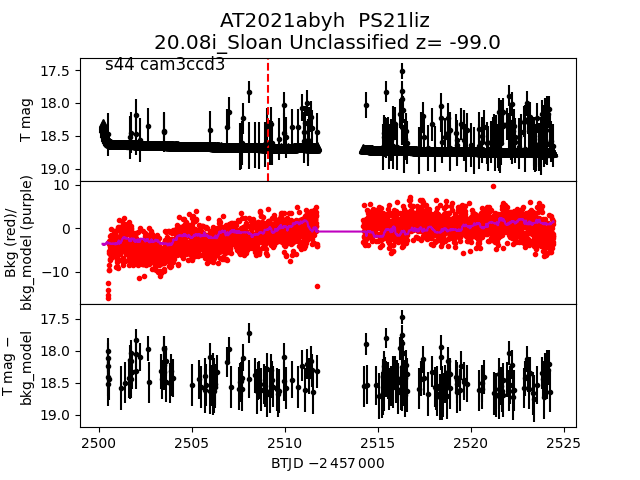
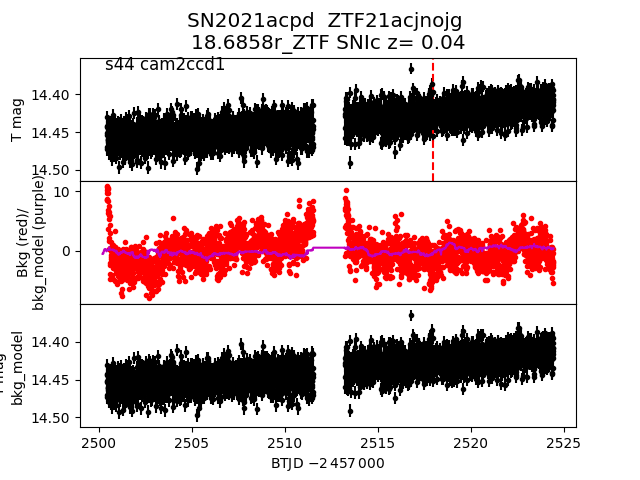
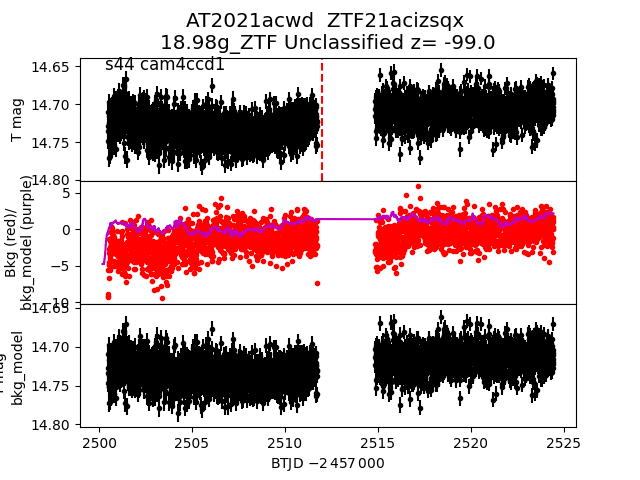
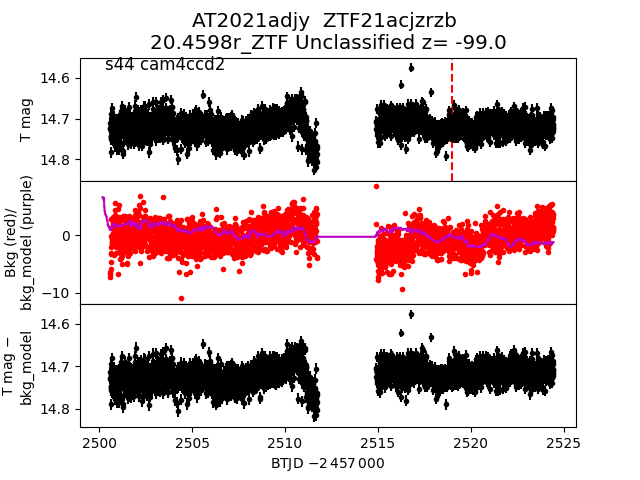
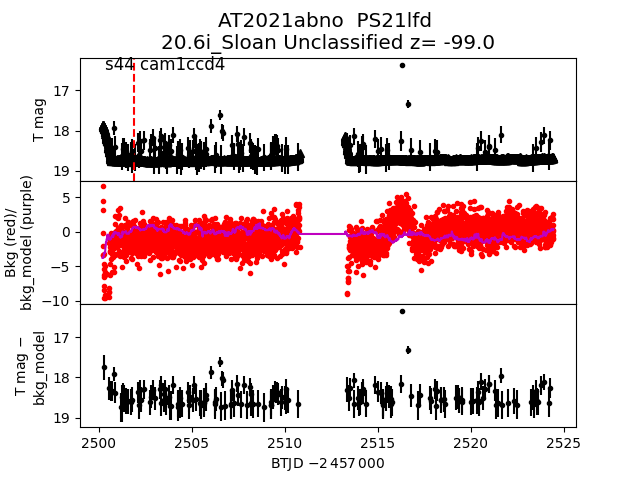
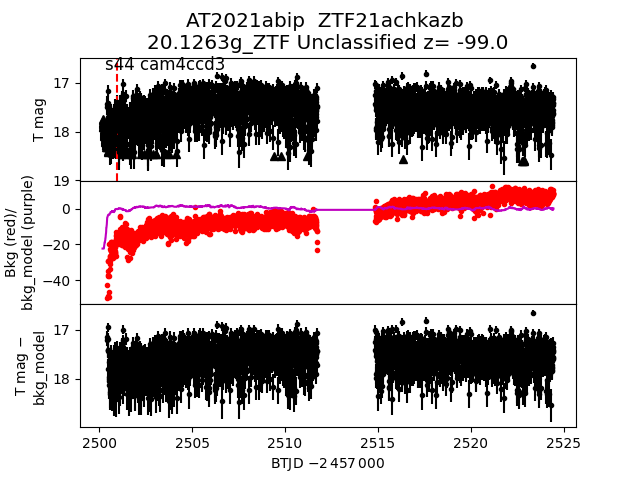
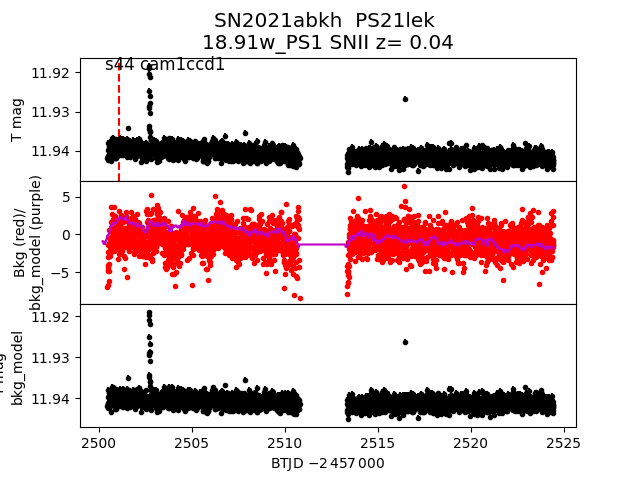
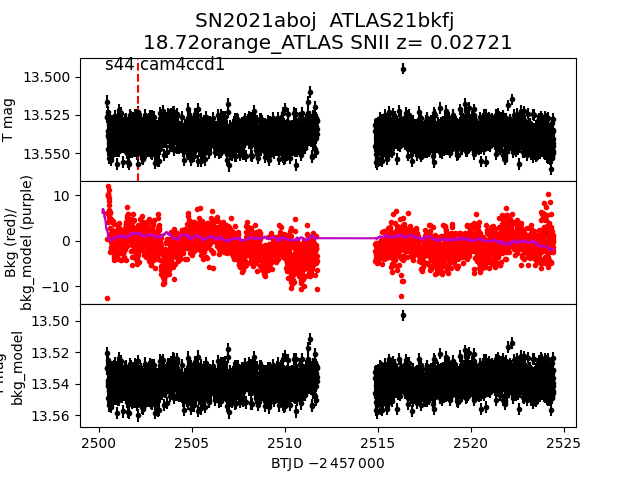
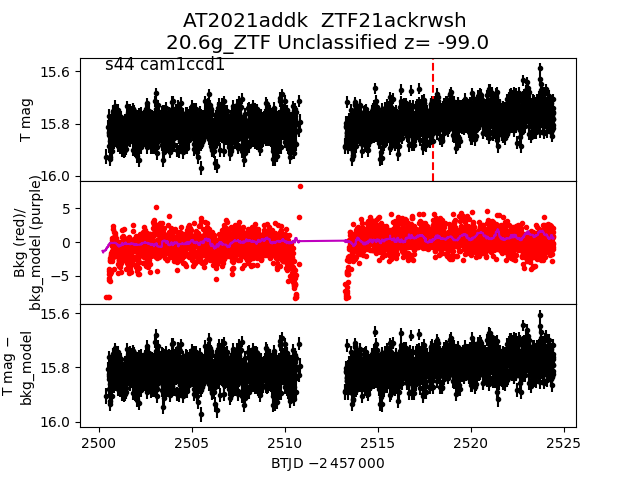
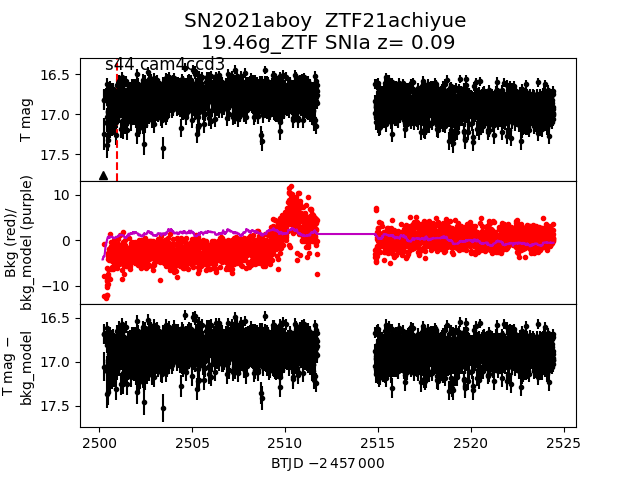
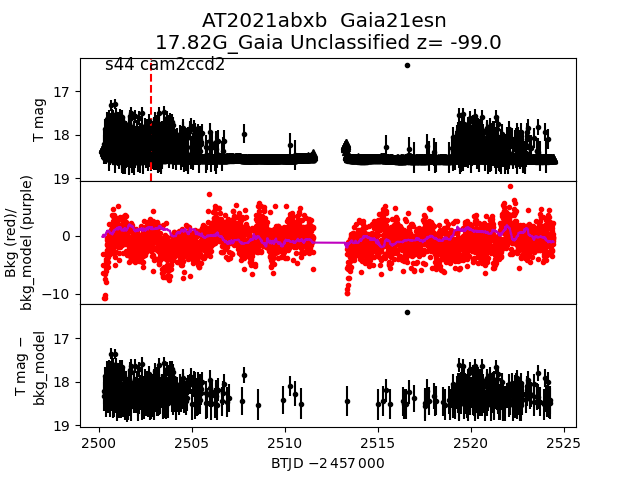
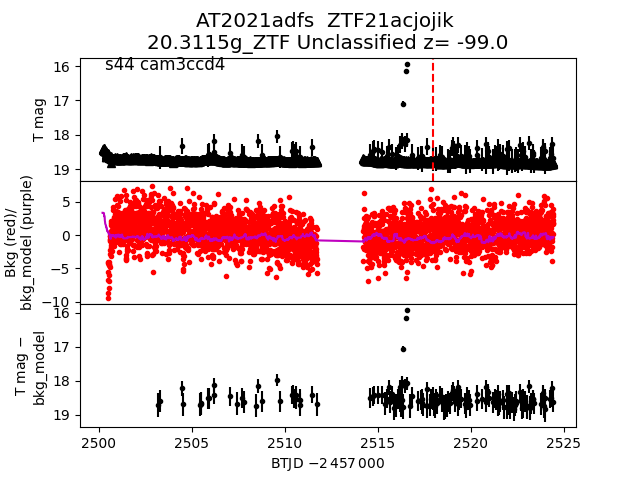
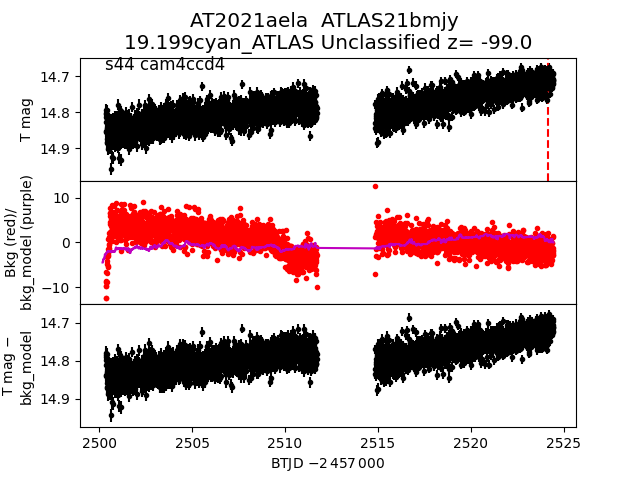
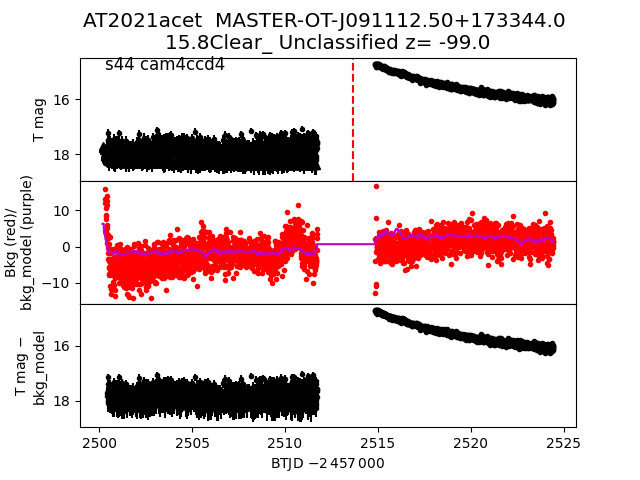
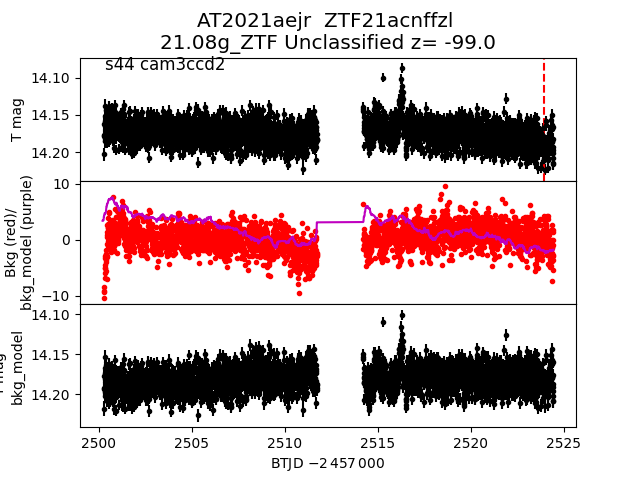
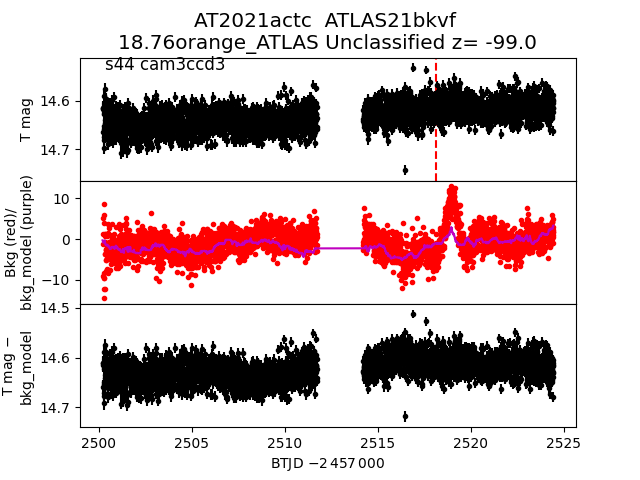
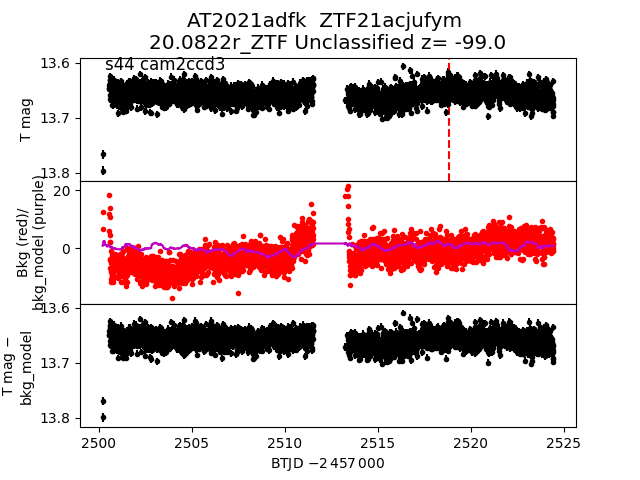
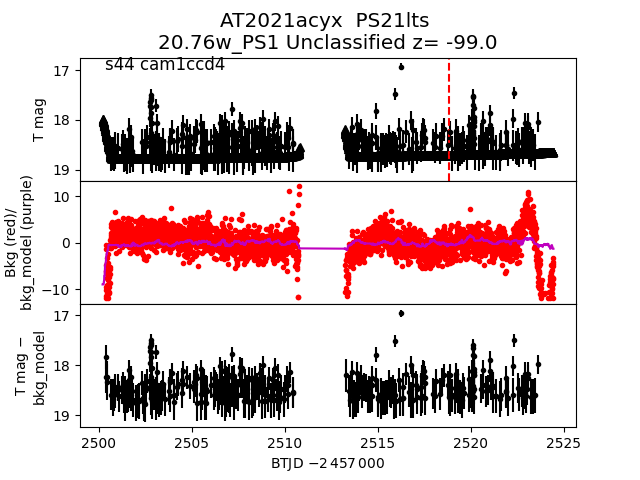
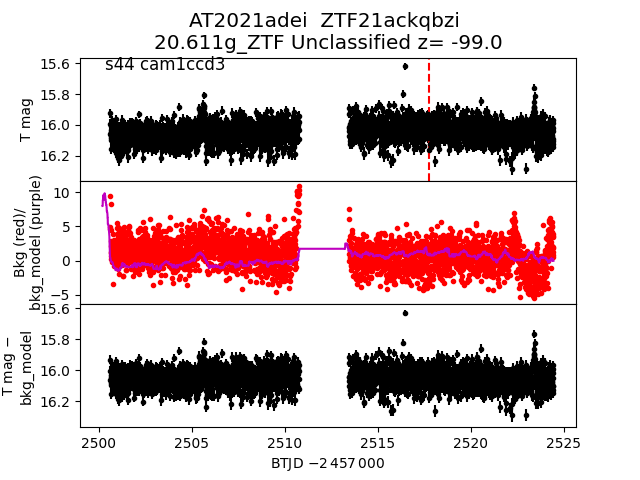
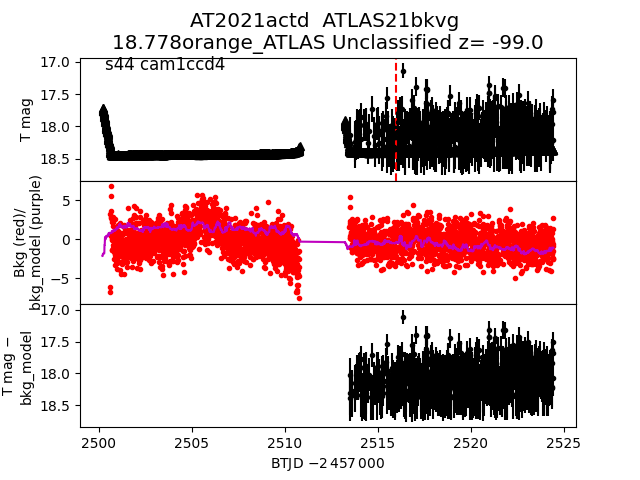
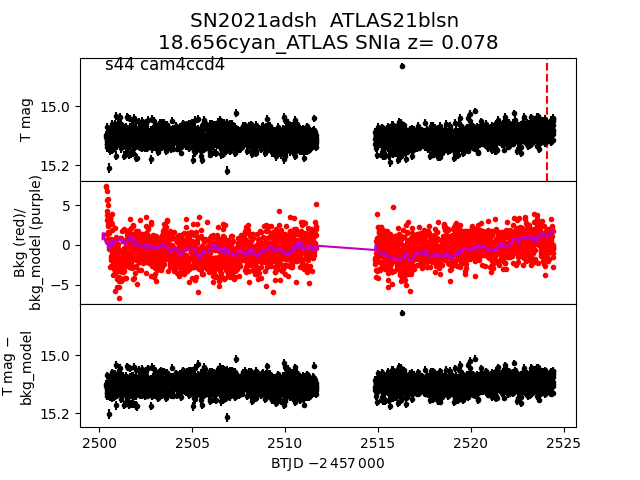
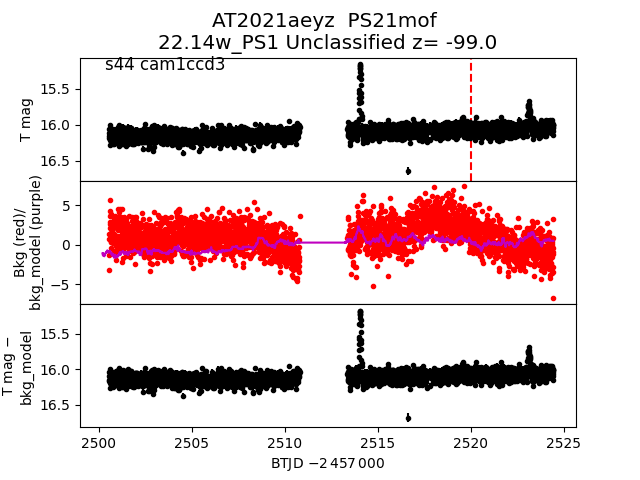
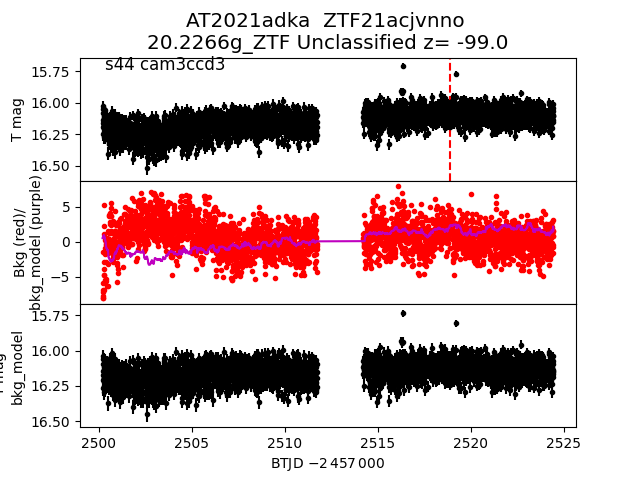
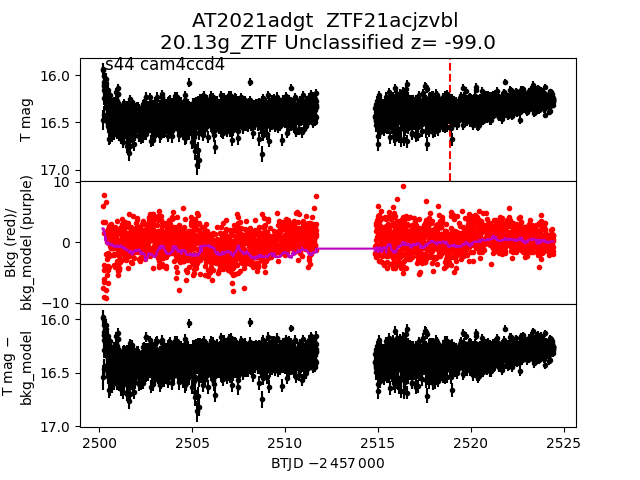
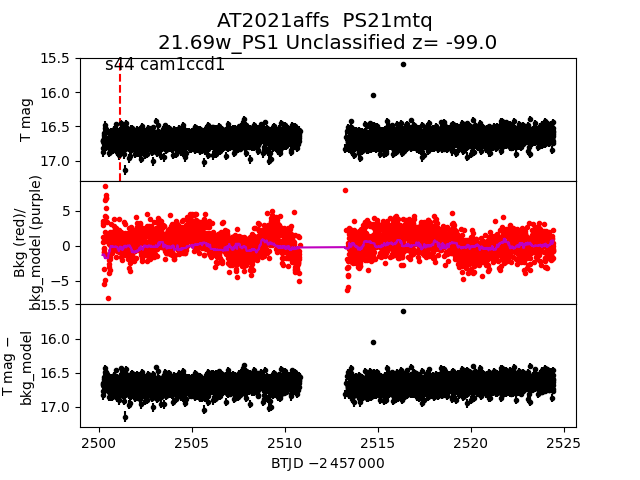
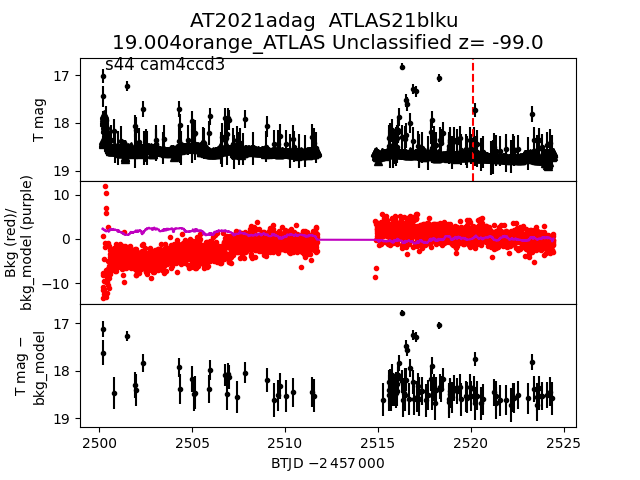
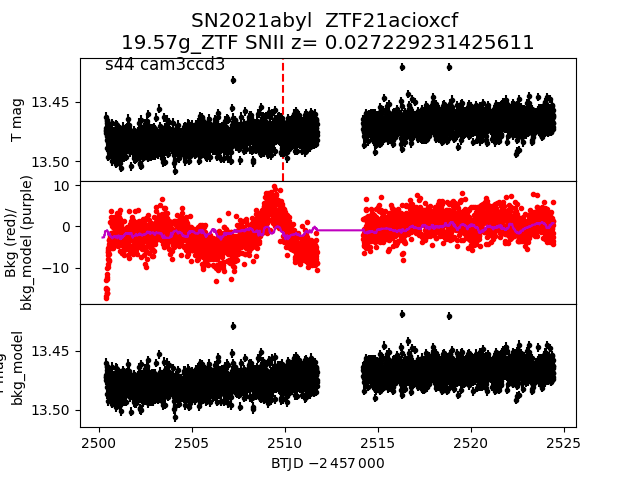
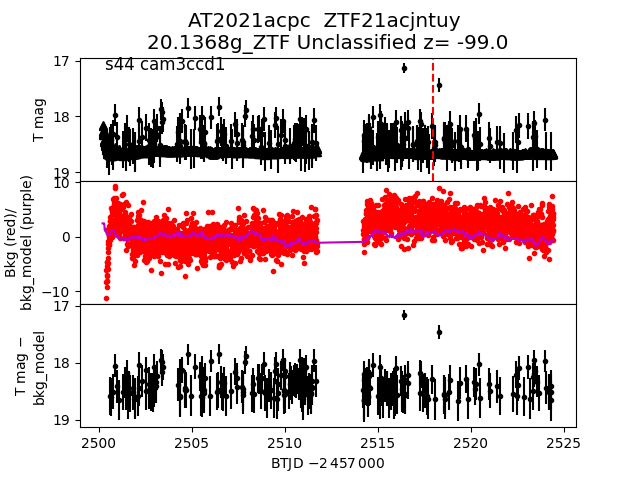
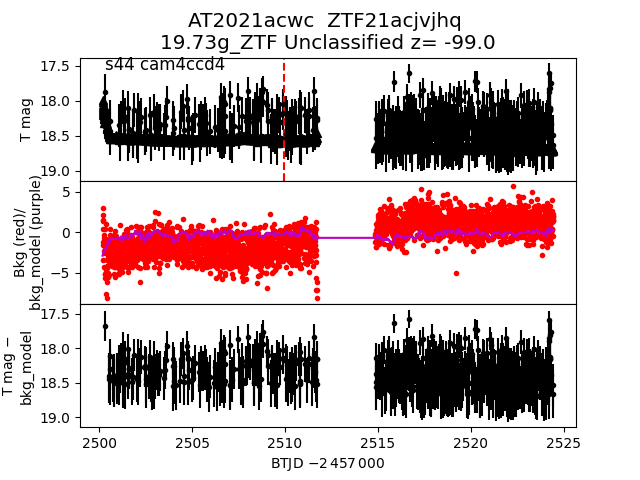
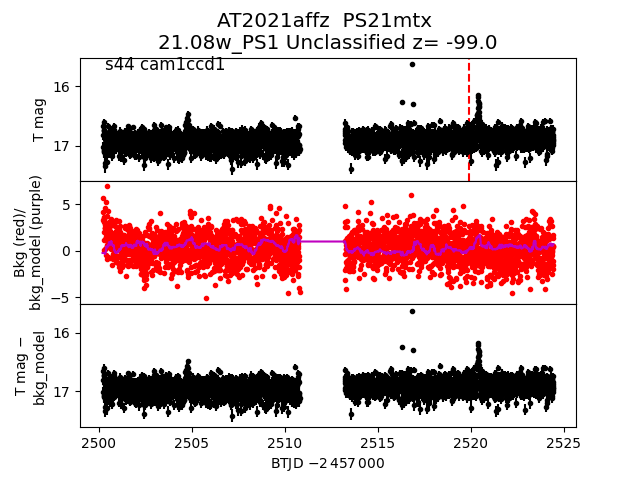
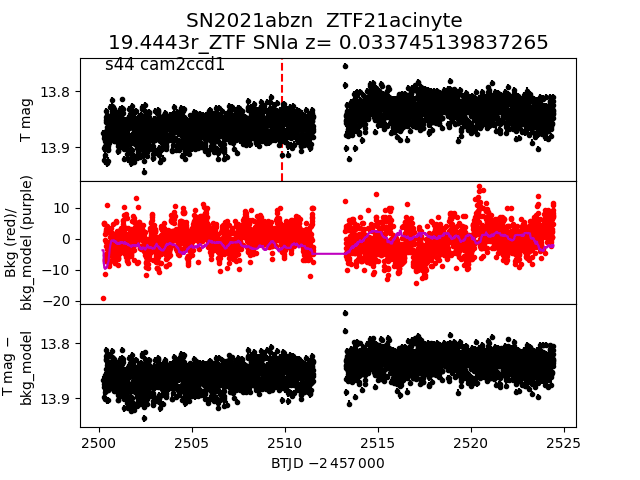
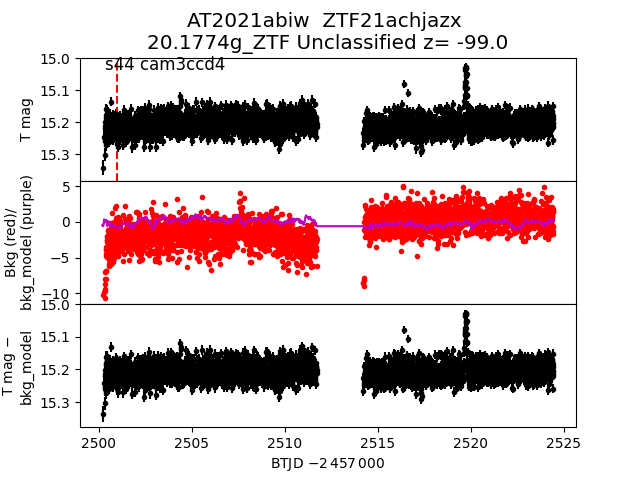
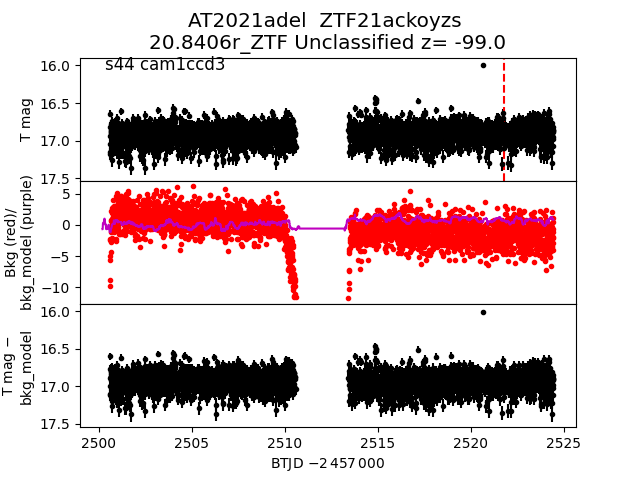
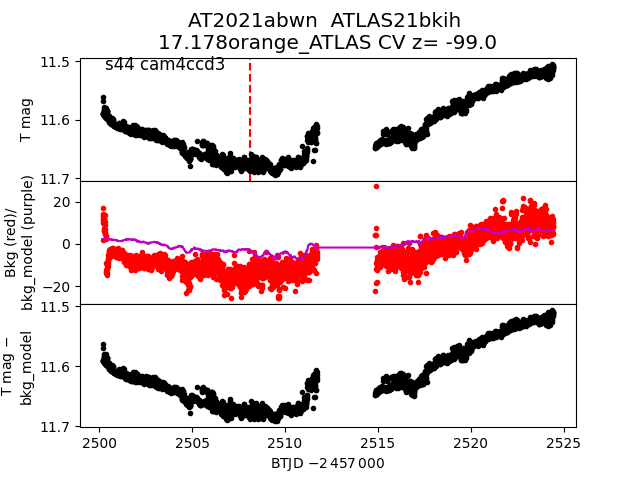
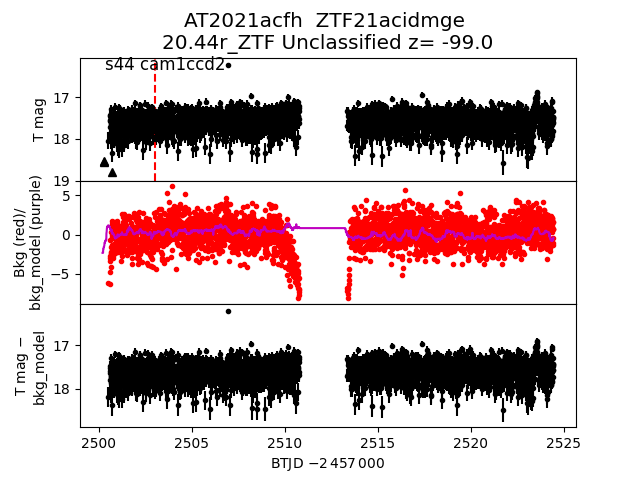
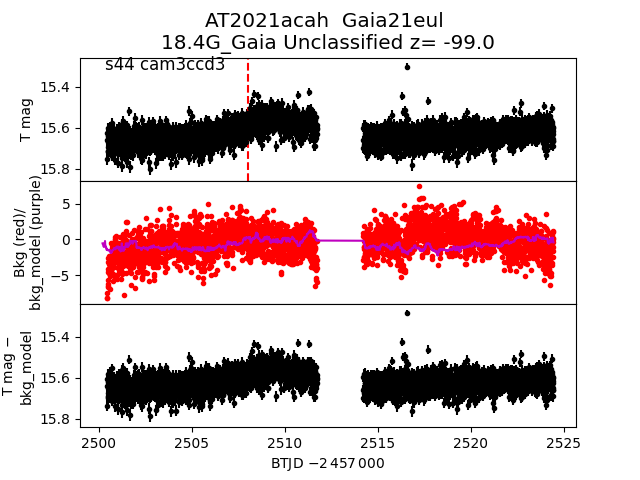
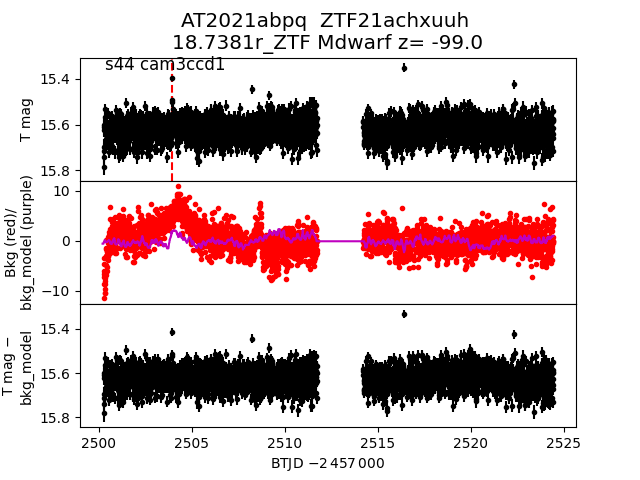
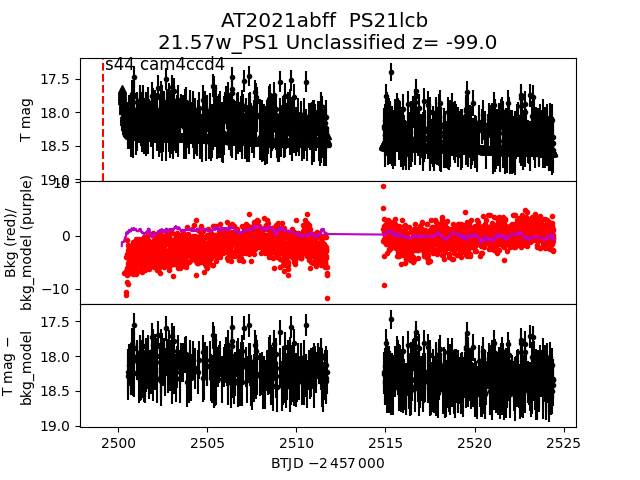
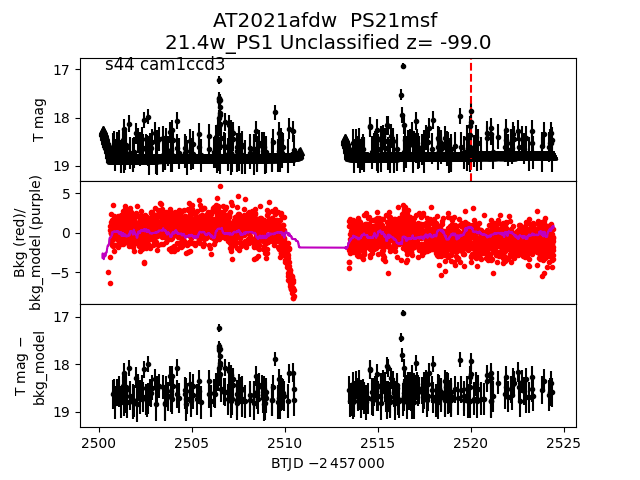
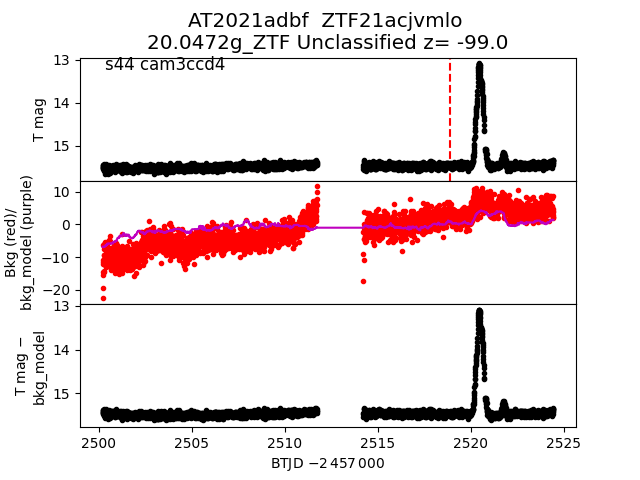
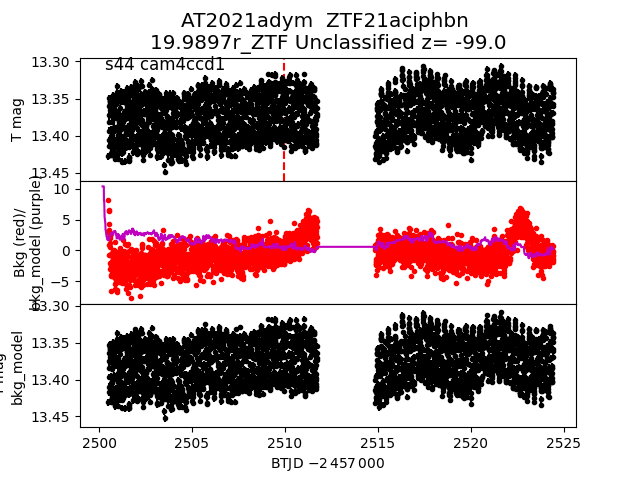
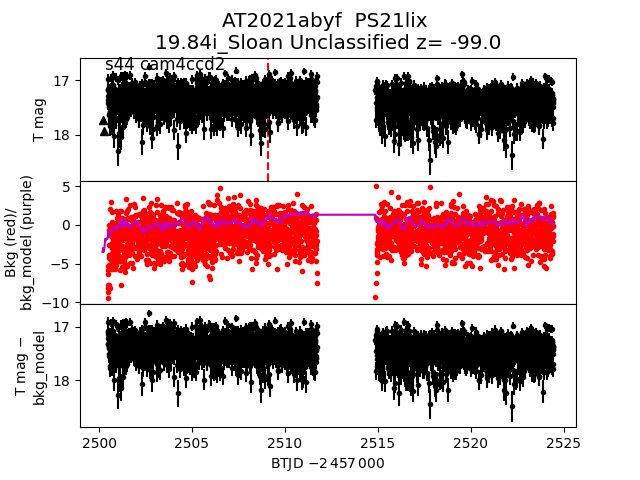
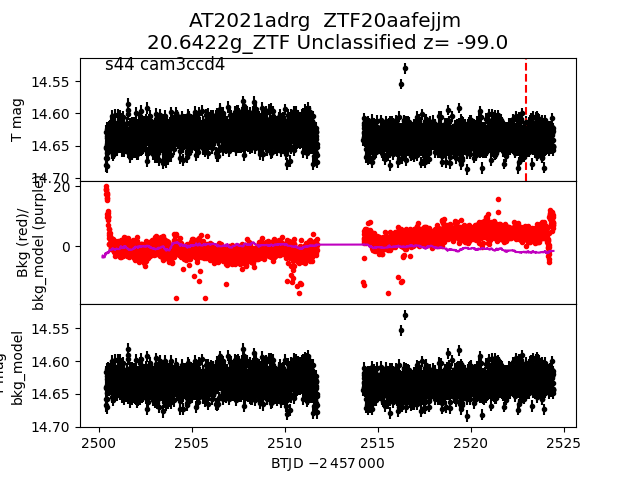
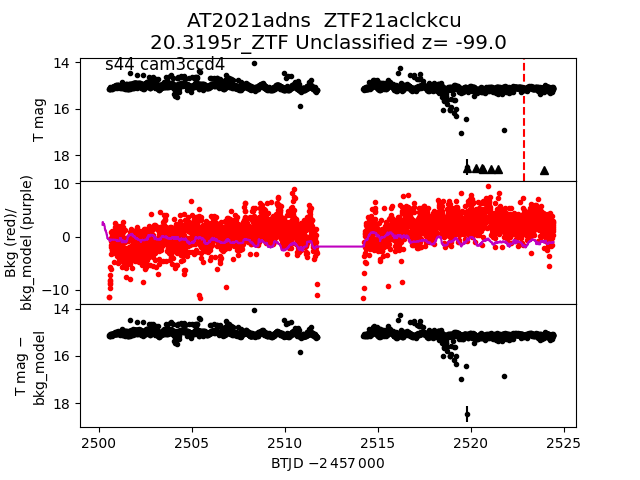
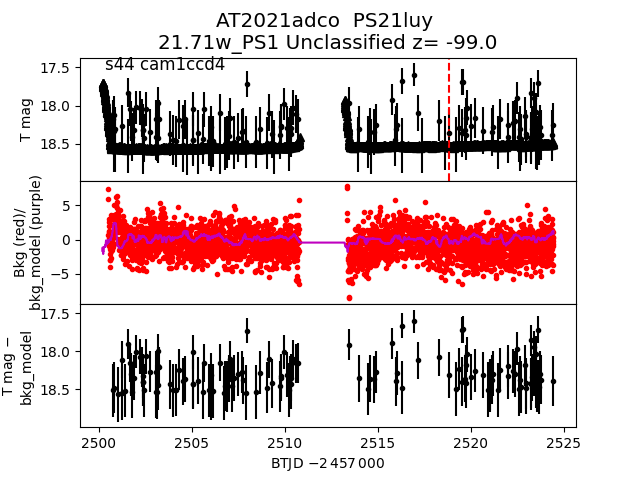
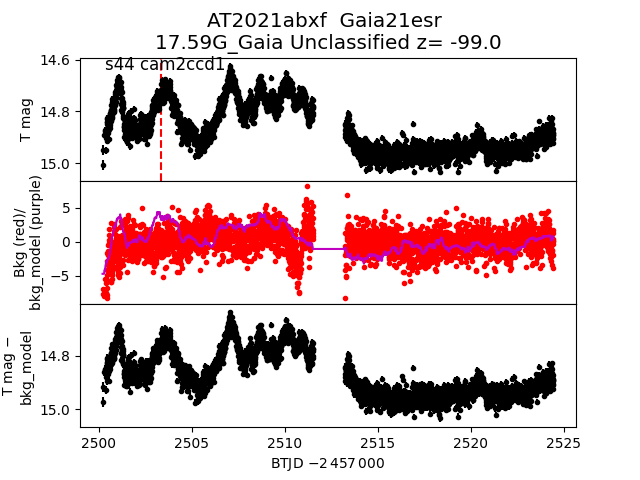
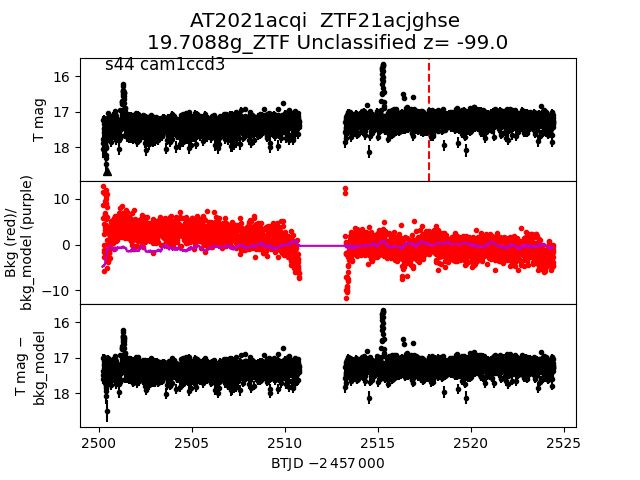
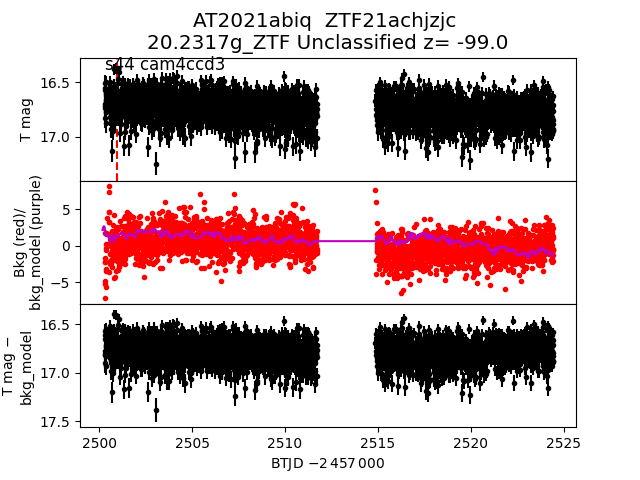
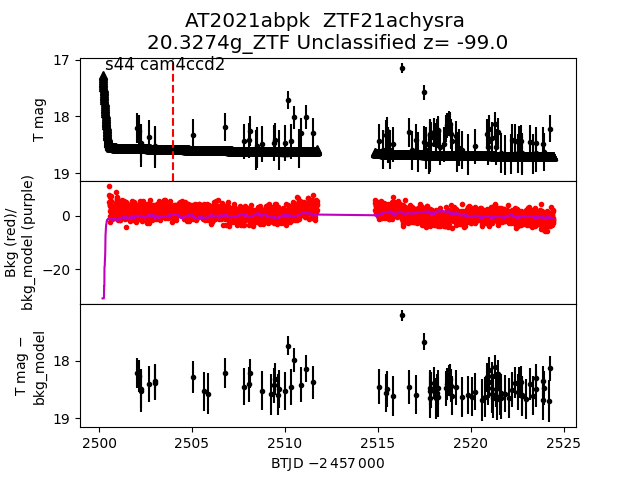
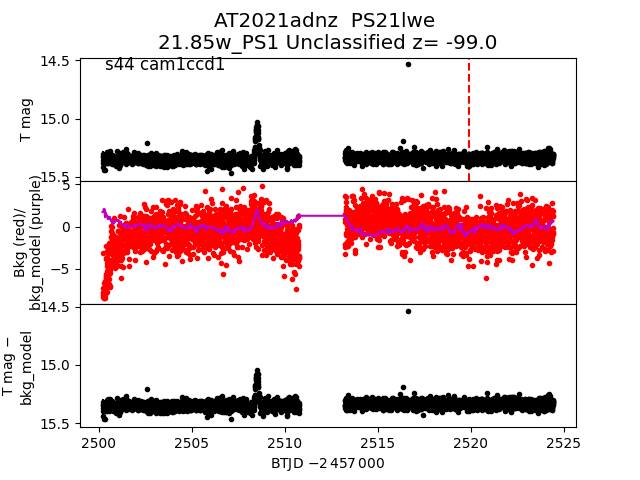
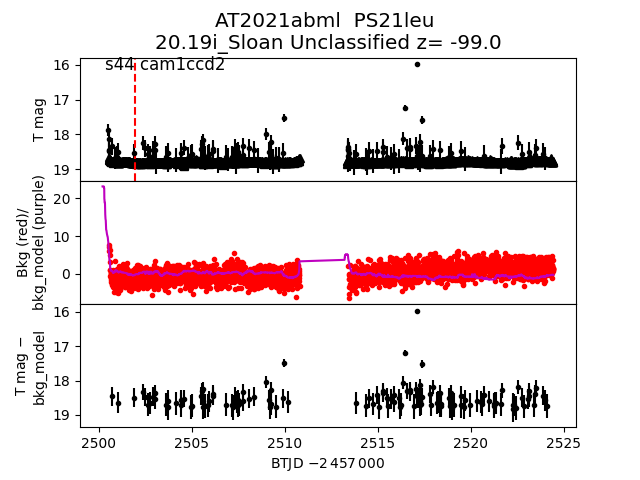
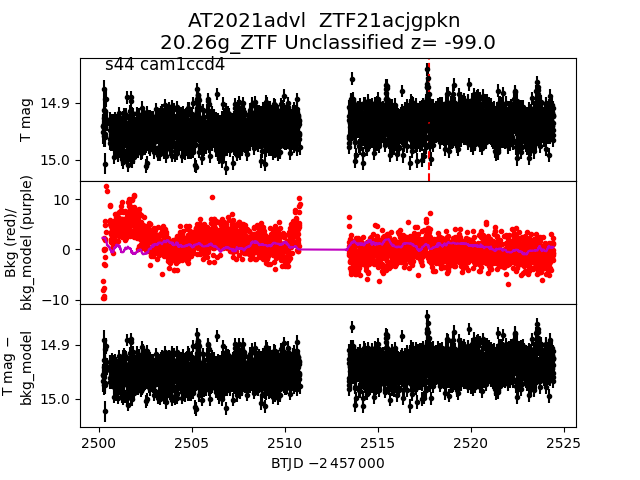
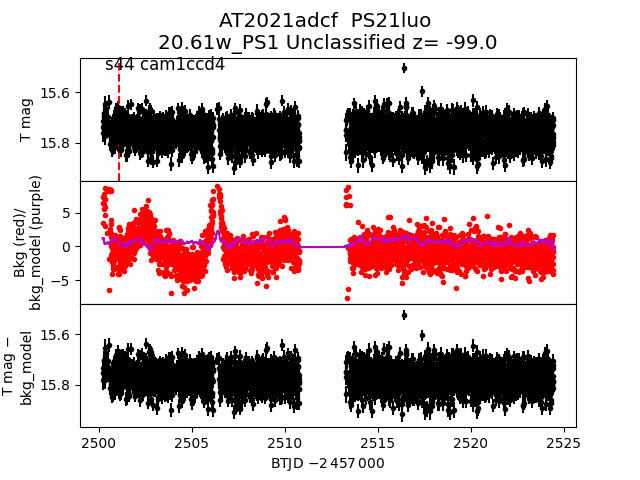
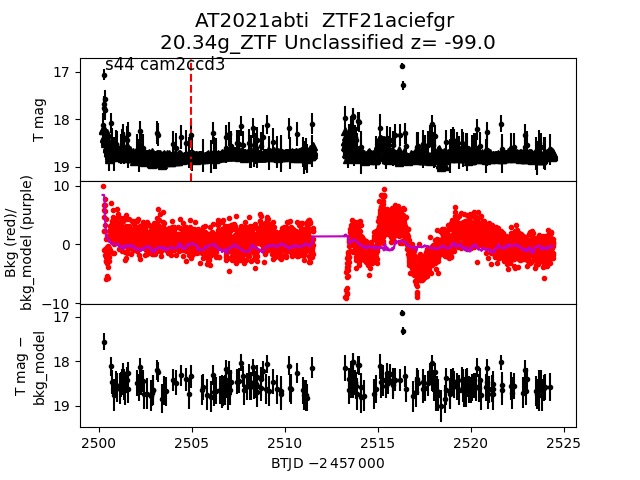
Each figure has three panels. The top panel shows the transient light curve, the middle panel shows the local background (estimated in an annulus), and the bottom panel shows a "background-model corrected" light curve. Details about the background model are in the README.
The vertical red line marks the time of discovery reported to TNS. Other useful metadata from TNS is in the figure title.
Note that the top and bottom panel are in magnitudes, while the middle panel is in differential flux units. The magnitudes are calibrated to the flux in the reference image used for image subtraction. Thus, flux from the host galaxy is included in these magnitudes.
3-sigma upper limits are plotted as triangles with no errorbars. A typical limiting magnitude is 19.6 in 30 minutes or 18.4 in 200 seconds (for low backgrounds).
The links allow you to download the light curve data as a text file.
More details in the README.
2021adzd
 2021acus
 2021afey
 2021adda
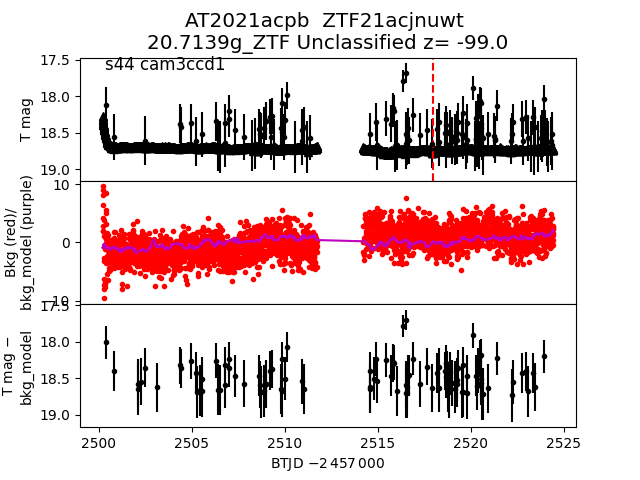
 2021acpb
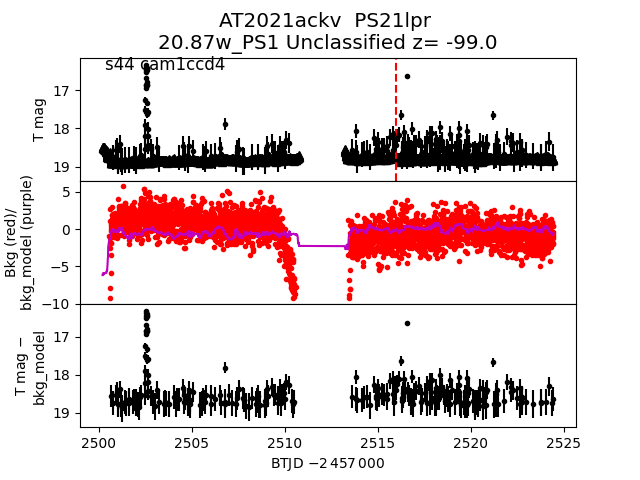
 2021ackv
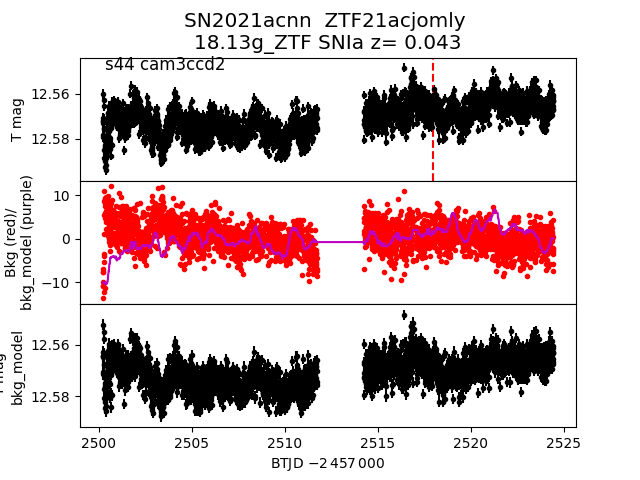
 2021acnn
 2021adyp
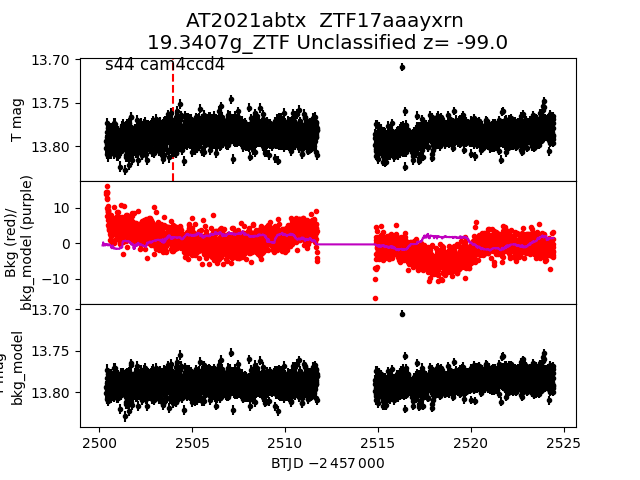
 2021abtx
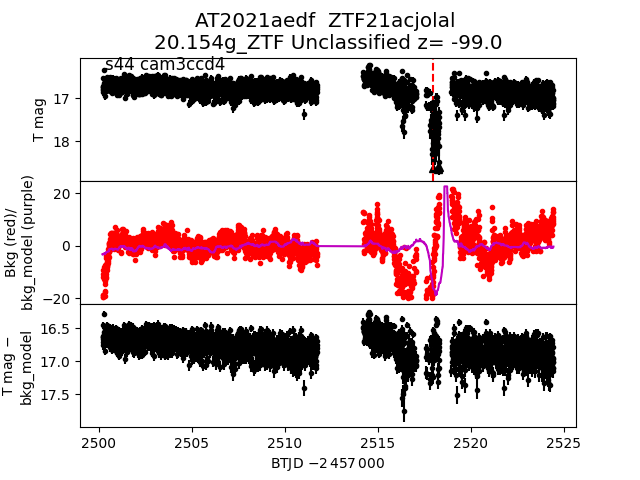
 2021aedf
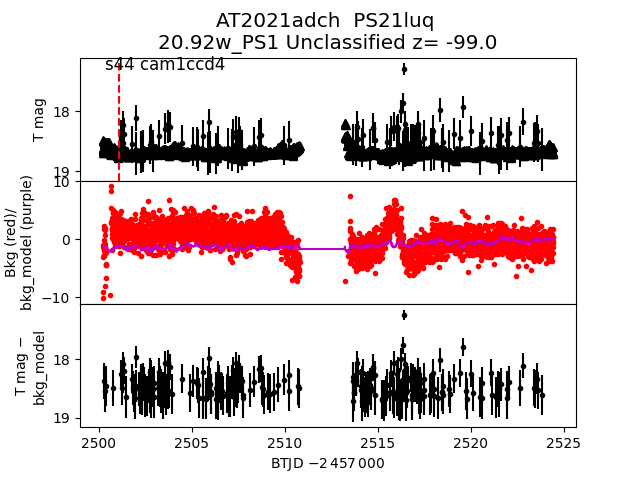
 2021adch
 2021adff
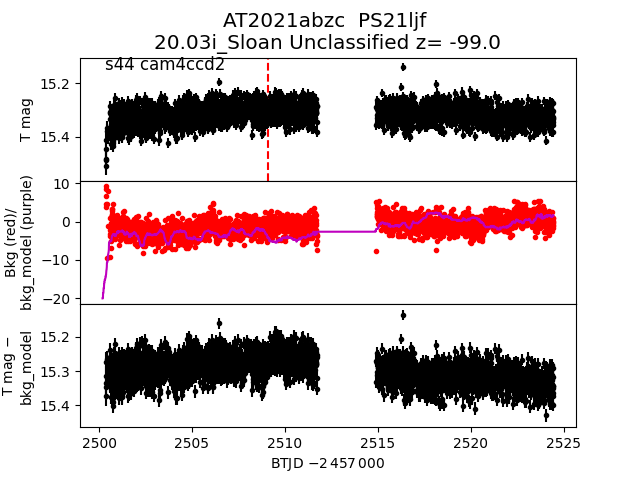
 2021abzc
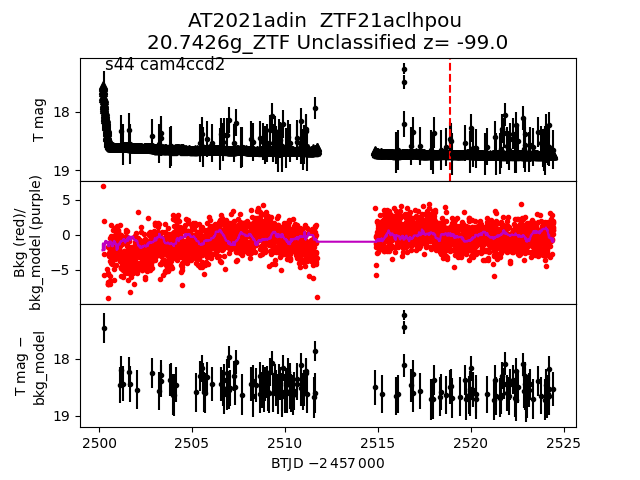
 2021adin
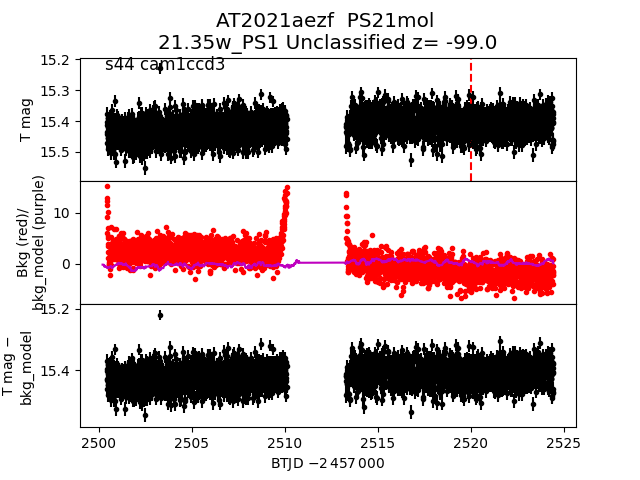
 2021aezf
 2021acyp
 2021acvk
 2021adeh
 2021aeyr
 2021abyh
 2021acpd
 2021acwd
 2021adjy
 2021abno
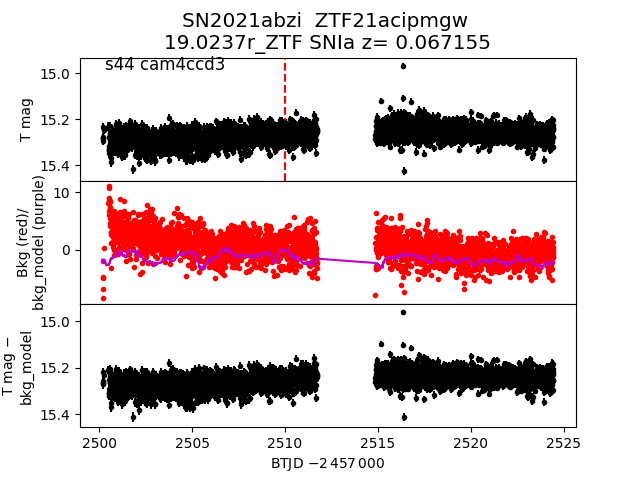
 2021abzi
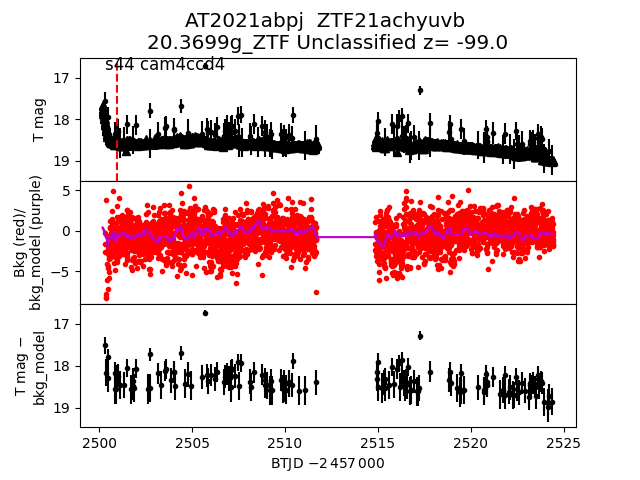
 2021abpj
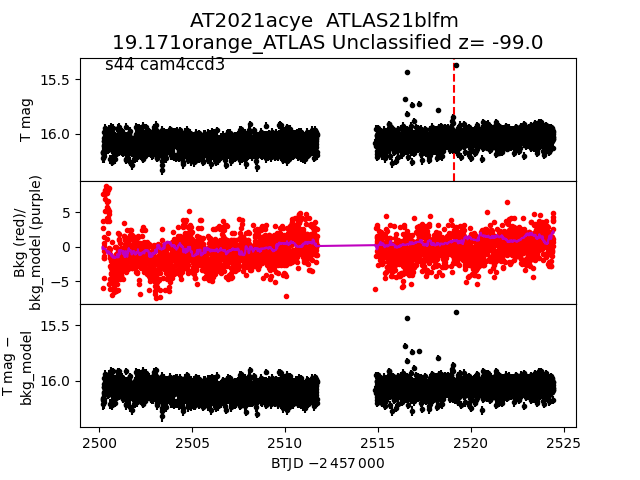
 2021acye
 2021abip
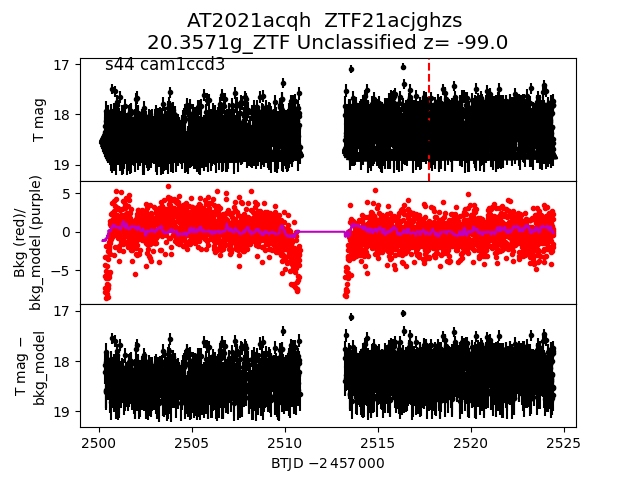
 2021acqh
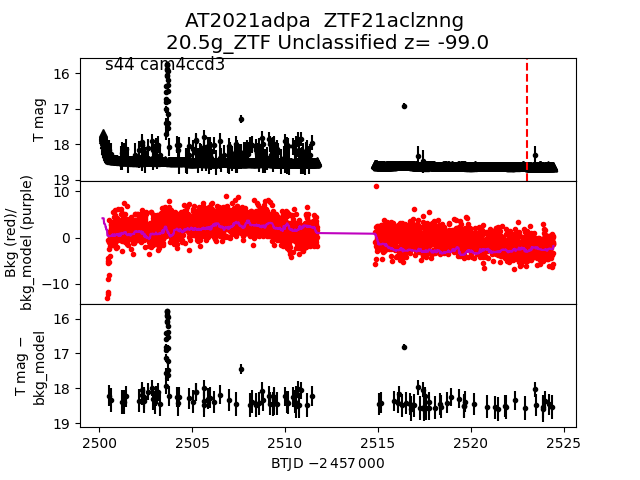
 2021adpa
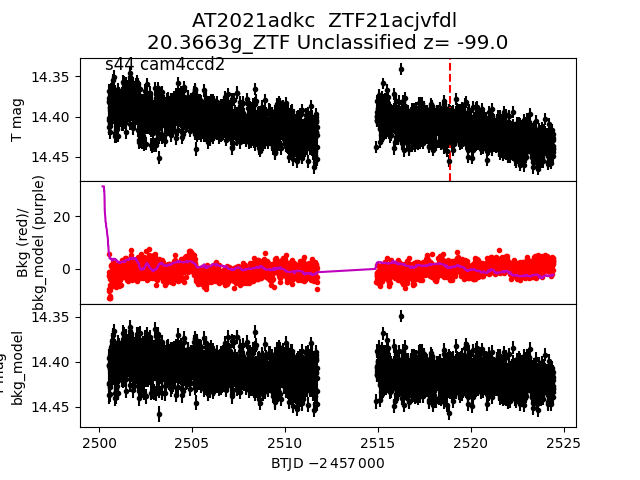
 2021adkc
 2021abkh
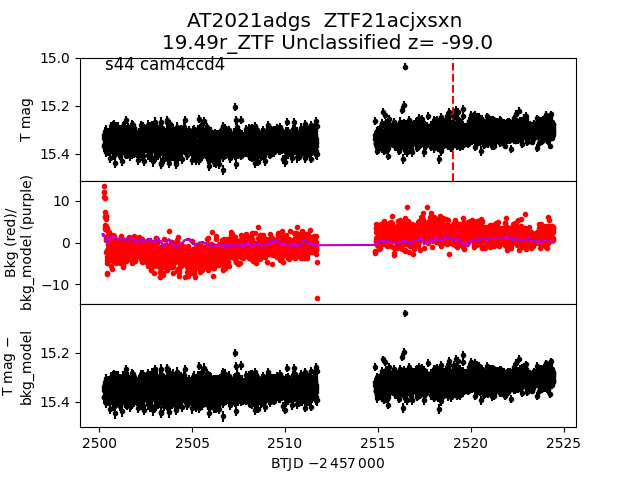
 2021adgs
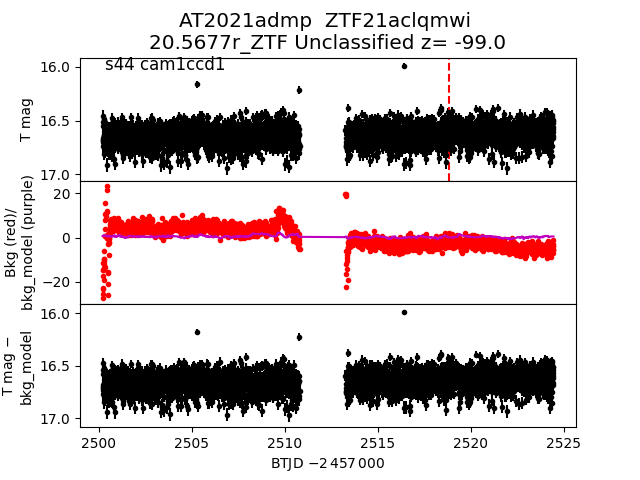
 2021admp
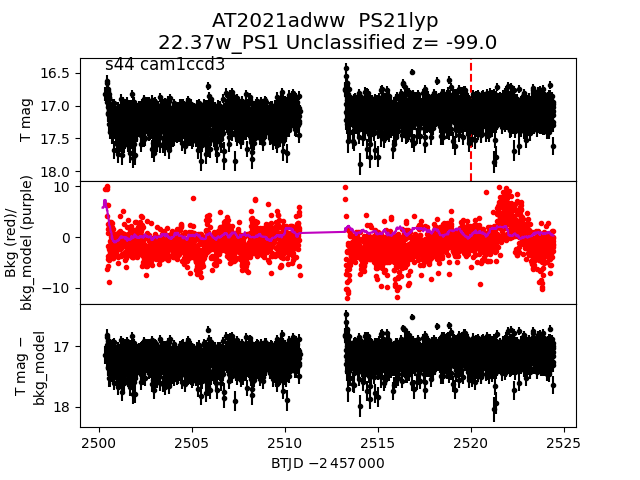
 2021adww
 2021aboj
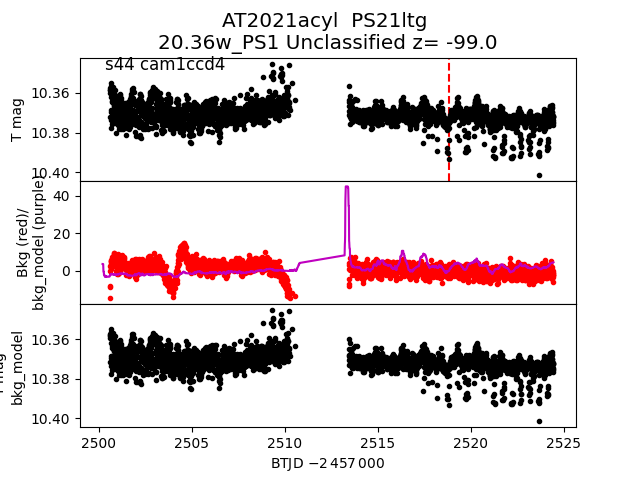
 2021acyl
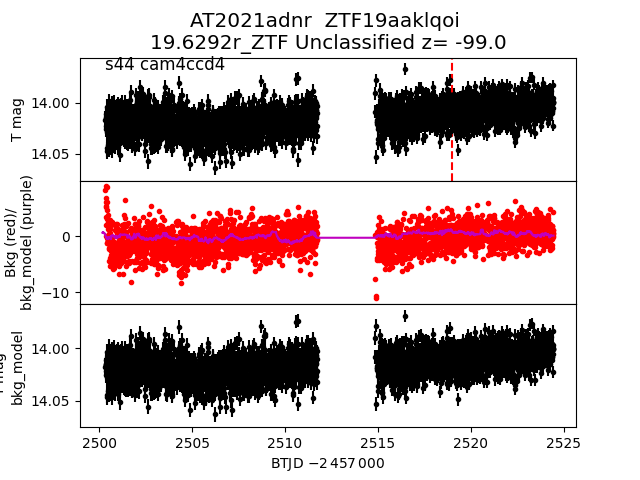
 2021adnr
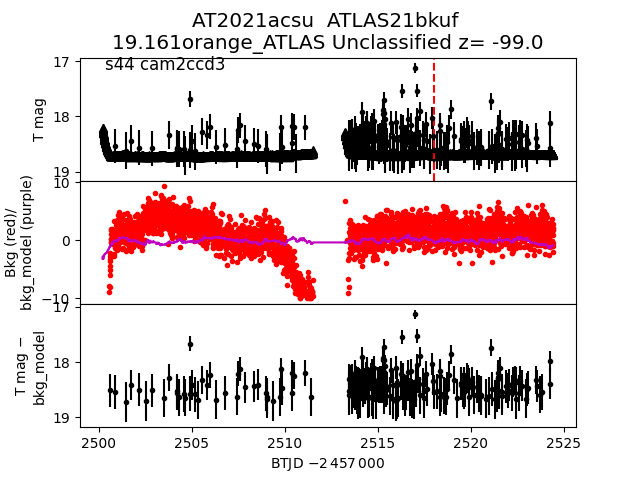
 2021acsu
 2021addk
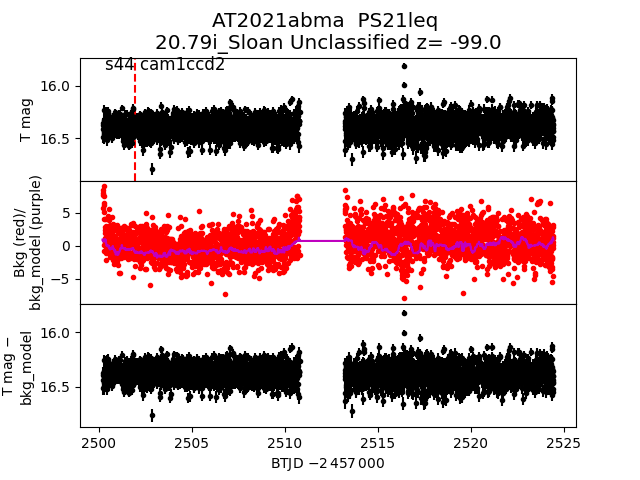
 2021abma
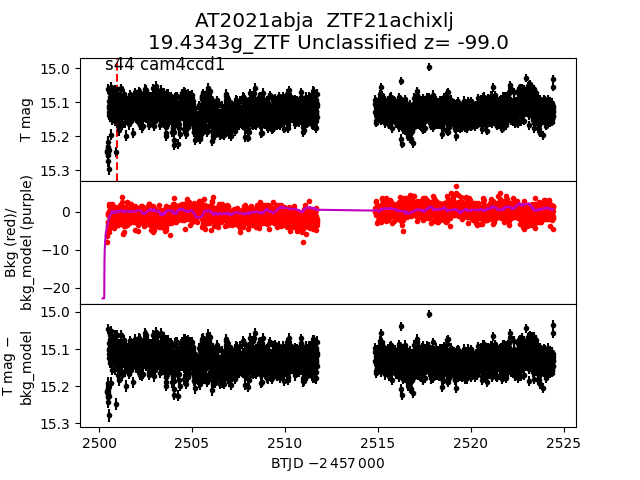
 2021abja
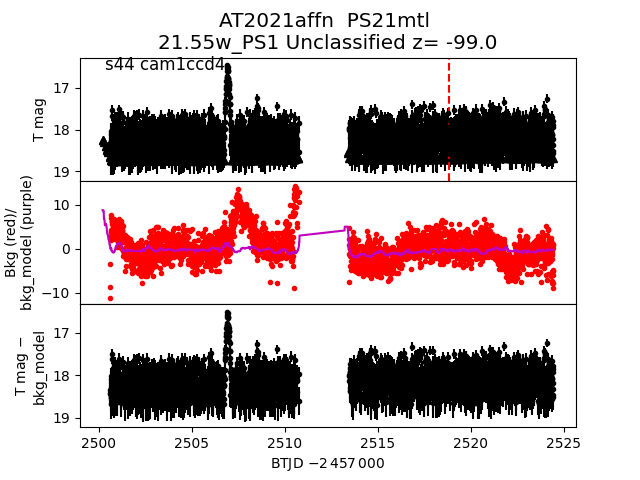
 2021affn
 2021aboy
 2021abxb
 2021adfs
 2021aela
 2021acet
 2021aejr
 2021actc
 2021adfk
 2021acyx
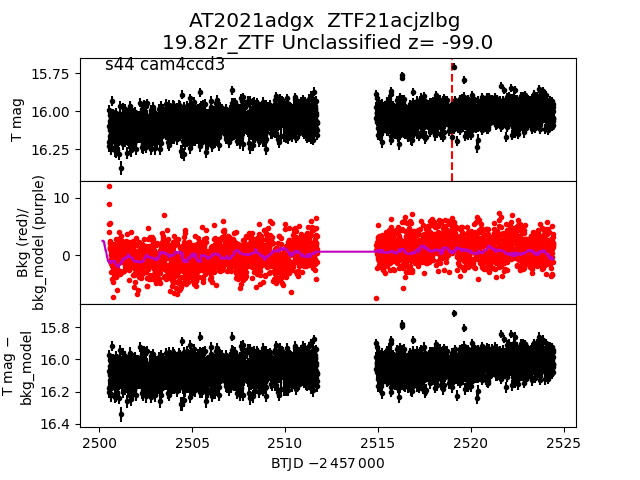
 2021adgx
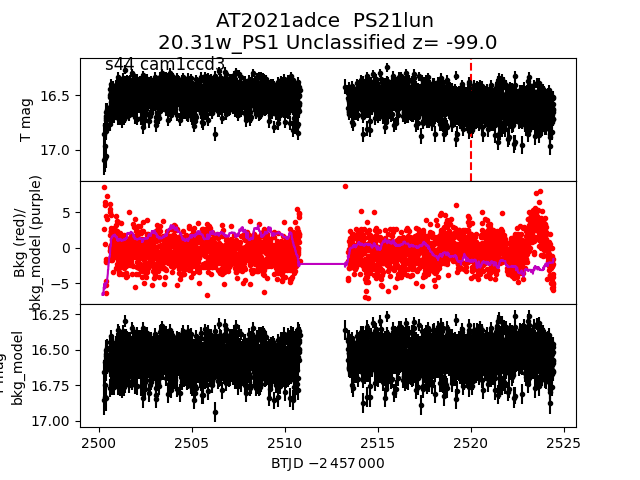
 2021adce
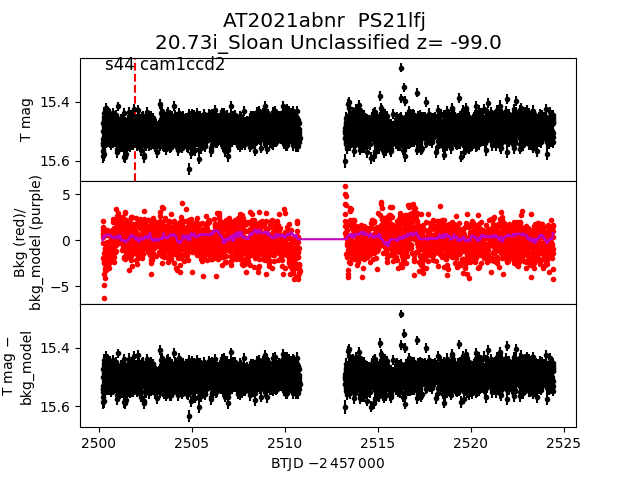
 2021abnr
 2021adei
 2021actd
 2021adsh
 2021aeyz
 2021adka
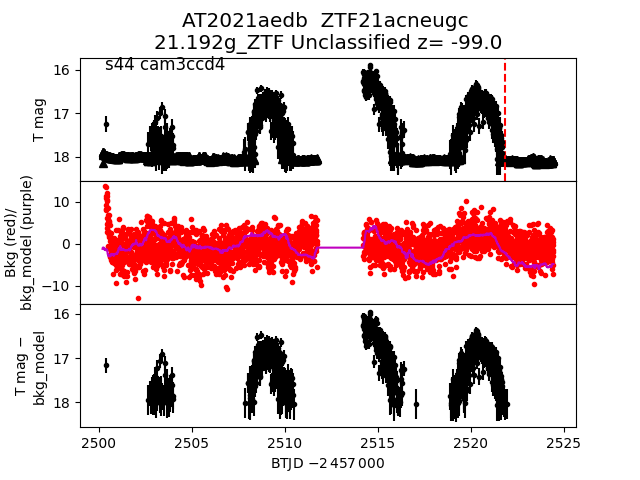
 2021aedb
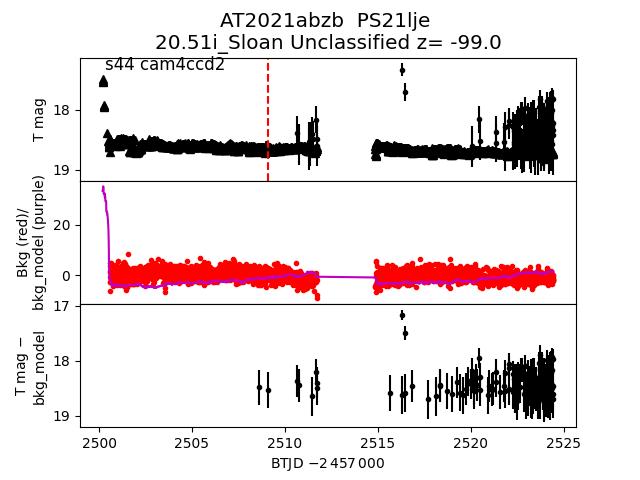
 2021abzb
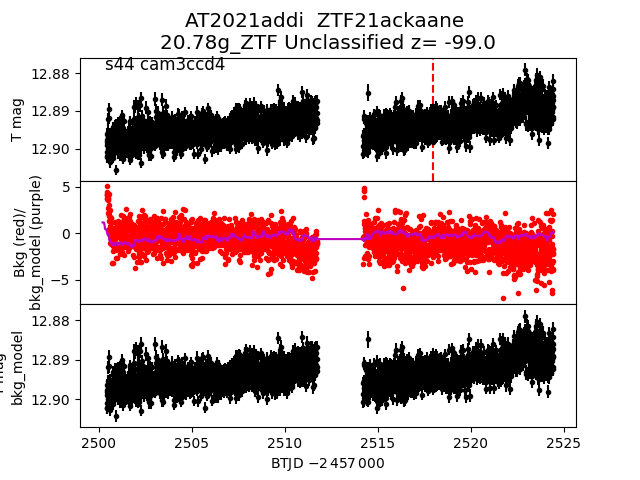
 2021addi
 2021adgt
 2021affs
 2021adag
 2021abyl
 2021acpc
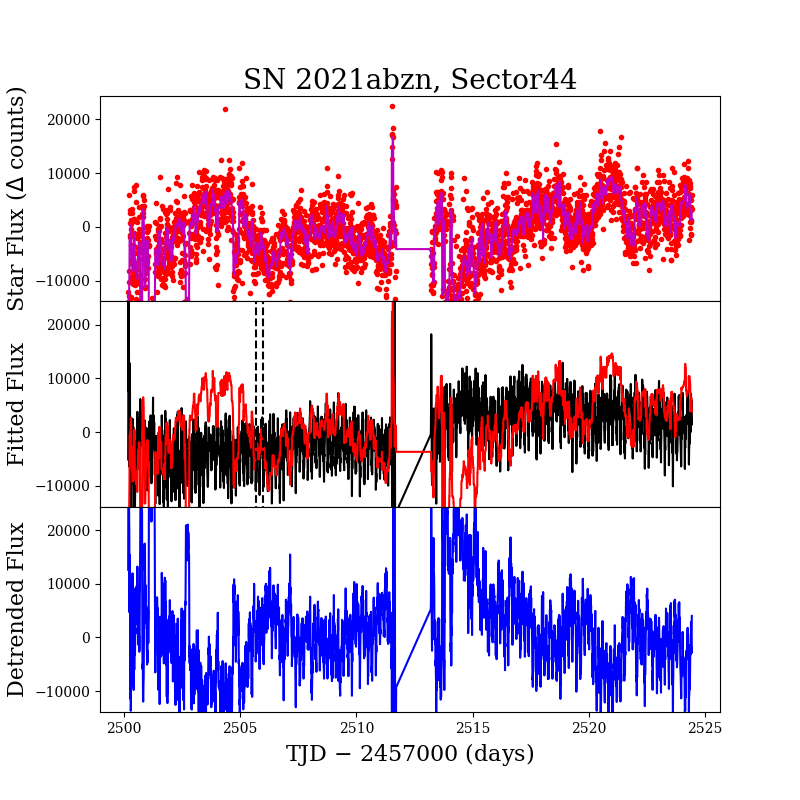
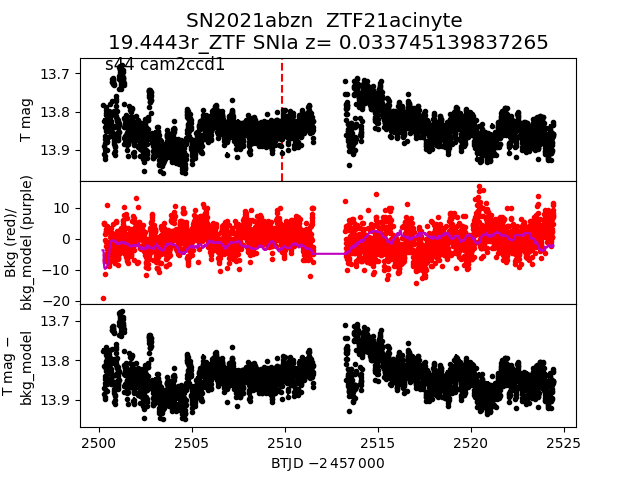
 2021abzn
 2021acwc
 2021affz
 2021abzn
 2021abiw
 2021adel
 2021abwn
 2021acfh
 2021acah
 2021abpq
 2021abff
 2021afdw
 2021abzn_detrended
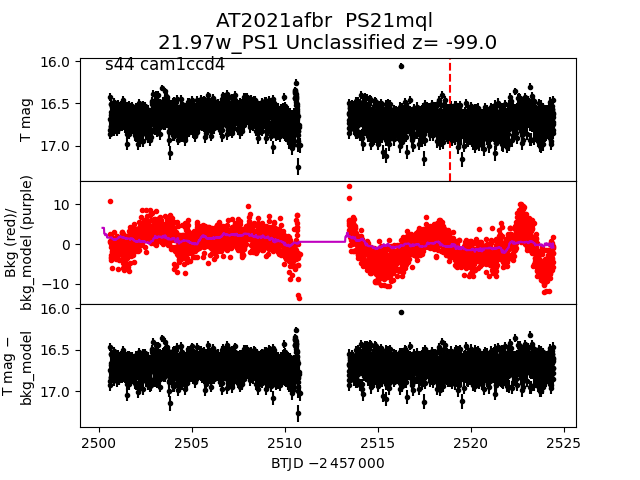
 2021afbr
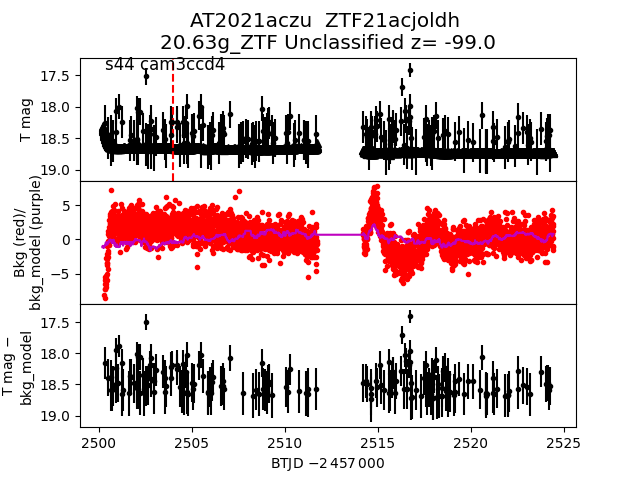
 2021aczu
 2021adbf
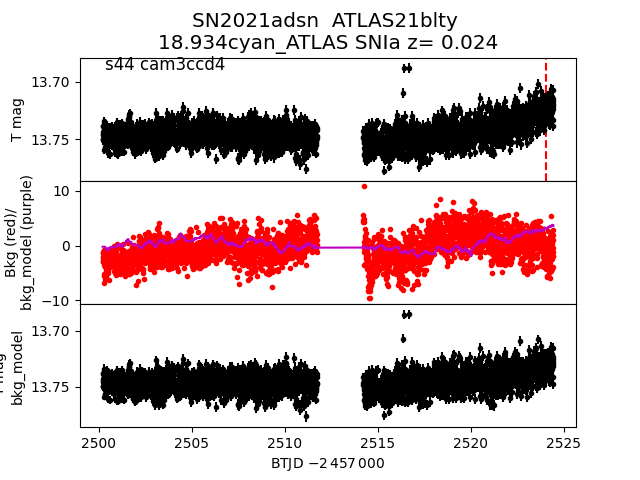
 2021adsn
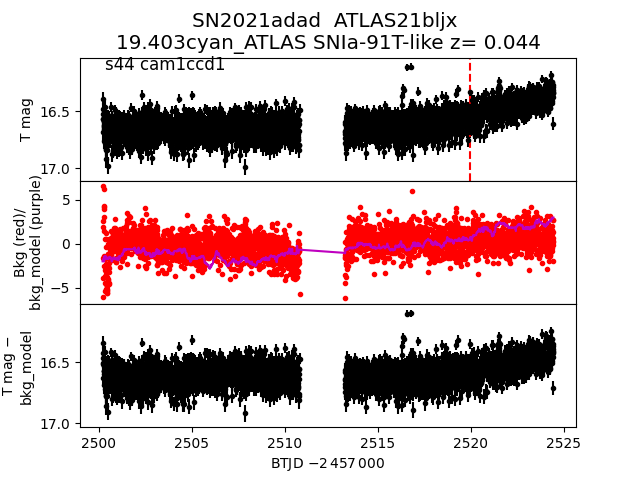
 2021adad
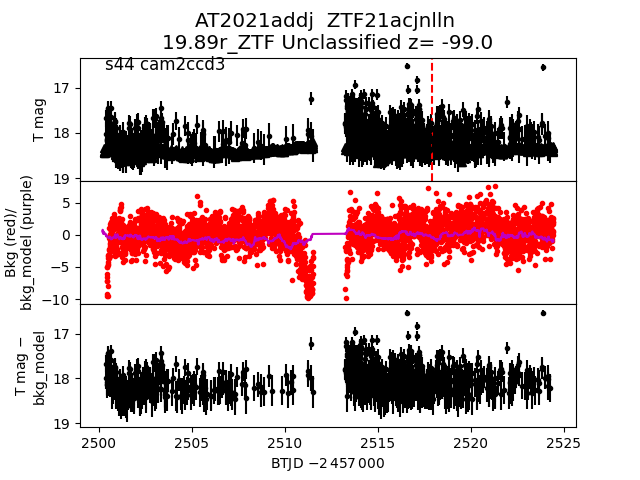
 2021addj
 2021adym
 2021abyf
 2021adrg
 2021adns
 2021adco
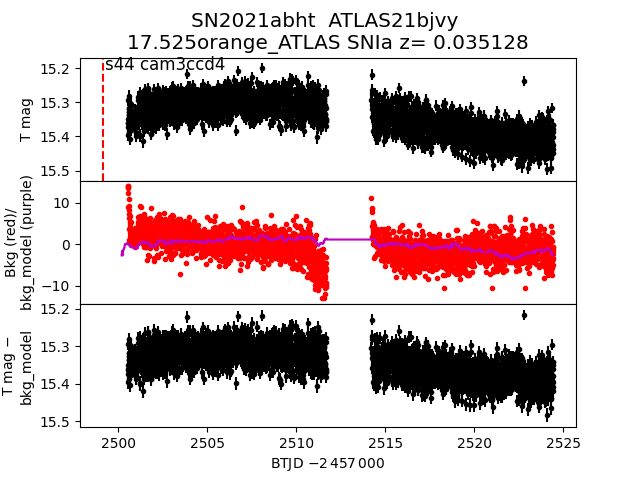
 2021abht
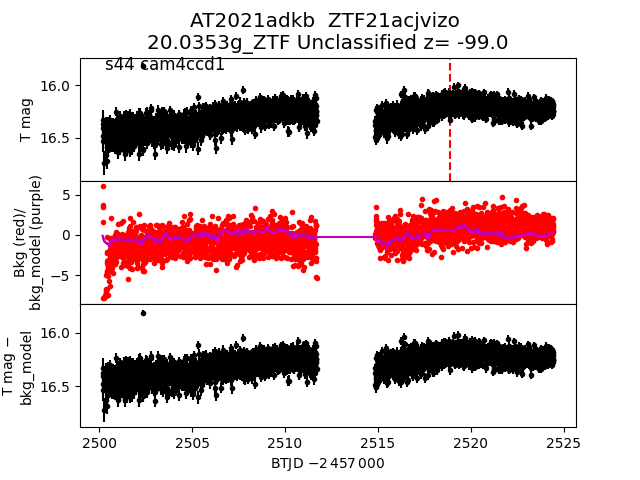
 2021adkb
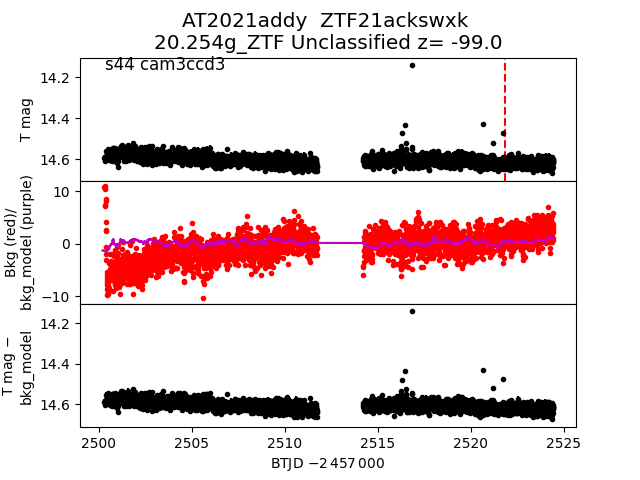
 2021addy
 2021abxf
 2021acqi
 2021abiq
 2021abpk
 2021adnz
 2021abml
 2021advl
 2021adcf
 2021abti
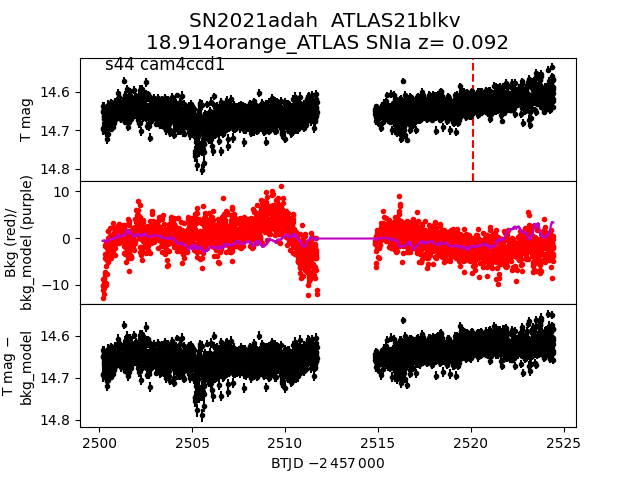
 2021adah
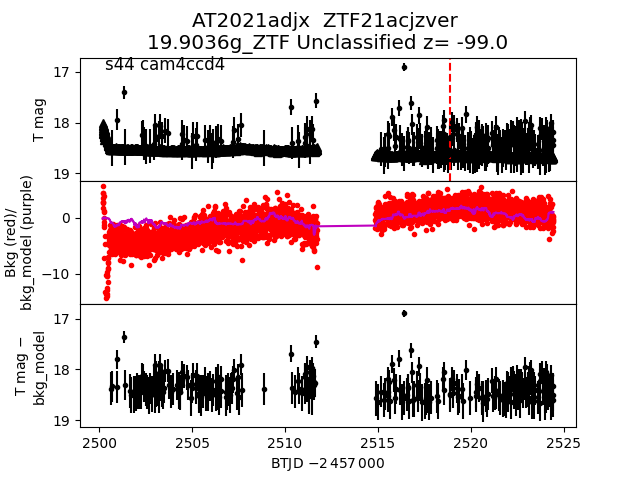
 2021adjx
 2021aecw