all transients in sector43 (121 total)
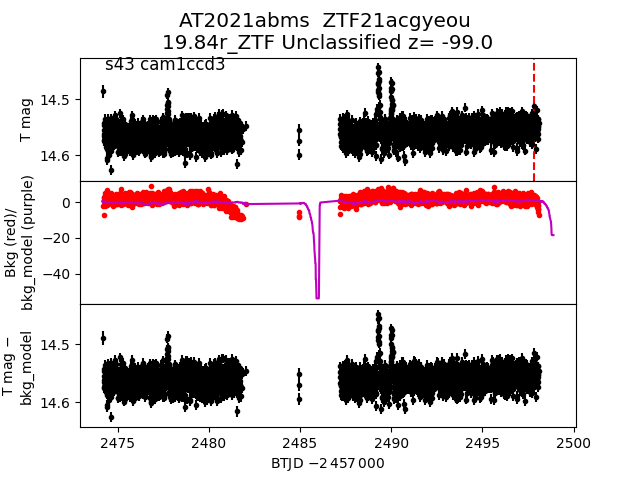
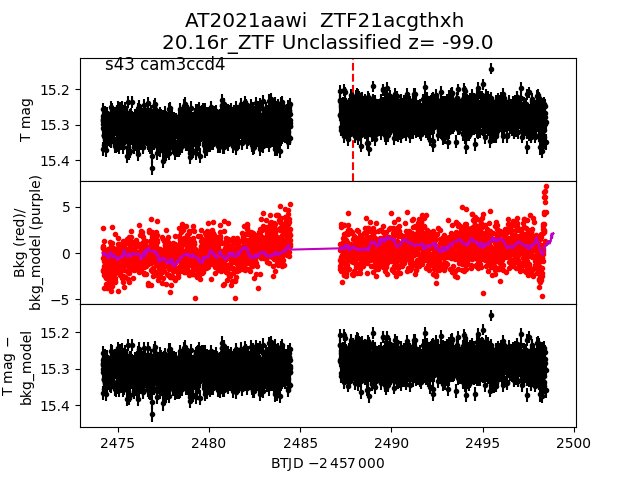
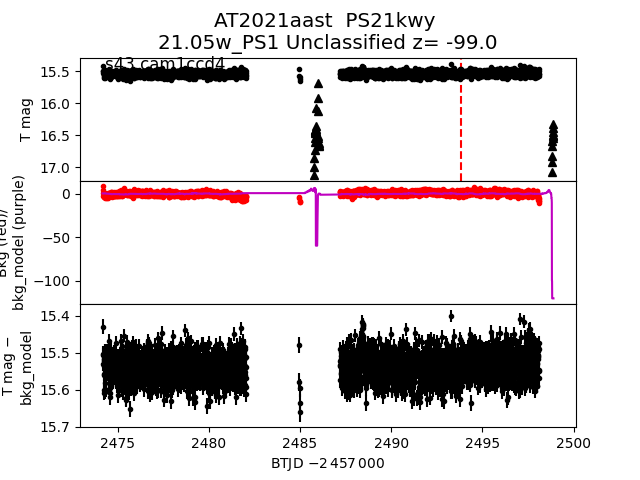
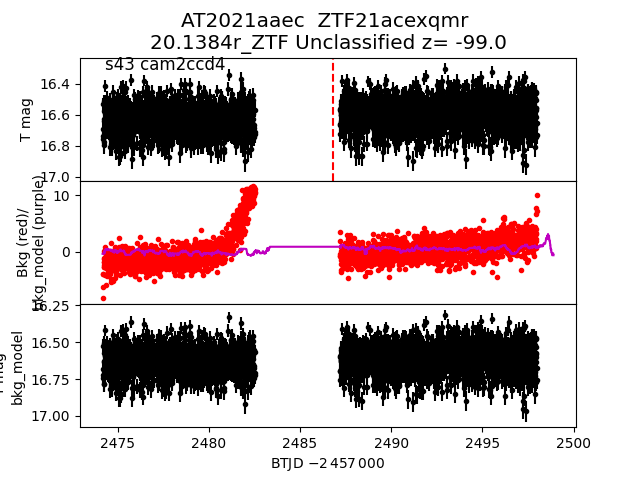
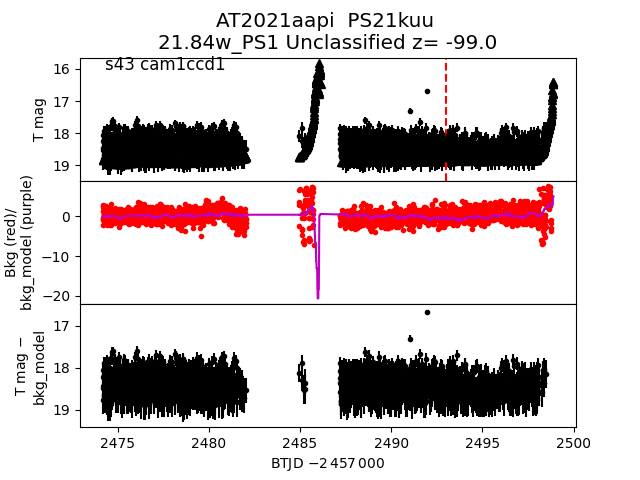
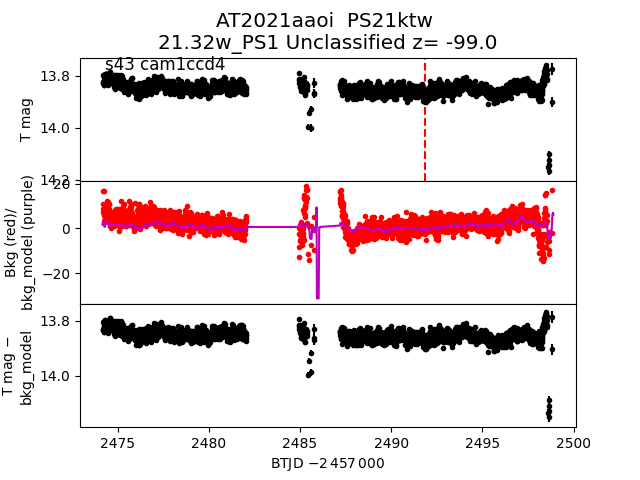
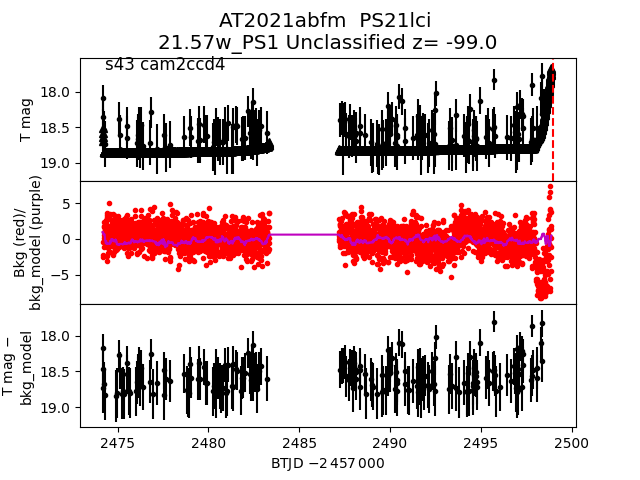
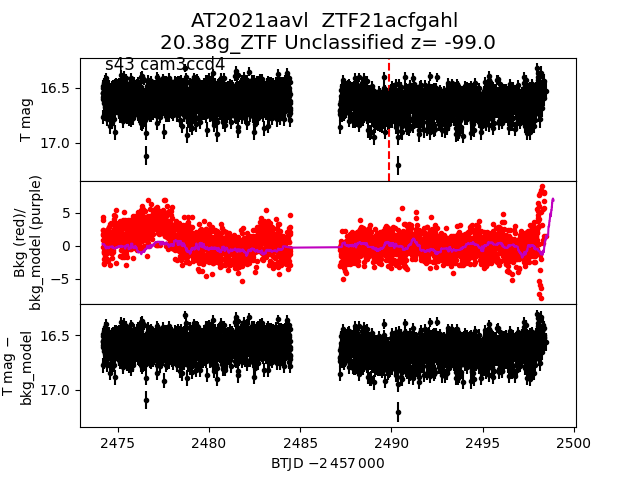
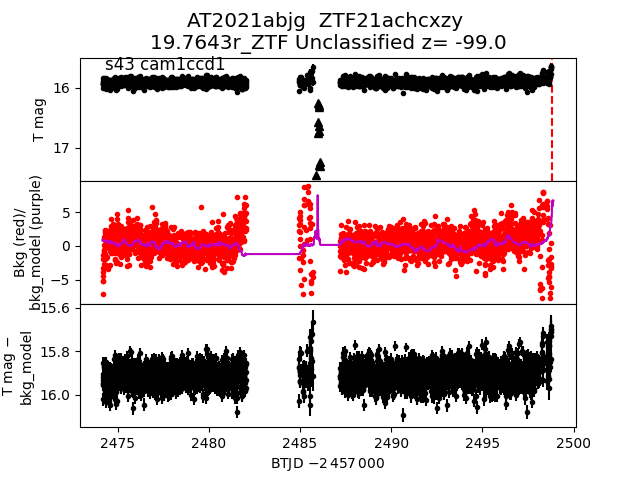
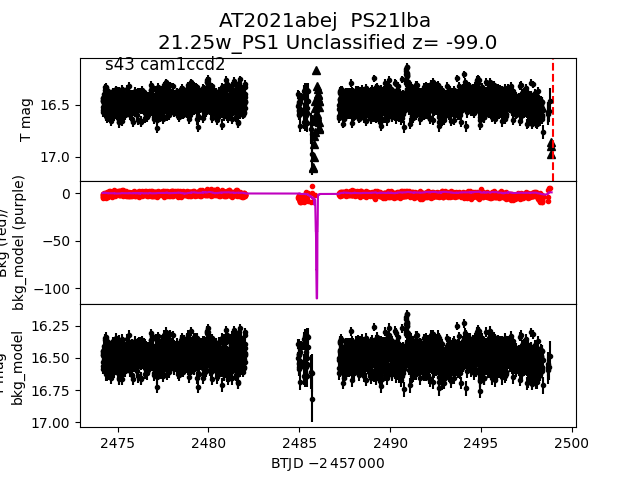
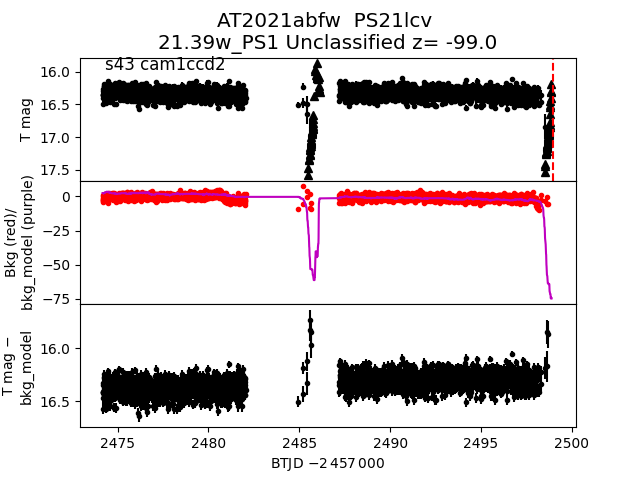
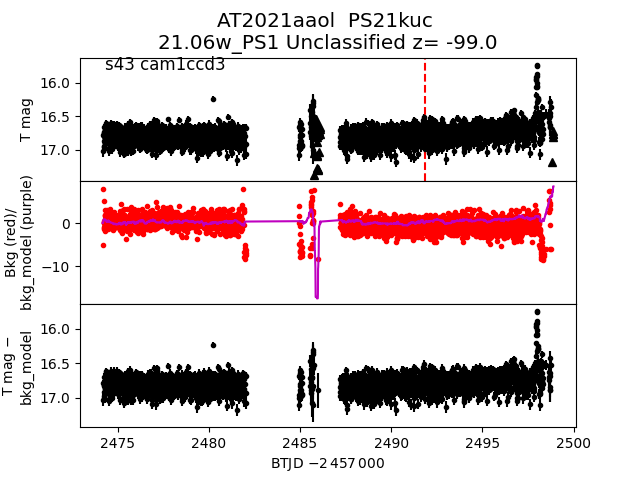
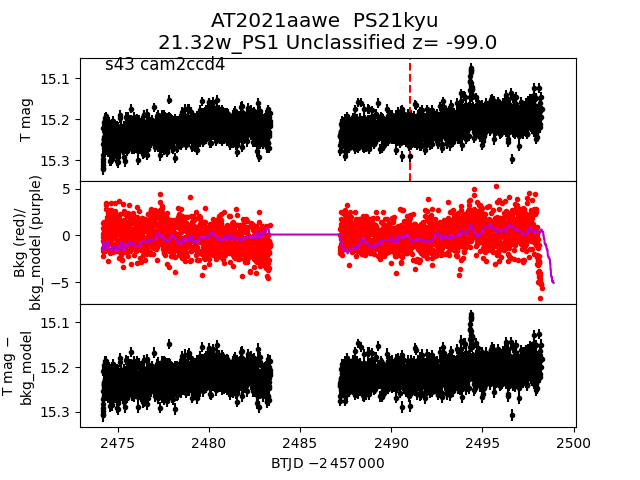
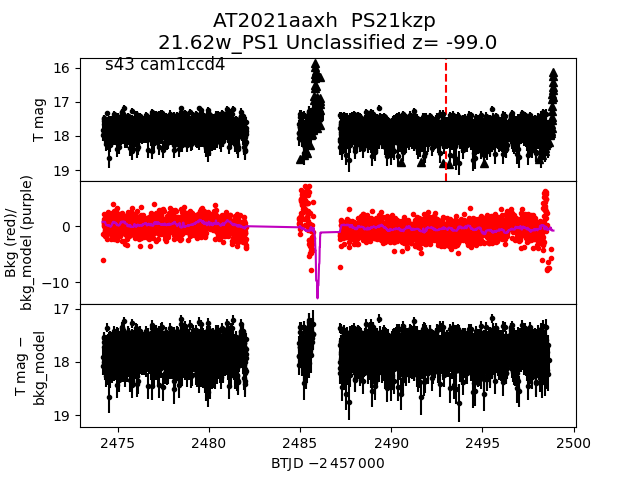
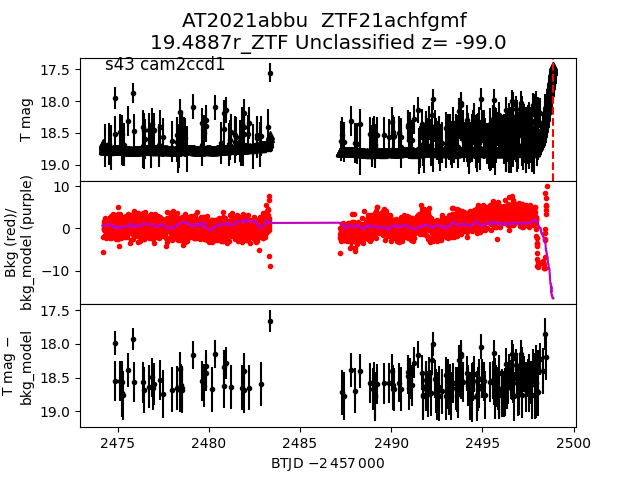
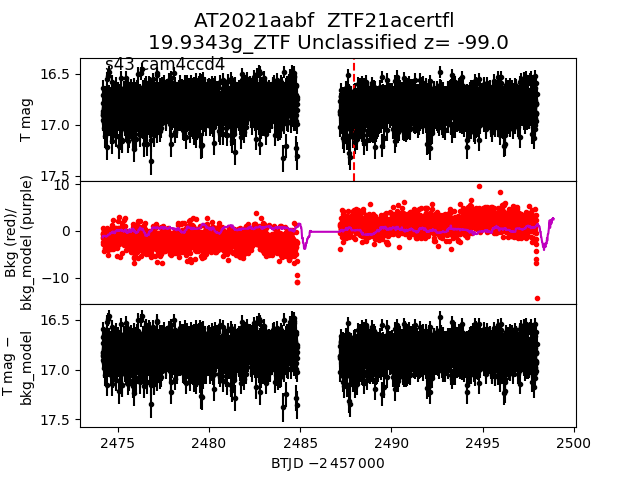
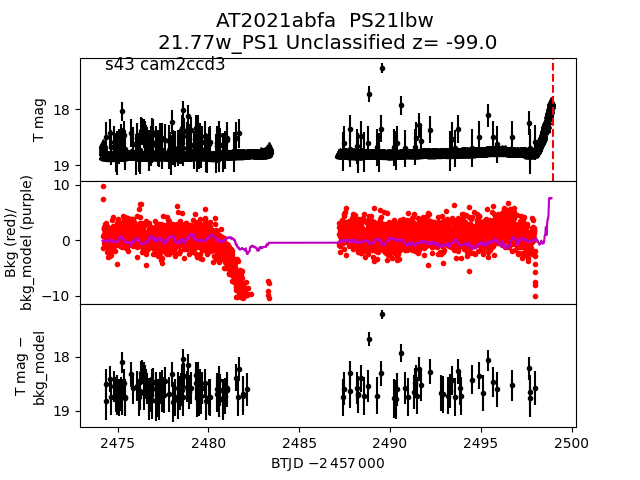
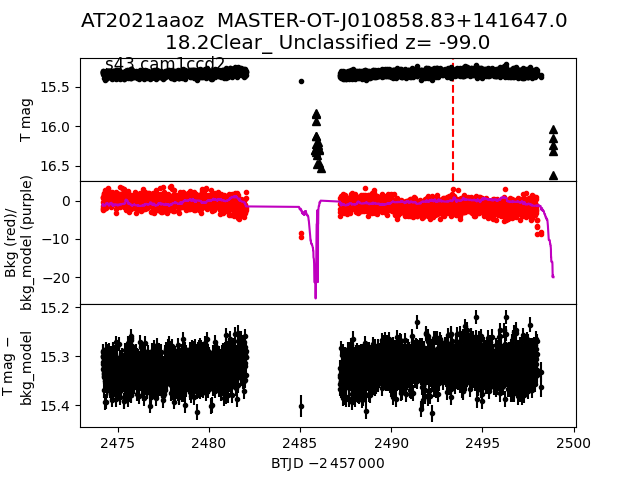
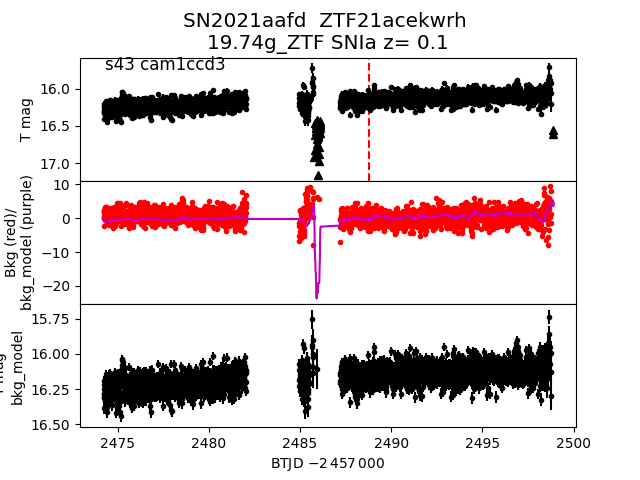
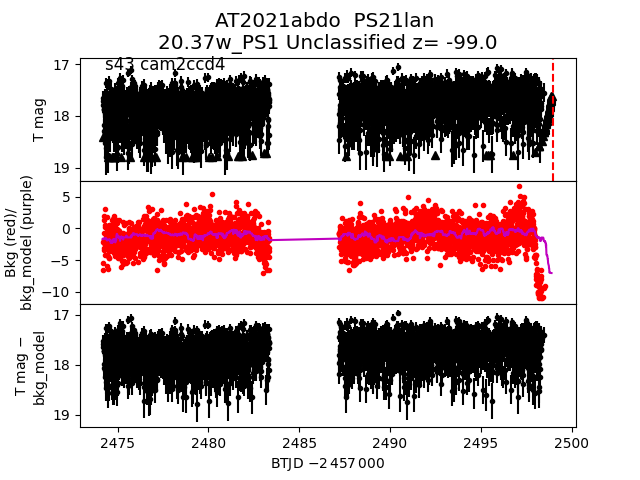
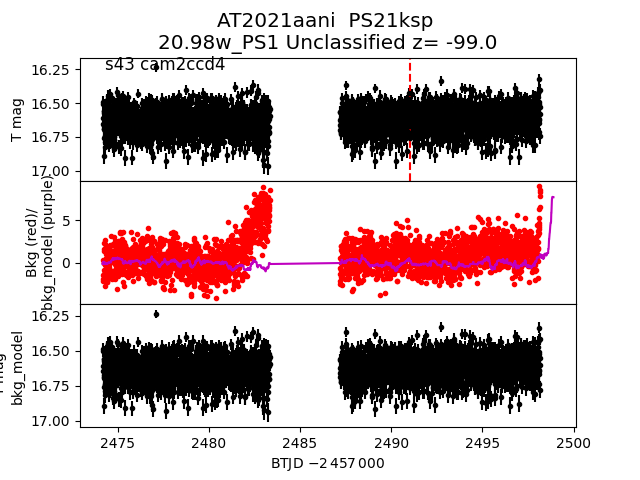
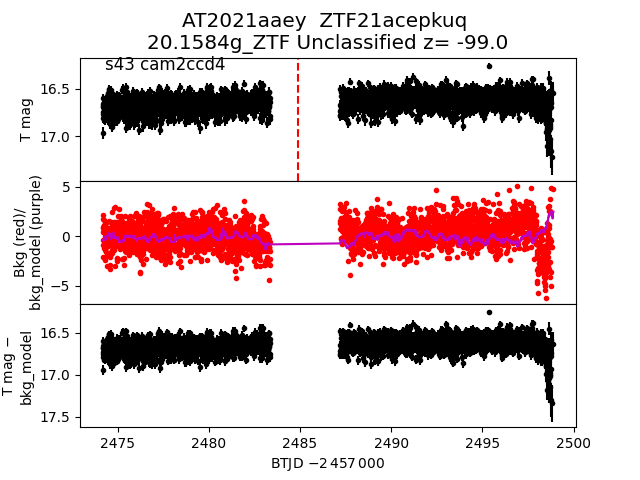
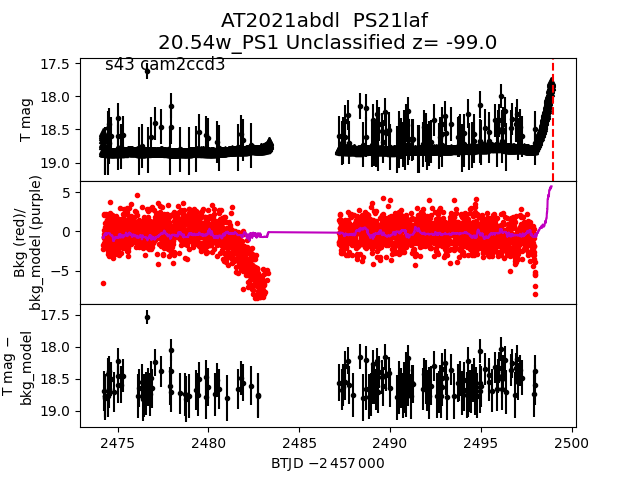
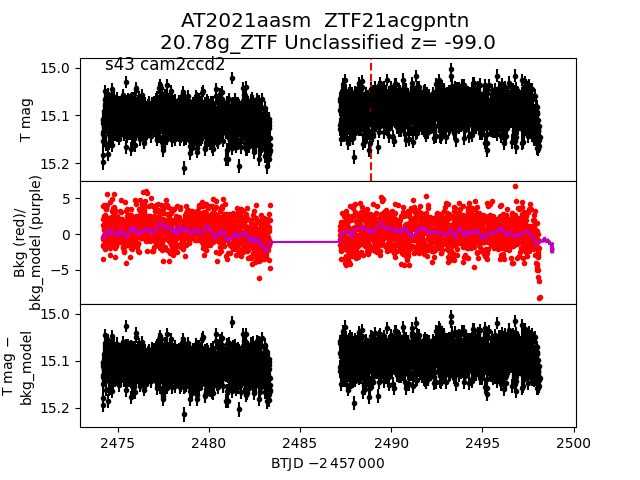
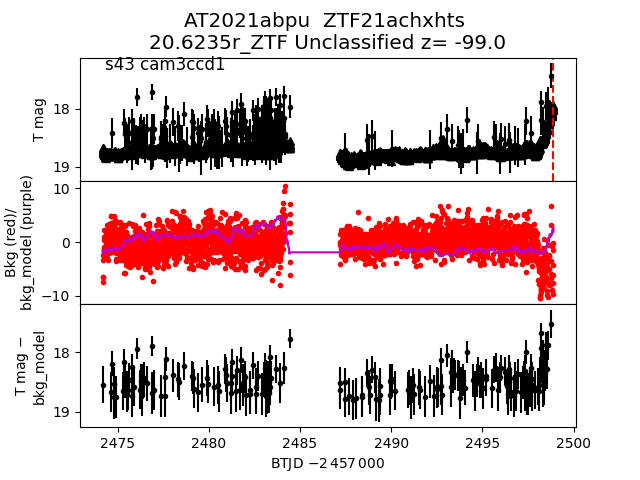
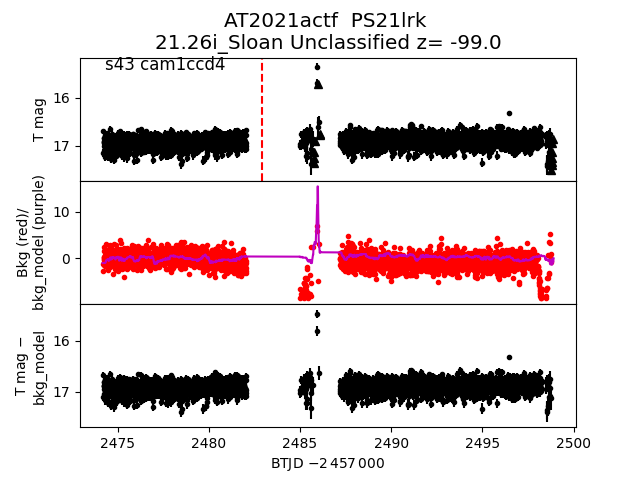
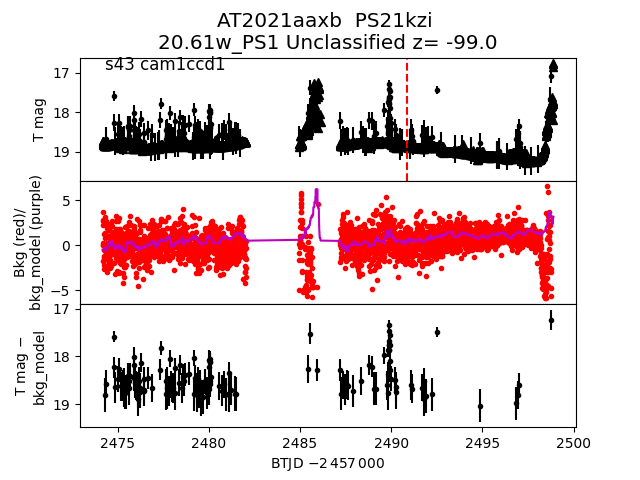
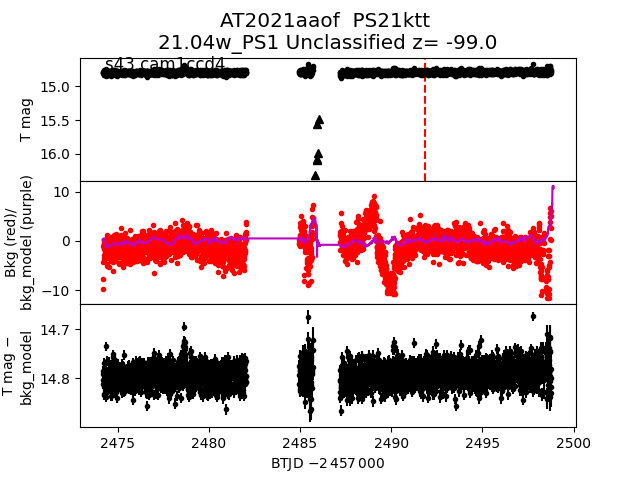
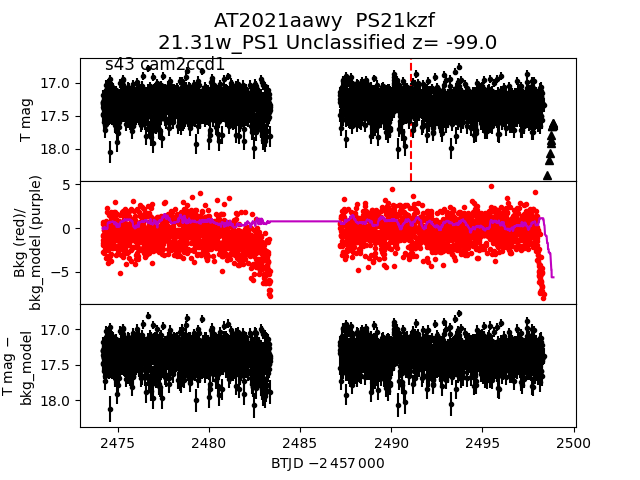
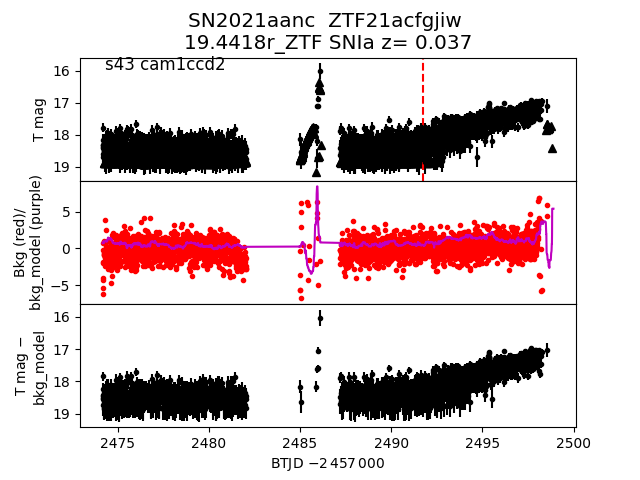
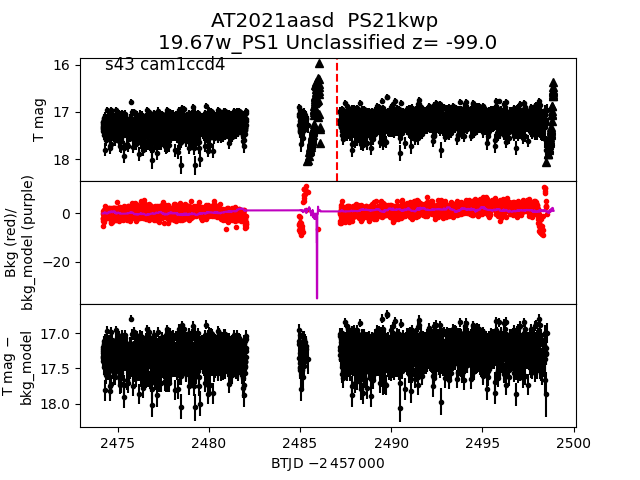
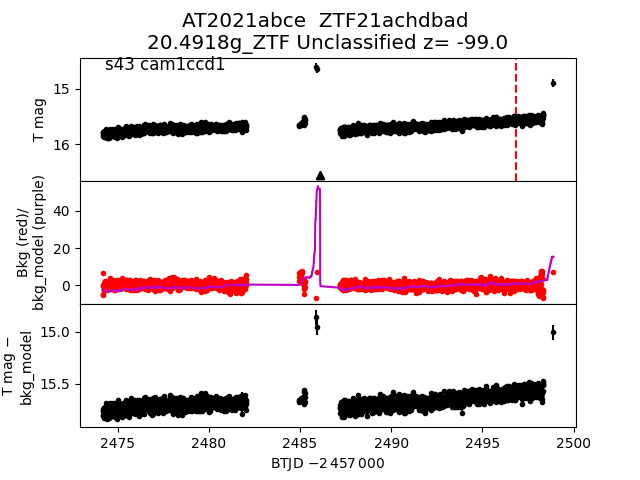
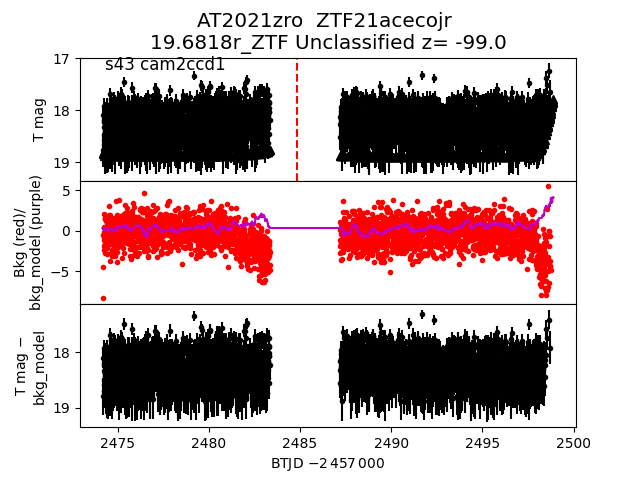
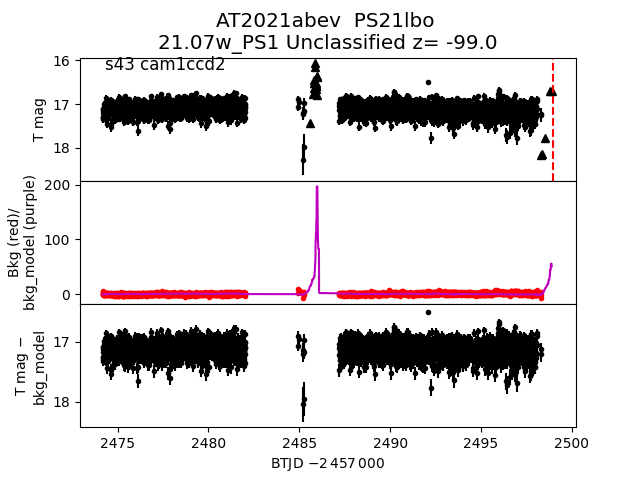
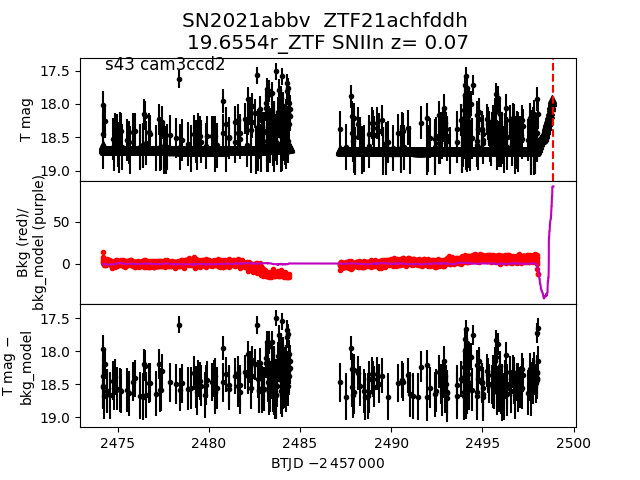
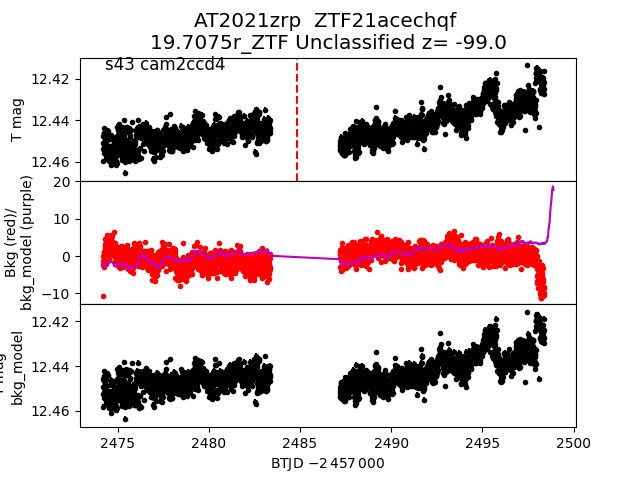
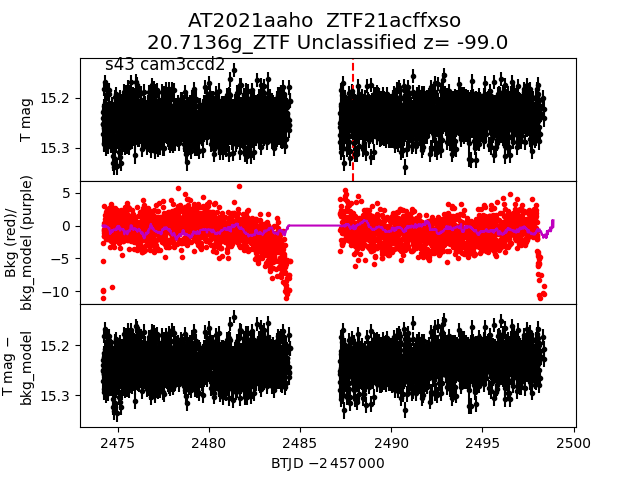
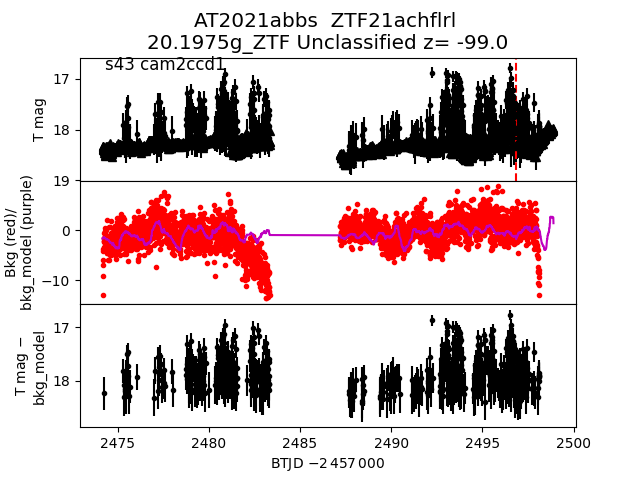
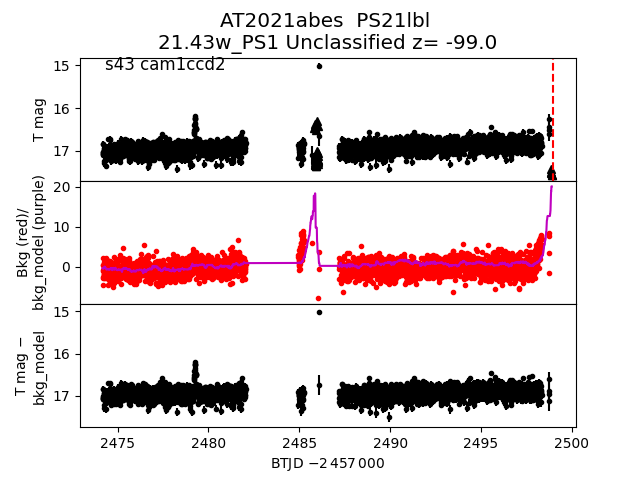
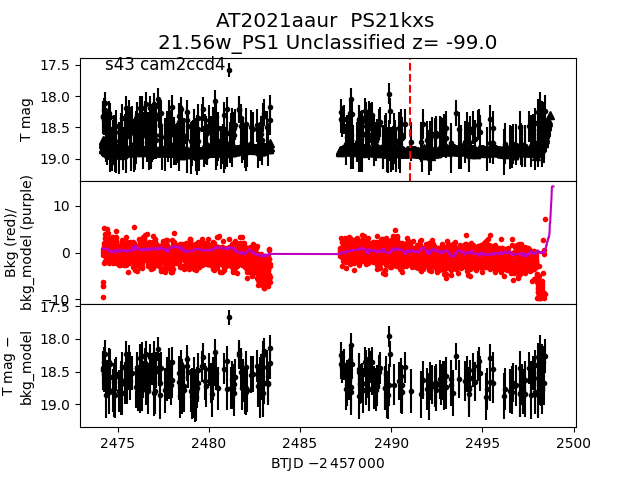
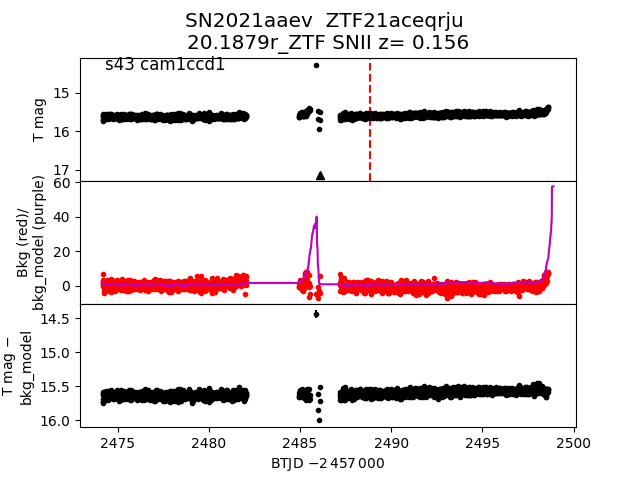
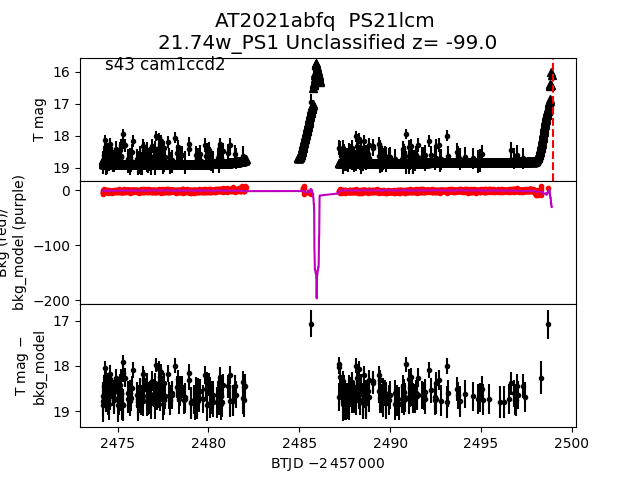
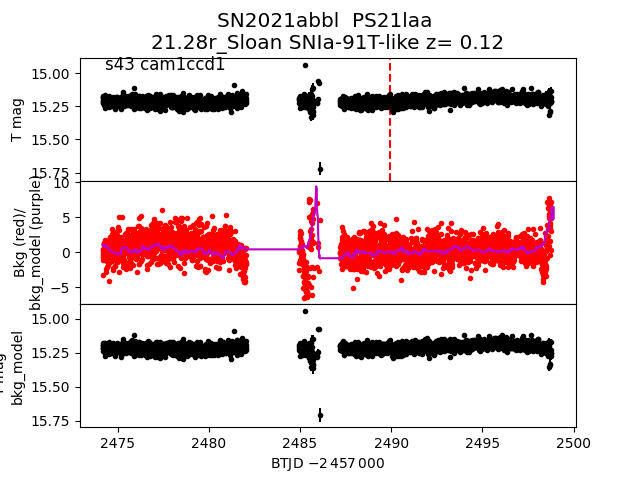
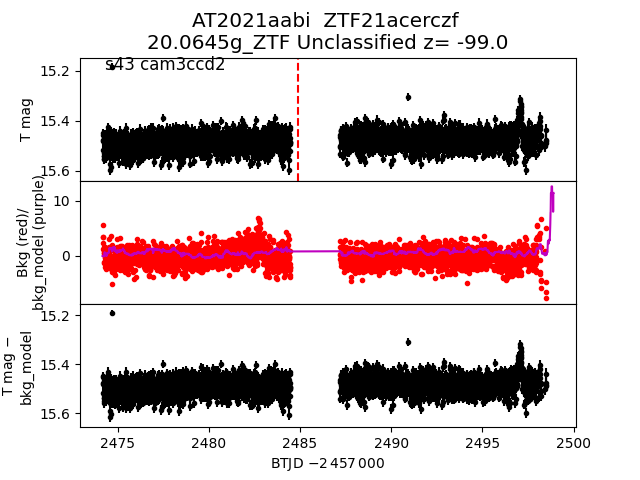
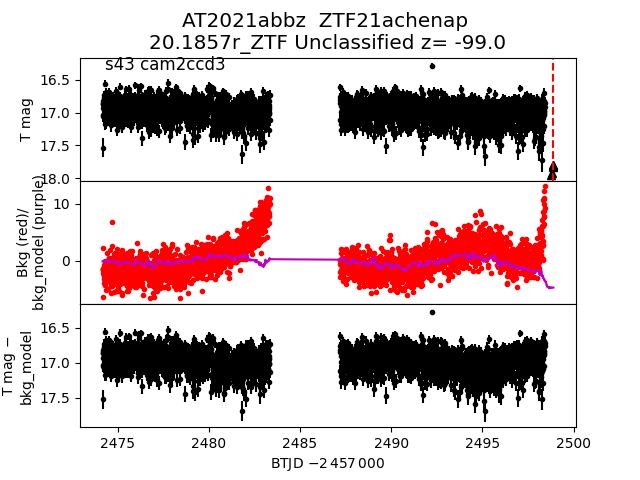
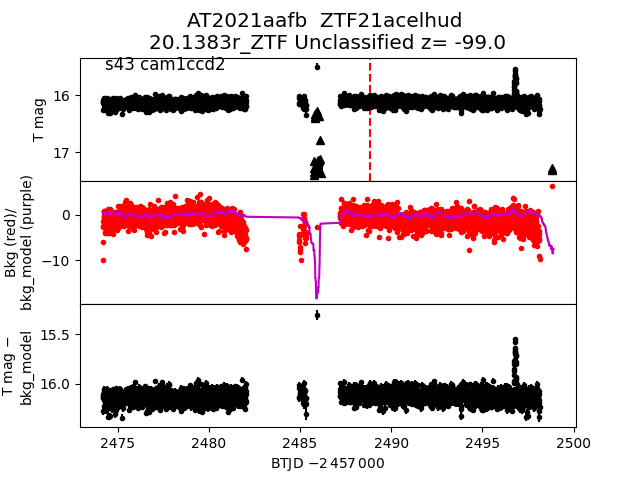
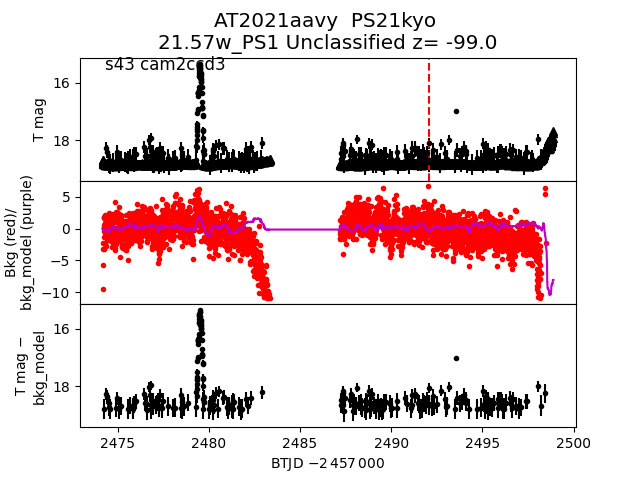
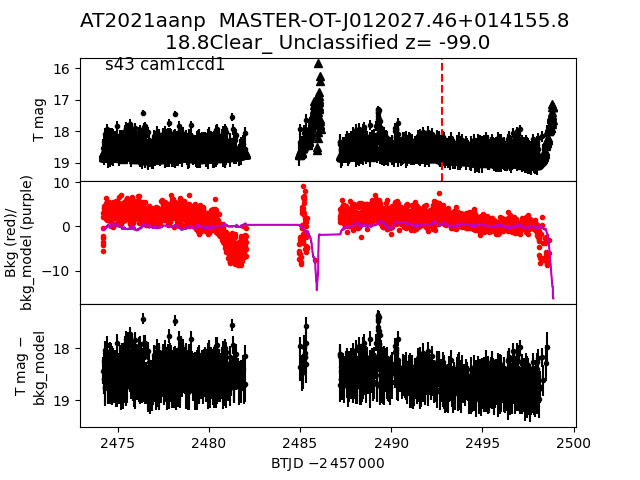
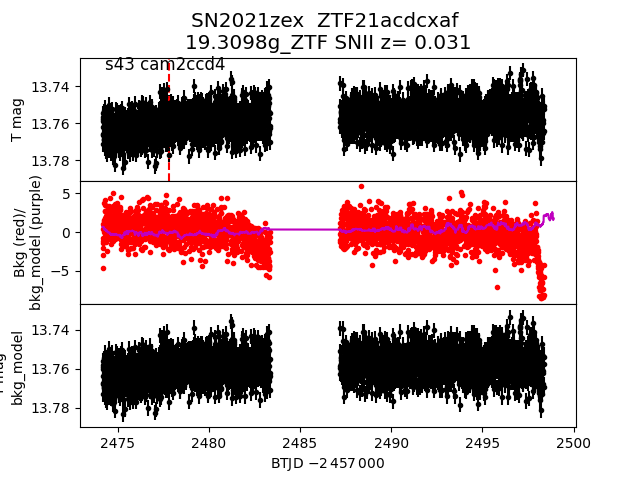
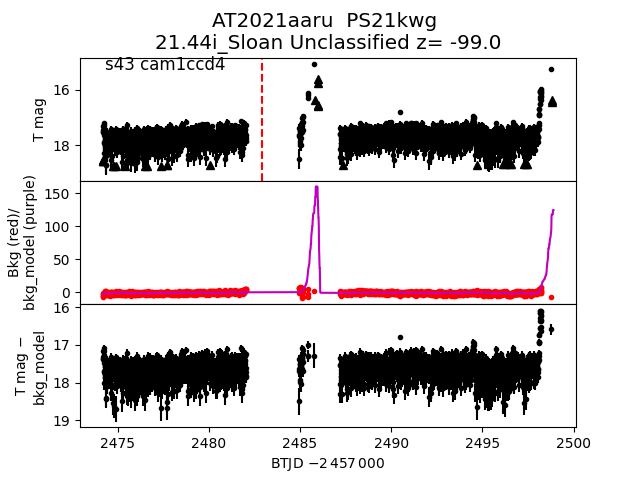
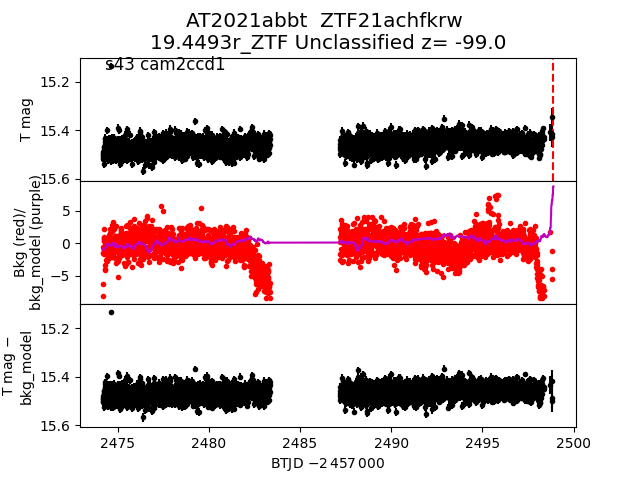
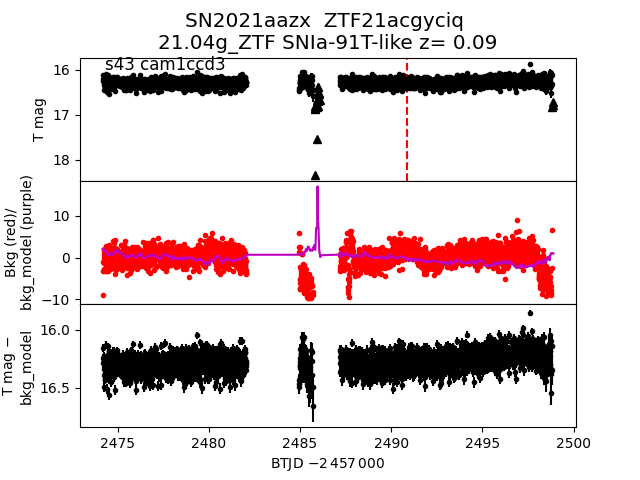
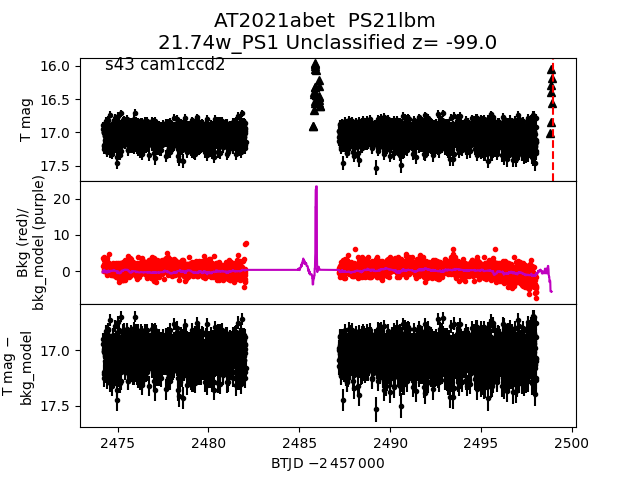
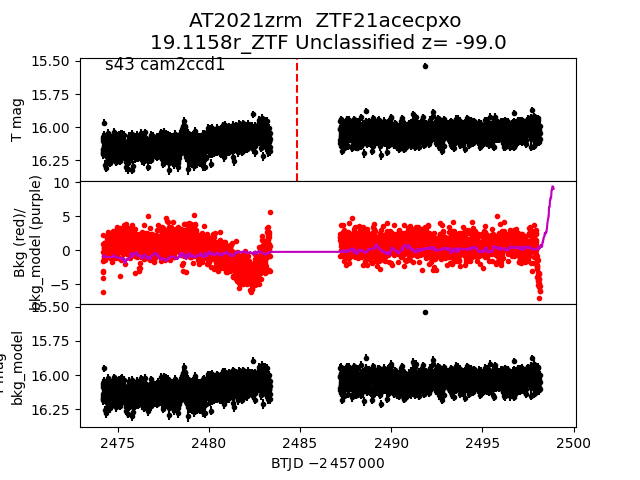
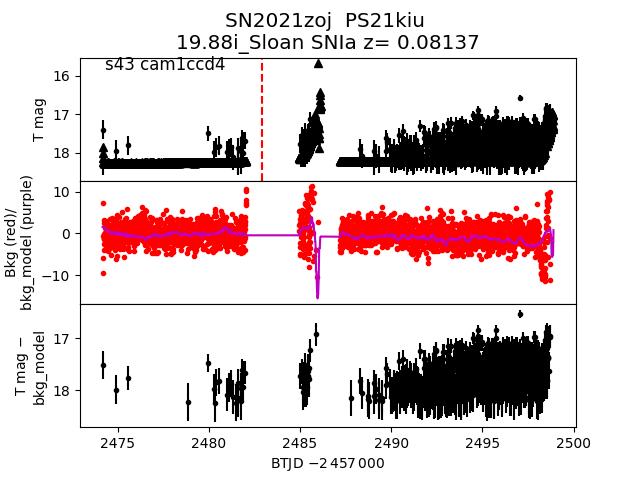
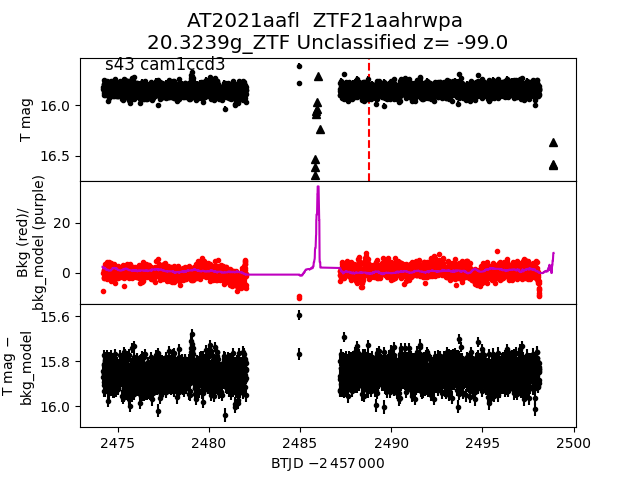
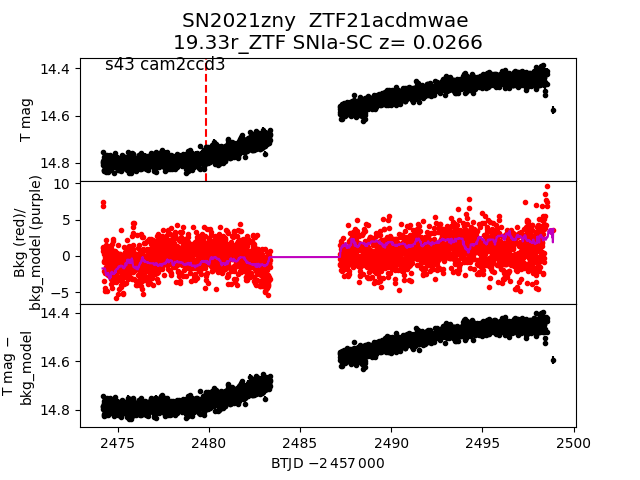
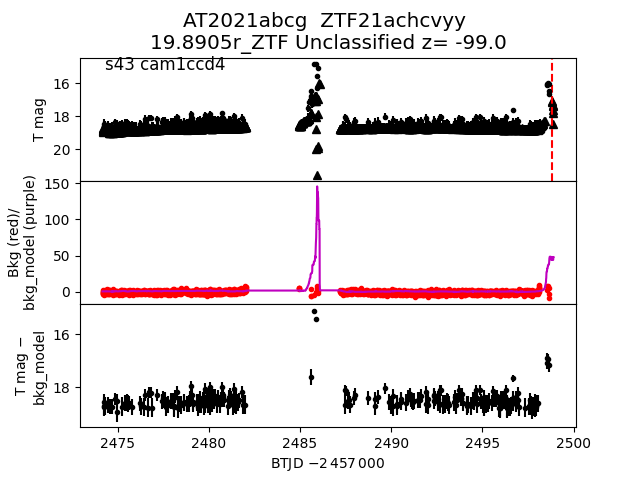
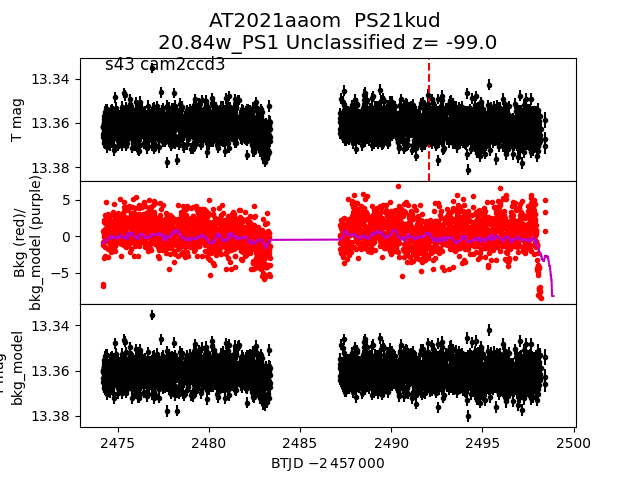
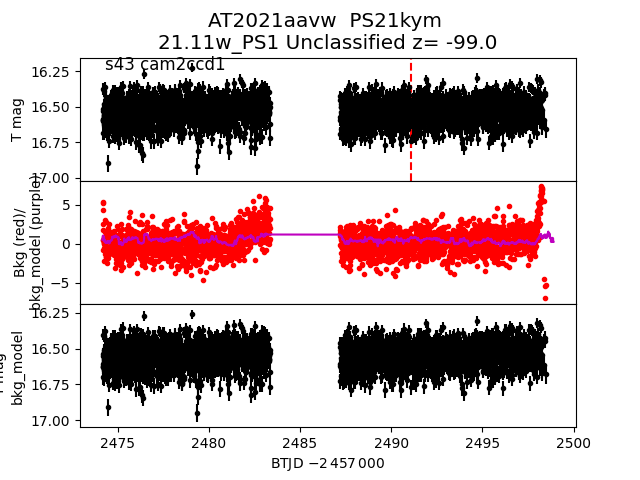
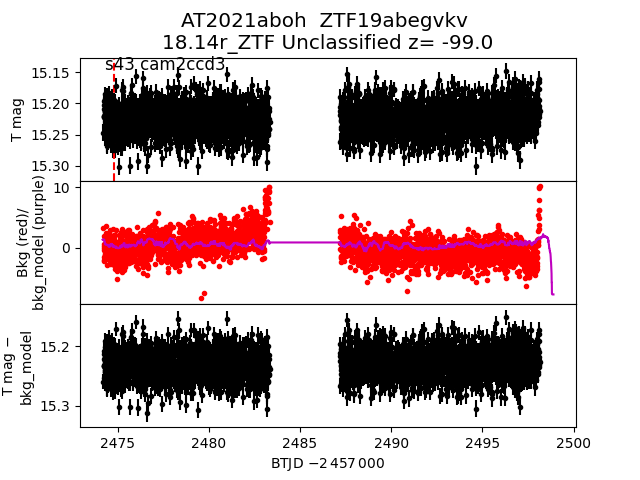
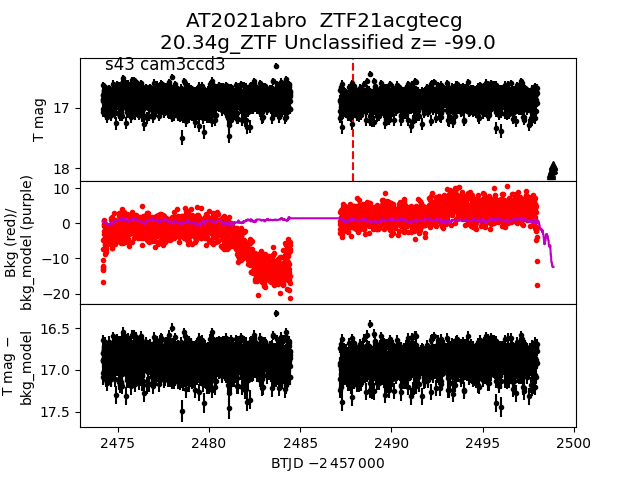
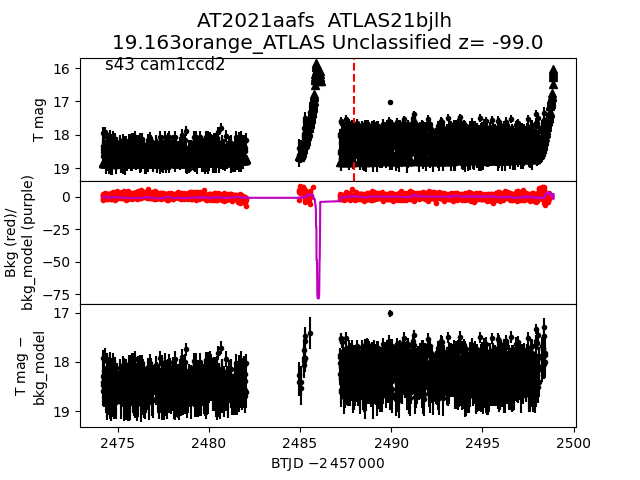
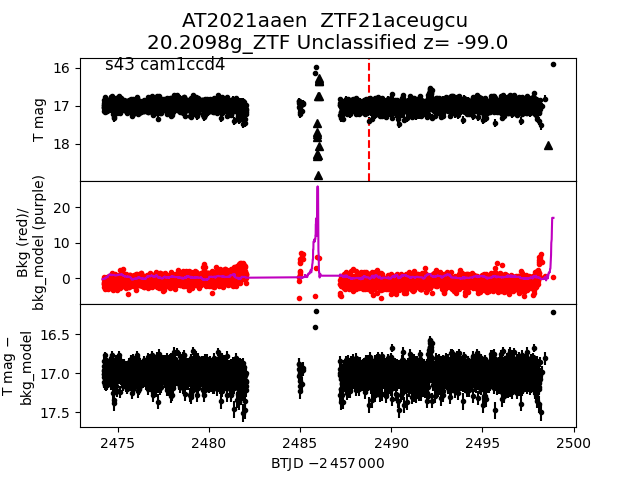
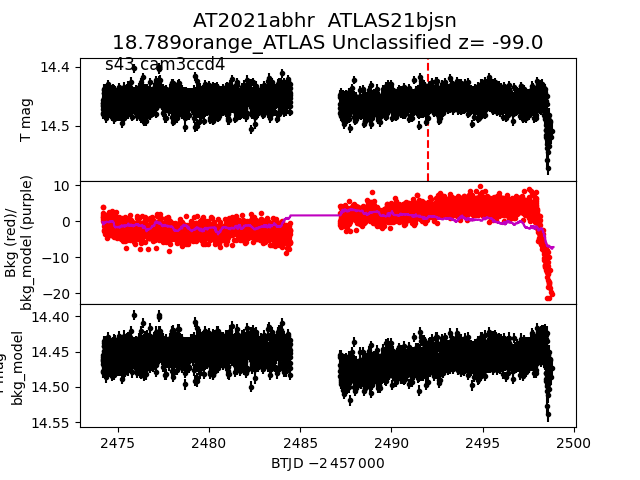
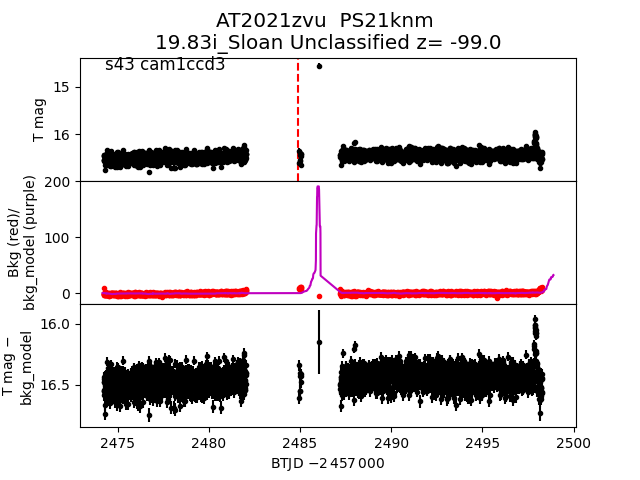
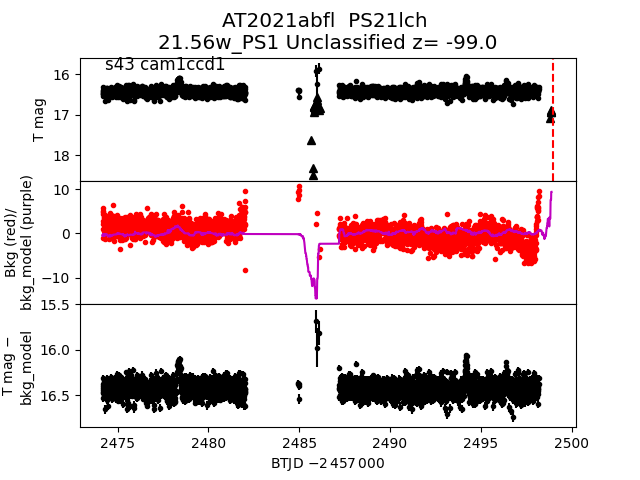
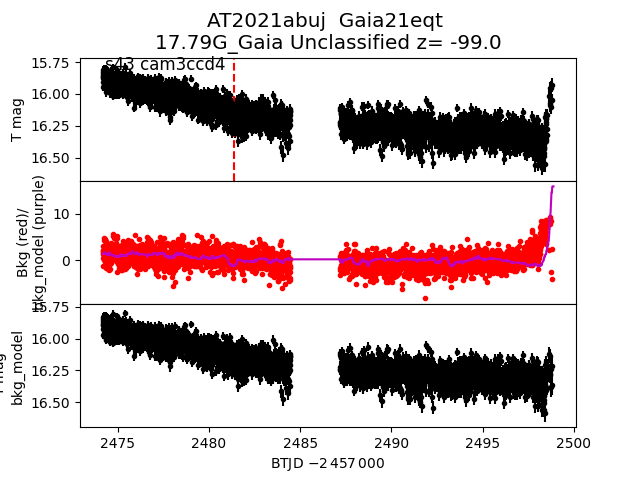
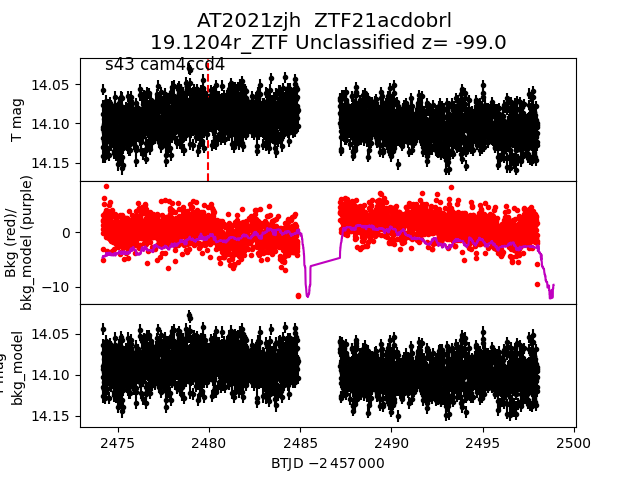
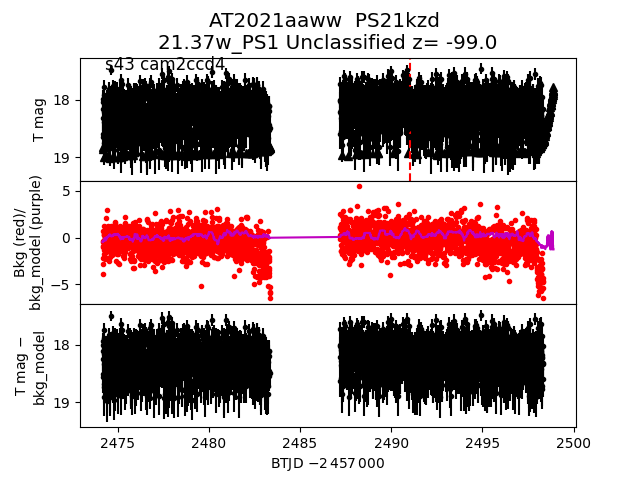
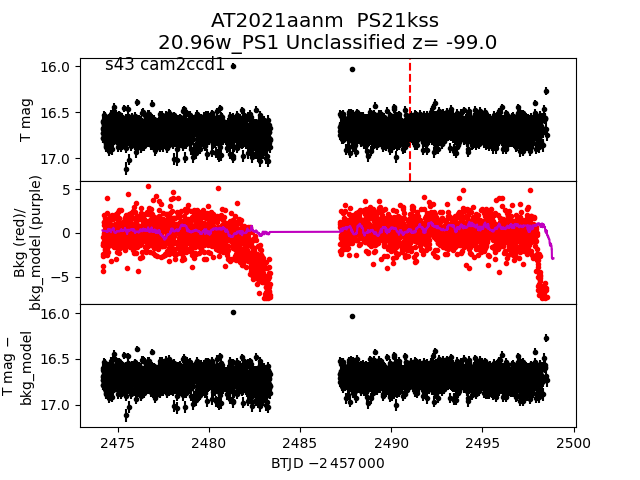
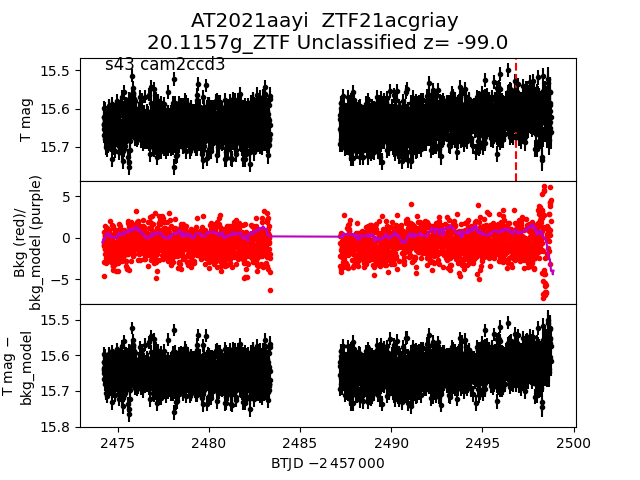
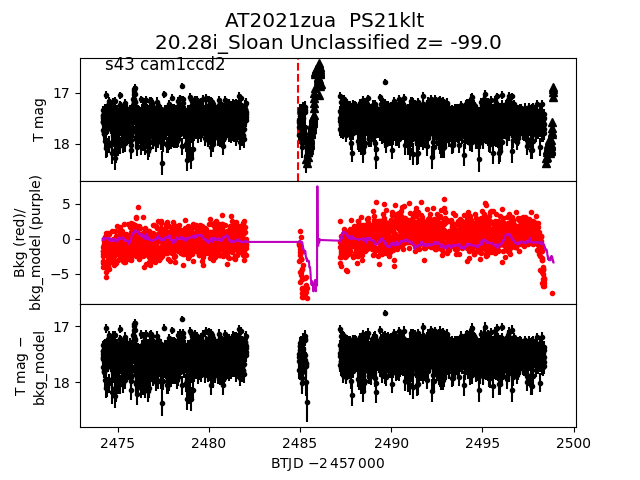
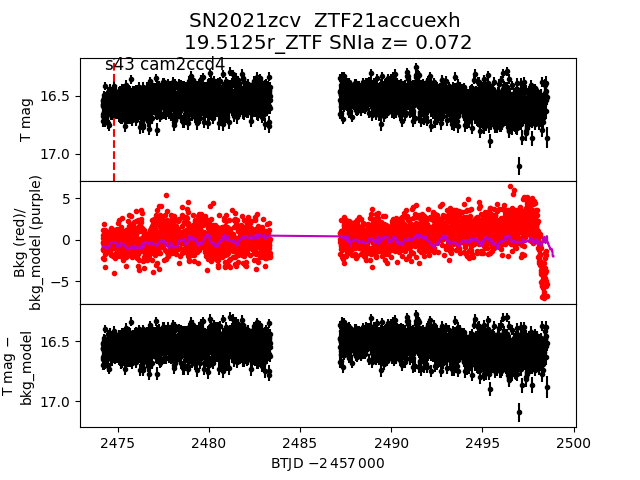
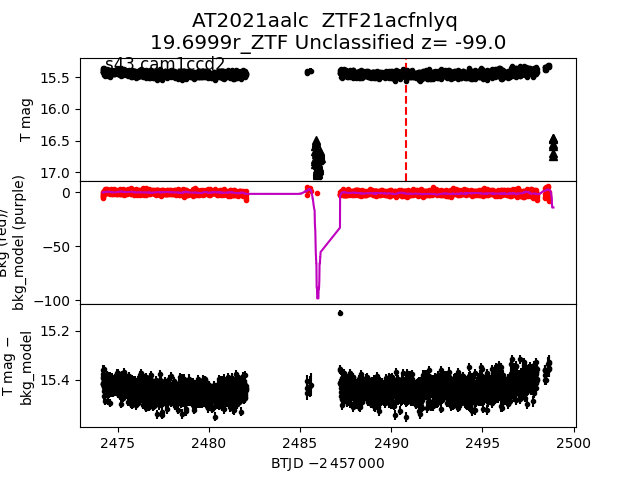
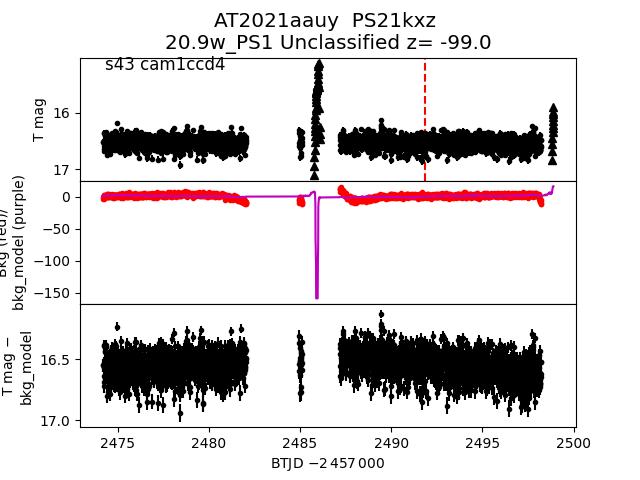
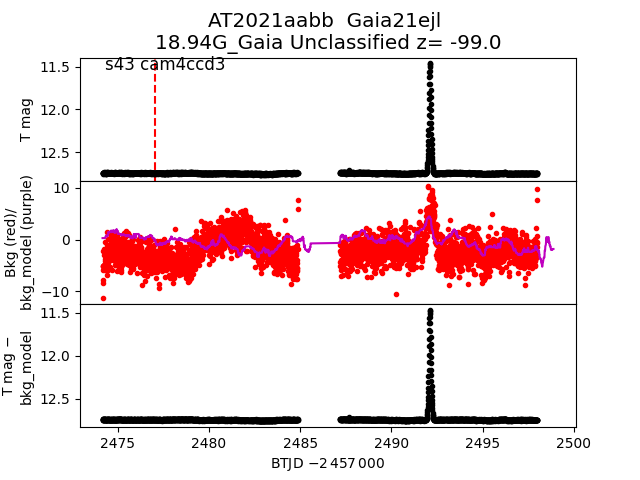
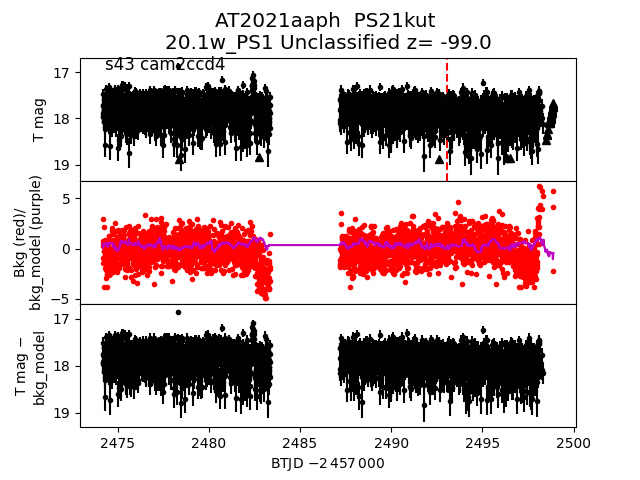
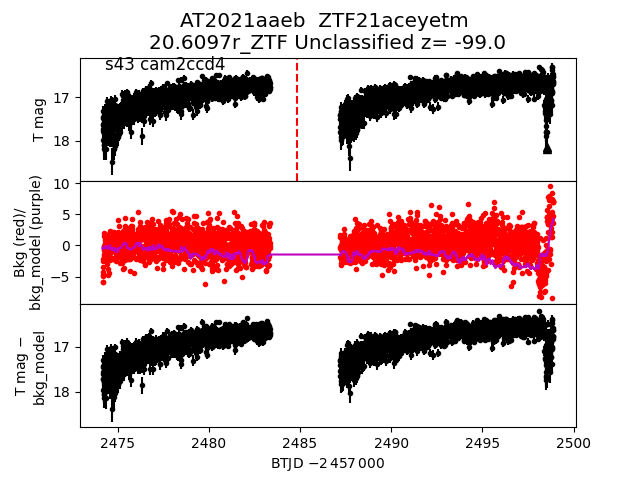
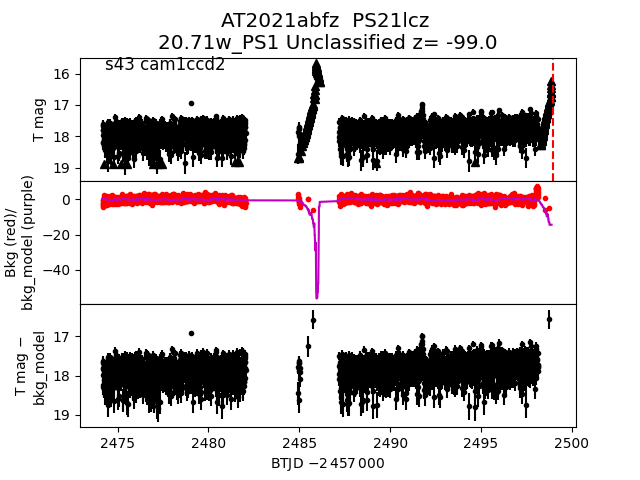
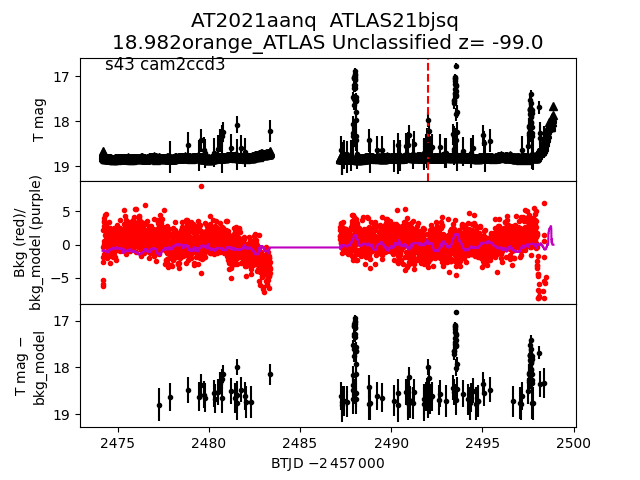
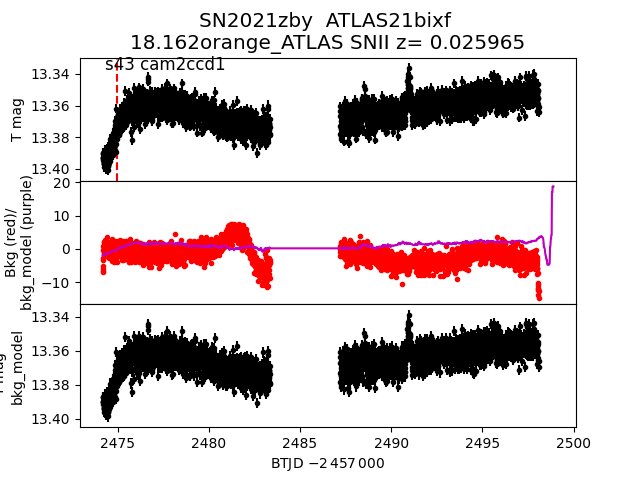
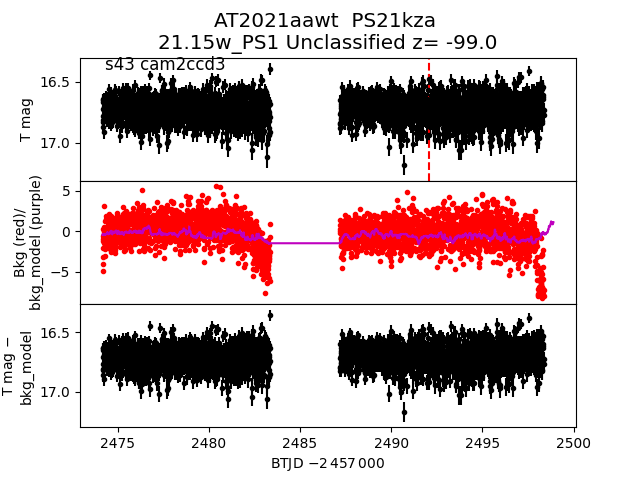
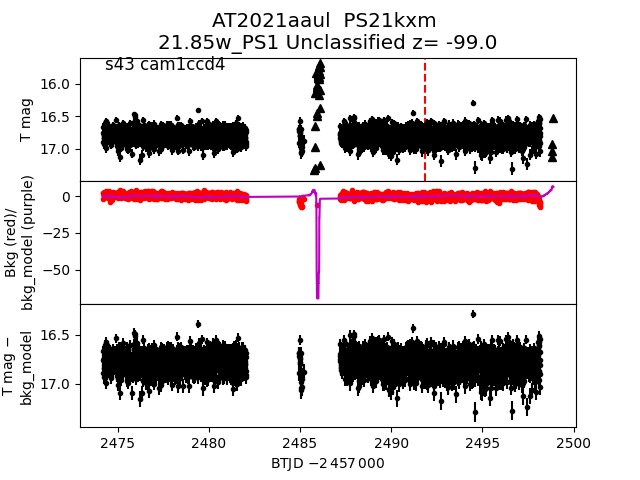
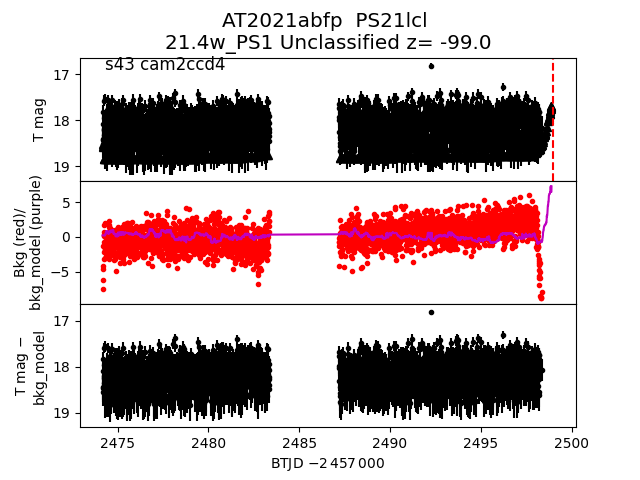
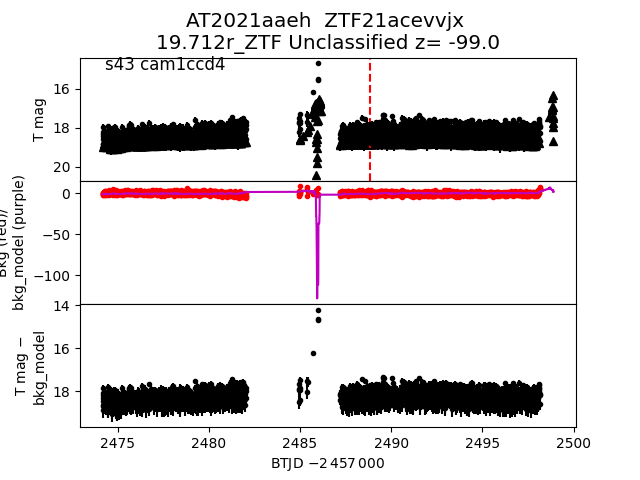
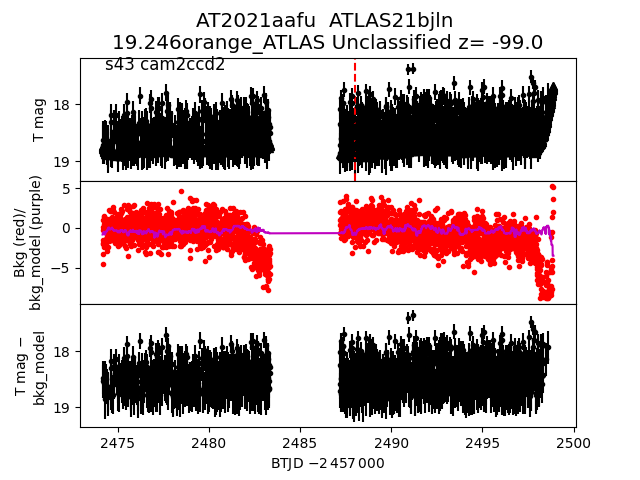
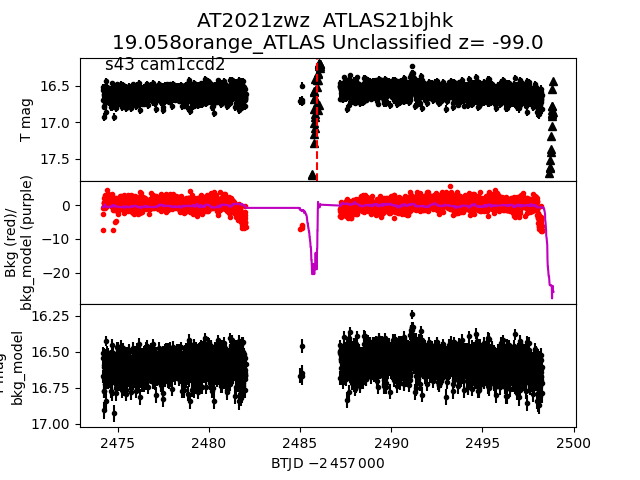
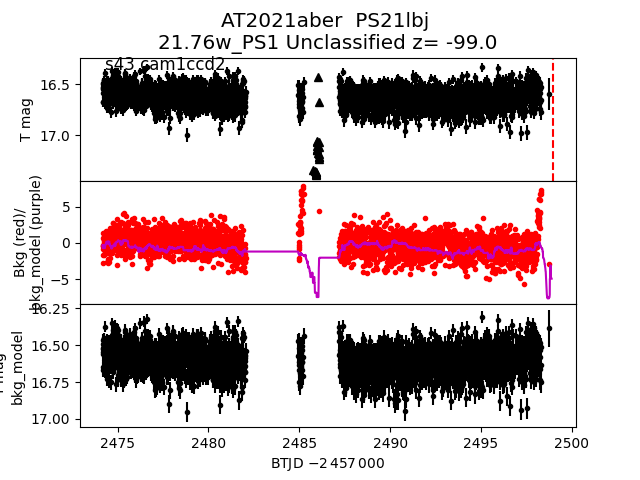
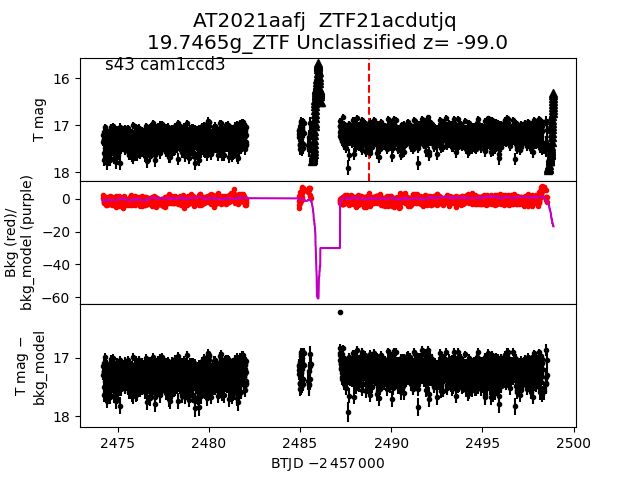
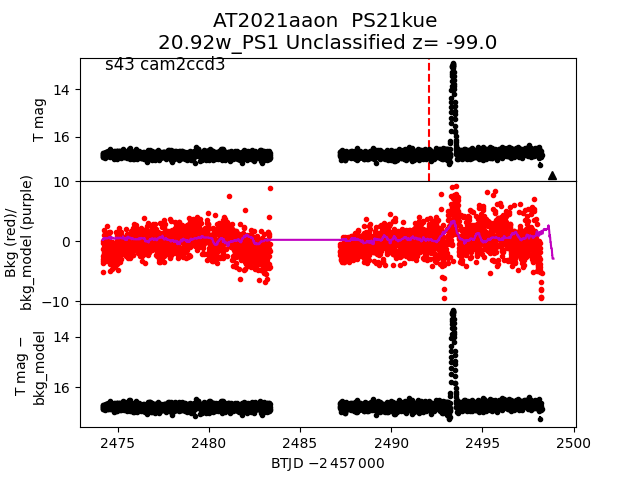
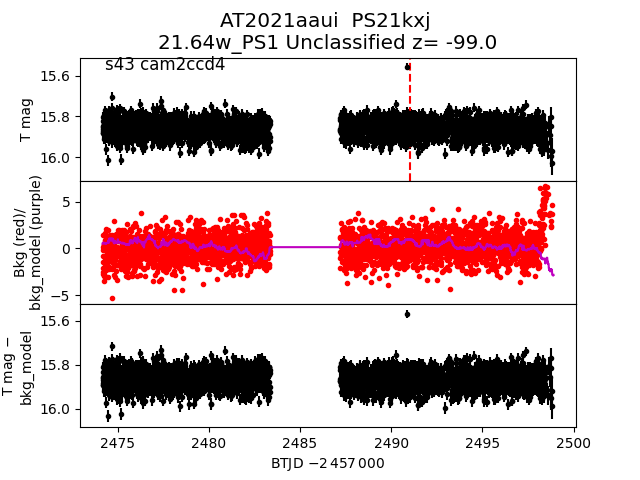
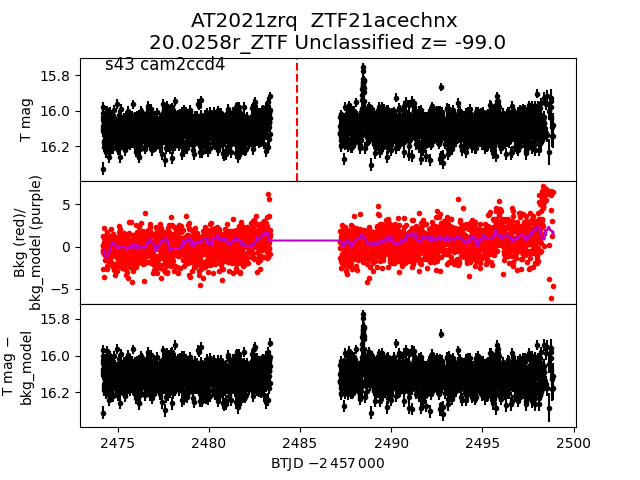
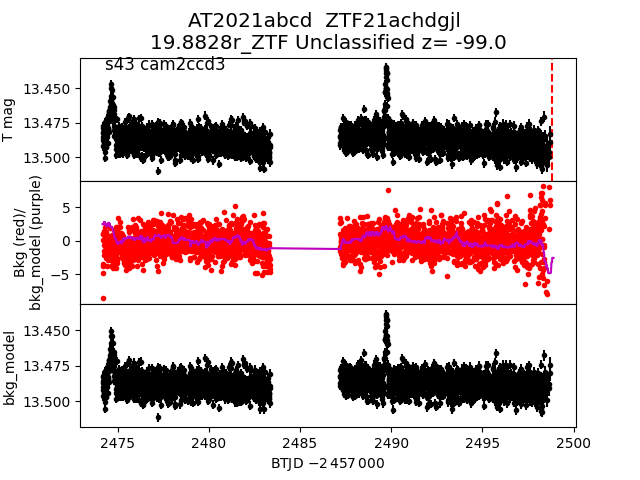
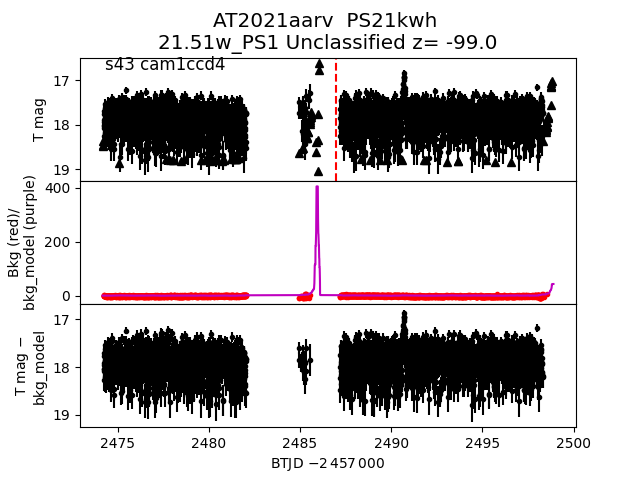
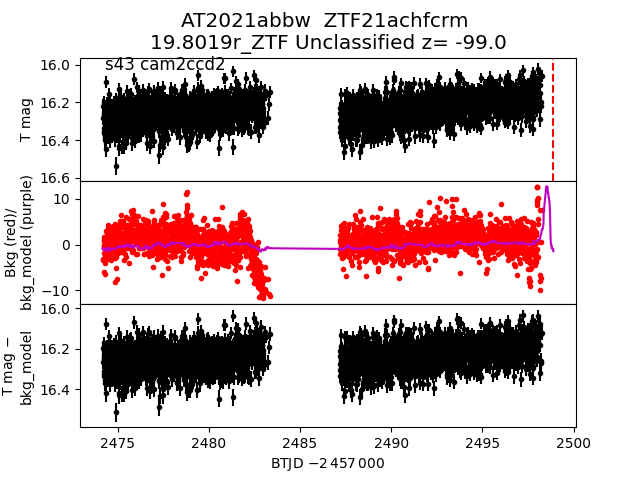
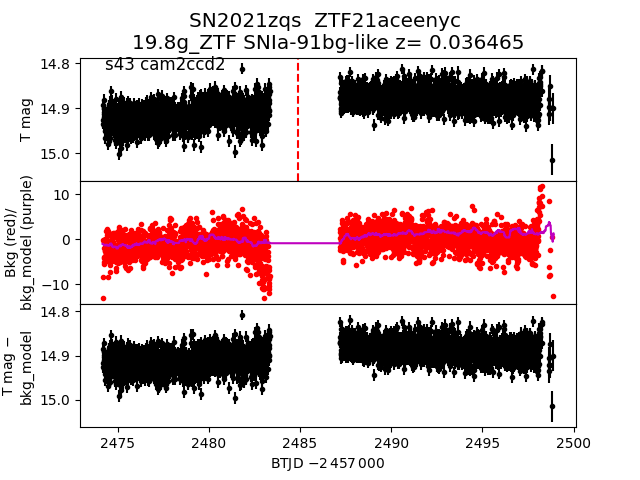
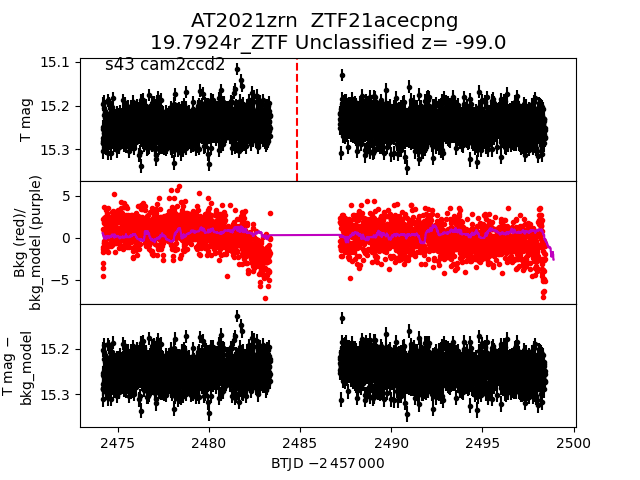
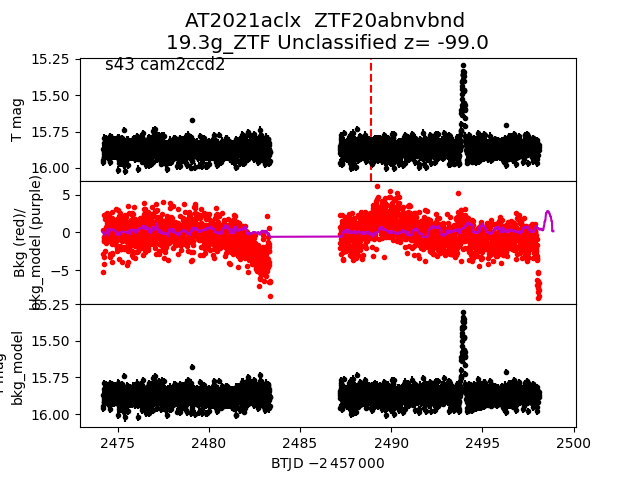
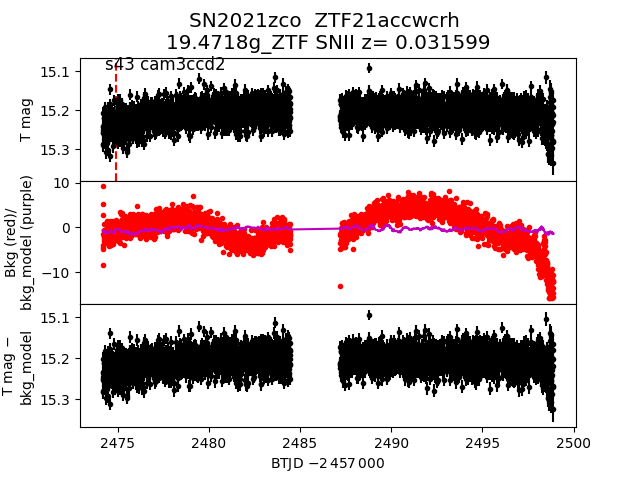
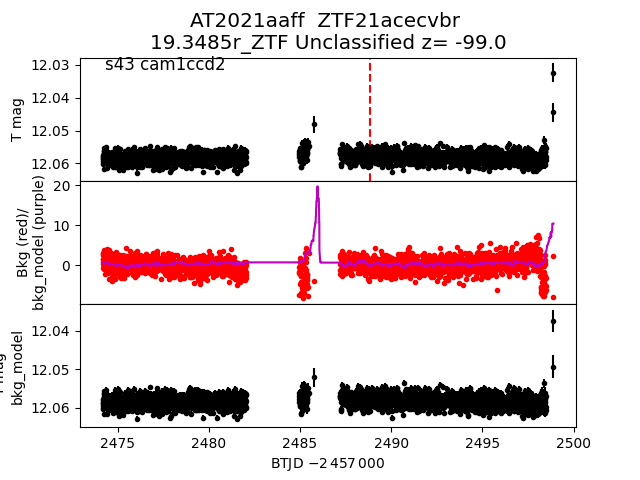
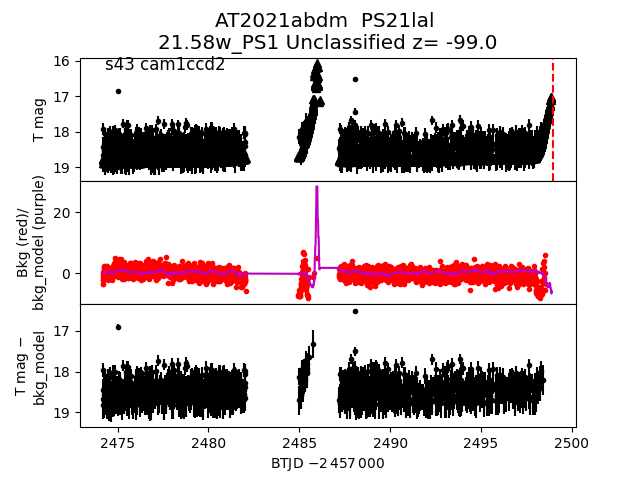
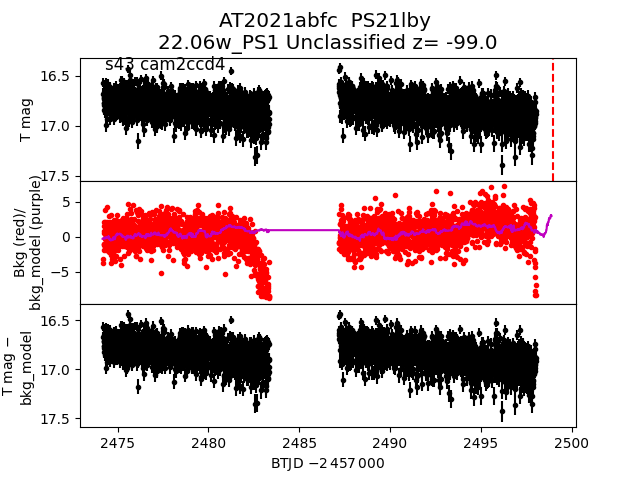
Each figure has three panels. The top panel shows the transient light curve, the middle panel shows the local background (estimated in an annulus), and the bottom panel shows a "background-model corrected" light curve. Details about the background model are in the README.
The vertical red line marks the time of discovery reported to TNS. Other useful metadata from TNS is in the figure title.
Note that the top and bottom panel are in magnitudes, while the middle panel is in differential flux units. The magnitudes are calibrated to the flux in the reference image used for image subtraction. Thus, flux from the host galaxy is included in these magnitudes.
3-sigma upper limits are plotted as triangles with no errorbars. A typical limiting magnitude is 19.6 in 30 minutes or 18.4 in 200 seconds (for low backgrounds).
The links allow you to download the light curve data as a text file.
More details in the README.
2021aawi
 2021aast
 2021aaec
 2021aapi
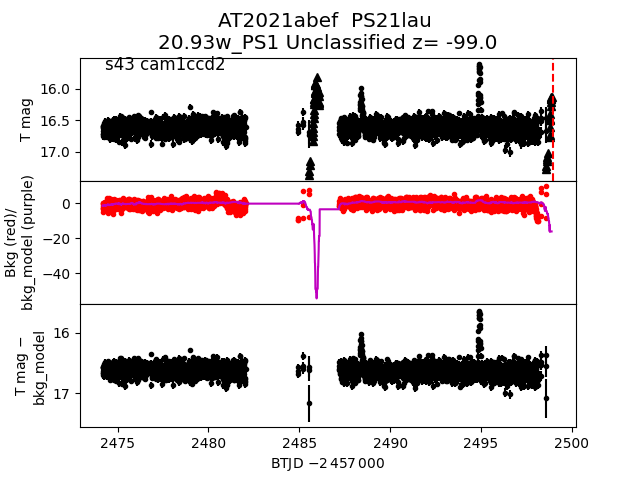
 2021abef
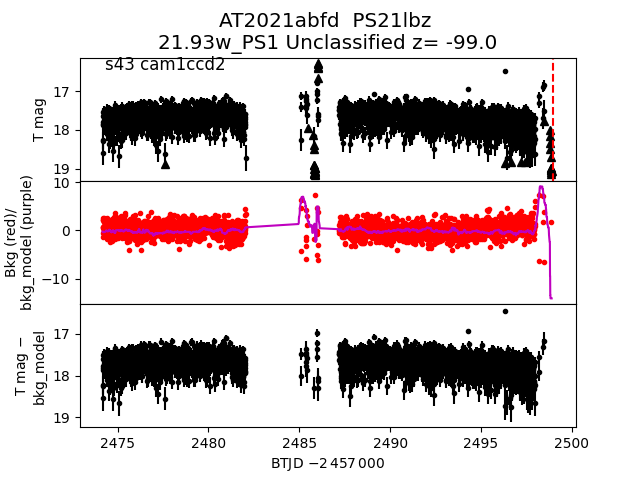
 2021abfd
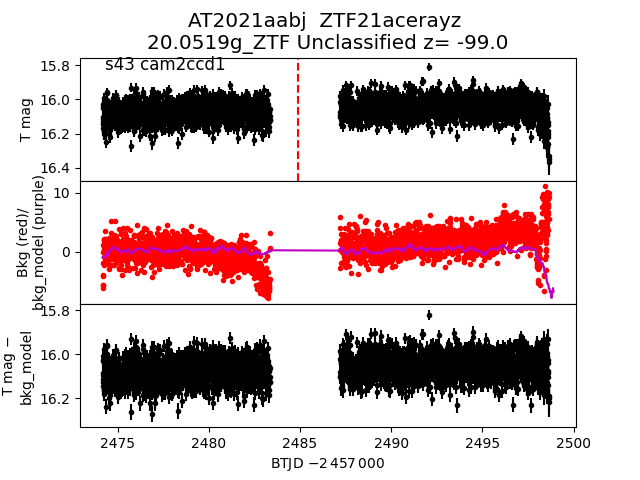
 2021aabj
 2021aaoi
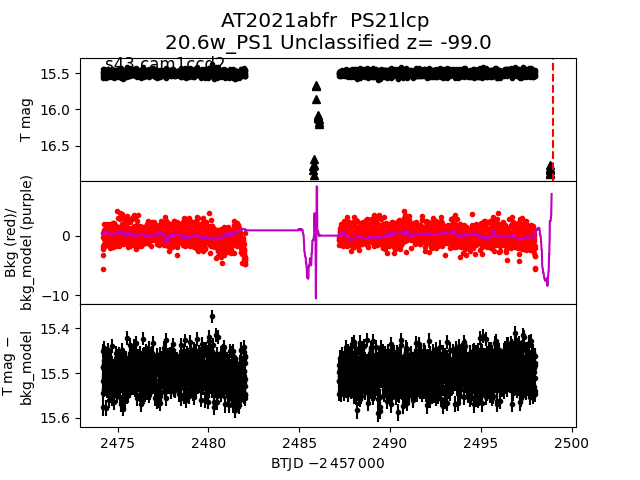
 2021abfr
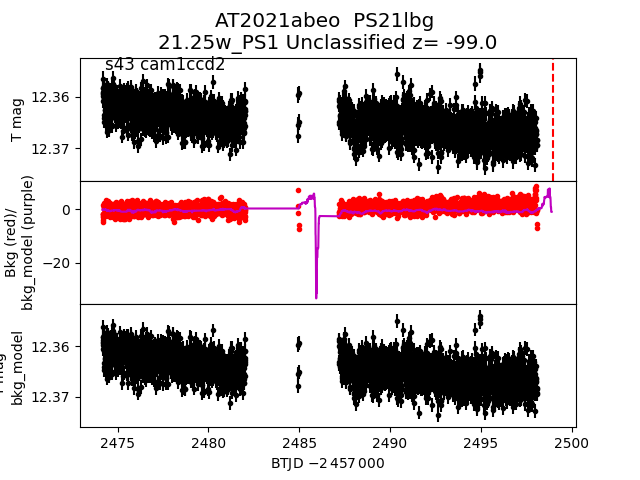
 2021abeo
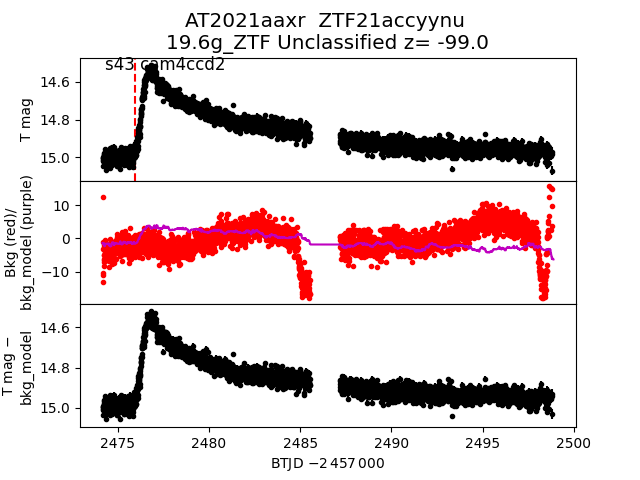
 2021aaxr
 2021abfm
 2021aavl
 2021abjg
 2021abej
 2021abfw
 2021aaol
 2021aawe
 2021aaxh
 2021abbu
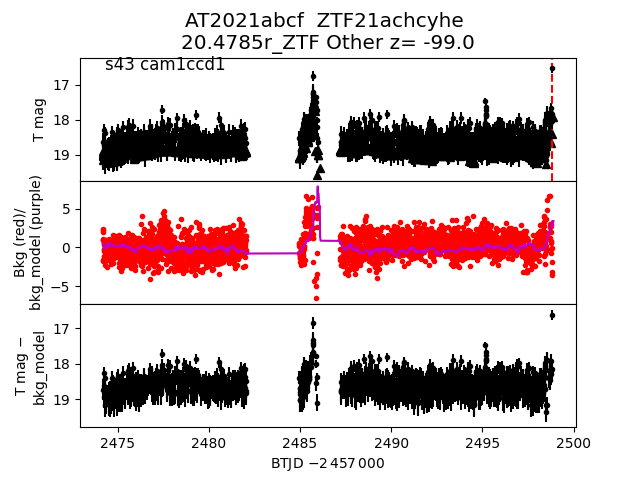
 2021abcf
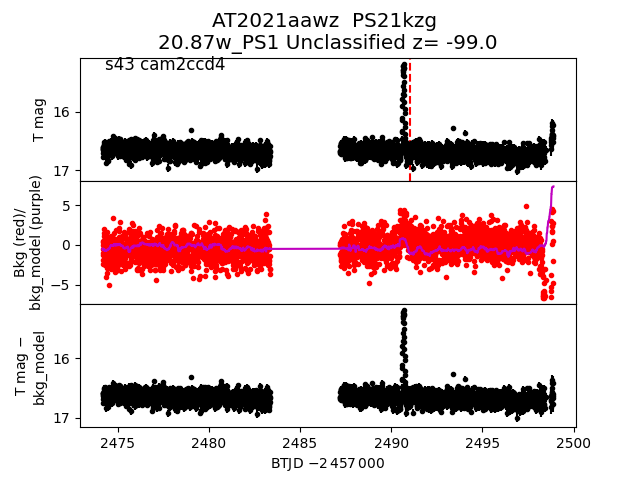
 2021aawz
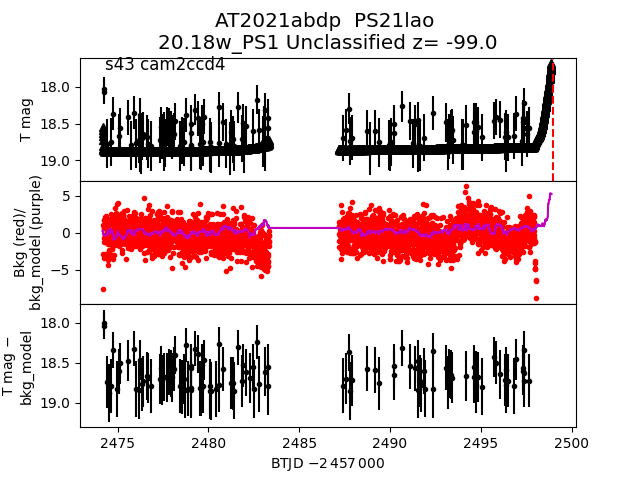
 2021abdp
 2021aabf
 2021abfa
 2021aaoz
 2021aafd
 2021abdo
 2021aani
 2021aaey
 2021abdl
 2021aasm
 2021abpu
 2021actf
 2021aaxb
 2021aaof
 2021aawy
 2021aanc
 2021aasd
 2021abce
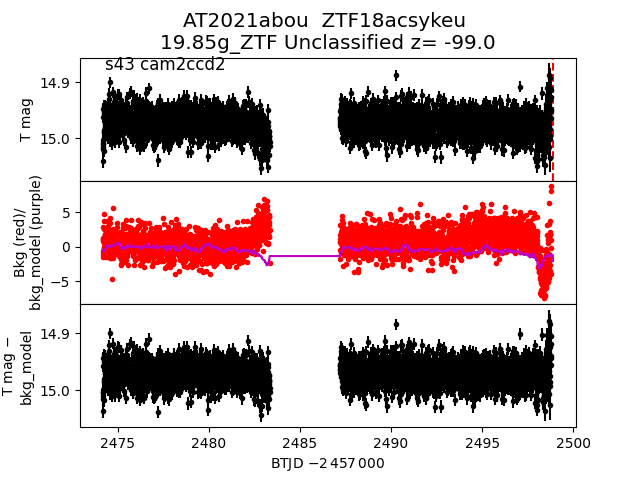
 2021abou
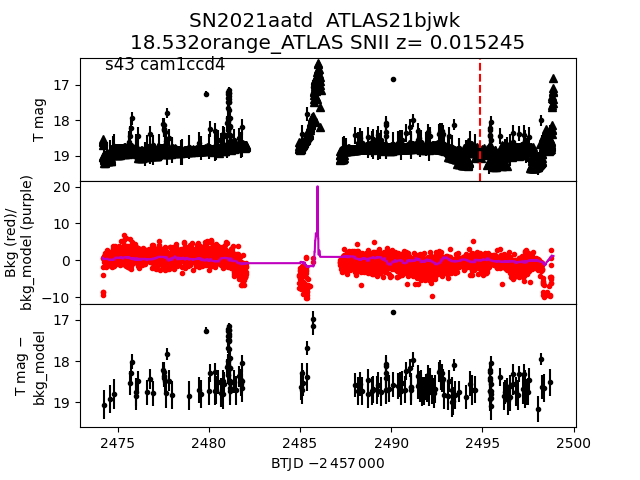
 2021aatd
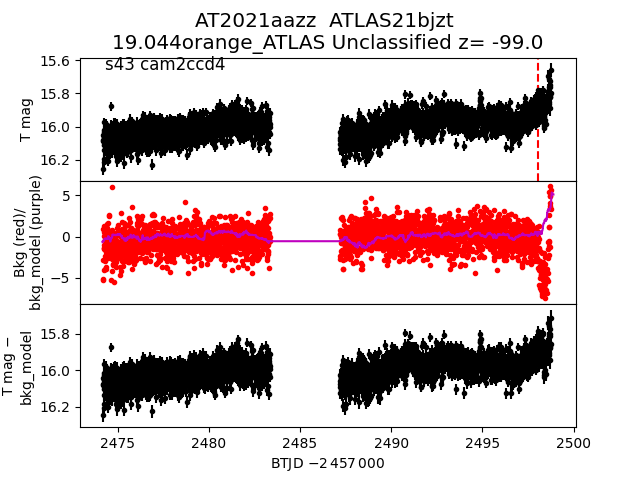
 2021aazz
 2021zro
 2021abev
 2021abbv
 2021zrp
 2021aaho
 2021abbs
 2021abes
 2021aaur
 2021aaev
 2021abfq
 2021abbl
 2021aabi
 2021abbz
 2021aafb
 2021aavy
 2021aanp
 2021zex
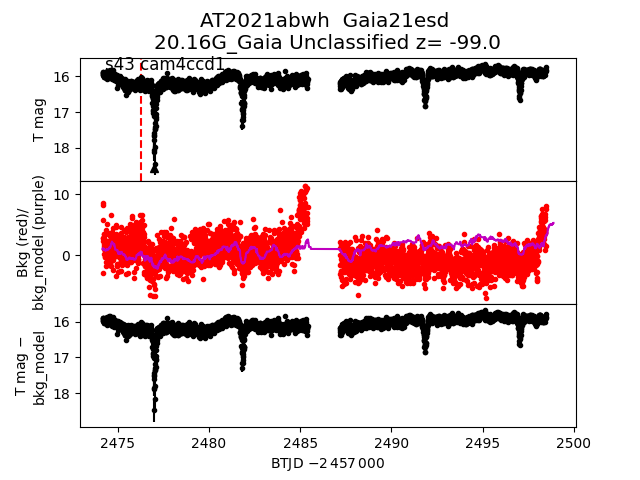
 2021abwh
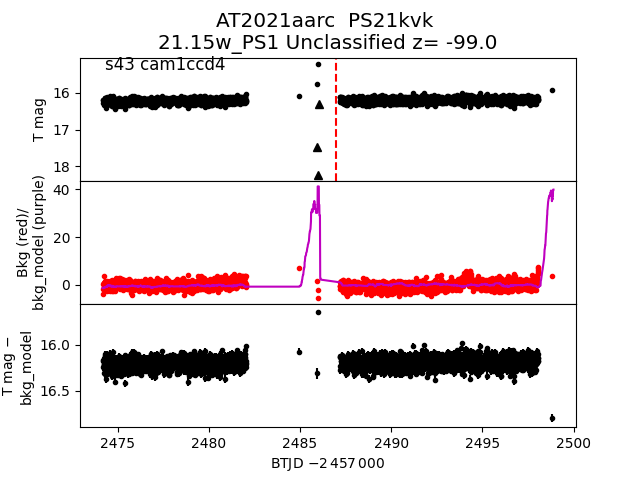
 2021aarc
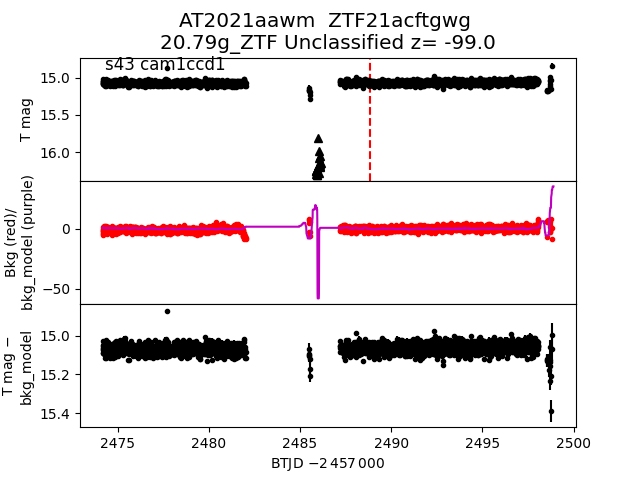
 2021aawm
 2021aaru
 2021abbt
 2021aazx
 2021abet
 2021zrm
 2021zoj
 2021aafl
 2021zny
 2021abcg
 2021aaom
 2021aavw
 2021aboh
 2021abro
 2021aafs
 2021aaen
 2021abhr
 2021zvu
 2021abfl
 2021abuj
 2021zjh
 2021aaww
 2021aanm
 2021aayi
 2021zua
 2021zcv
 2021aalc
 2021aauy
 2021aabb
 2021aaph
 2021aaeb
 2021abfz
 2021aanq
 2021zby
 2021aawt
 2021aaul
 2021abfp
 2021aaeh
 2021aafu
 2021zwz
 2021aber
 2021aafj
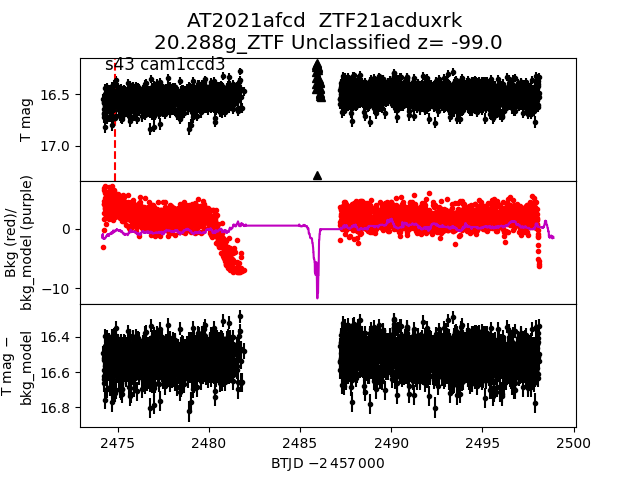
 2021afcd
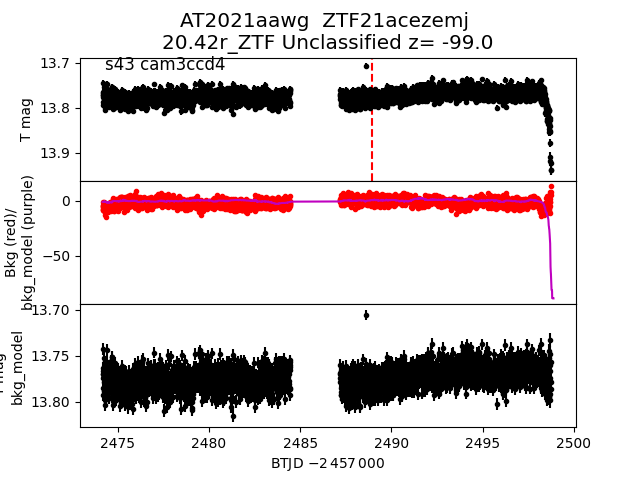
 2021aawg
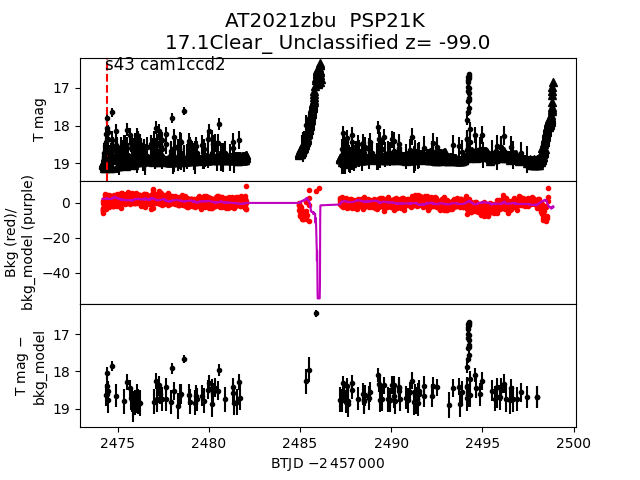
 2021zbu
 2021aaon
 2021aaui
 2021zrq
 2021abcd
 2021aarv
 2021abbw
 2021zqs
 2021zrn
 2021aclx
 2021zco
 2021aaff
 2021abdm
 2021abfc
 2021abms