sector42 supernovae (26 total)
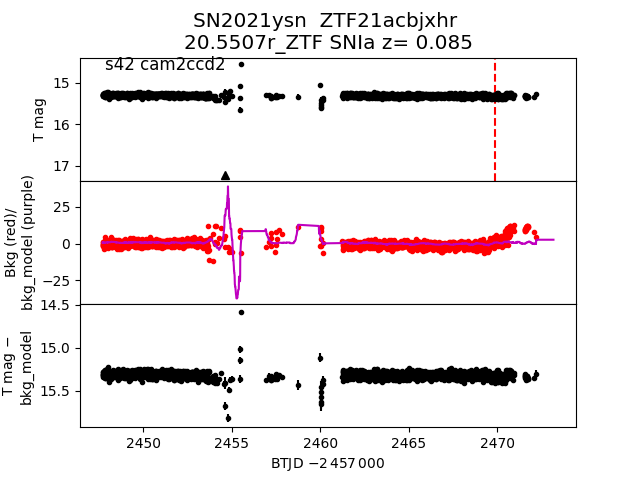
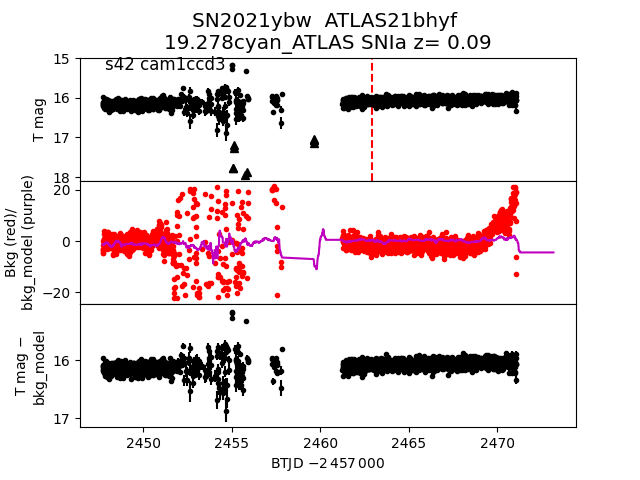
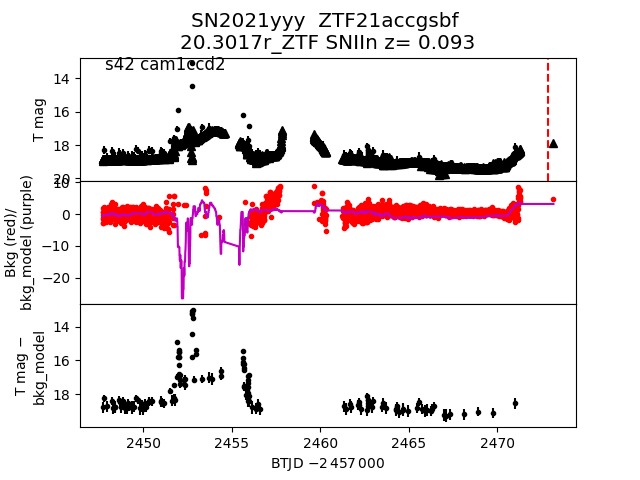
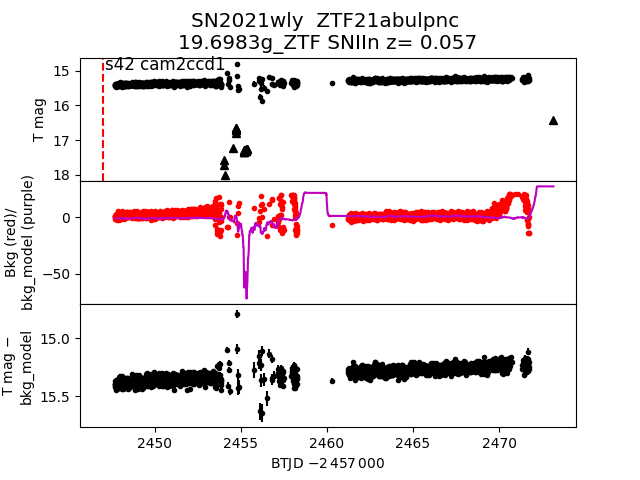
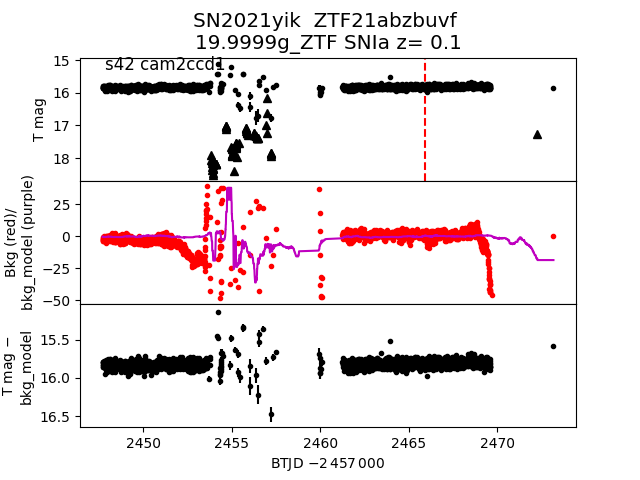
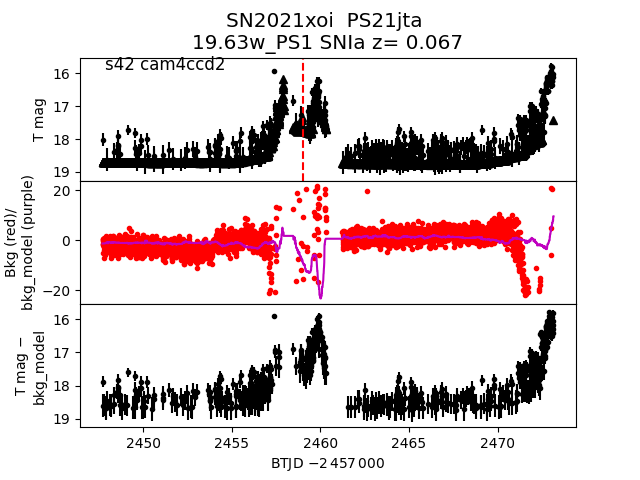
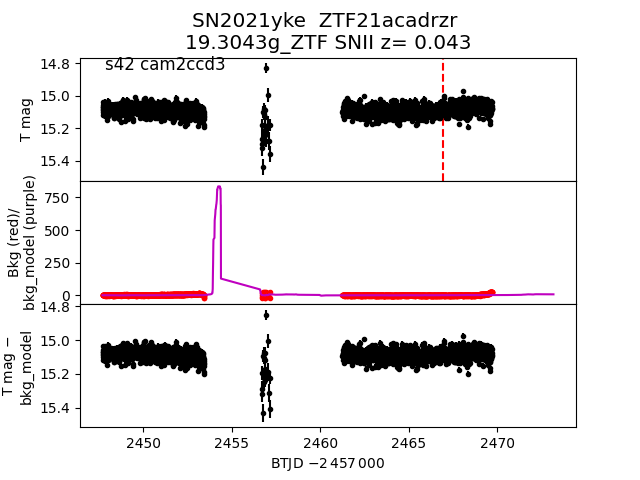
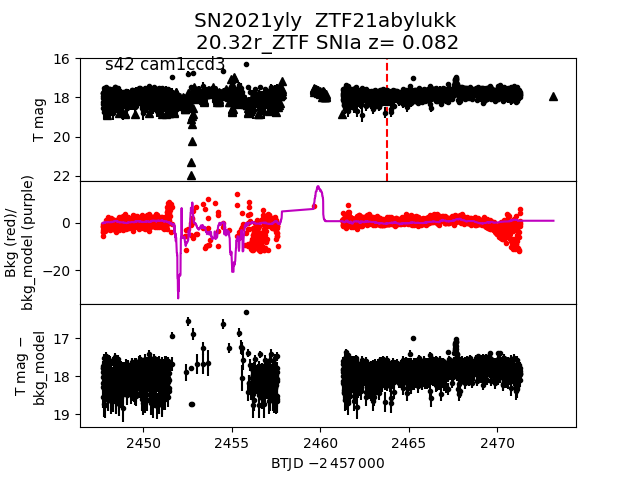
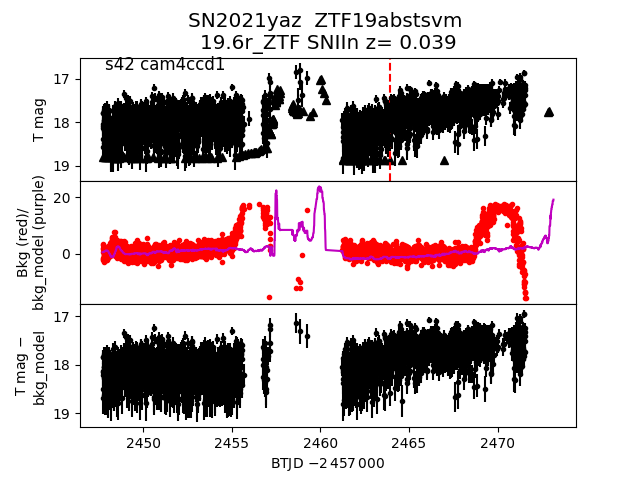
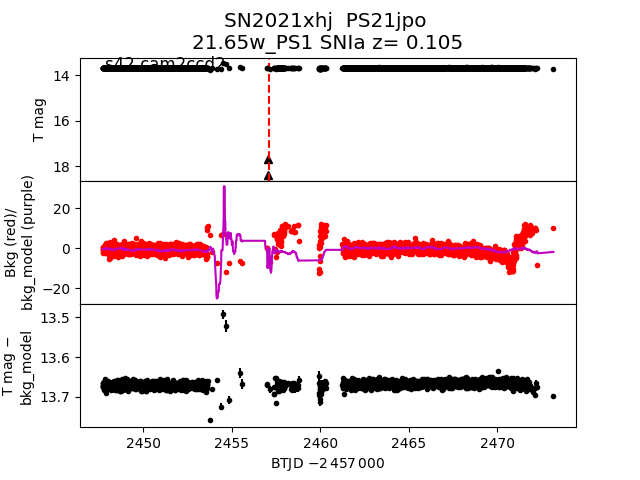
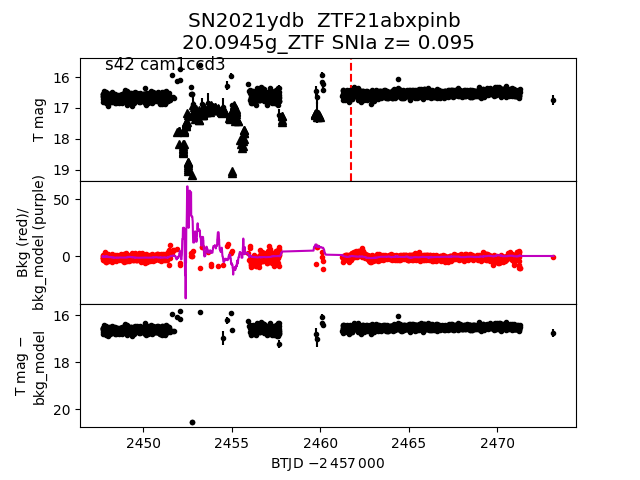
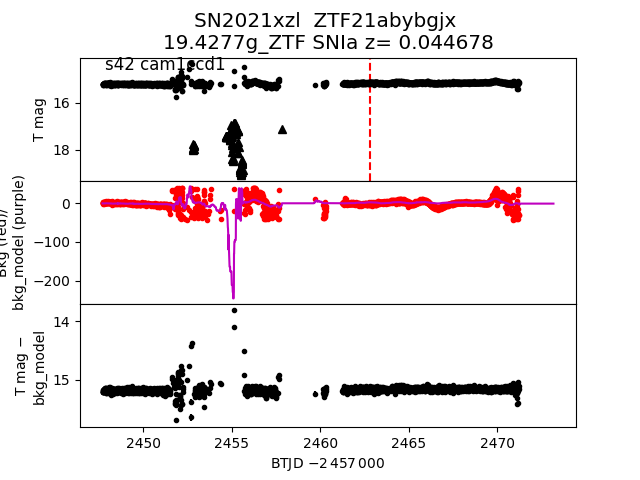
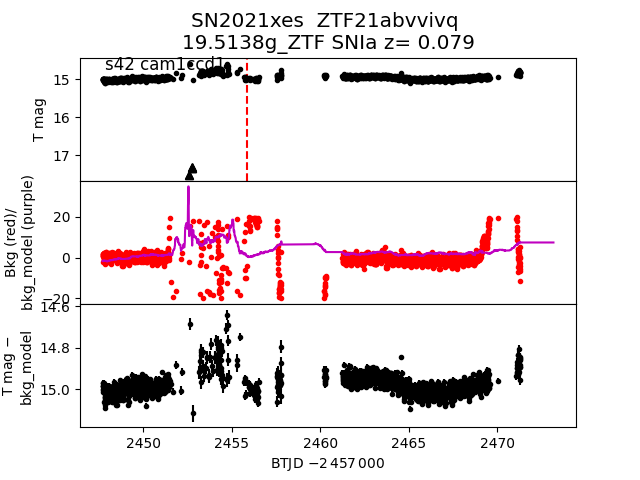
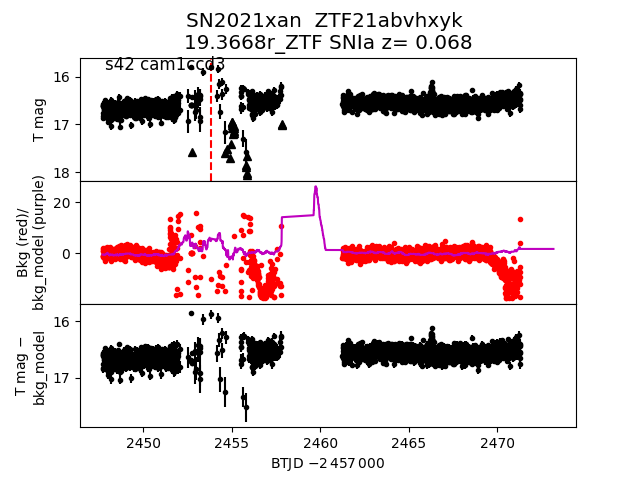
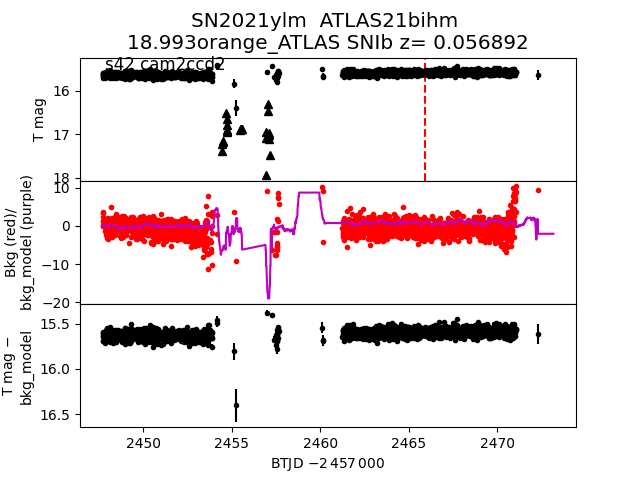
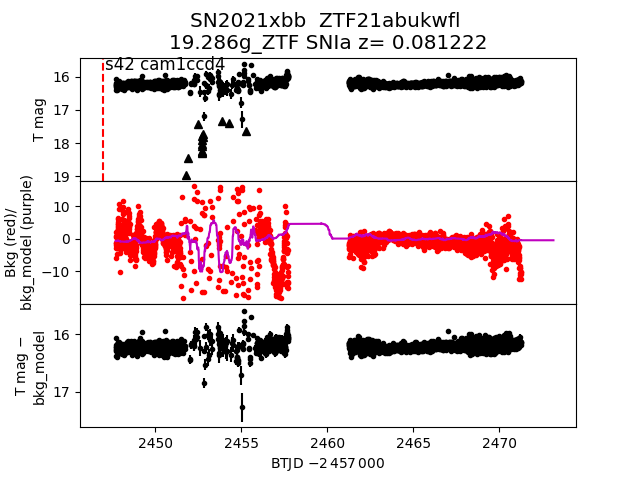
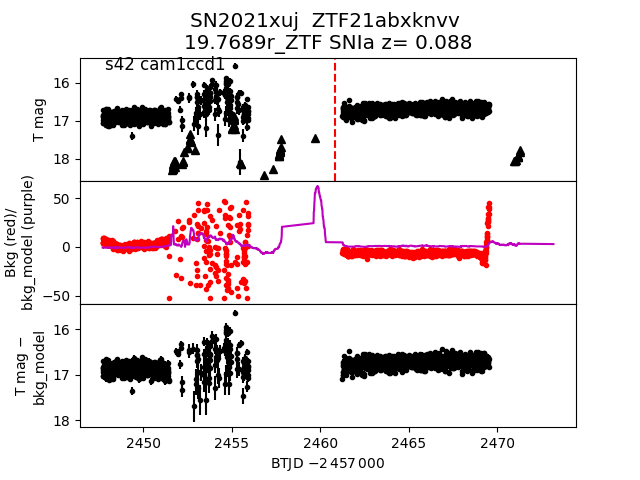
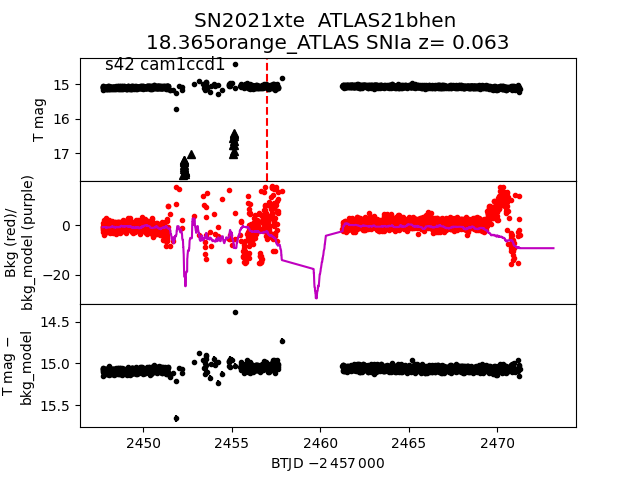
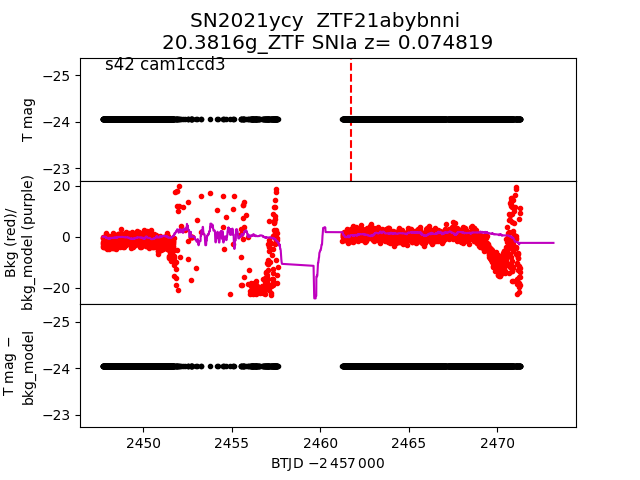
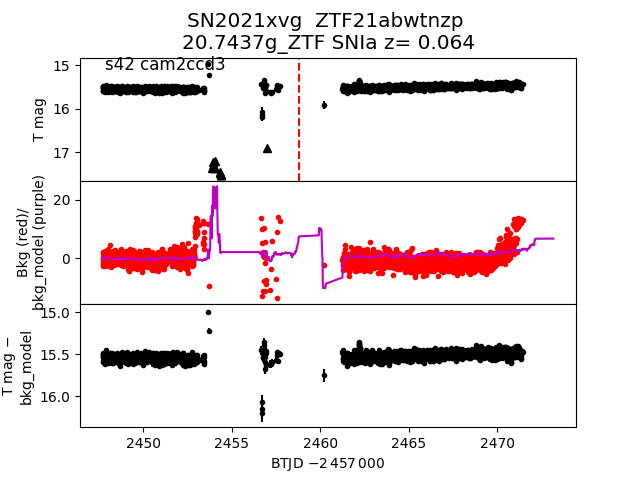
Each figure has three panels. The top panel shows the transient light curve, the middle panel shows the local background (estimated in an annulus), and the bottom panel shows a "background-model corrected" light curve. Details about the background model are in the README.
The vertical red line marks the time of discovery reported to TNS. Other useful metadata from TNS is in the figure title.
Note that the top and bottom panel are in magnitudes, while the middle panel is in differential flux units. The magnitudes are calibrated to the flux in the reference image used for image subtraction. Thus, flux from the host galaxy is included in these magnitudes.
3-sigma upper limits are plotted as triangles with no errorbars. A typical limiting magnitude is 19.6 in 30 minutes or 18.4 in 200 seconds (for low backgrounds).
The links allow you to download the light curve data as a text file.
More details in the README.
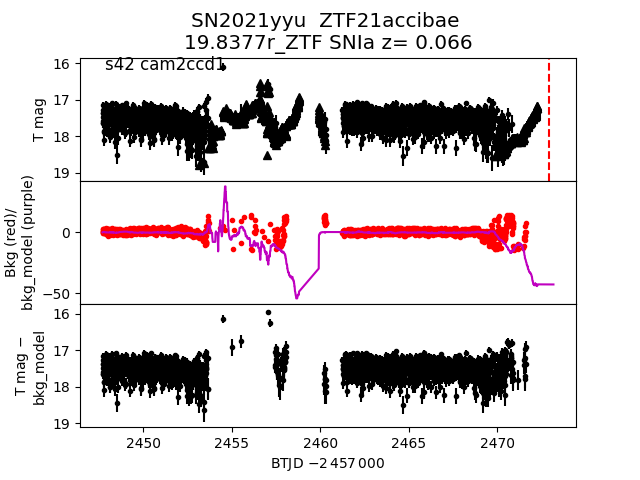
2021yyu
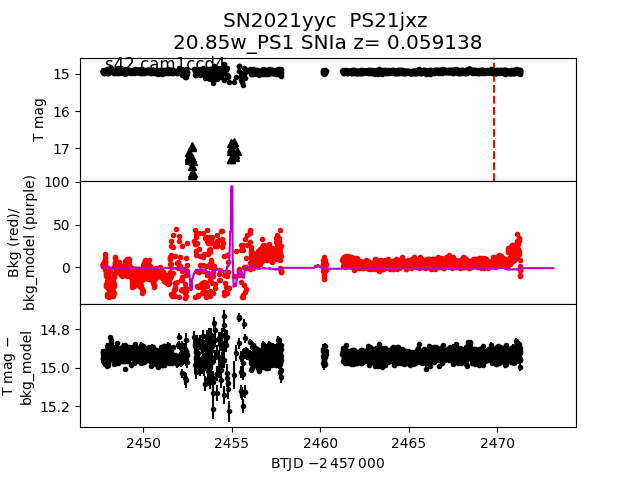
 2021yyc
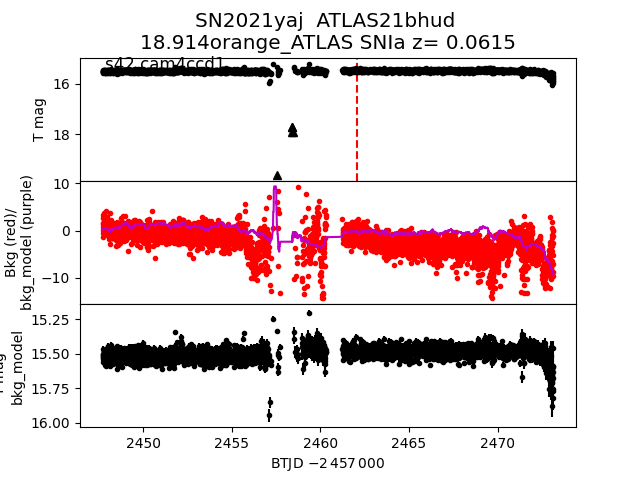
 2021yaj
 2021ybw
 2021yyy
 2021wly
 2021yik
 2021xoi
 2021yke
 2021yly
 2021yaz
 2021xhj
 2021ydb
 2021xzl
 2021xes
 2021xan
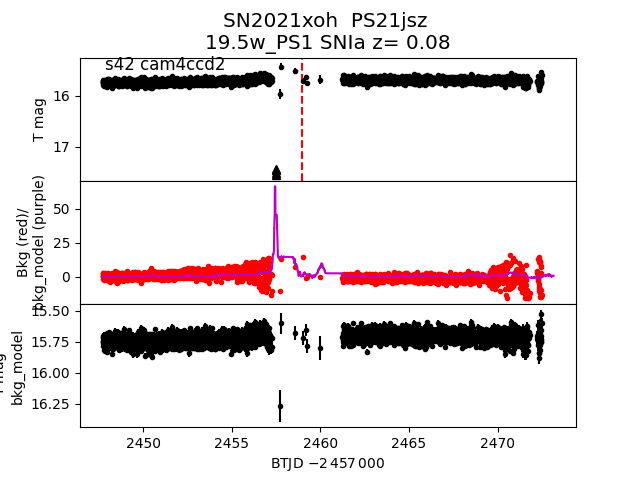
 2021xoh
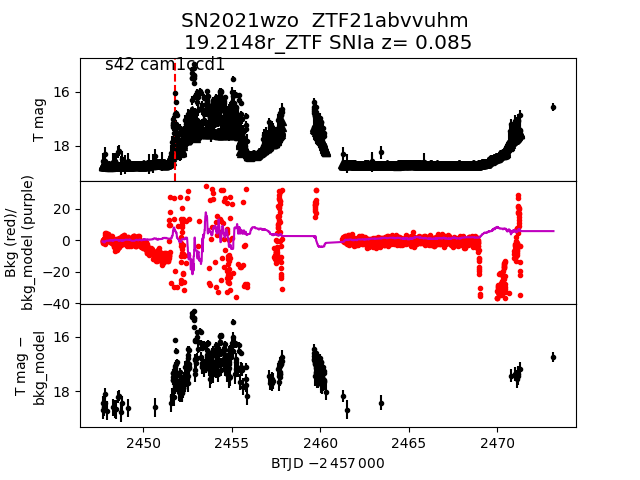
 2021wzo
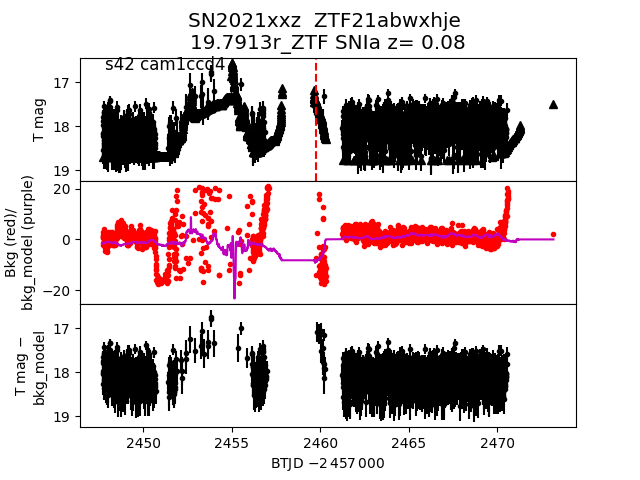
 2021xxz
 2021ylm
 2021xbb
 2021xuj
 2021xte
 2021ycy
 2021xvg
 2021ysn