all transients in sector41 (106 total)
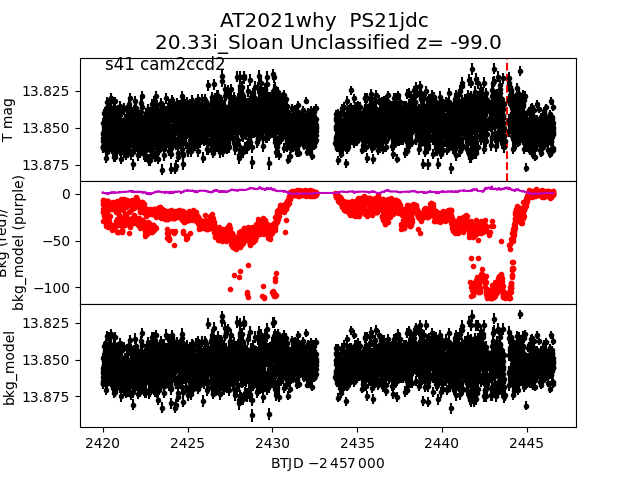
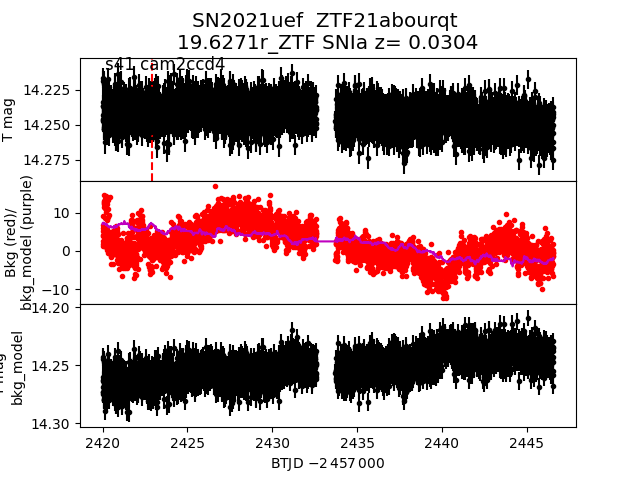
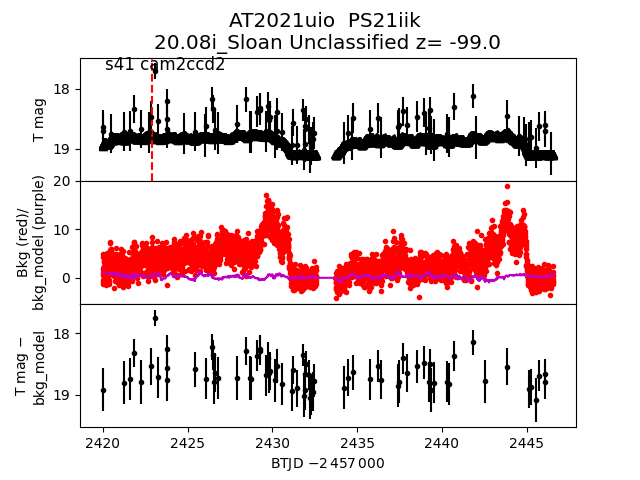
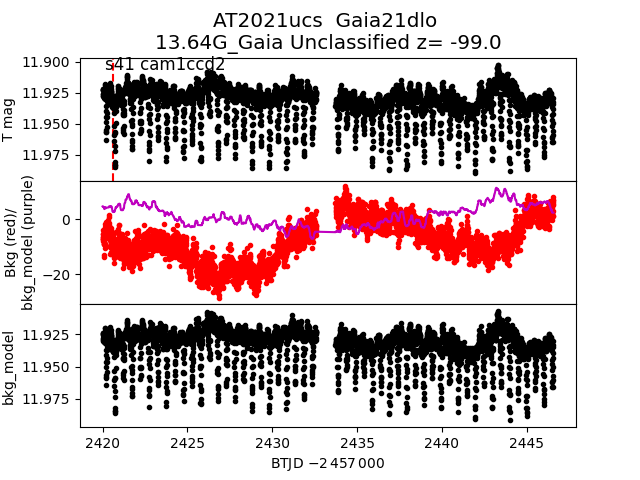
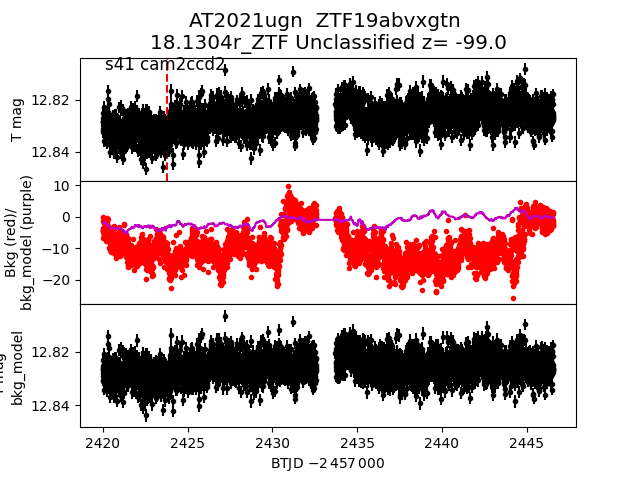
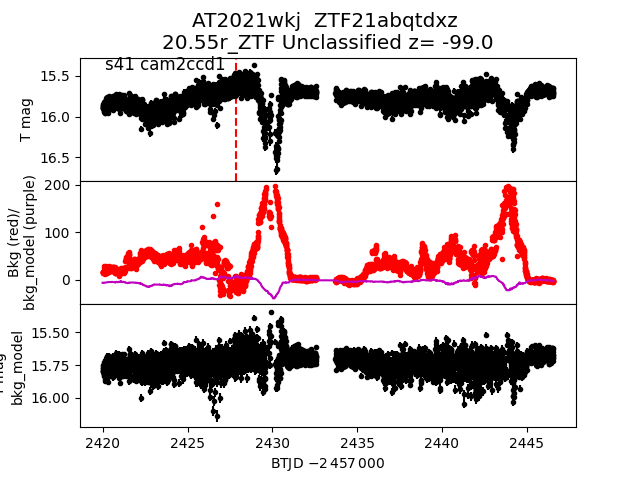
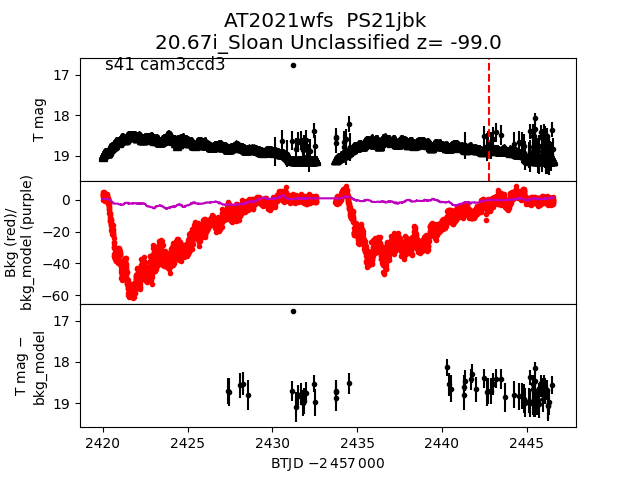
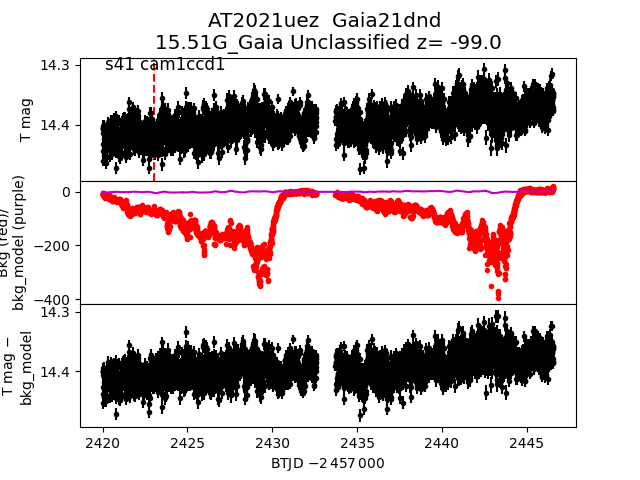
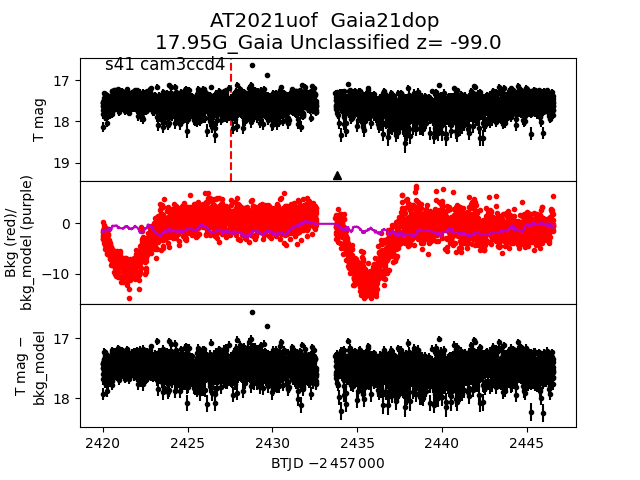
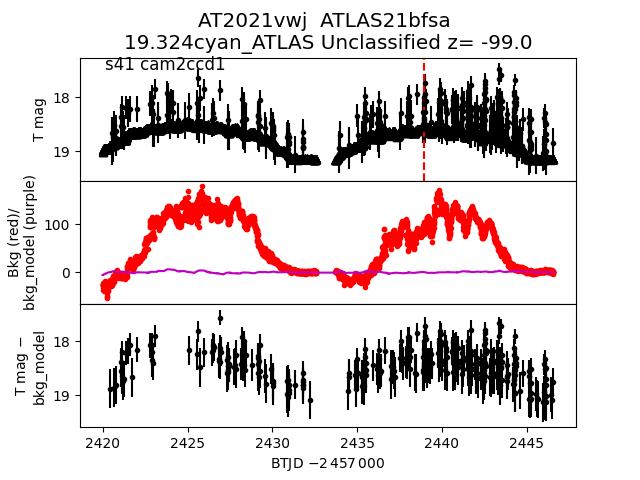
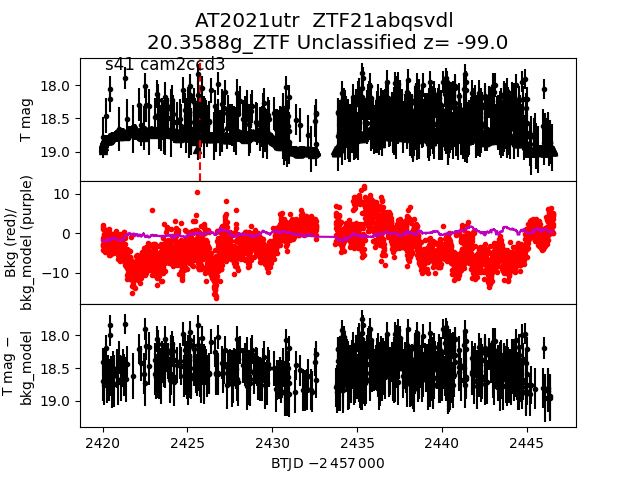
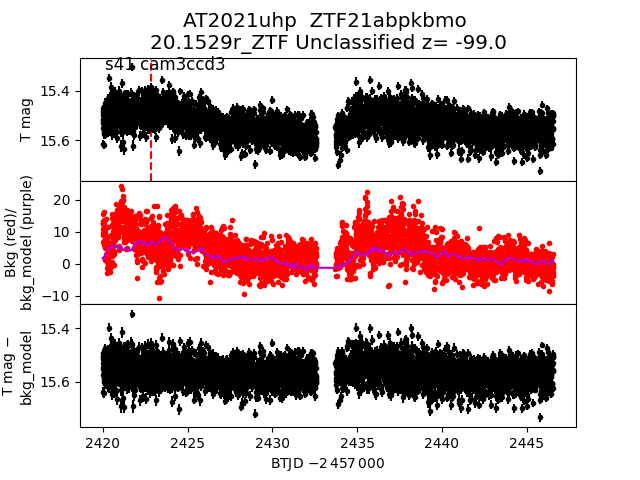
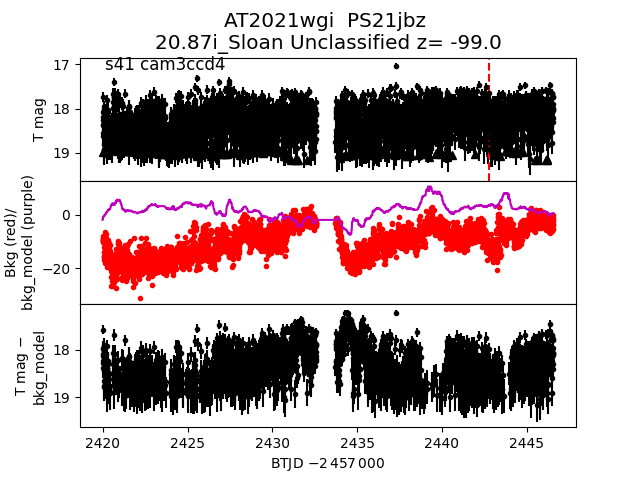
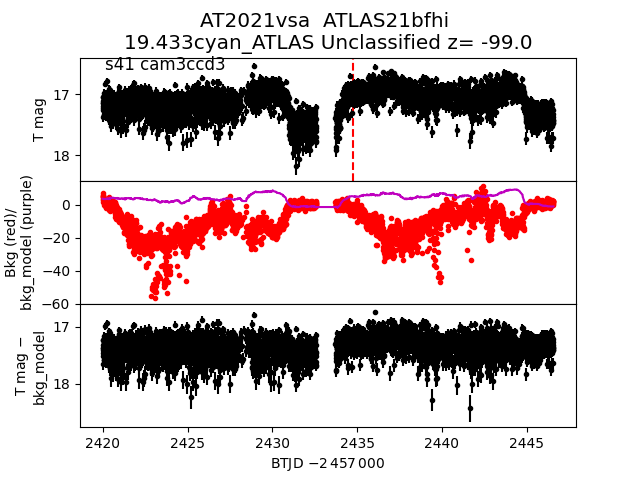
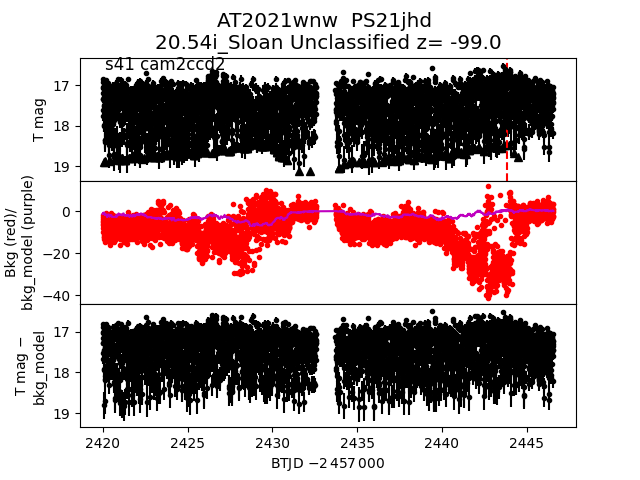
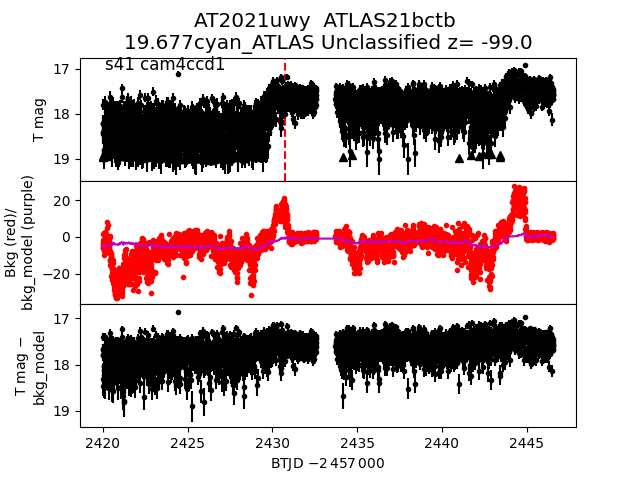
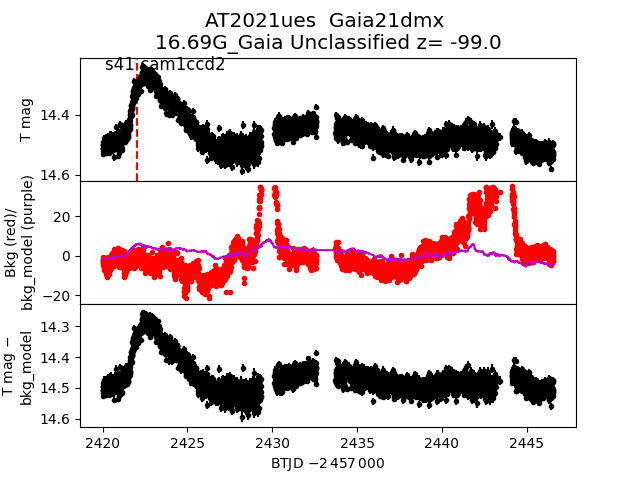
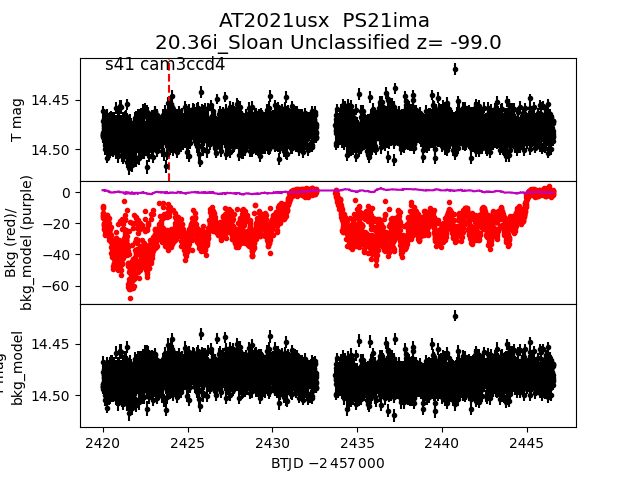
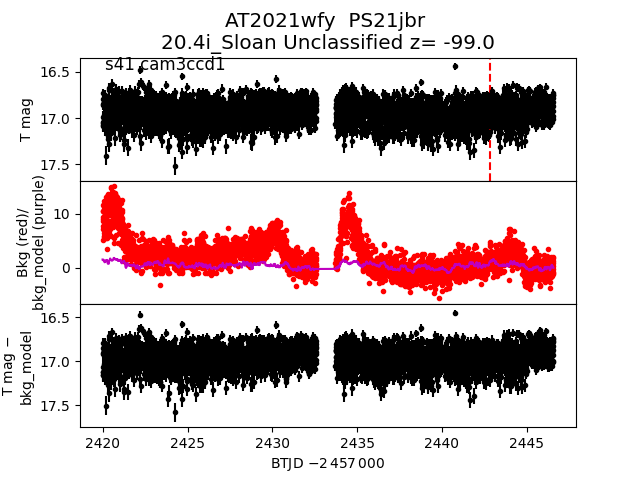
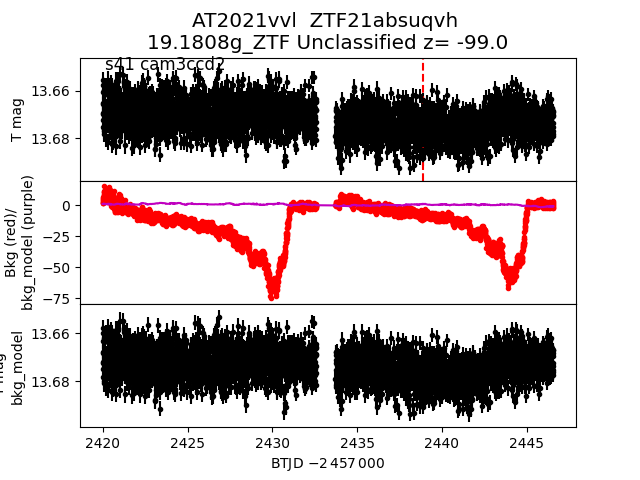
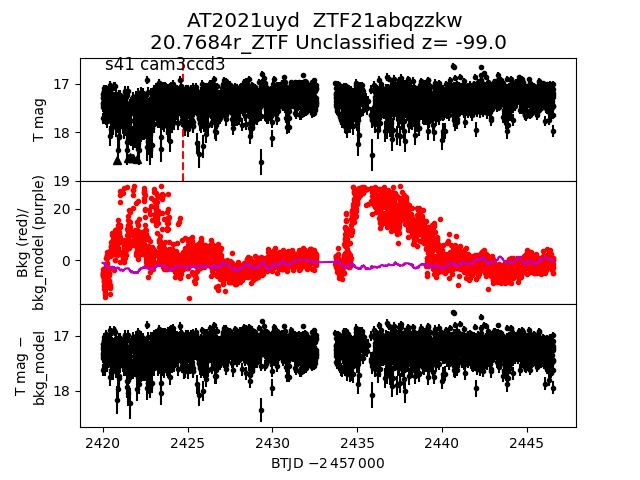
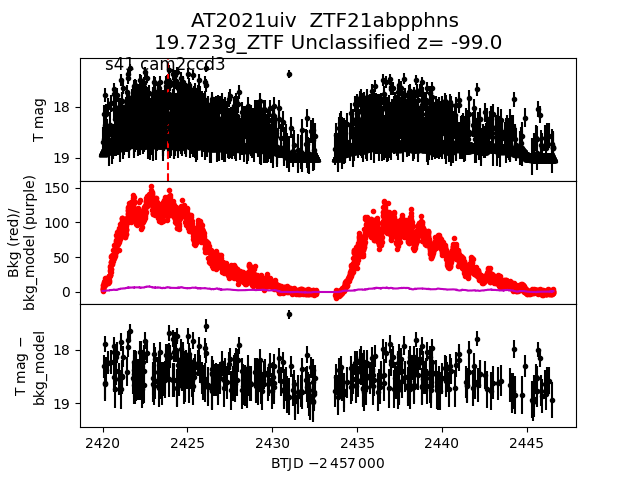
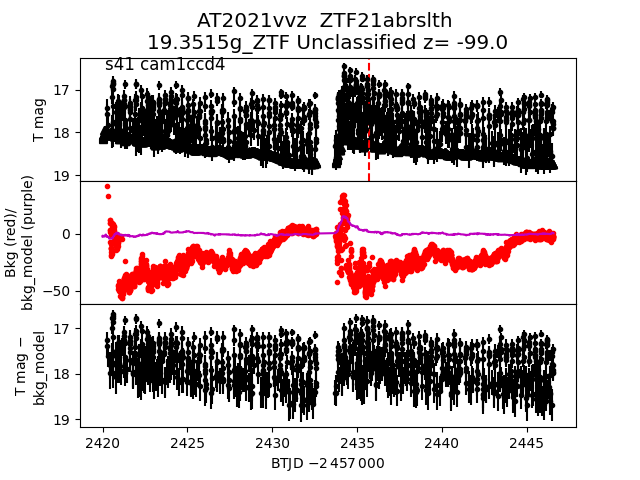
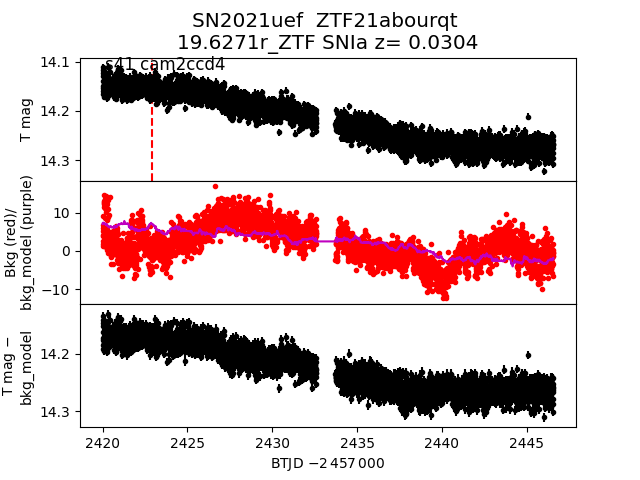
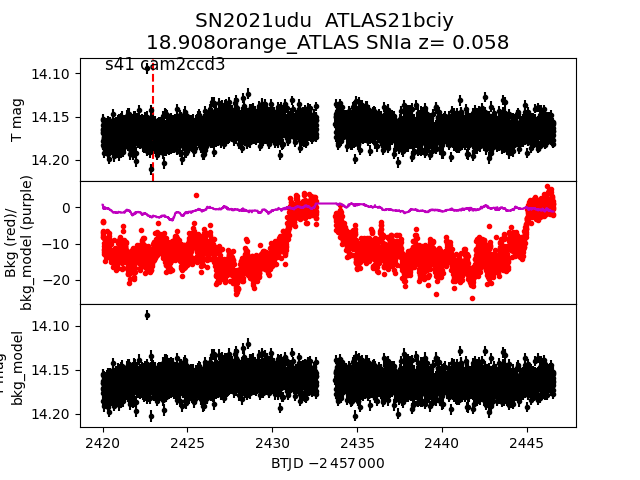
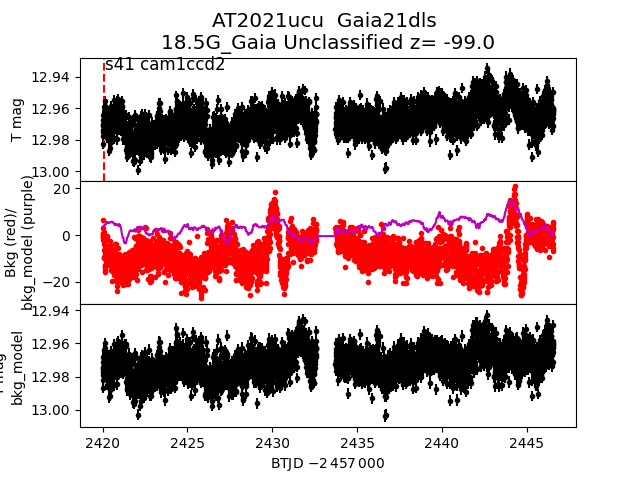
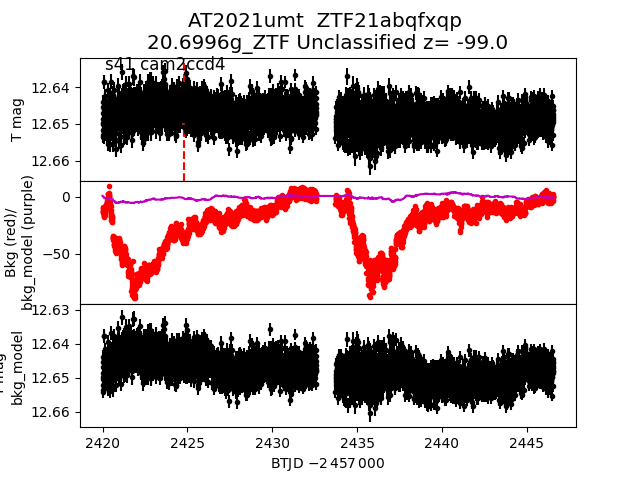
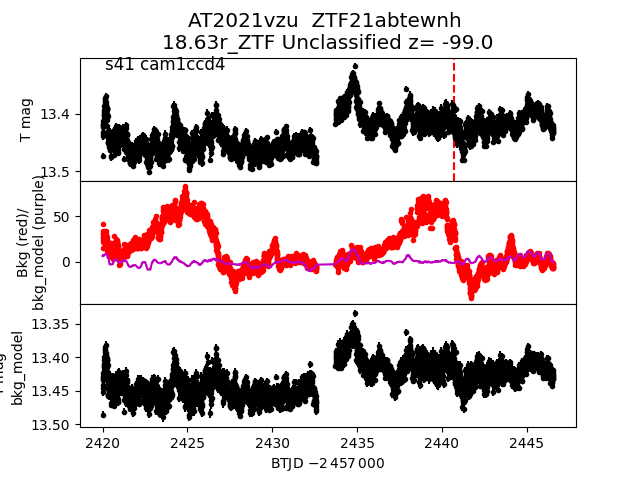
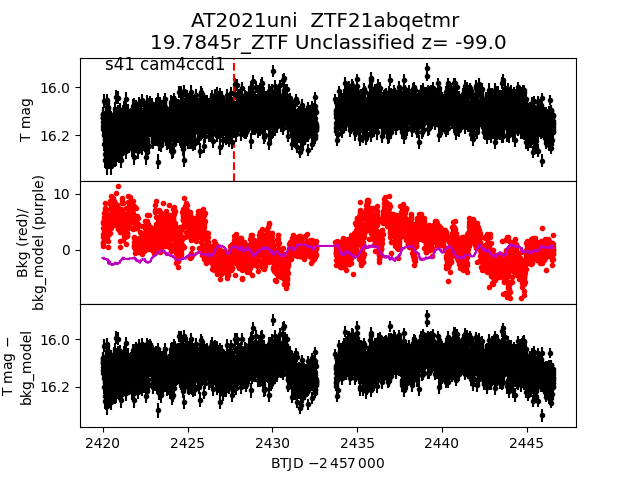
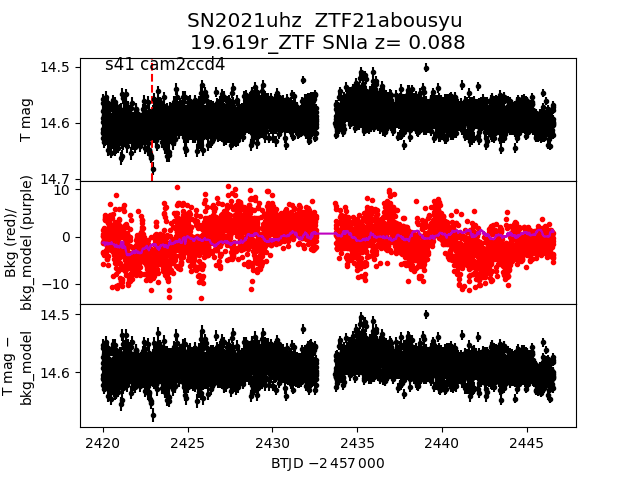
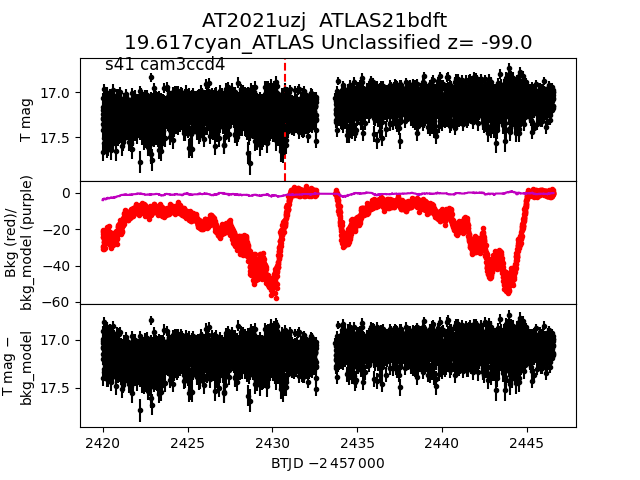
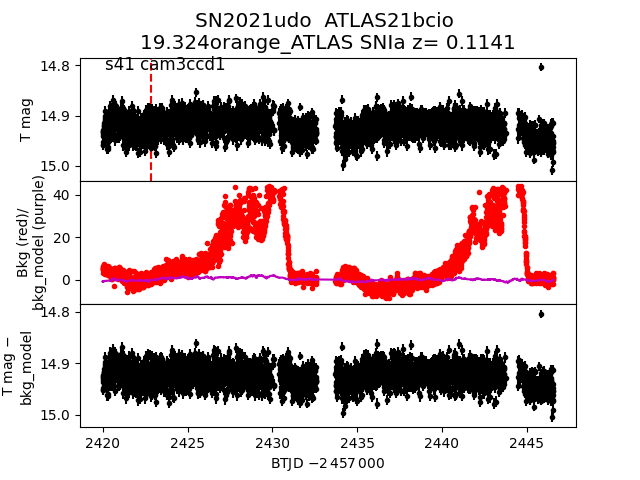
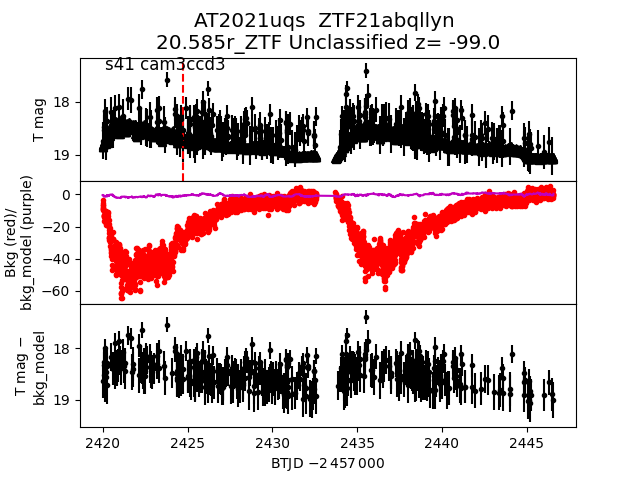
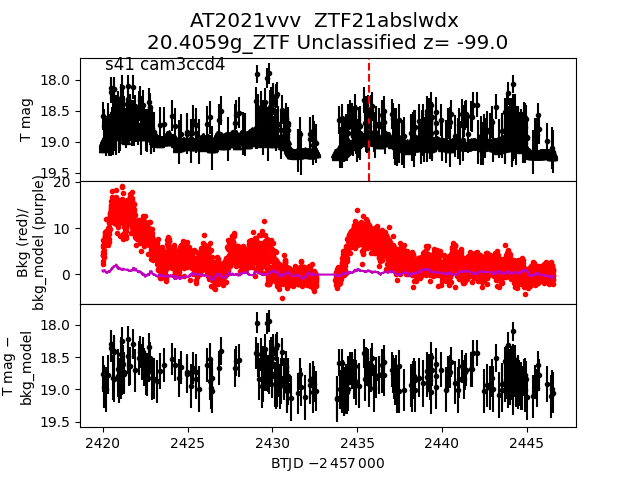
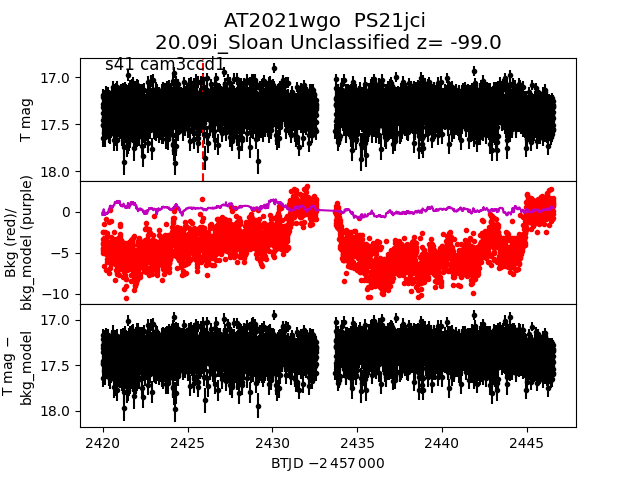
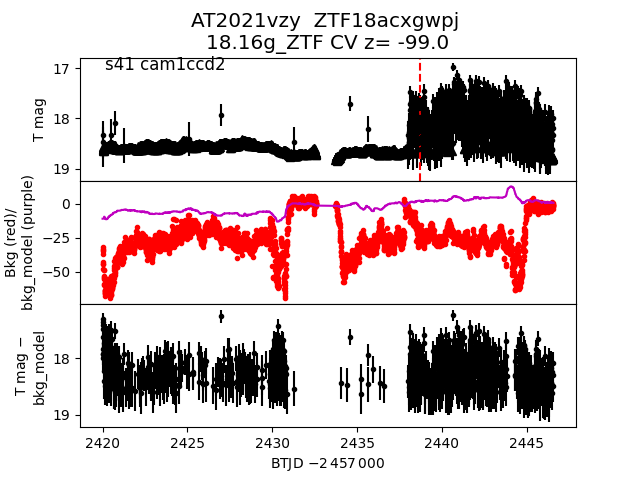
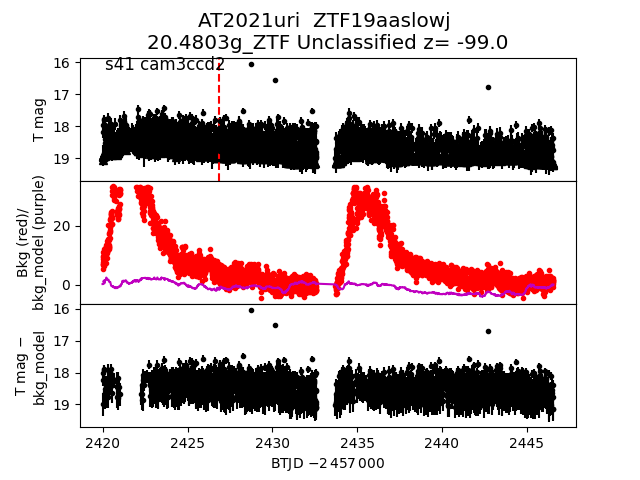
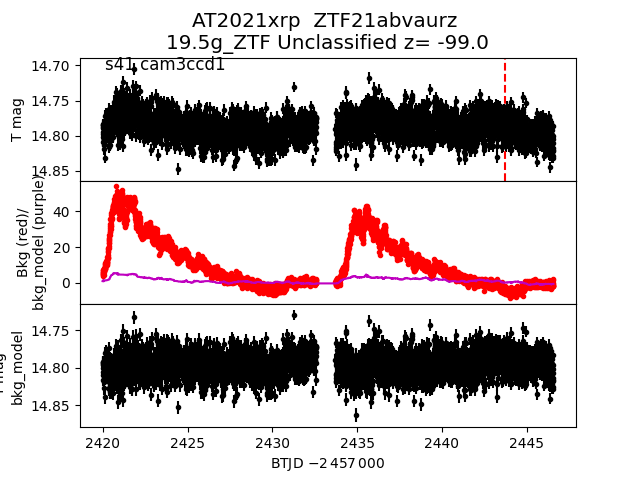
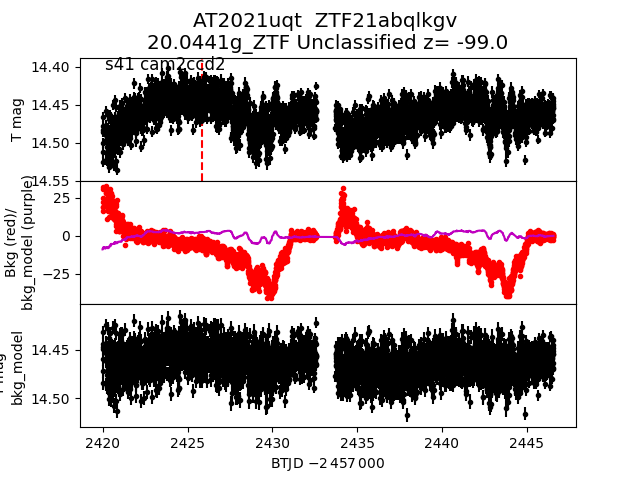
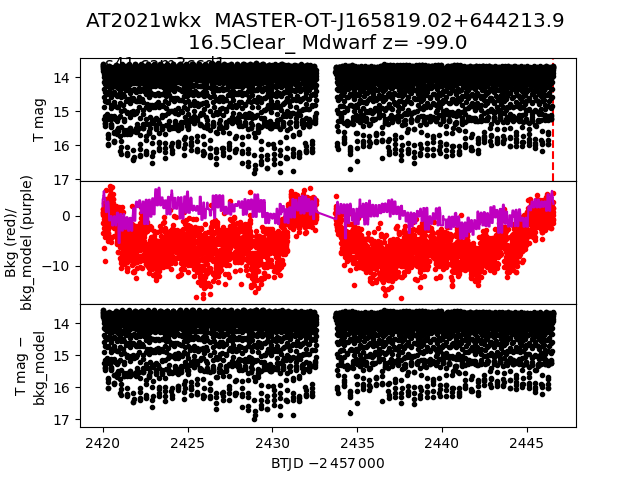
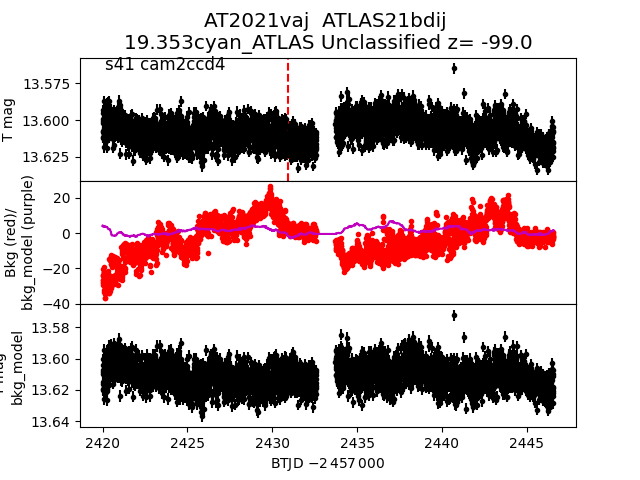
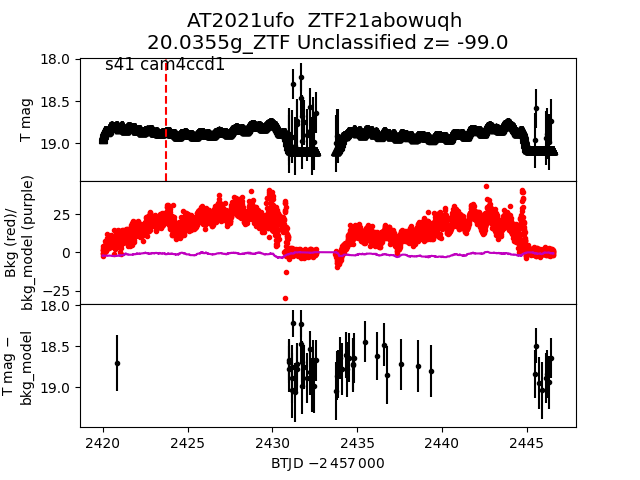
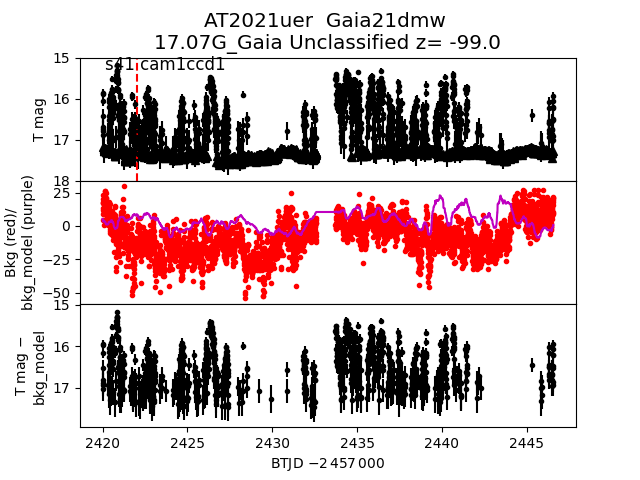
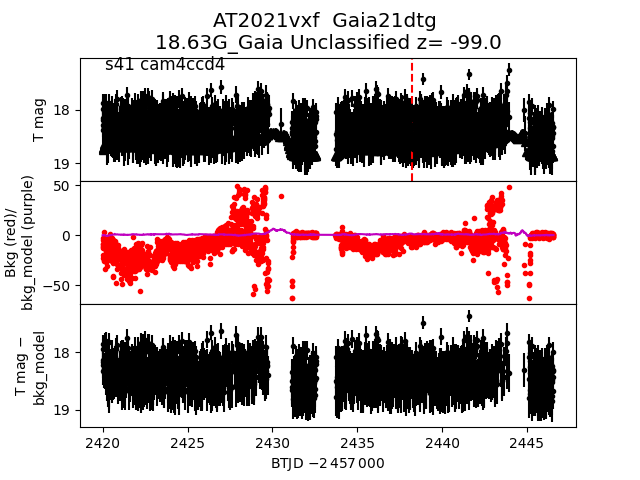
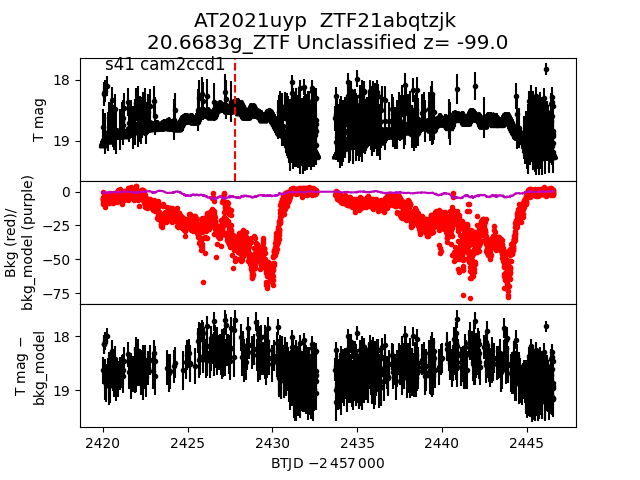
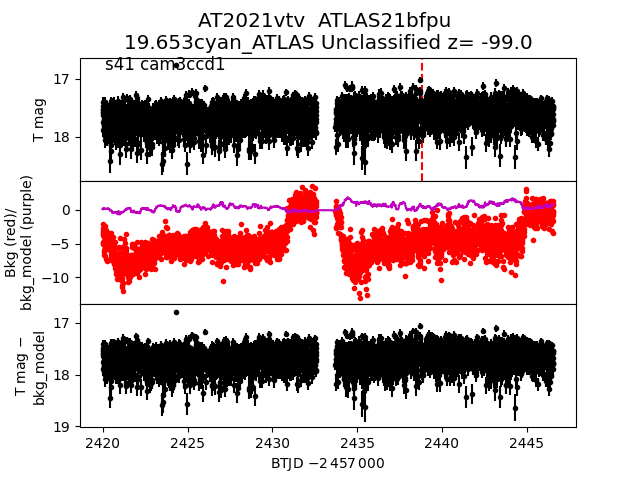
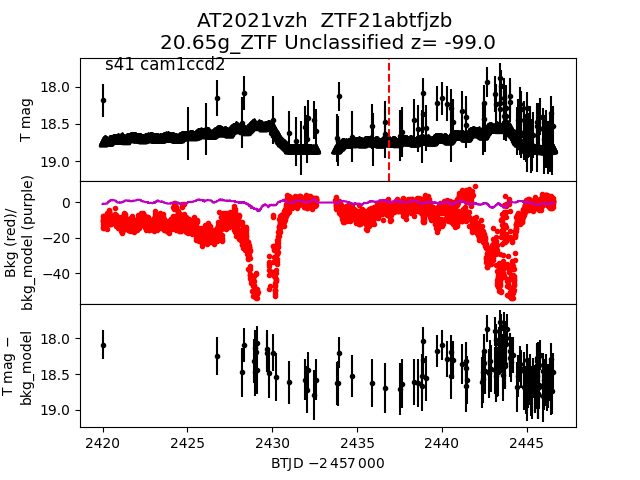
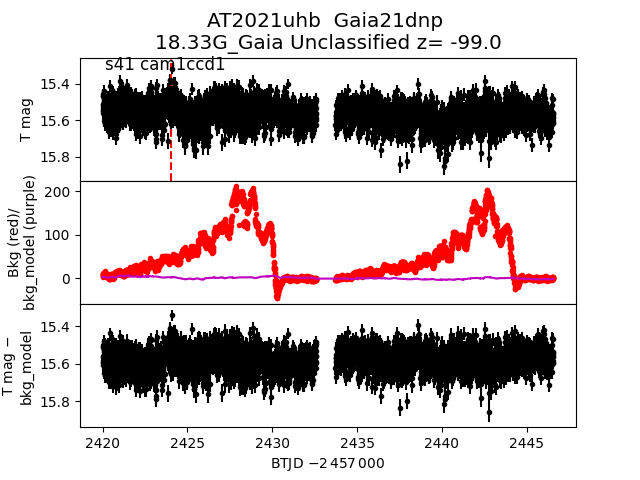
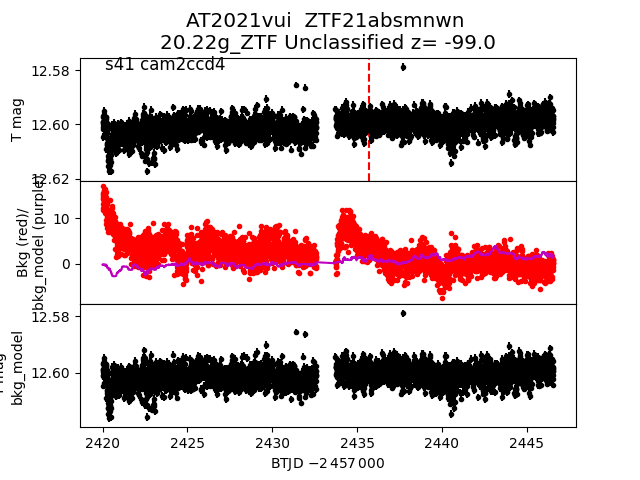
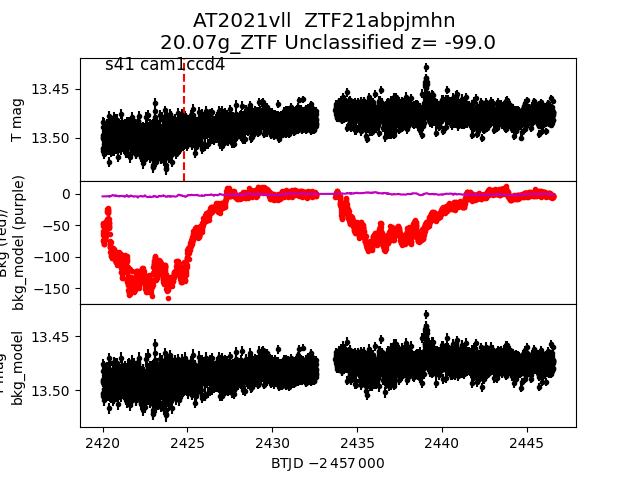
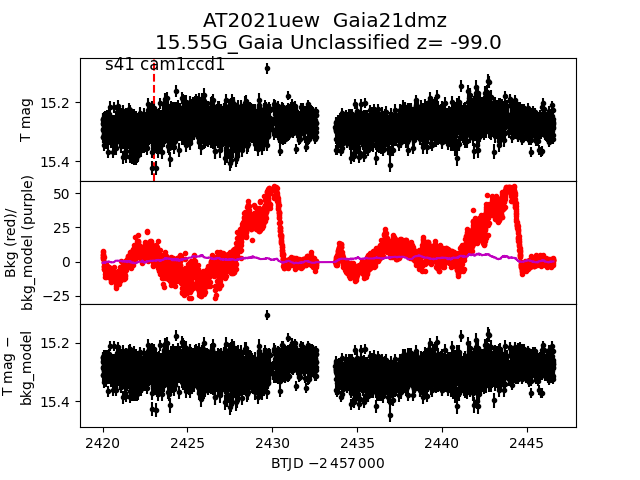
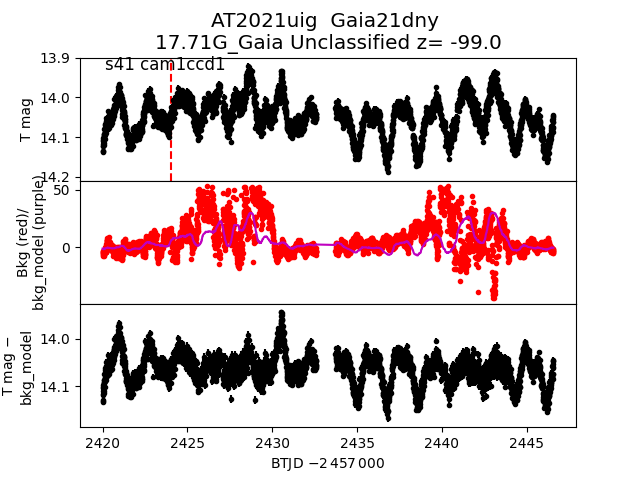
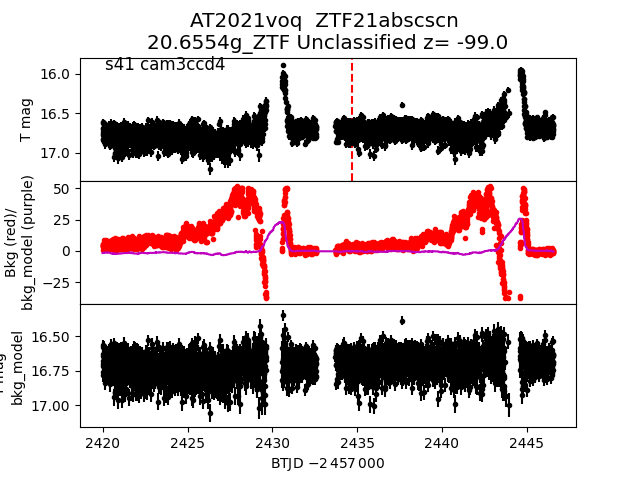
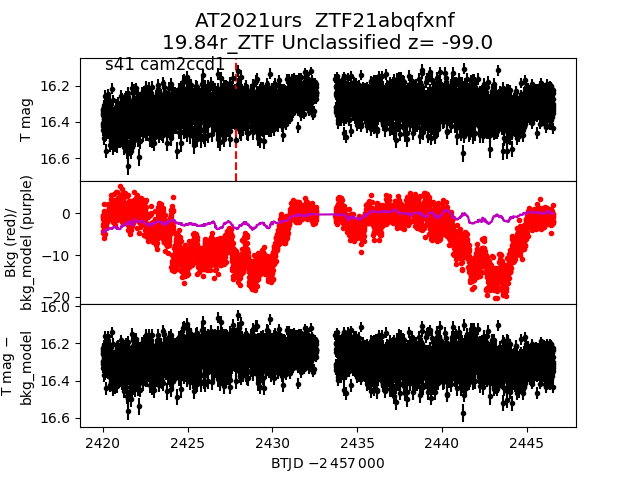
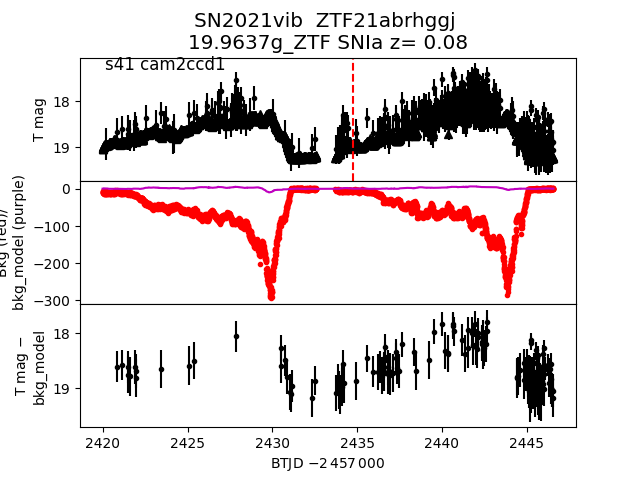
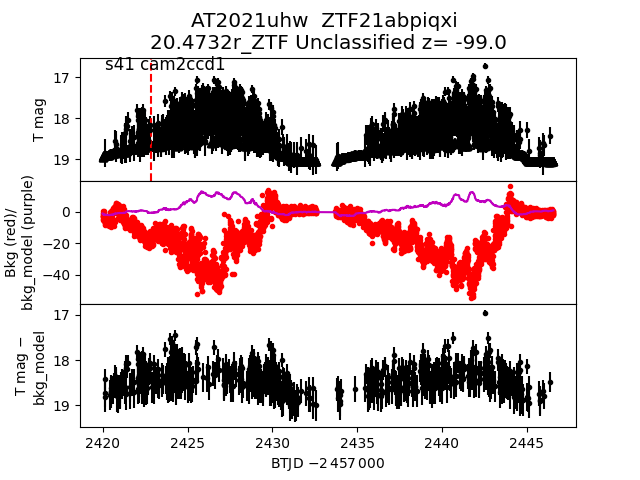
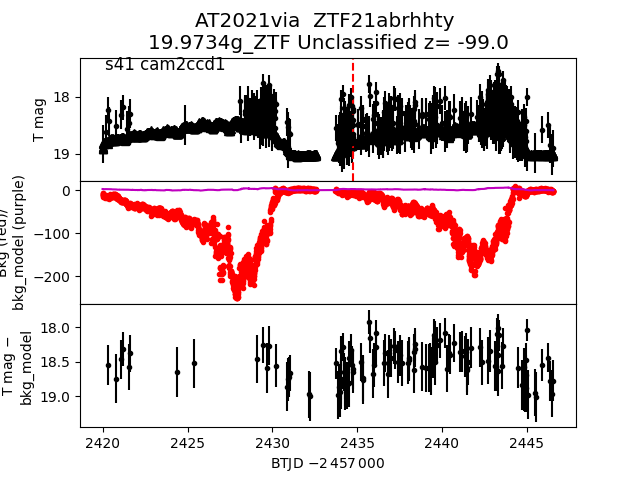
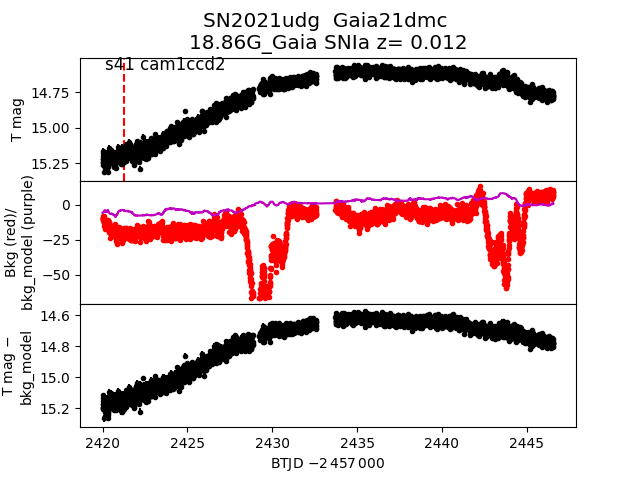
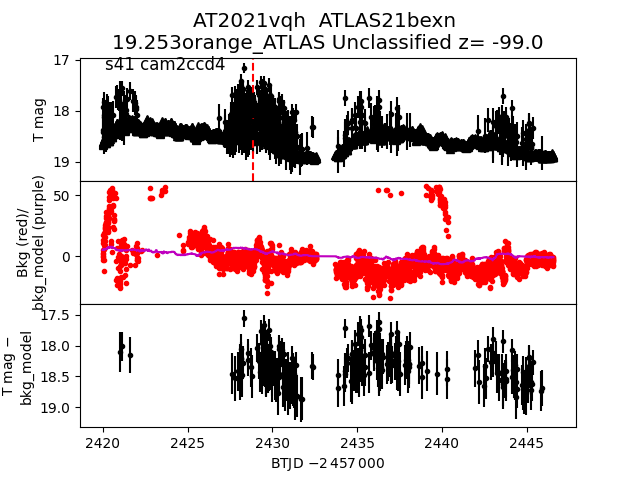
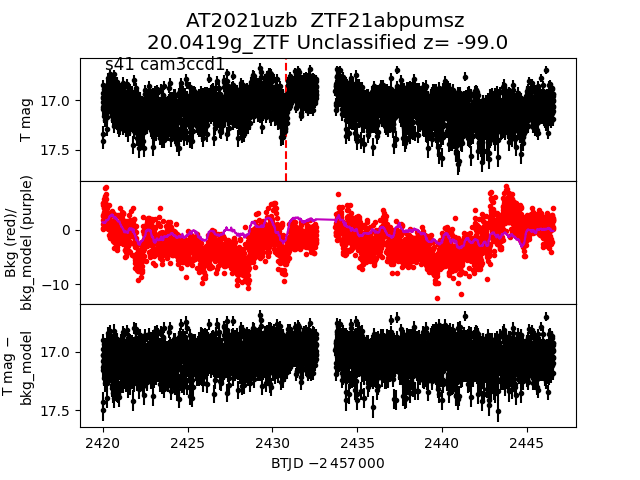
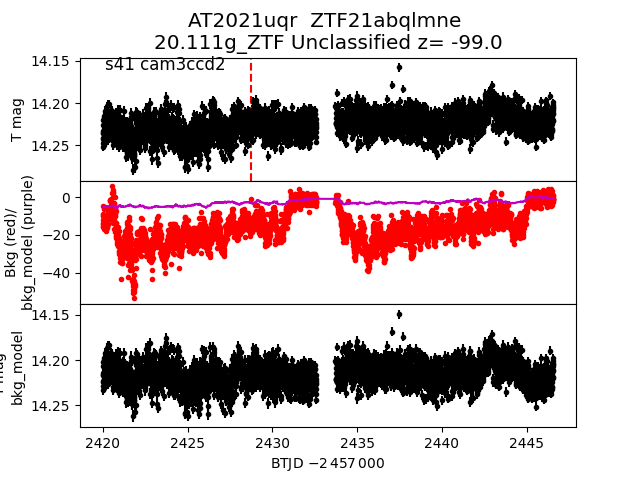
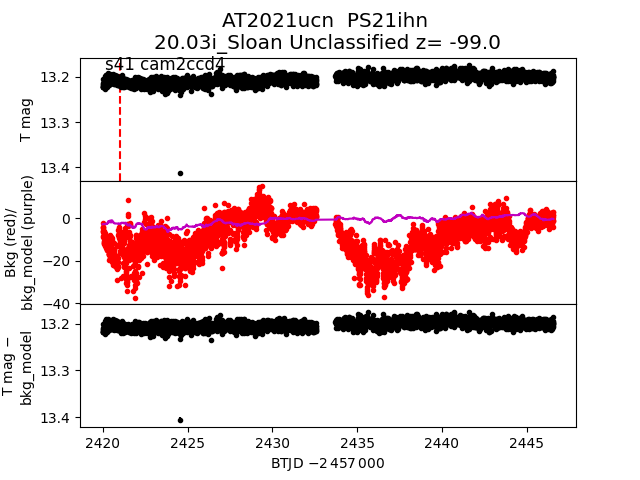
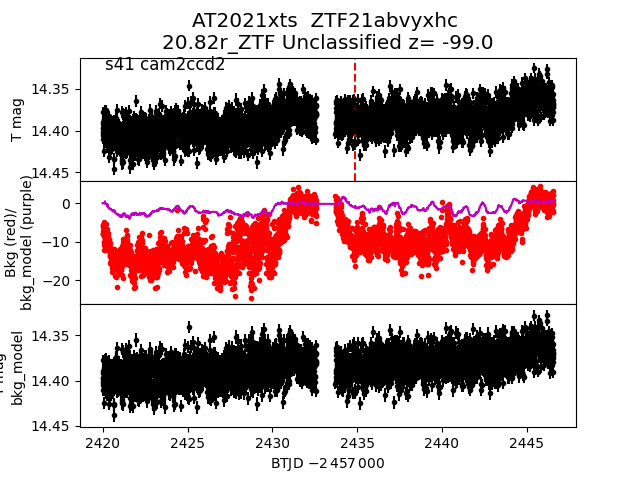
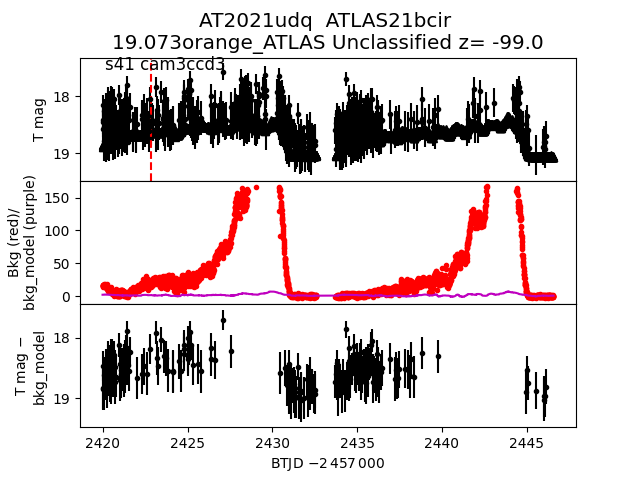
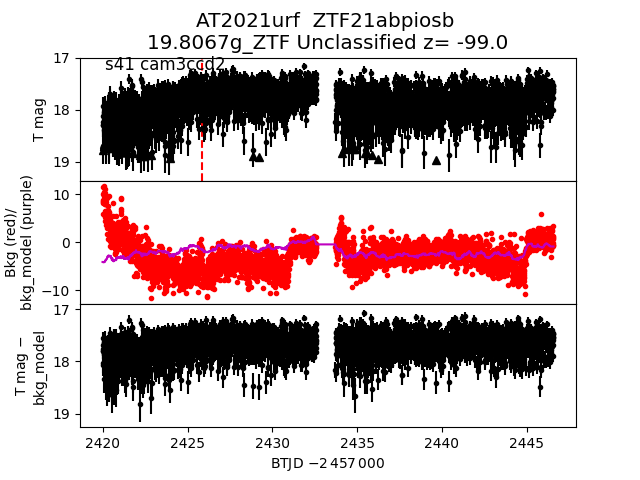
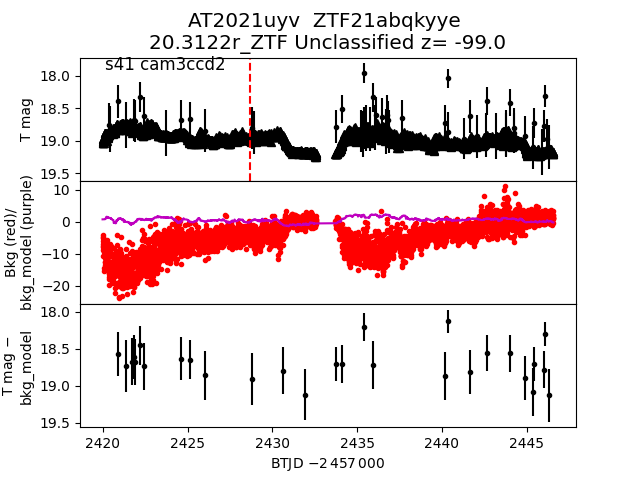
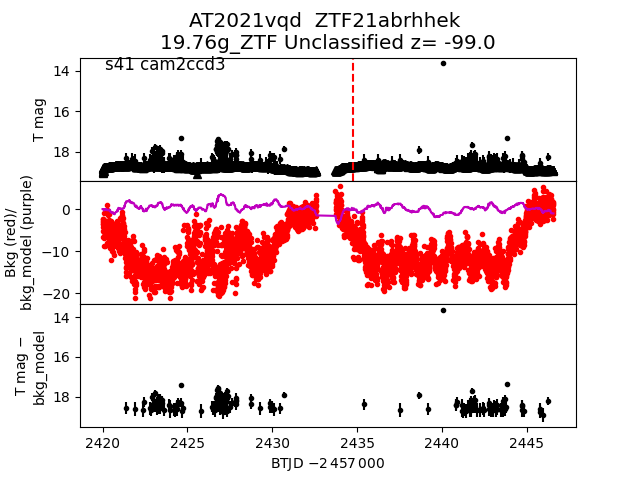
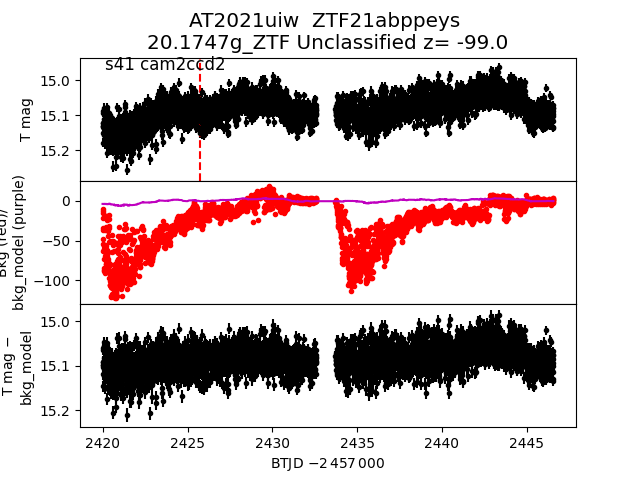
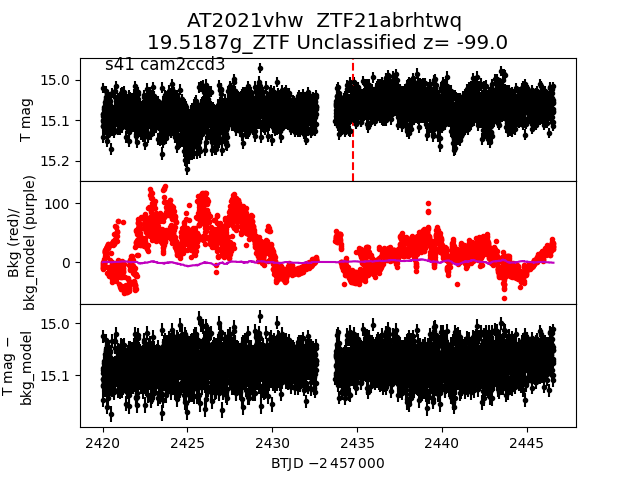
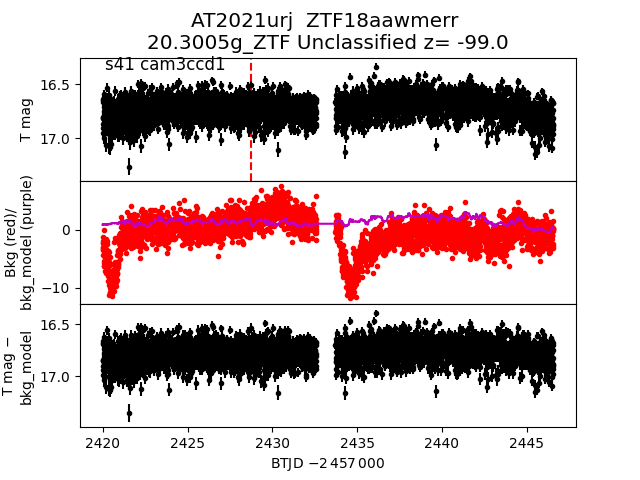
Each figure has three panels. The top panel shows the transient light curve, the middle panel shows the local background (estimated in an annulus), and the bottom panel shows a "background-model corrected" light curve. Details about the background model are in the README.
The vertical red line marks the time of discovery reported to TNS. Other useful metadata from TNS is in the figure title.
Note that the top and bottom panel are in magnitudes, while the middle panel is in differential flux units. The magnitudes are calibrated to the flux in the reference image used for image subtraction. Thus, flux from the host galaxy is included in these magnitudes.
3-sigma upper limits are plotted as triangles with no errorbars. A typical limiting magnitude is 19.6 in 30 minutes or 18.4 in 200 seconds (for low backgrounds).
The links allow you to download the light curve data as a text file.
More details in the README.
2021uef_detrended
 2021uio
 2021ucs
 2021ugn
 2021wkj
 2021wfs
 2021uez
 2021uof
 2021vwj
 2021utr
 2021uhp
 2021wgi
 2021vsa
 2021wnw
 2021uwy
 2021ues
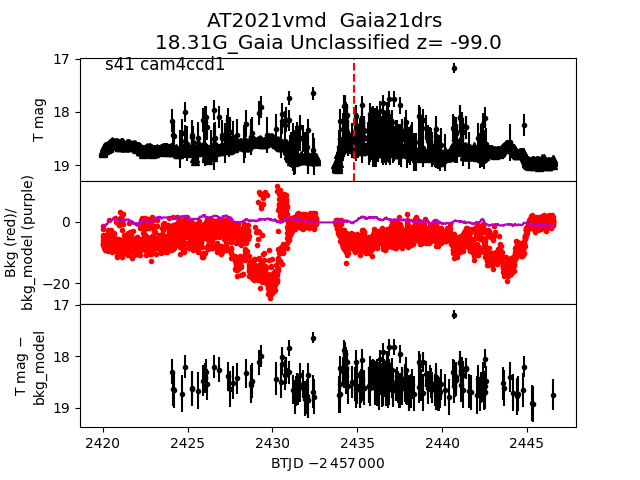
 2021vmd
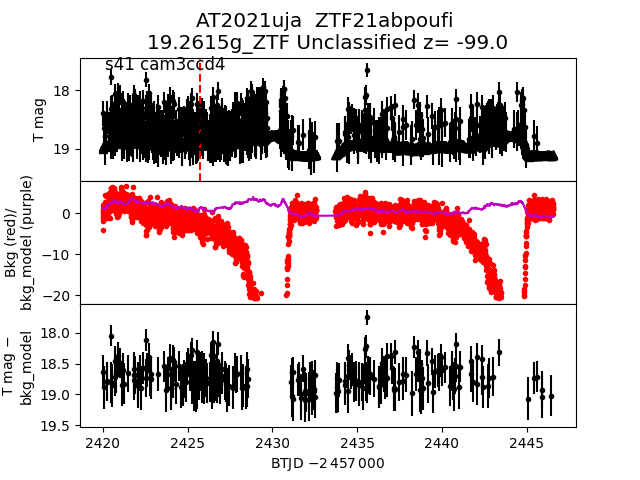
 2021uja
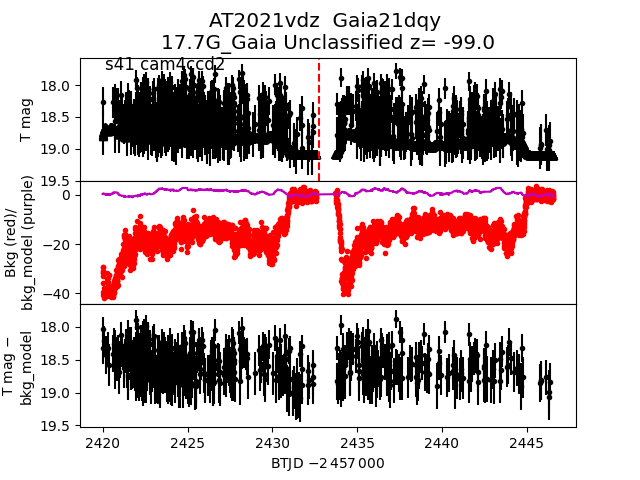
 2021vdz
 2021usx
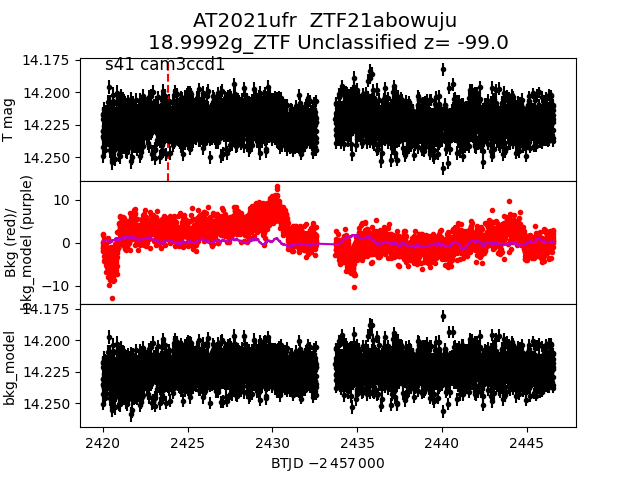
 2021ufr
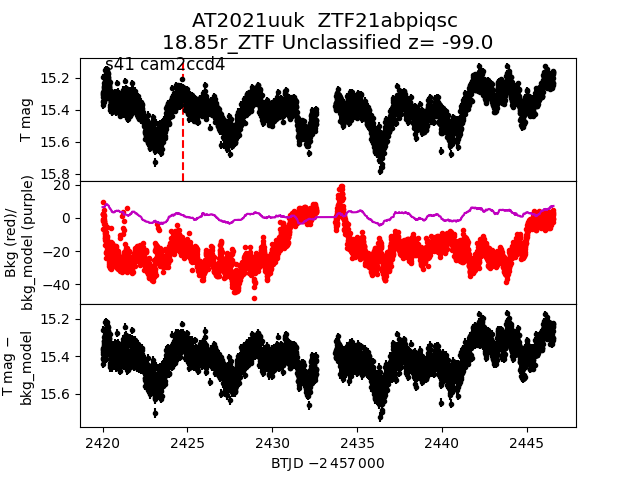
 2021uuk
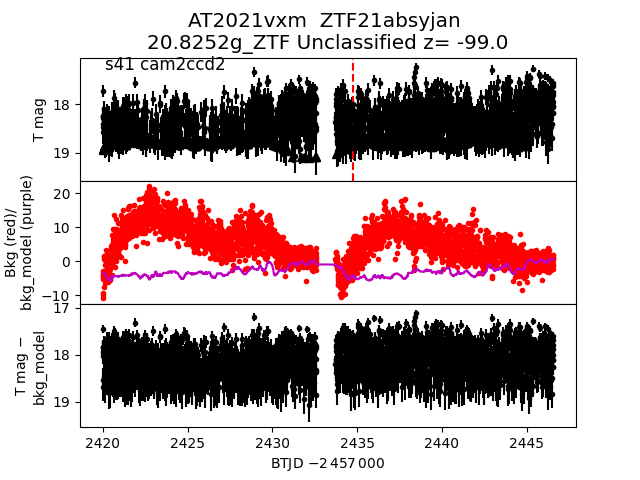
 2021vxm
 2021wfy
 2021vvl
 2021uyd
 2021uiv
 2021vvz
 2021uef
 2021udu
 2021ucu
 2021umt
 2021vzu
 2021uni
 2021uhz
 2021uzj
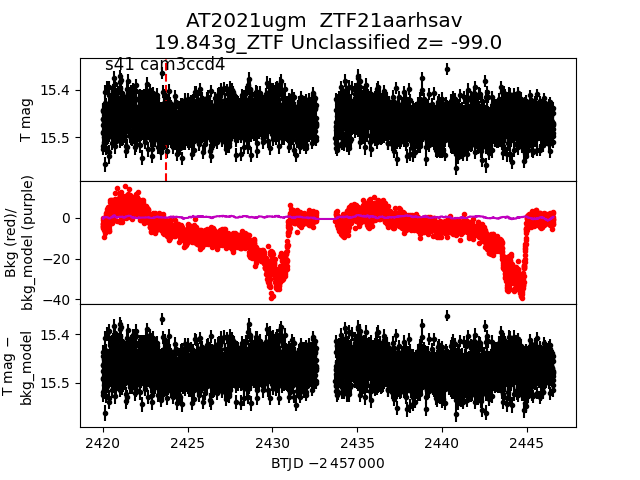
 2021ugm
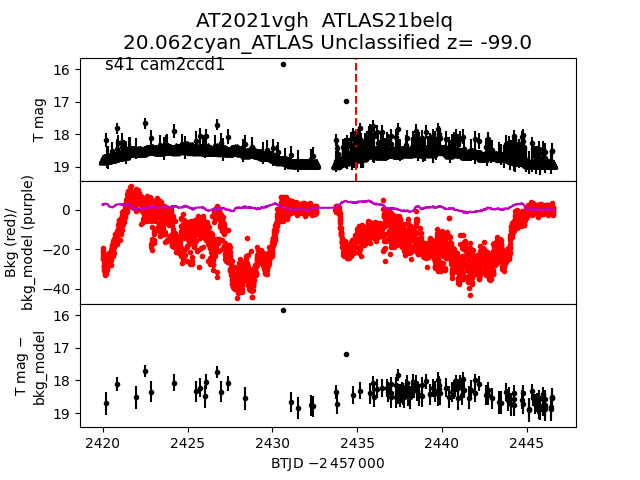
 2021vgh
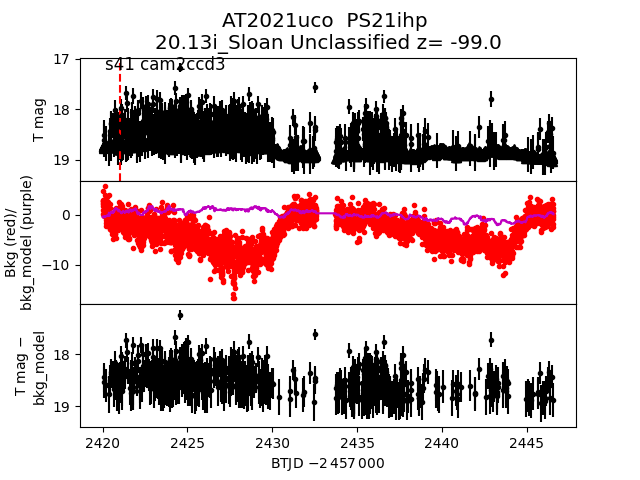
 2021uco
 2021udo
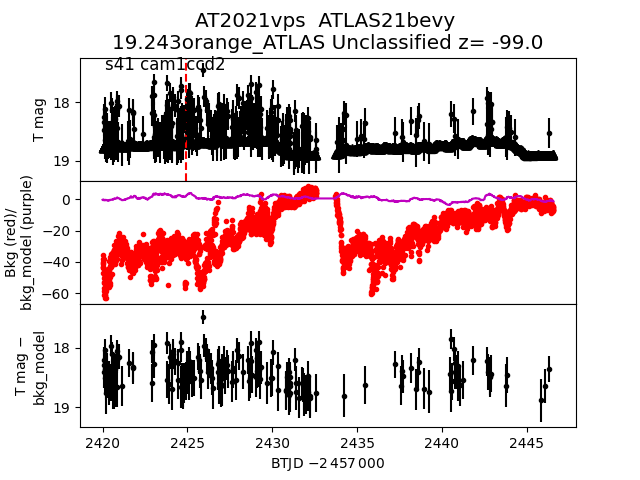
 2021vps
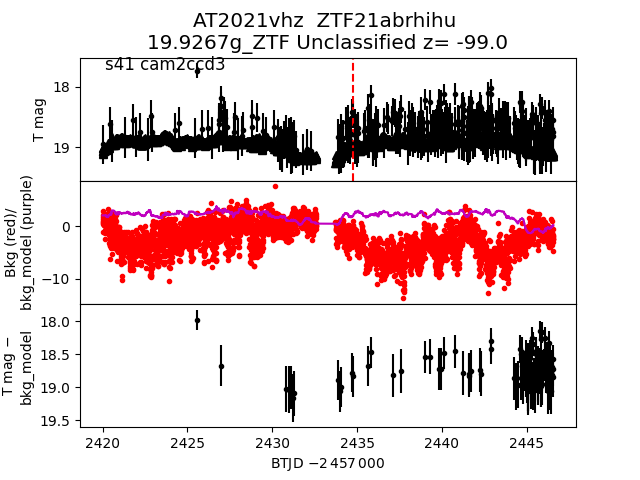
 2021vhz
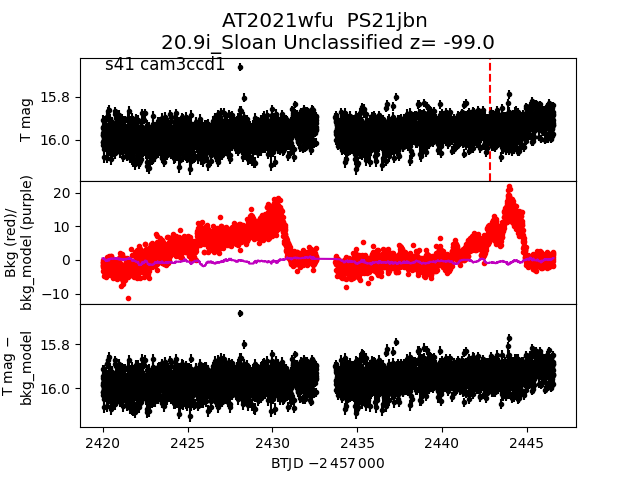
 2021wfu
 2021uqs
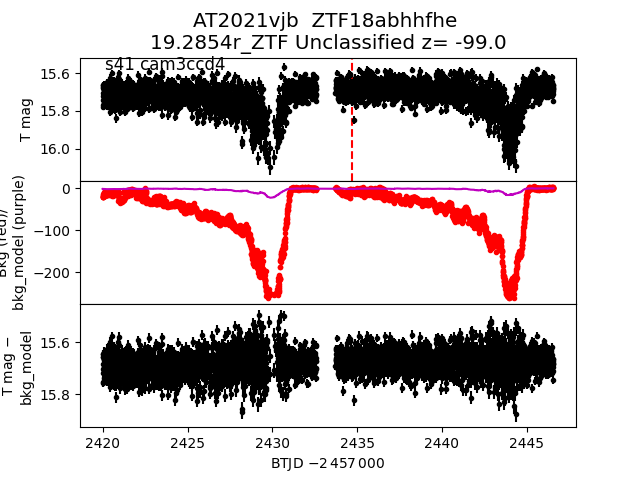
 2021vjb
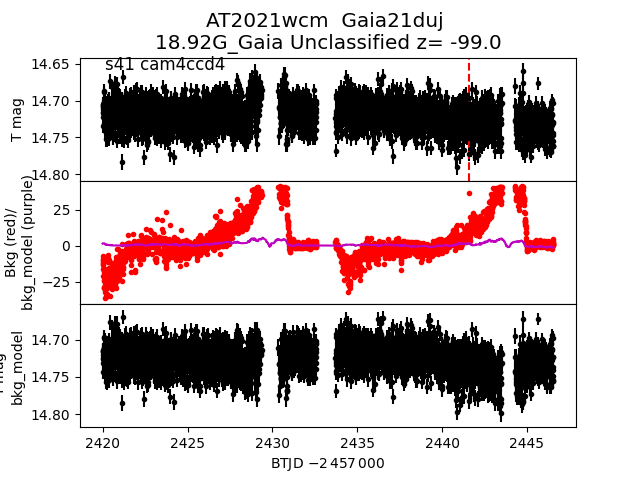
 2021wcm
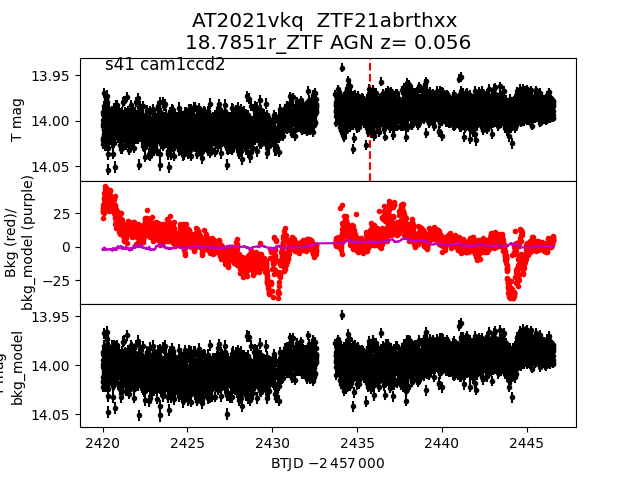
 2021vkq
 2021vvv
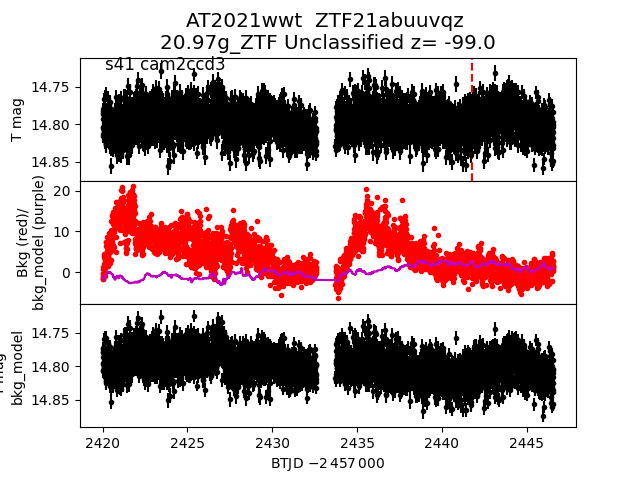
 2021wwt
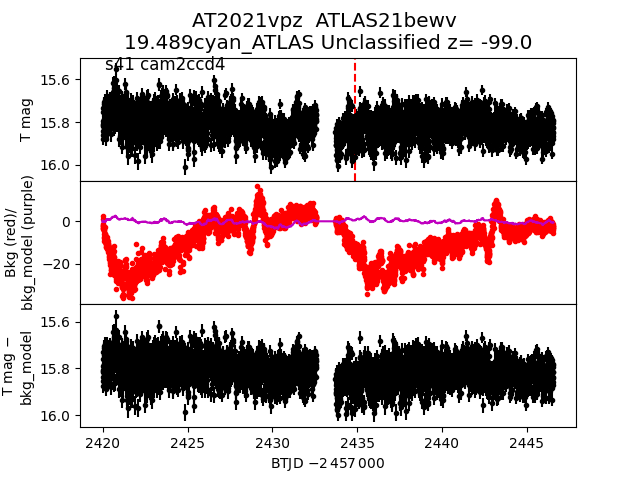
 2021vpz
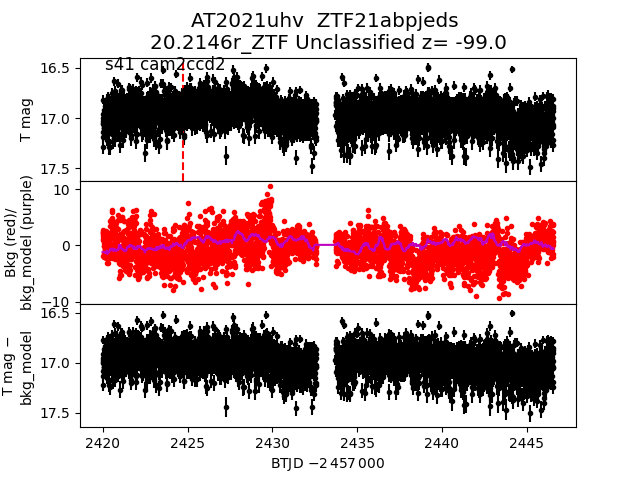
 2021uhv
 2021wgo
 2021vzy
 2021uri
 2021xrp
 2021uqt
 2021wkx
 2021vaj
 2021ufo
 2021uer
 2021vxf
 2021uyp
 2021vtv
 2021vzh
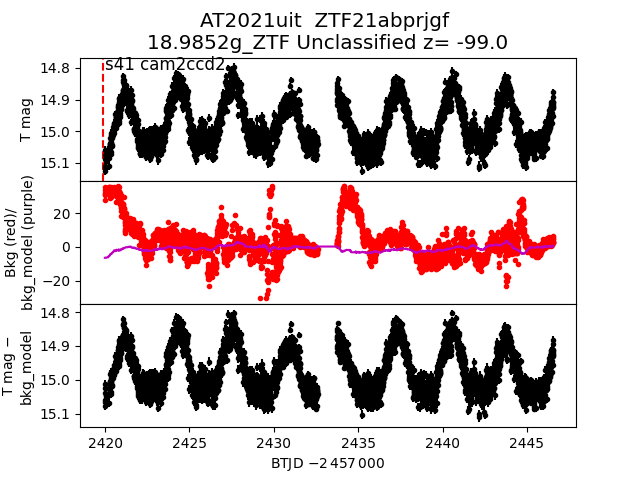
 2021uit
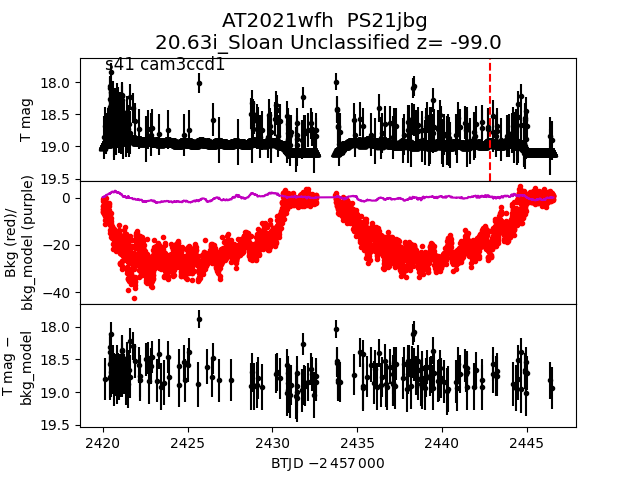
 2021wfh
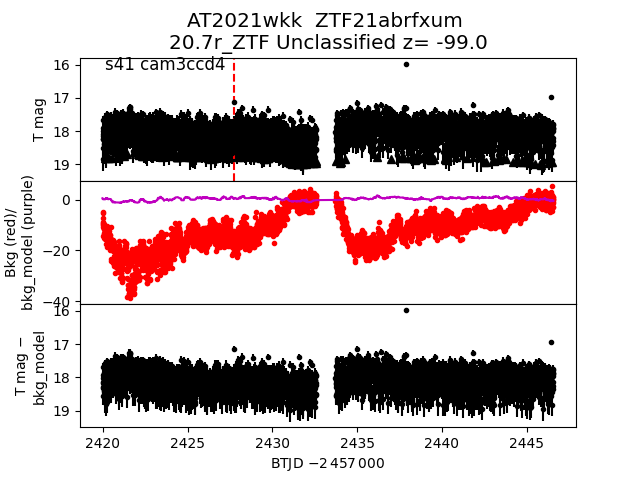
 2021wkk
 2021uhb
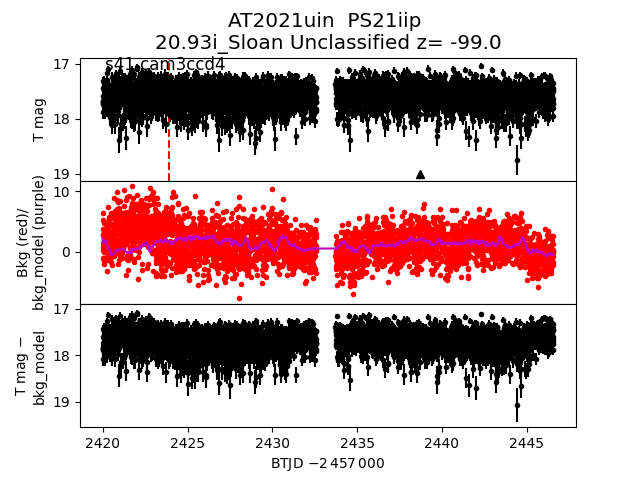
 2021uin
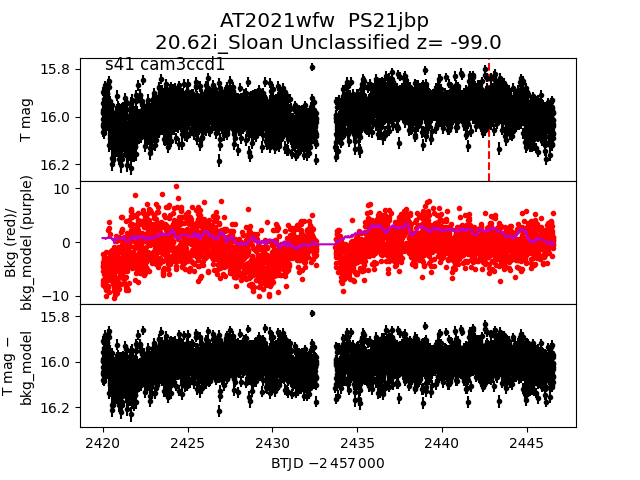
 2021wfw
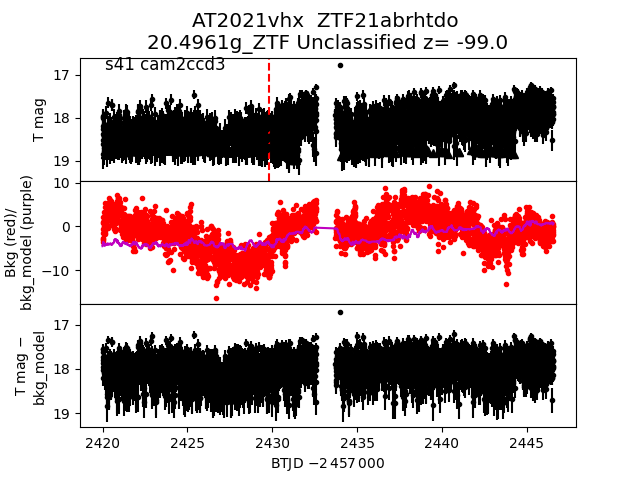
 2021vhx
 2021vui
 2021vll
 2021uew
 2021uig
 2021voq
 2021urs
 2021vib
 2021uhw
 2021via
 2021udg
 2021vqh
 2021uzb
 2021uqr
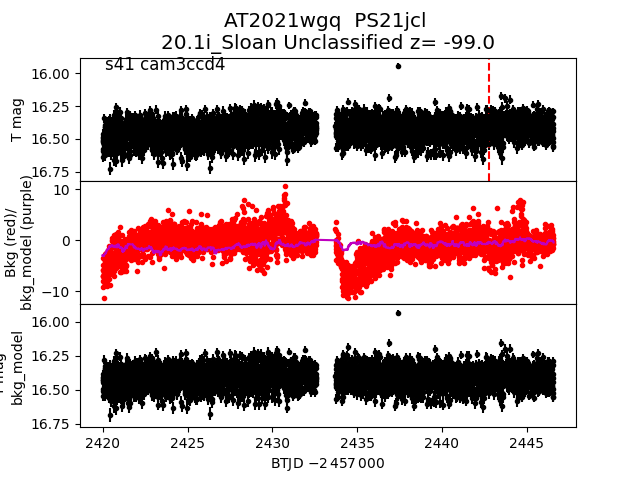
 2021wgq
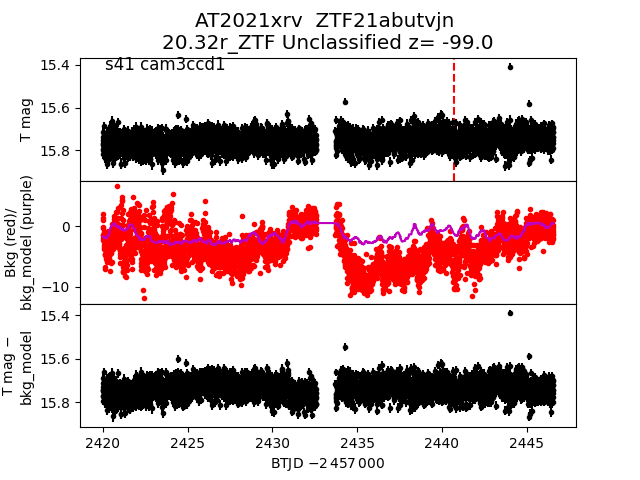
 2021xrv
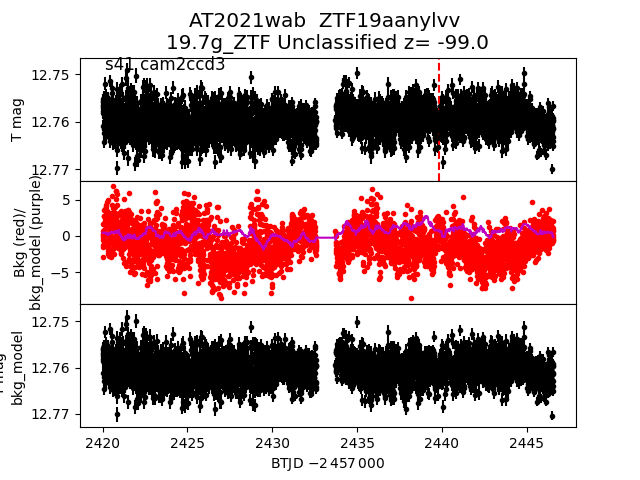
 2021wab
 2021ucn
 2021xts
 2021udq
 2021urf
 2021uyv
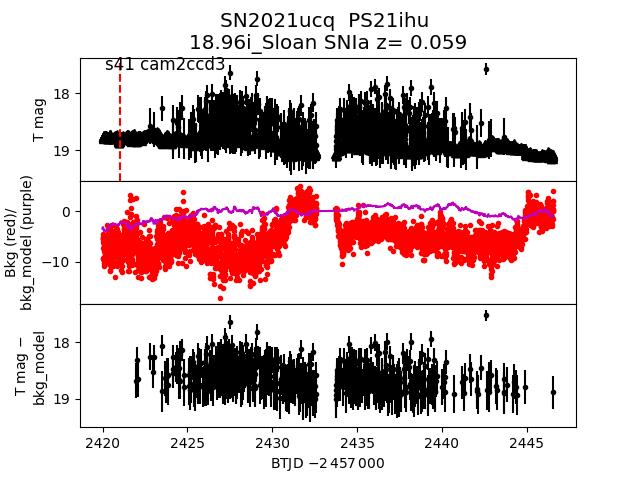
 2021ucq
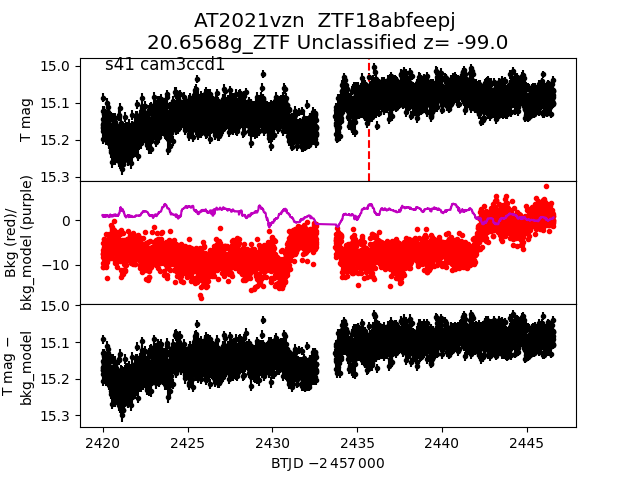
 2021vzn
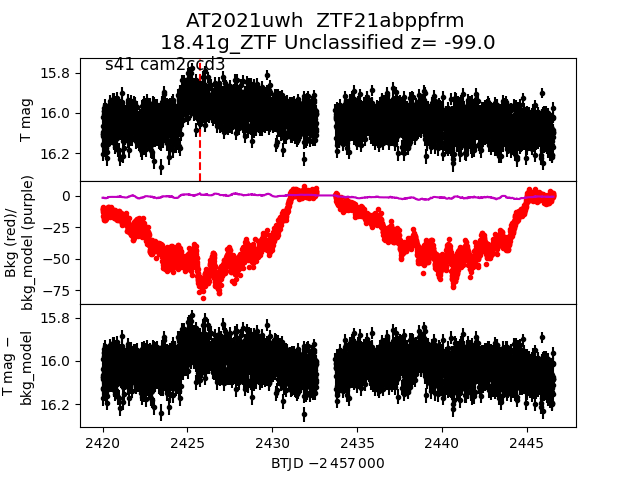
 2021uwh
 2021vqd
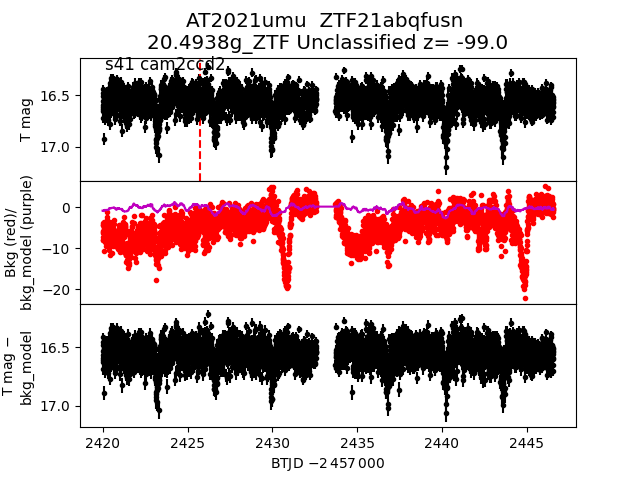
 2021umu
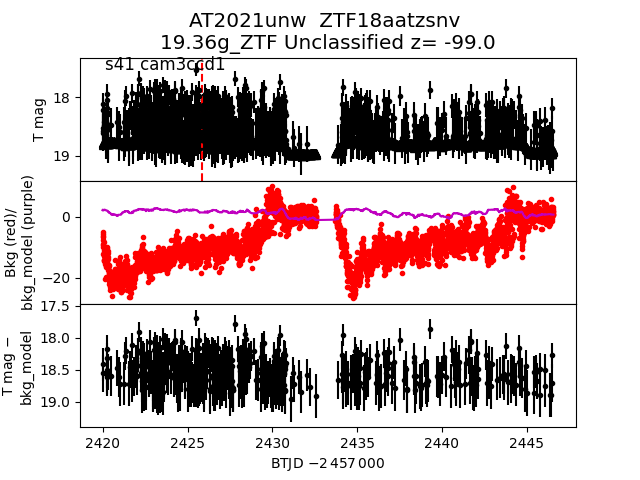
 2021unw
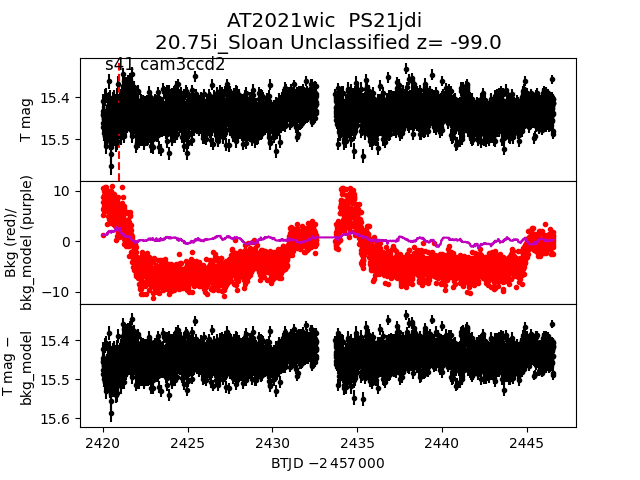
 2021wic
 2021uiw
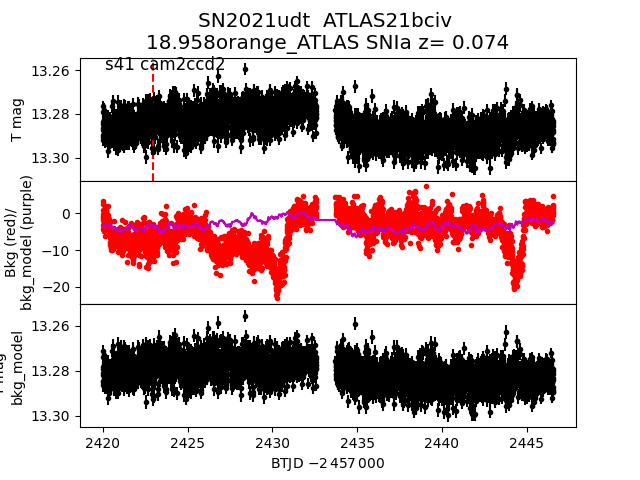
 2021udt
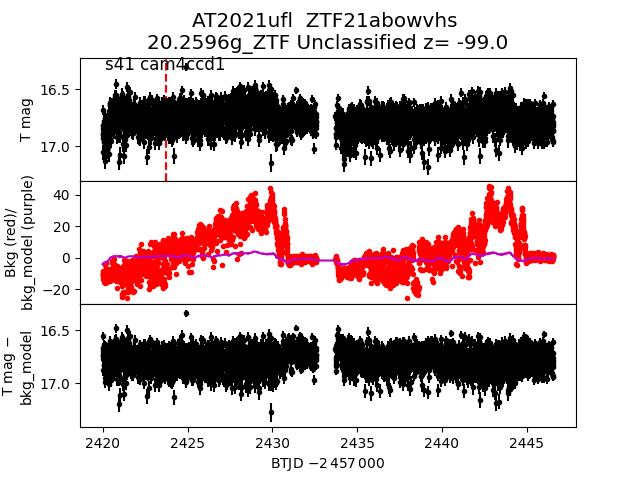
 2021ufl
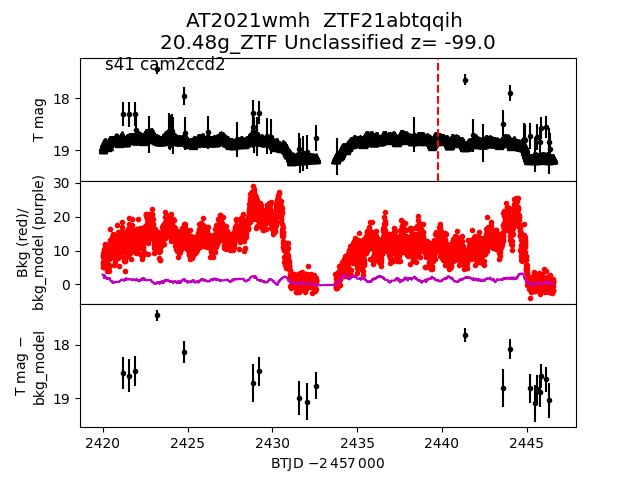
 2021wmh
 2021vhw
 2021urj
 2021why