all transients in sector39 (36 total)
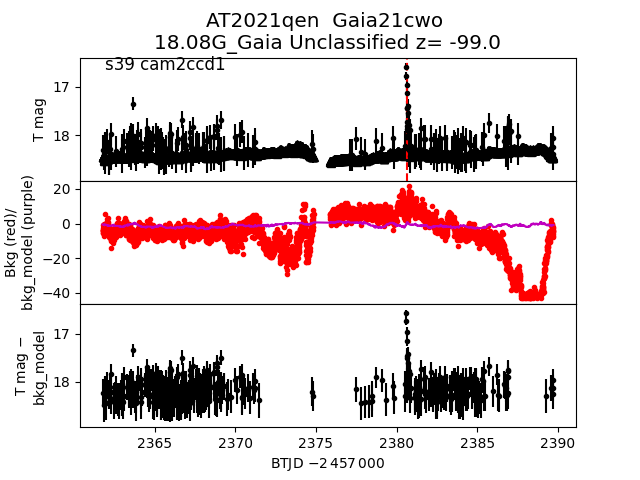
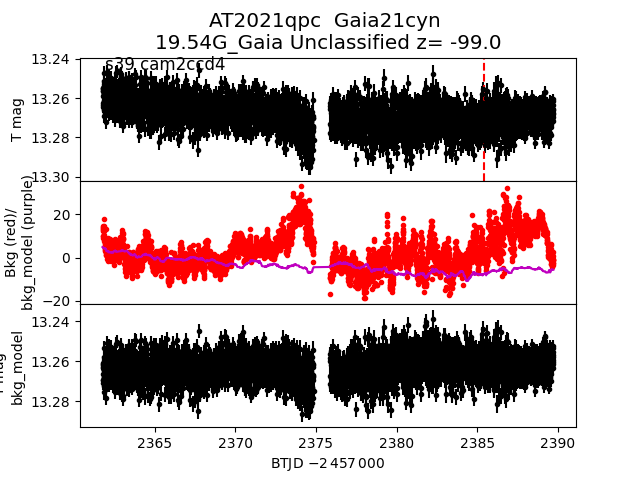
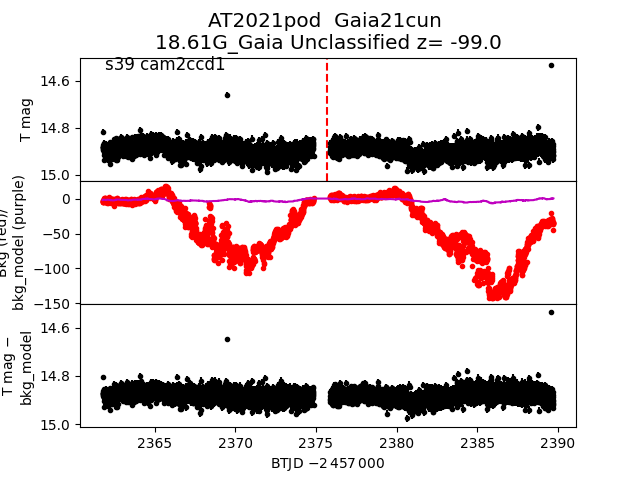
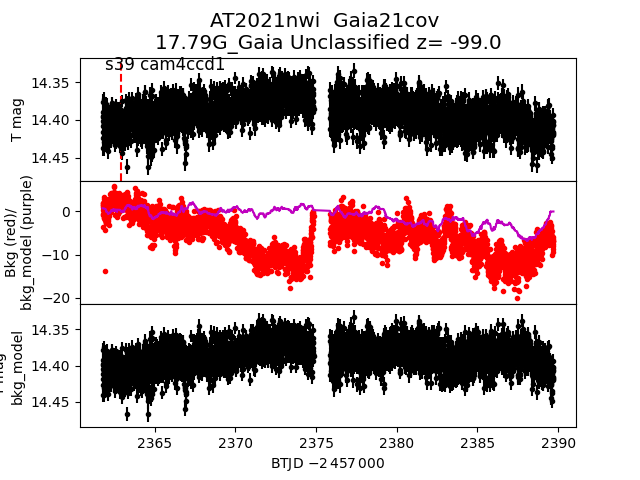
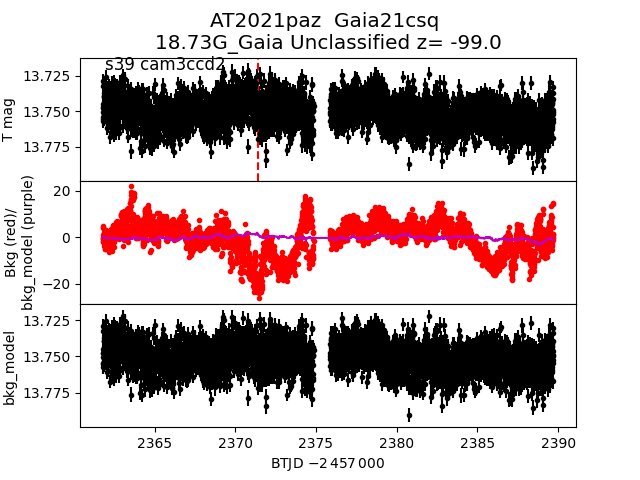
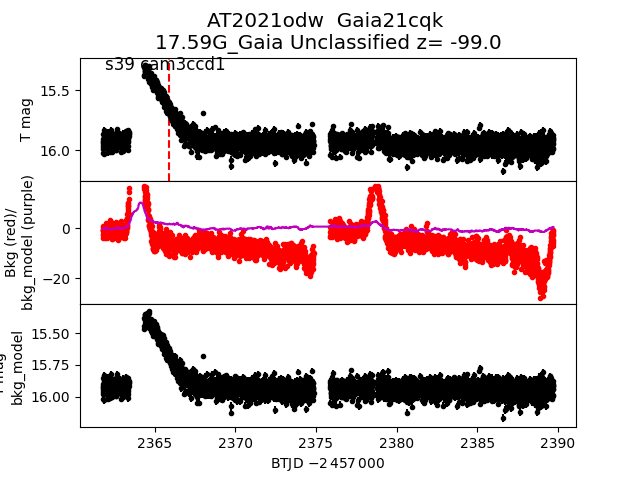
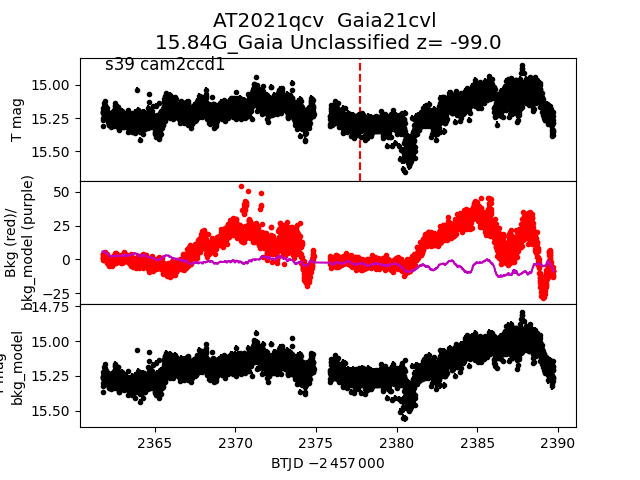
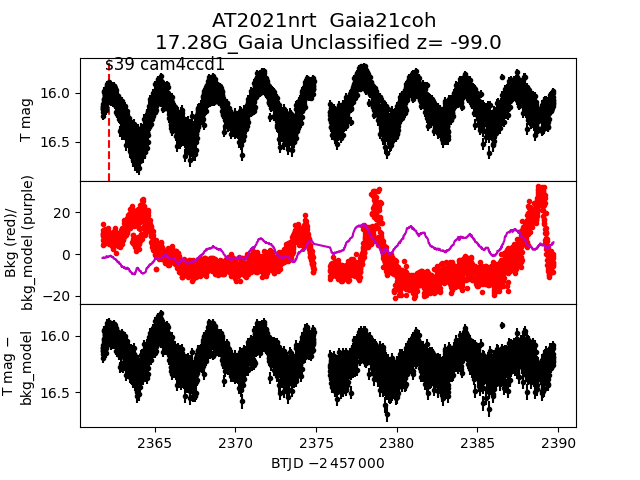
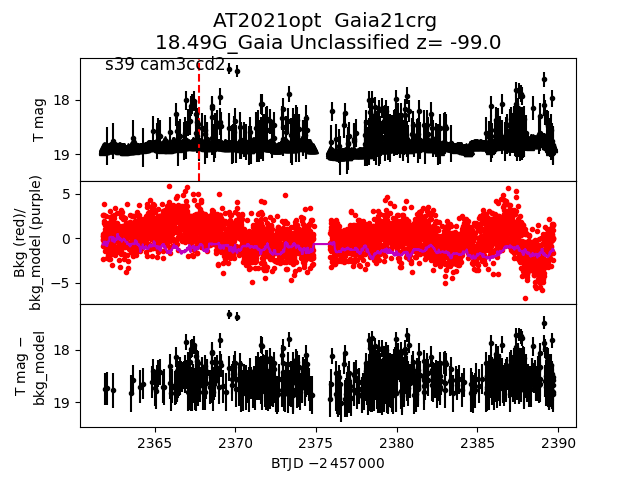
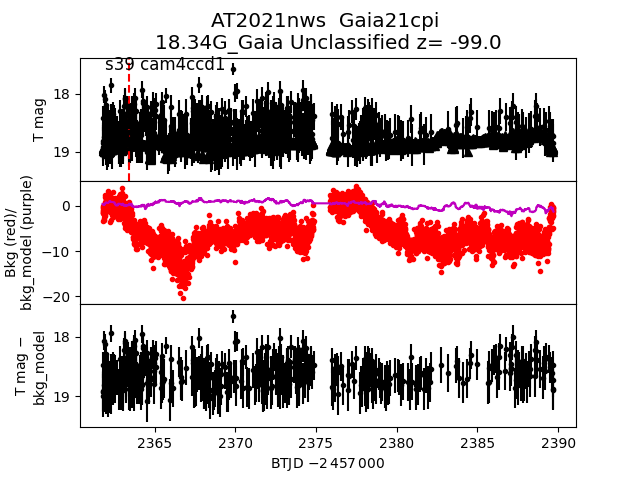
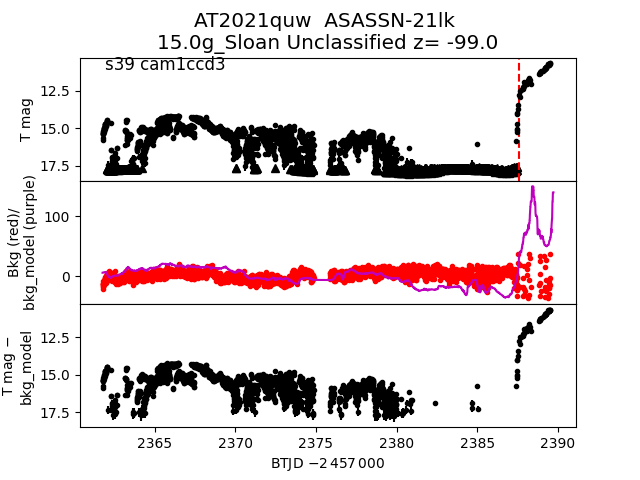
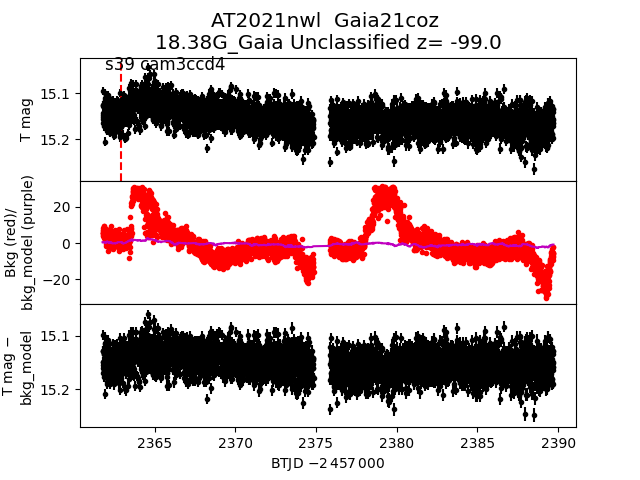
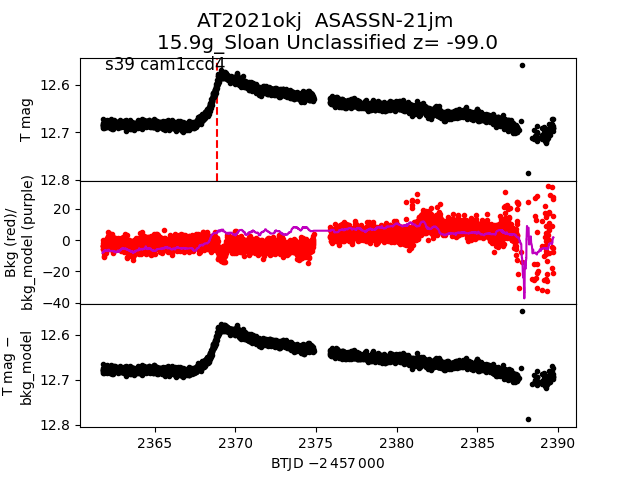
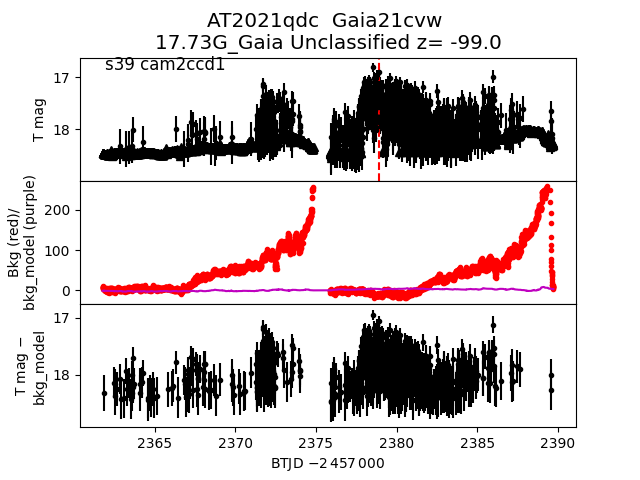
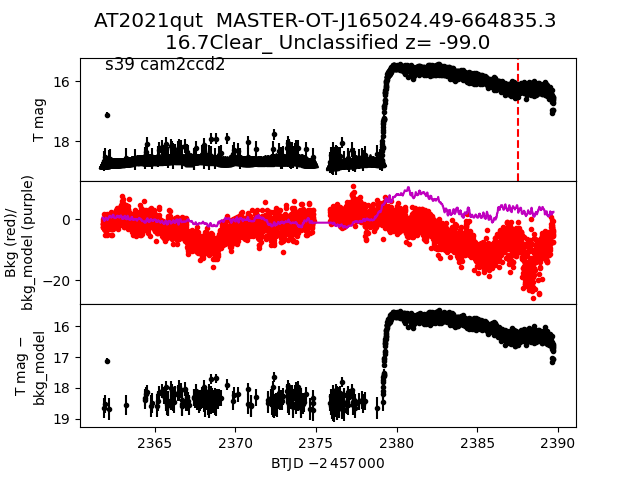
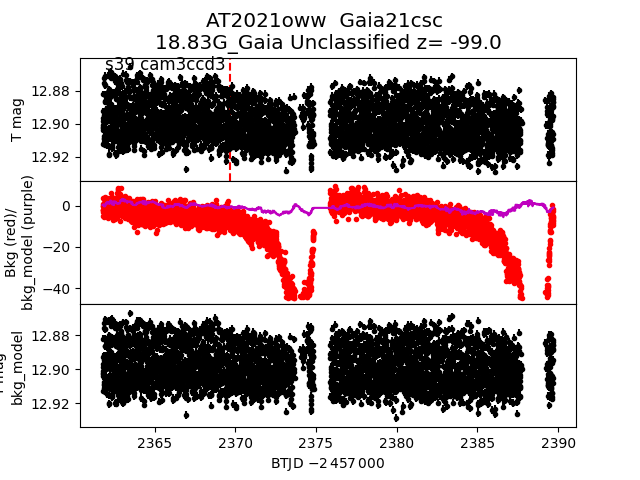
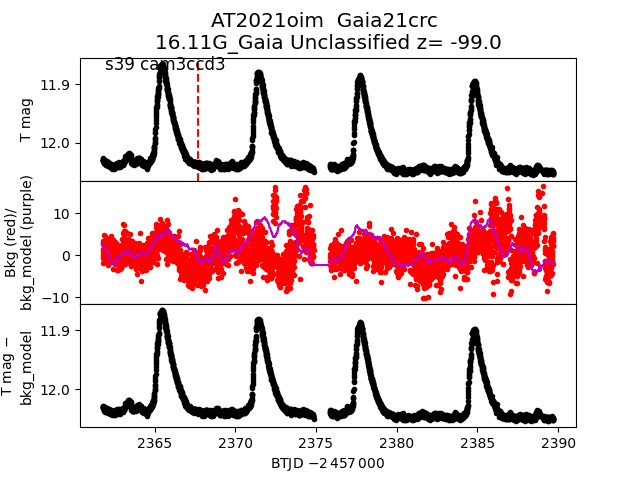
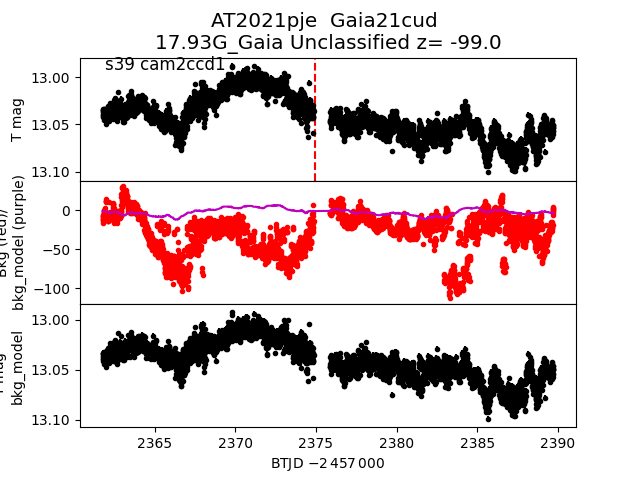
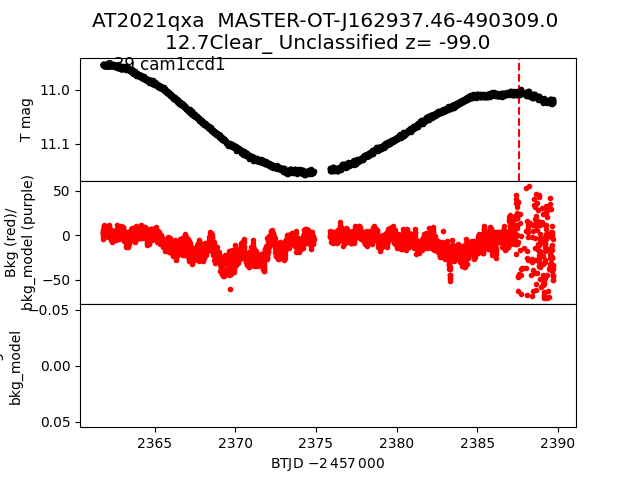
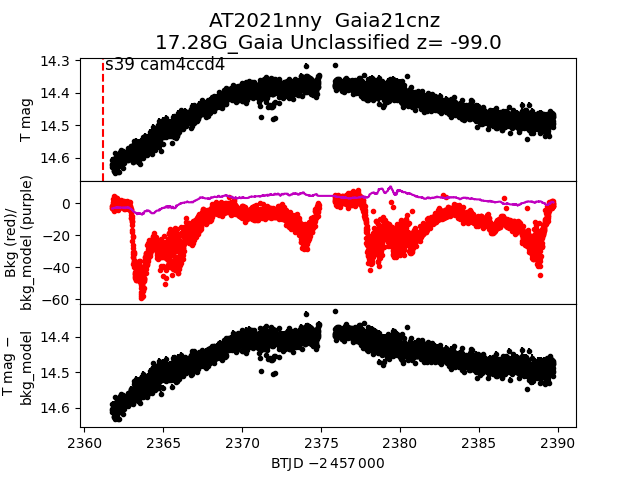
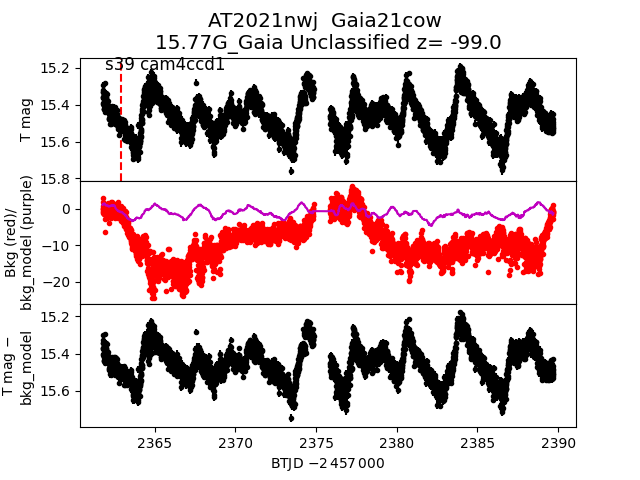
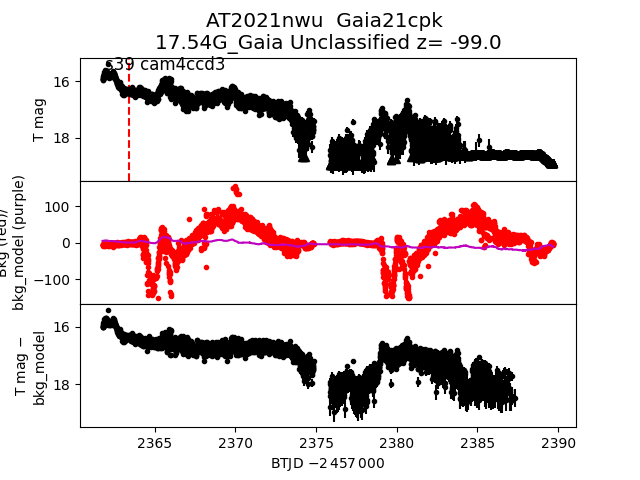
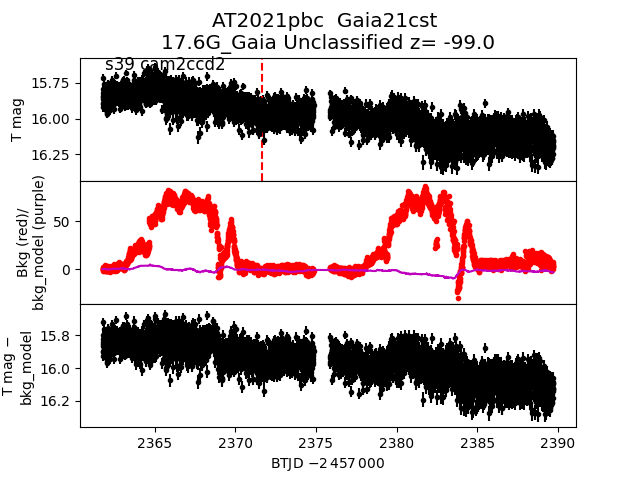
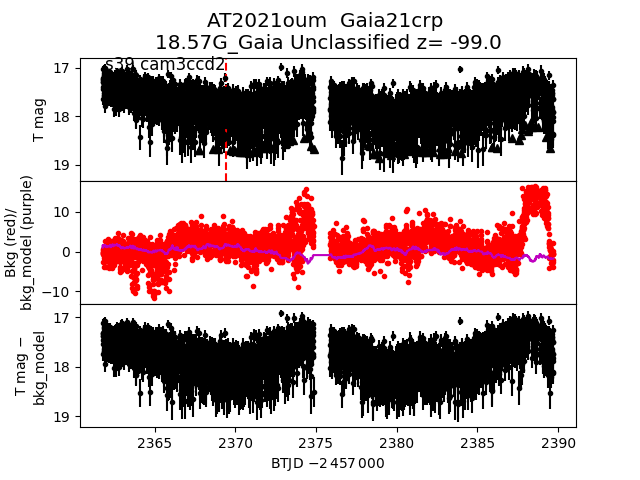
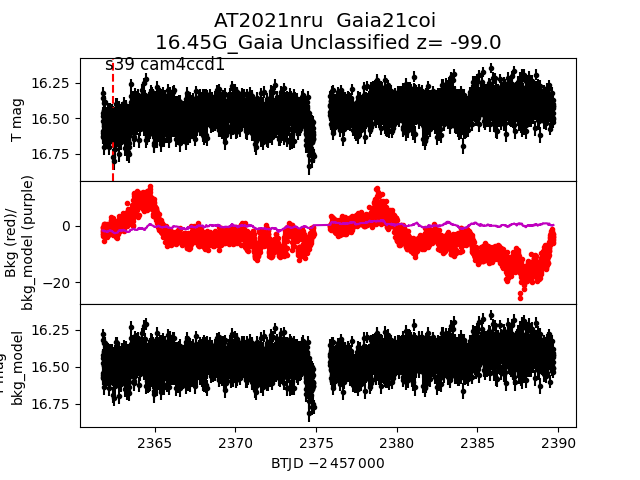
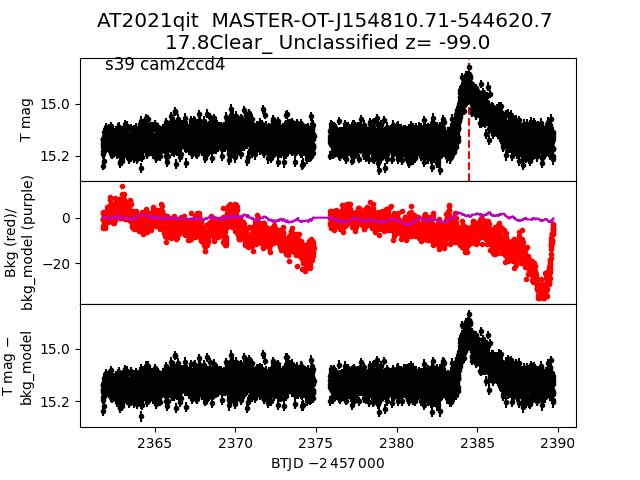
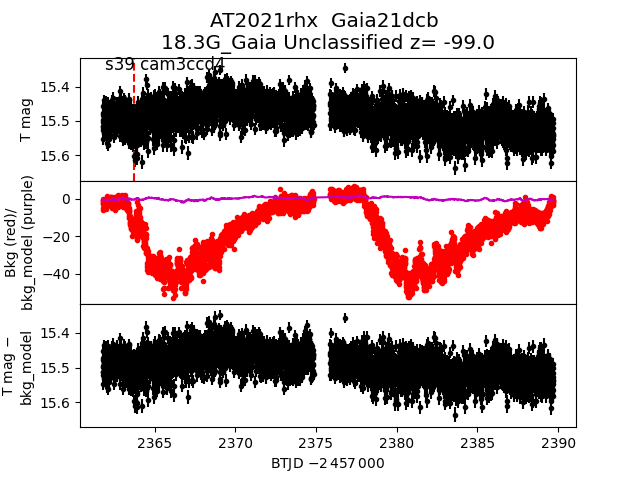
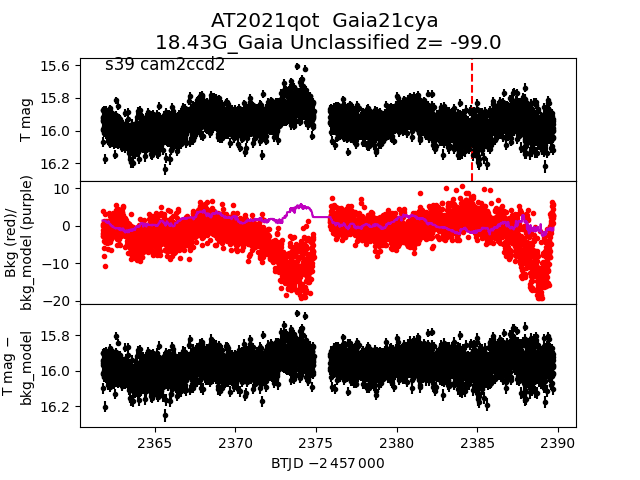
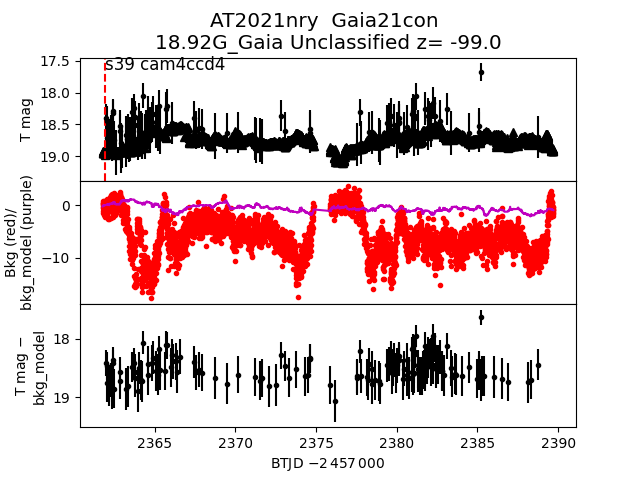
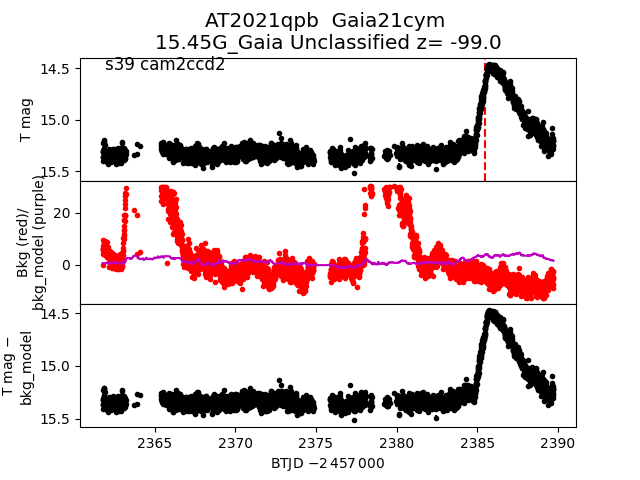
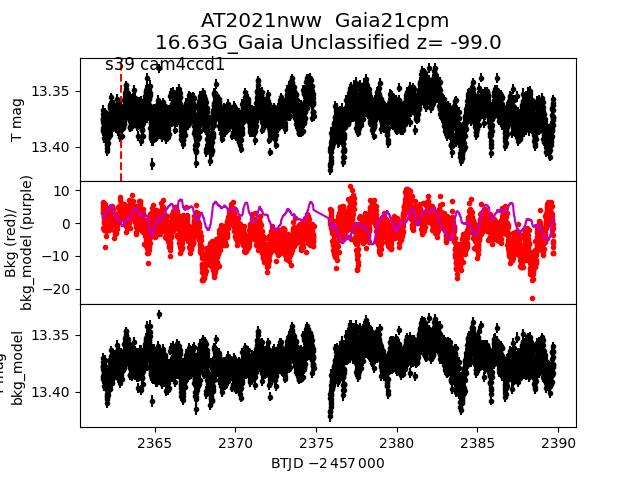
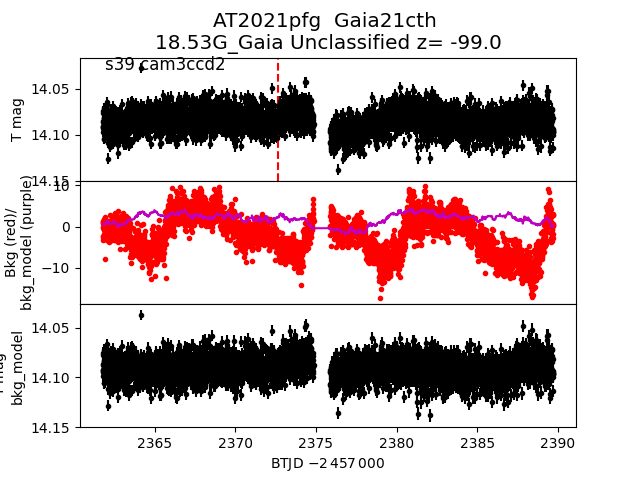
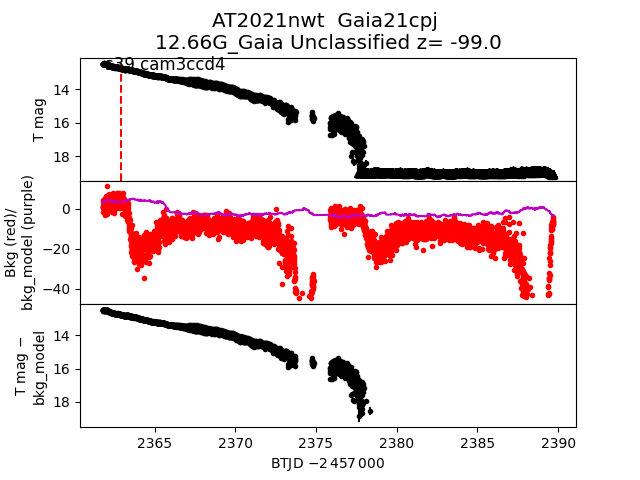
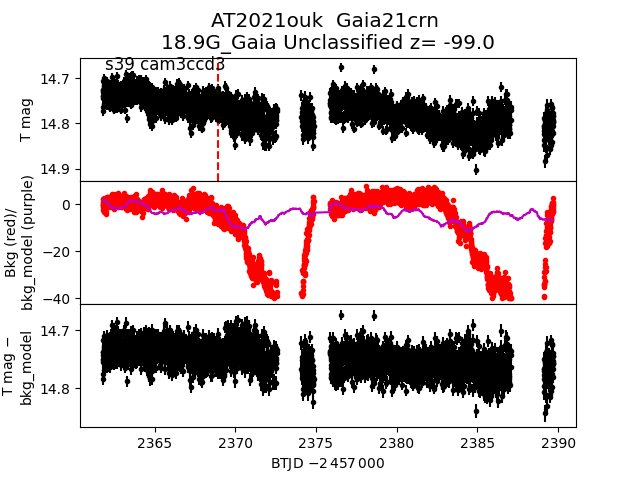
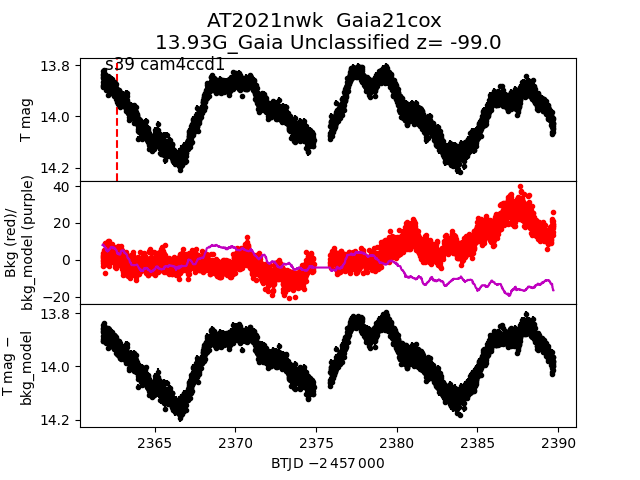
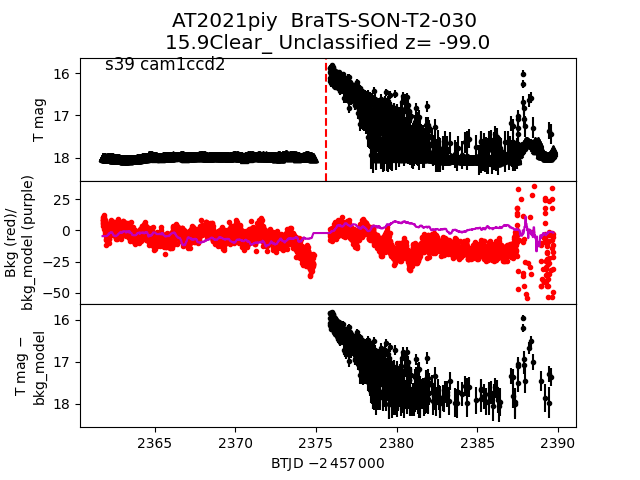
Each figure has three panels. The top panel shows the transient light curve, the middle panel shows the local background (estimated in an annulus), and the bottom panel shows a "background-model corrected" light curve. Details about the background model are in the README.
The vertical red line marks the time of discovery reported to TNS. Other useful metadata from TNS is in the figure title.
Note that the top and bottom panel are in magnitudes, while the middle panel is in differential flux units. The magnitudes are calibrated to the flux in the reference image used for image subtraction. Thus, flux from the host galaxy is included in these magnitudes.
3-sigma upper limits are plotted as triangles with no errorbars. A typical limiting magnitude is 19.6 in 30 minutes or 18.4 in 200 seconds (for low backgrounds).
The links allow you to download the light curve data as a text file.
More details in the README.
2021qpc
 2021pod
 2021nwi
 2021paz
 2021odw
 2021qcv
 2021nrt
 2021opt
 2021nws
 2021quw
 2021nwl
 2021okj
 2021qdc
 2021qut
 2021oww
 2021oim
 2021pje
 2021qxa
 2021nny
 2021nwj
 2021nwu
 2021pbc
 2021oum
 2021nru
 2021qit
 2021rhx
 2021qot
 2021nry
 2021qpb
 2021nww
 2021pfg
 2021nwt
 2021ouk
 2021nwk
 2021piy
 2021qen