all transients in sector38 (23 total)
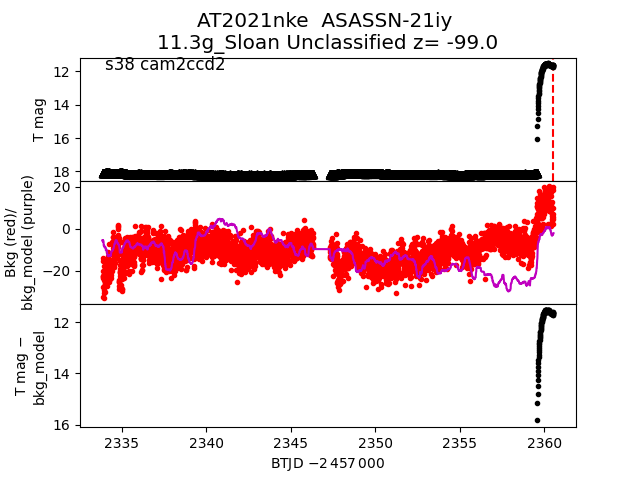
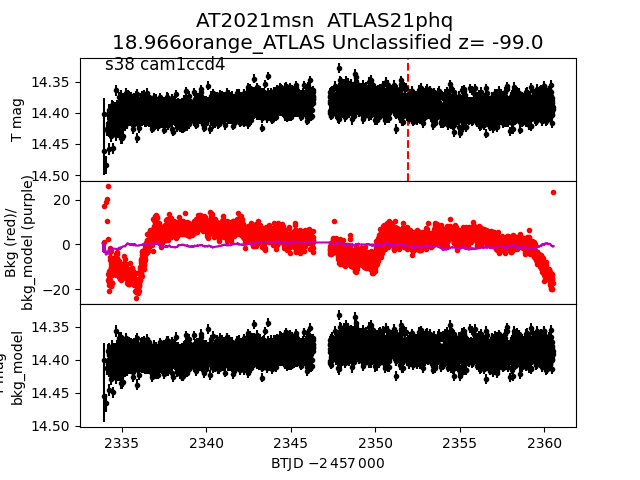
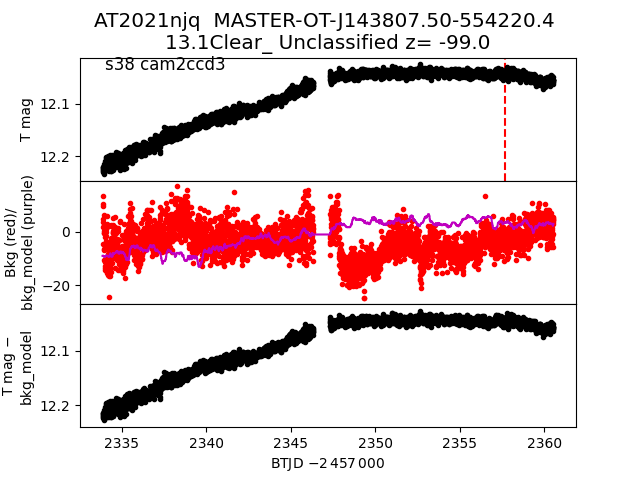
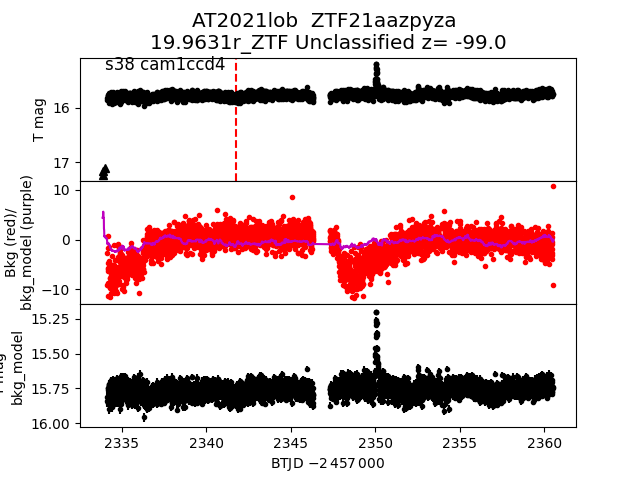
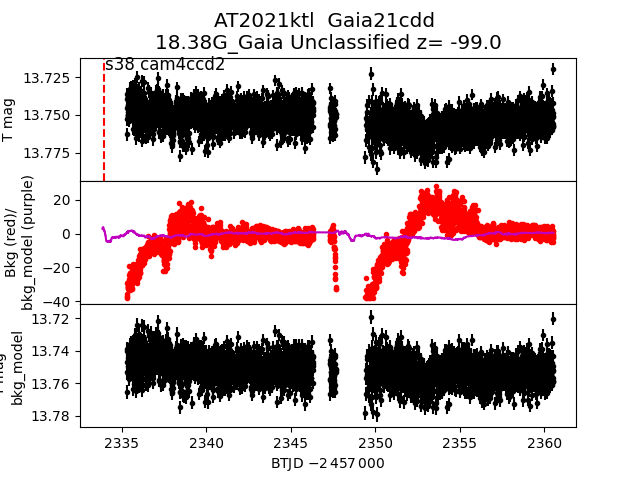
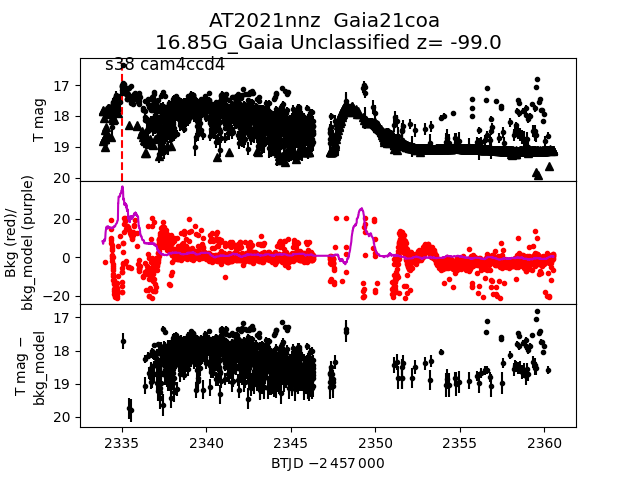
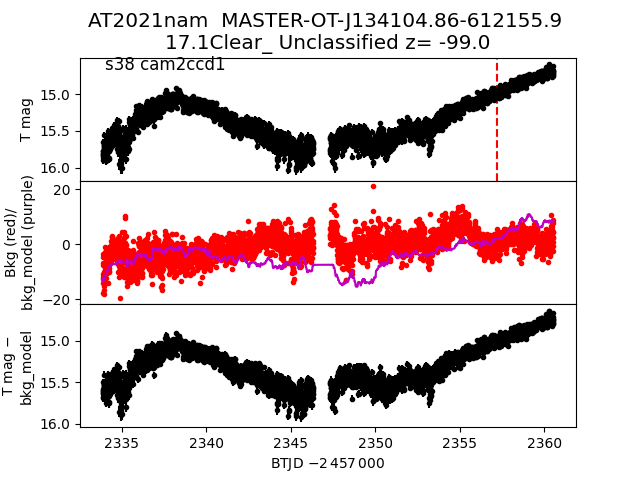
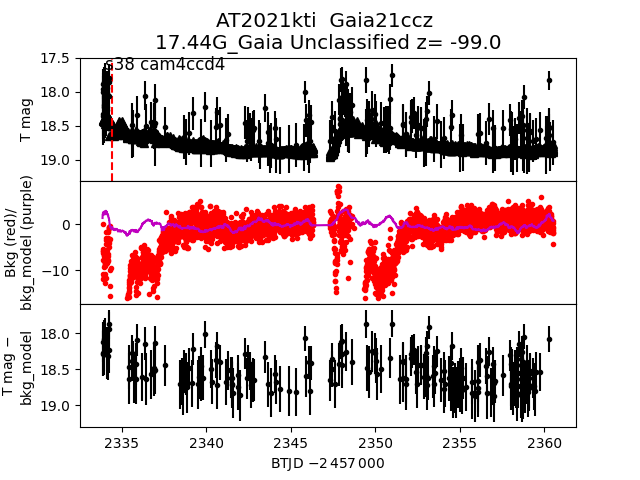
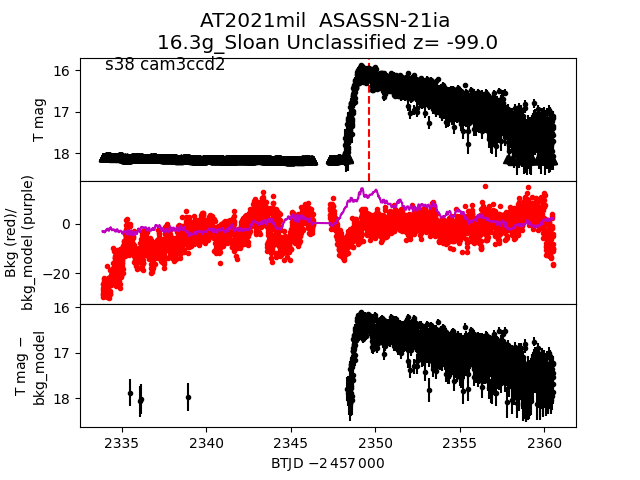
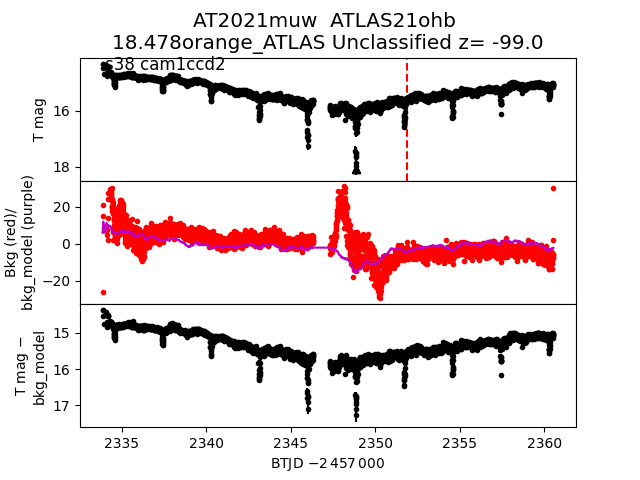
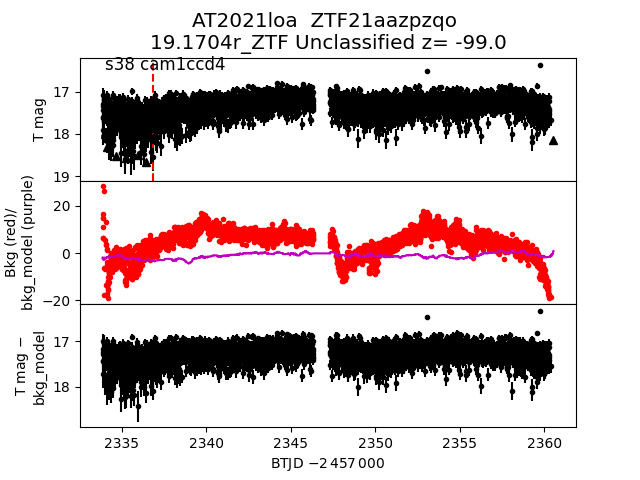
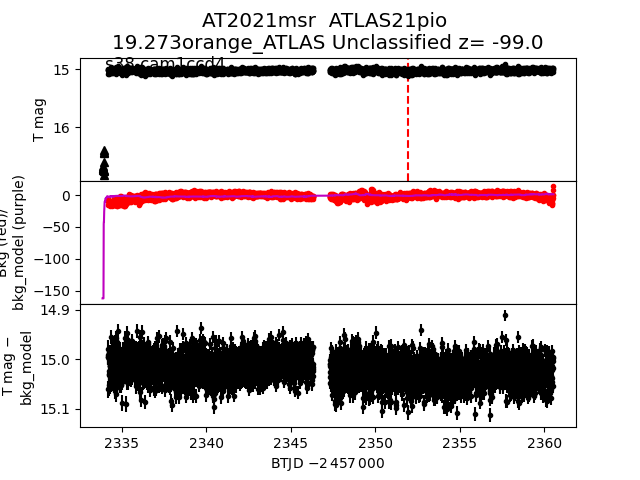
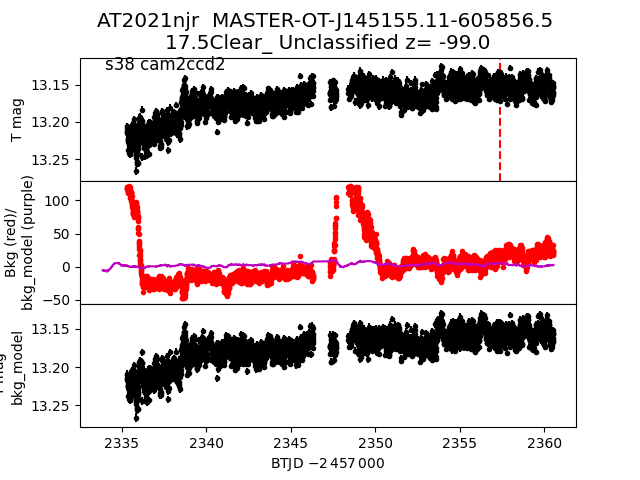
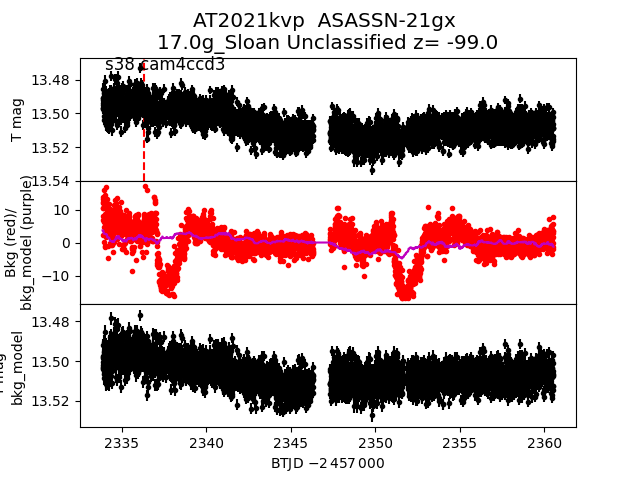
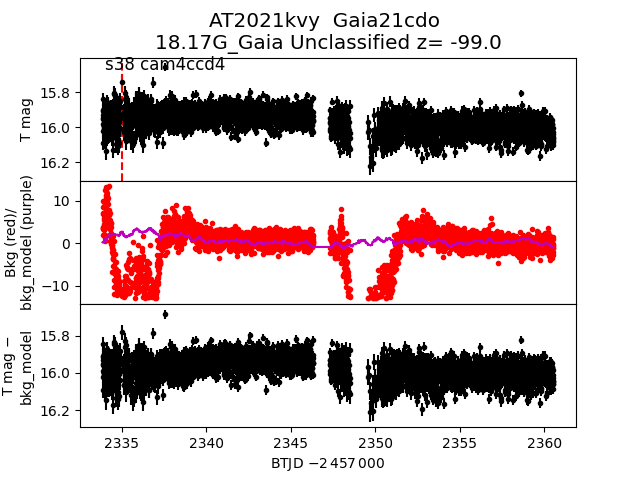
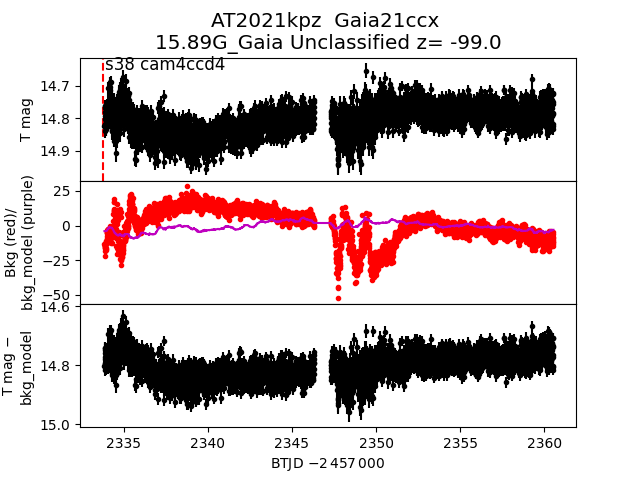
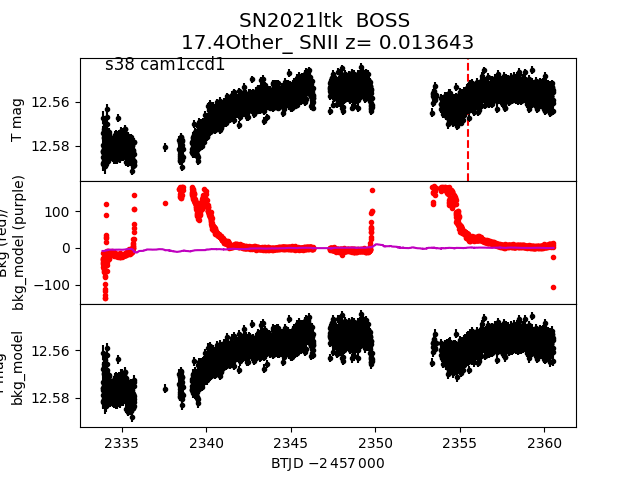
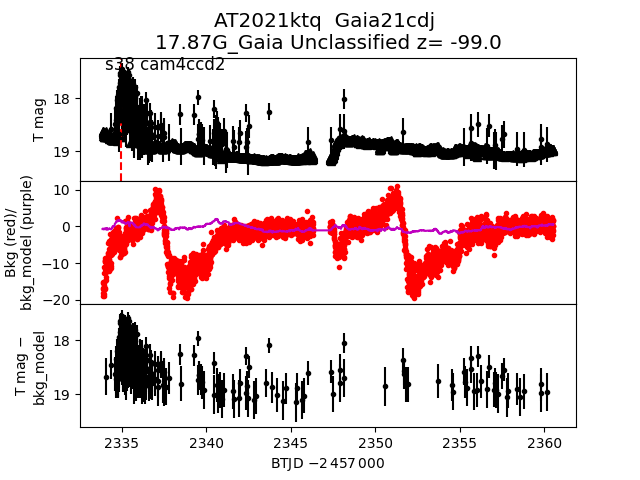
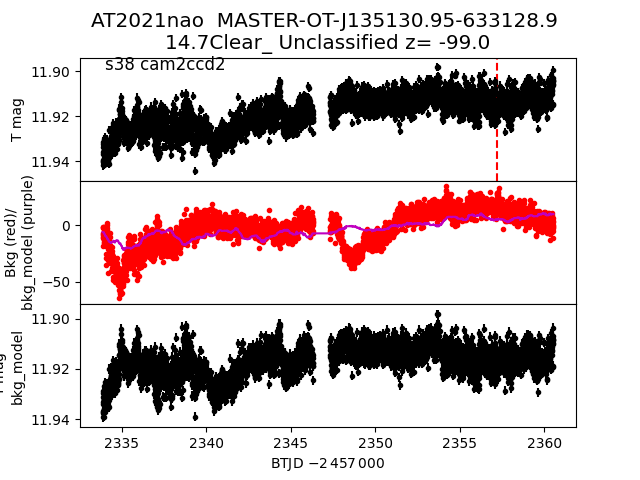
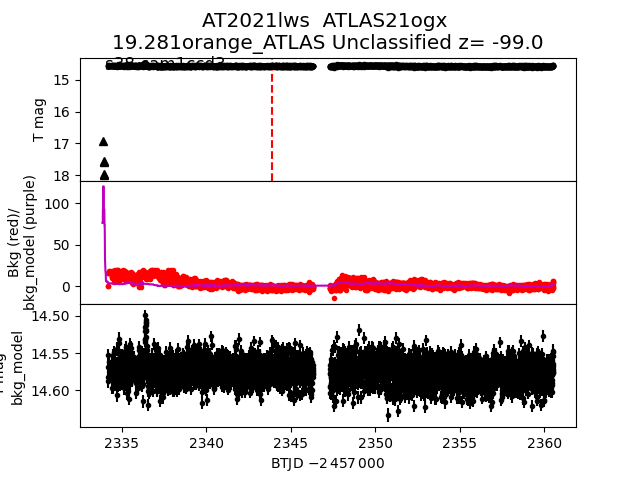
Each figure has three panels. The top panel shows the transient light curve, the middle panel shows the local background (estimated in an annulus), and the bottom panel shows a "background-model corrected" light curve. Details about the background model are in the README.
The vertical red line marks the time of discovery reported to TNS. Other useful metadata from TNS is in the figure title.
Note that the top and bottom panel are in magnitudes, while the middle panel is in differential flux units. The magnitudes are calibrated to the flux in the reference image used for image subtraction. Thus, flux from the host galaxy is included in these magnitudes.
3-sigma upper limits are plotted as triangles with no errorbars. A typical limiting magnitude is 19.6 in 30 minutes or 18.4 in 200 seconds (for low backgrounds).
The links allow you to download the light curve data as a text file.
More details in the README.
2021msn
 2021njq
 2021lob
 2021ktl
 2021nnz
 2021nam
 2021kti
 2021mil
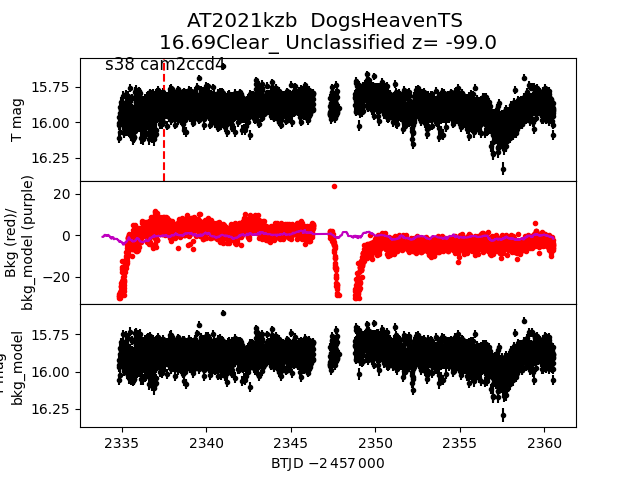
 2021kzb
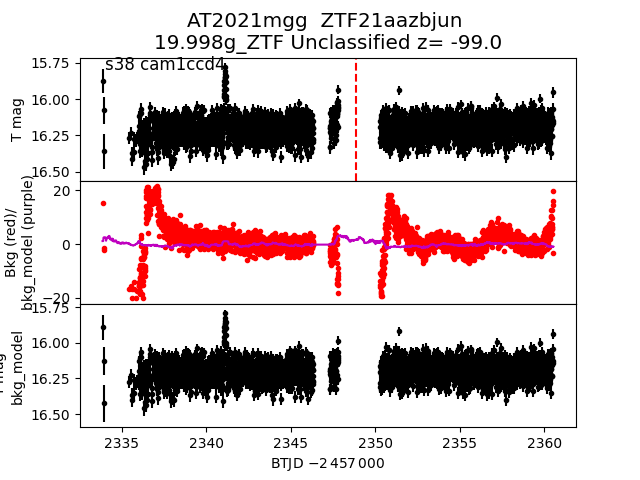
 2021mgg
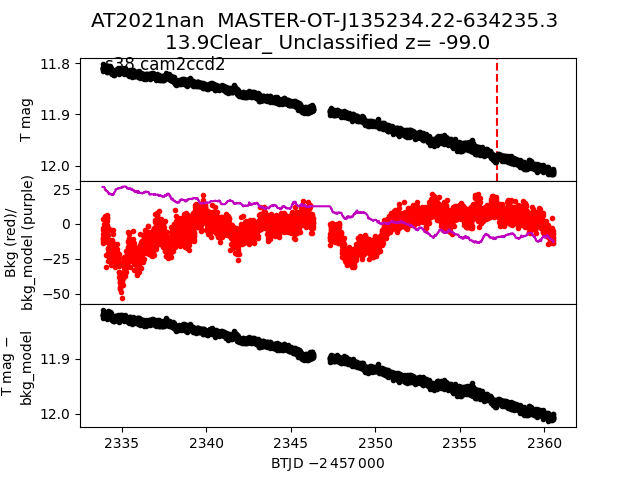
 2021nan
 2021muw
 2021loa
 2021msr
 2021njr
 2021kvp
 2021kvy
 2021kpz
 2021ltk
 2021ktq
 2021nao
 2021lws
 2021nke