all transients in sector37 (69 total)
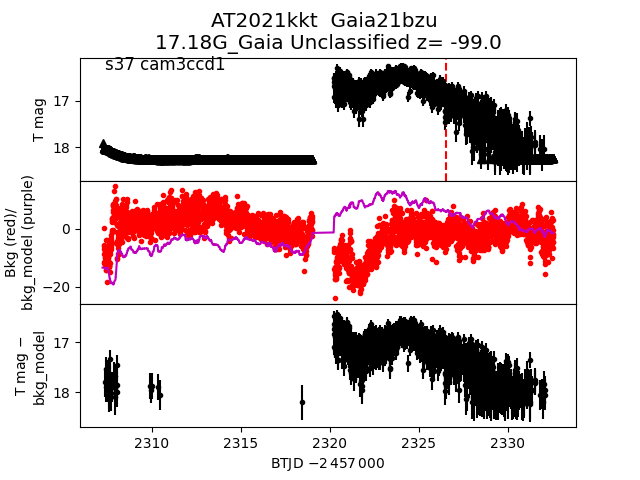
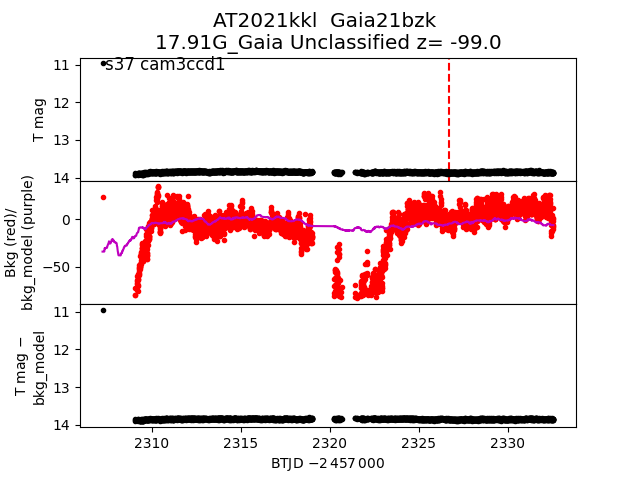
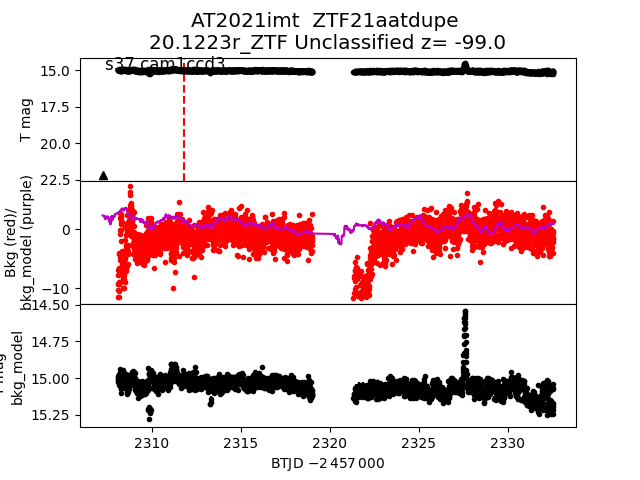
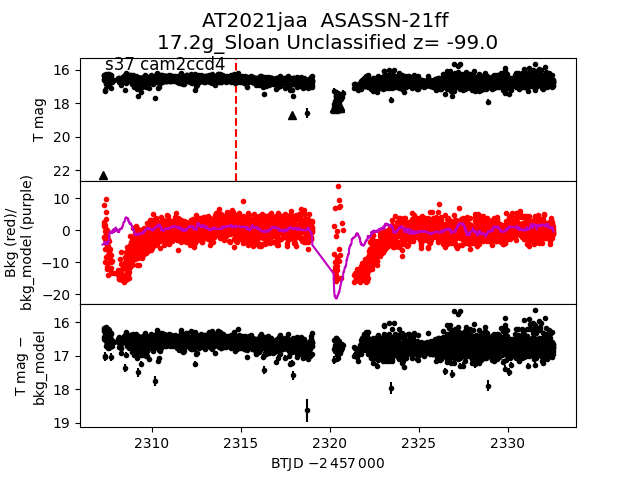
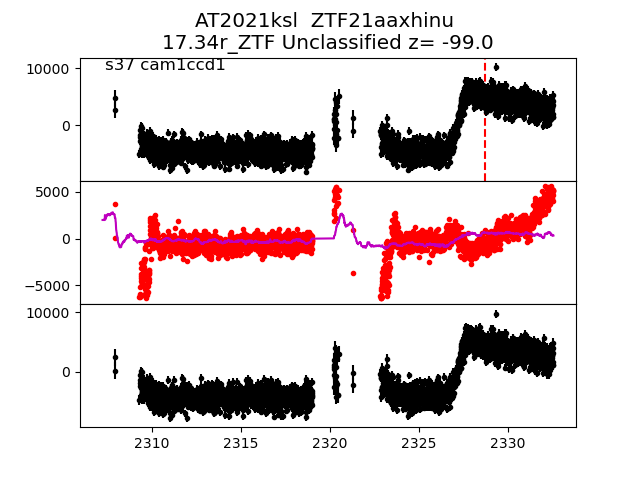
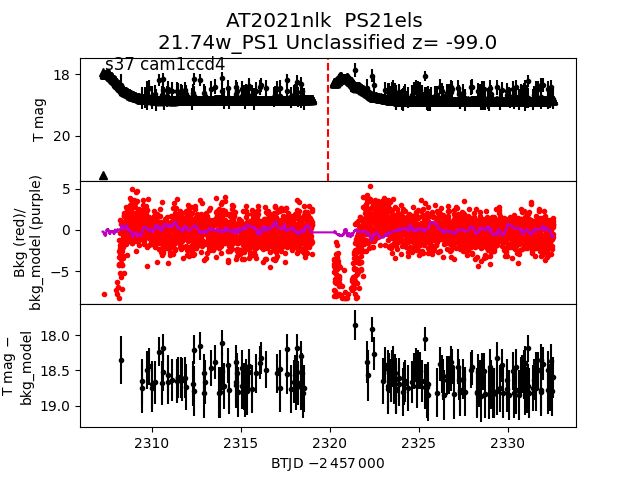
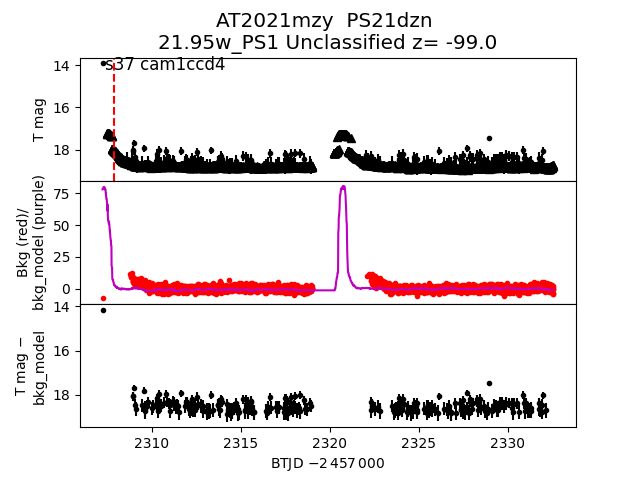
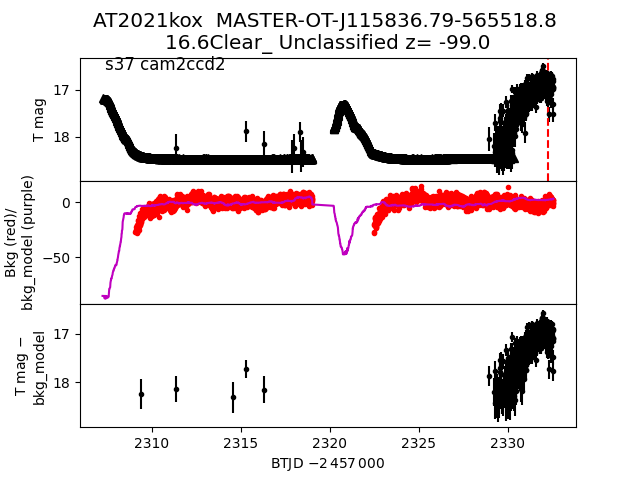
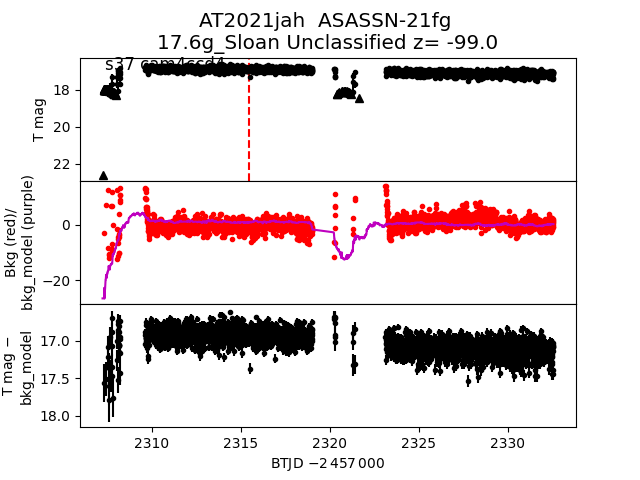
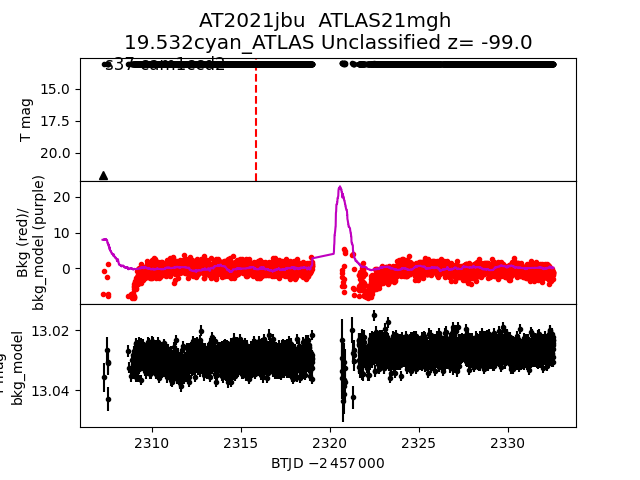
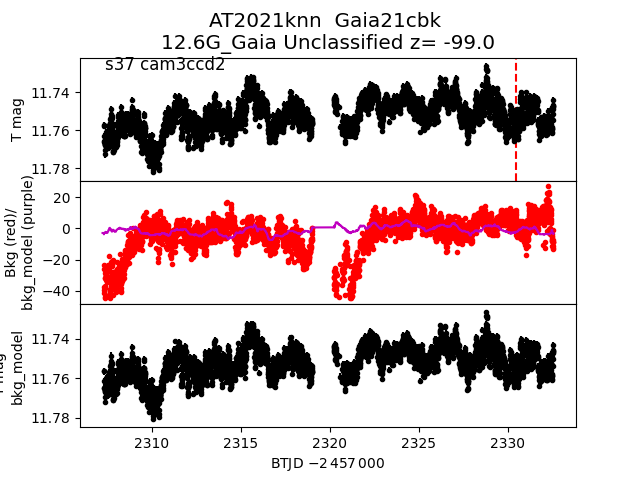
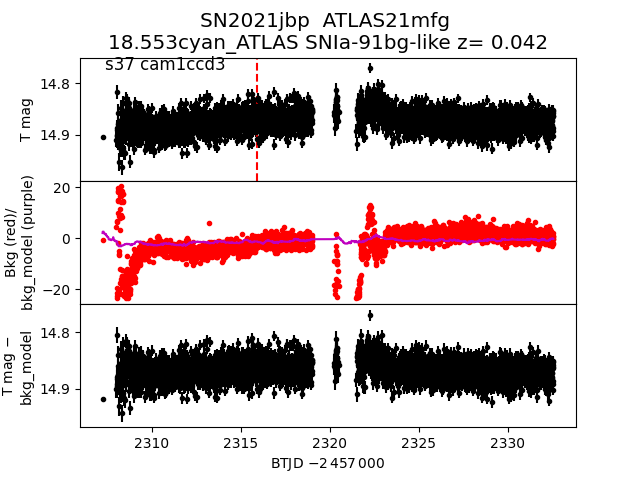
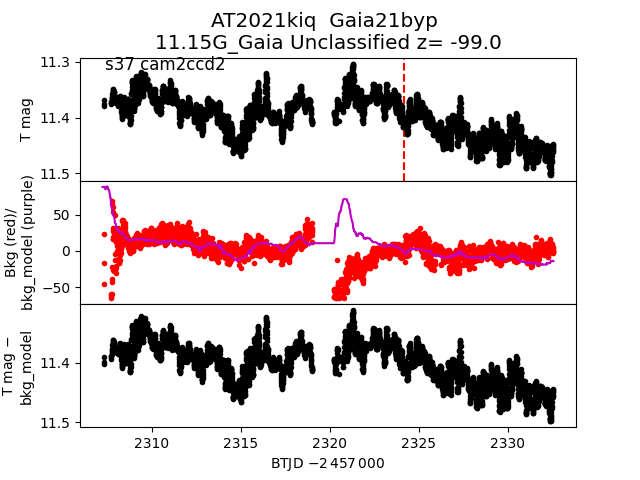
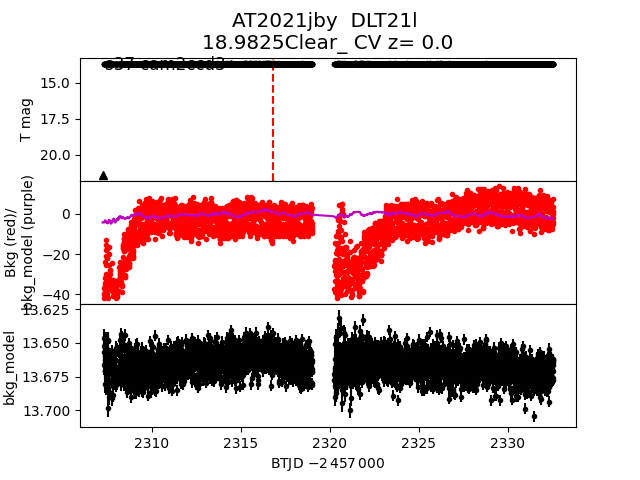
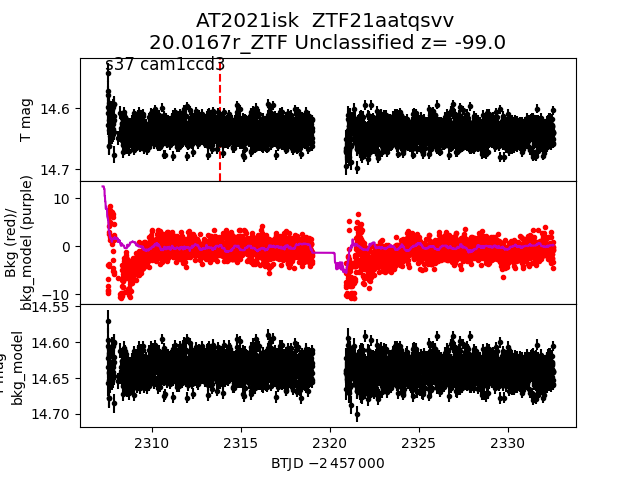
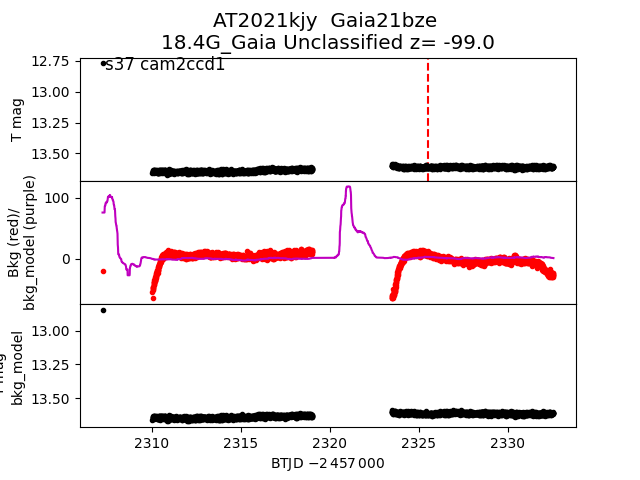
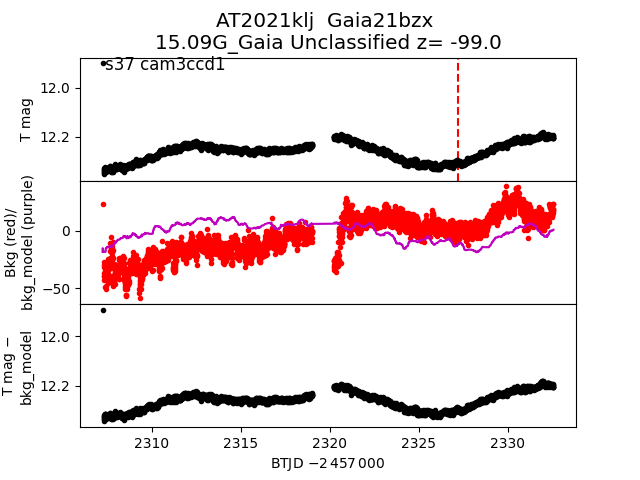
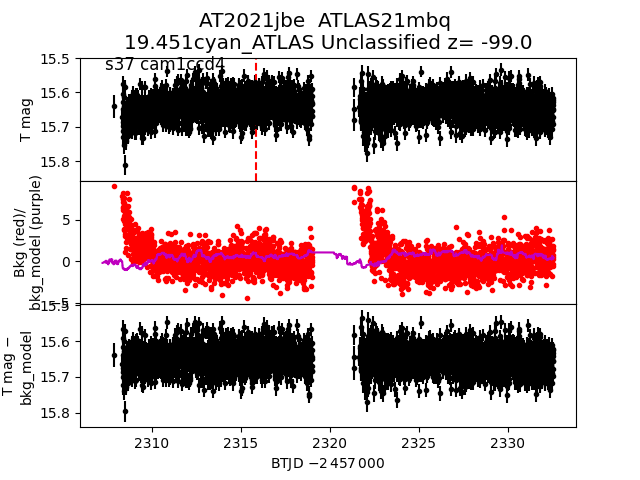
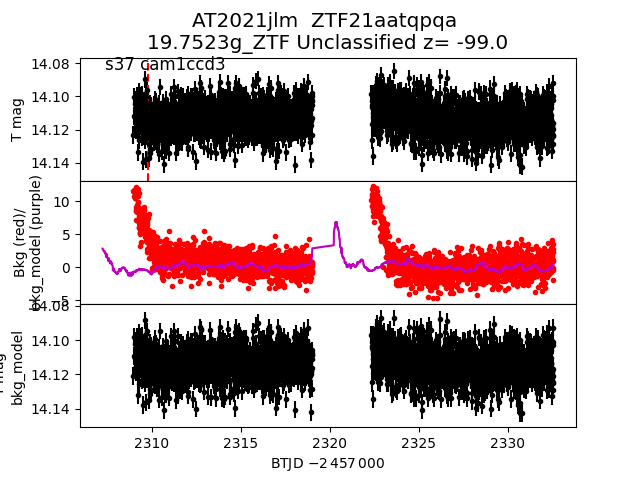
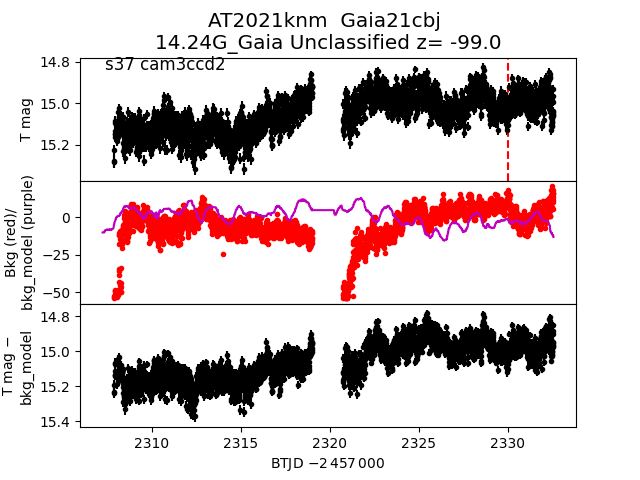
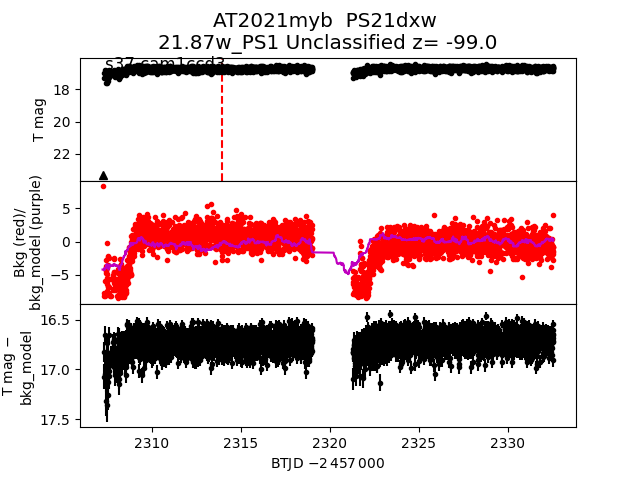
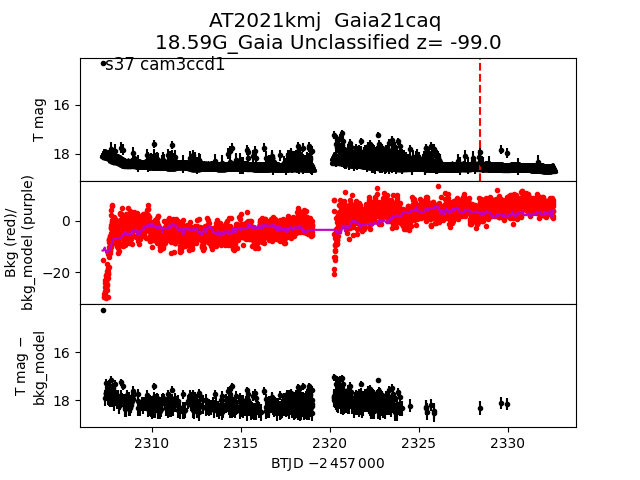
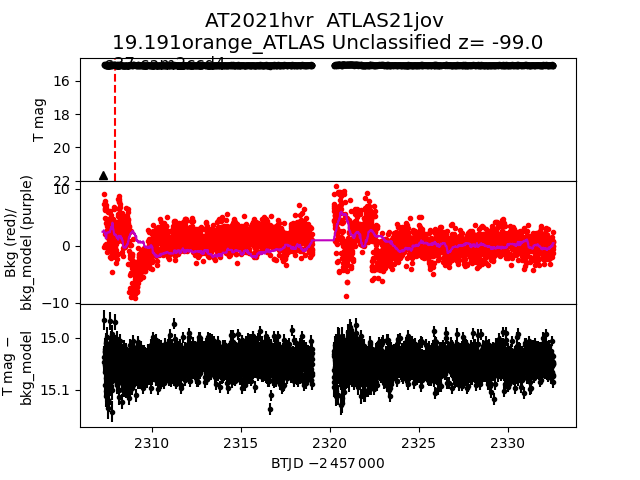
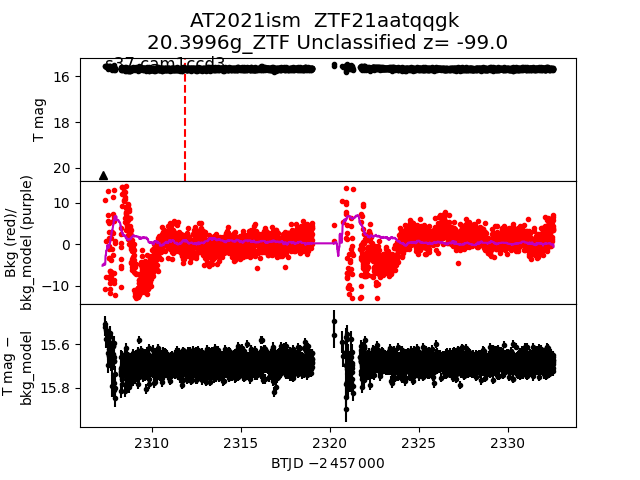
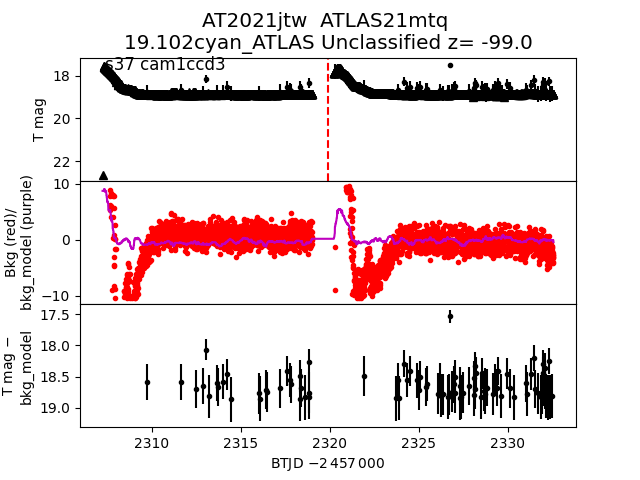
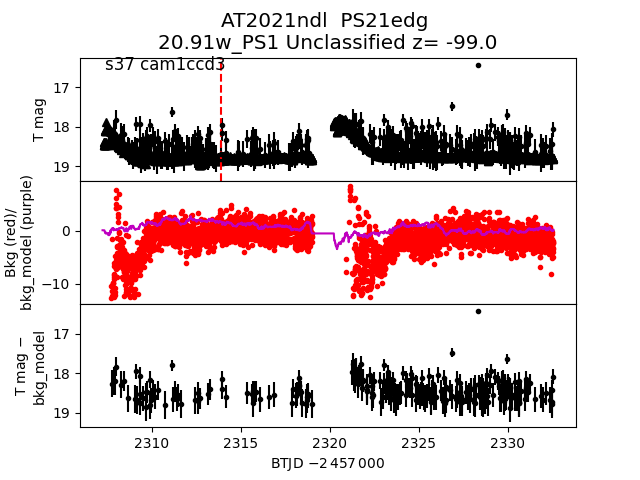
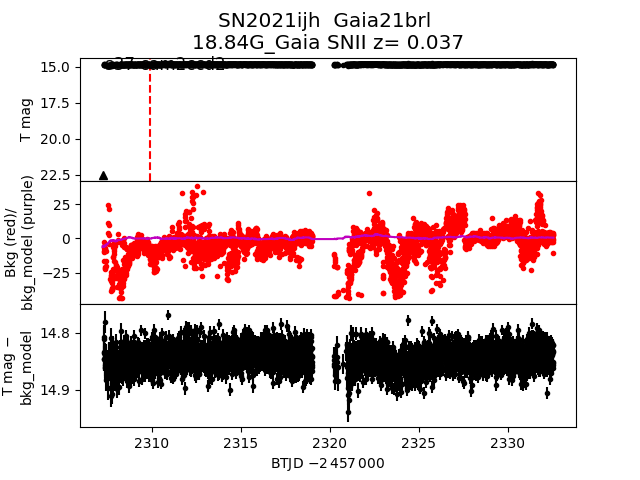
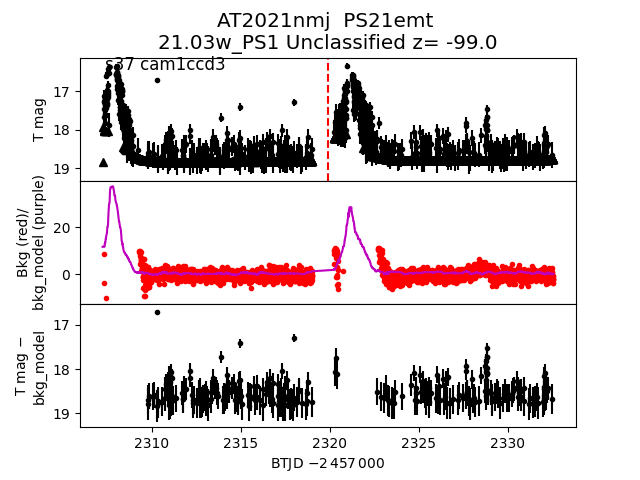
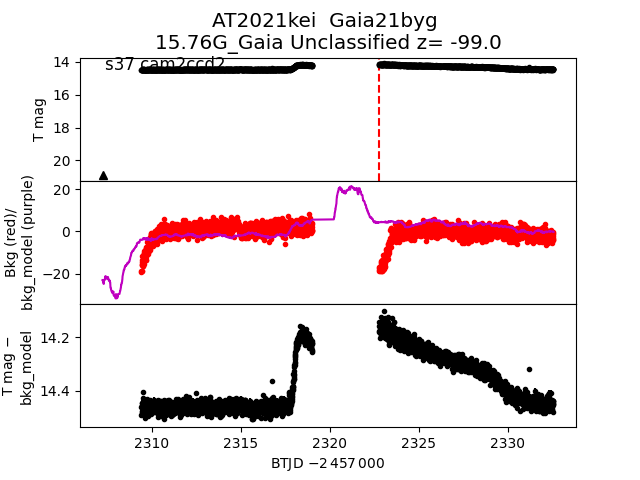
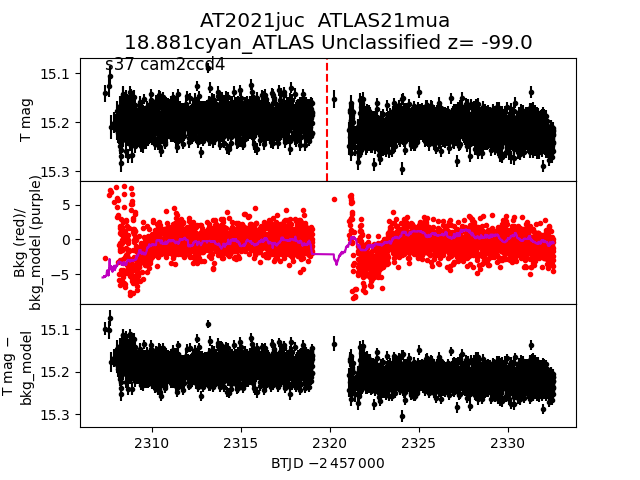
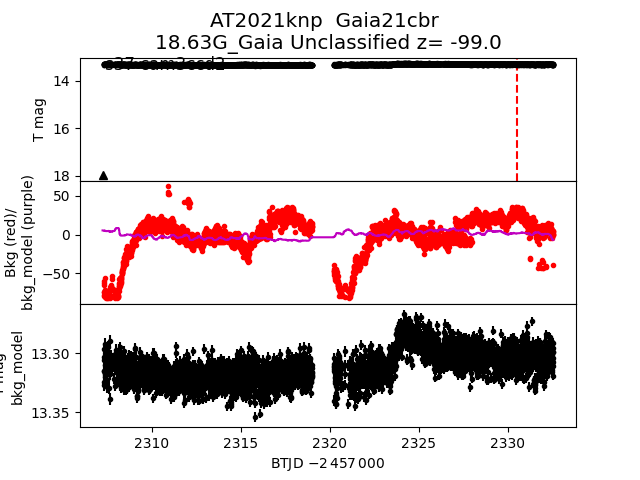
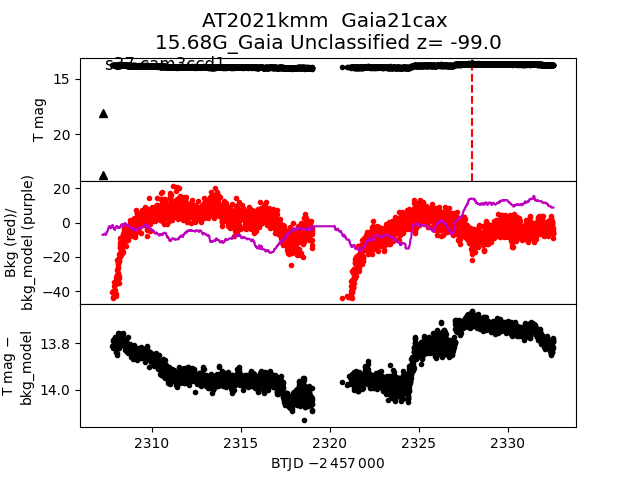
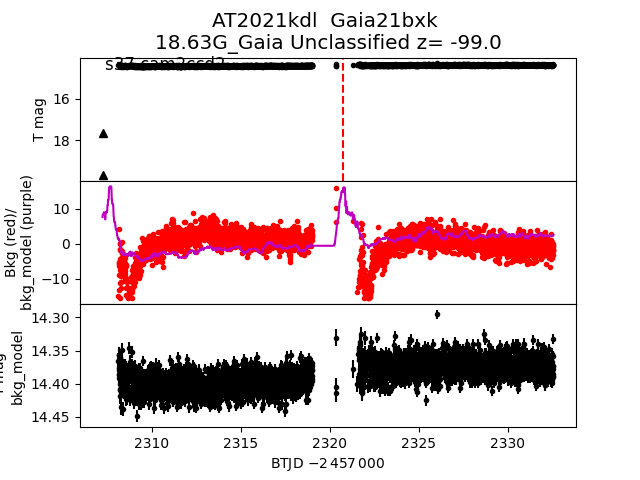
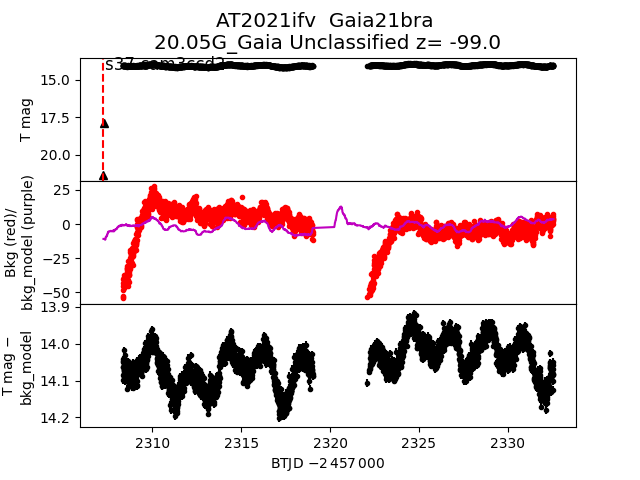
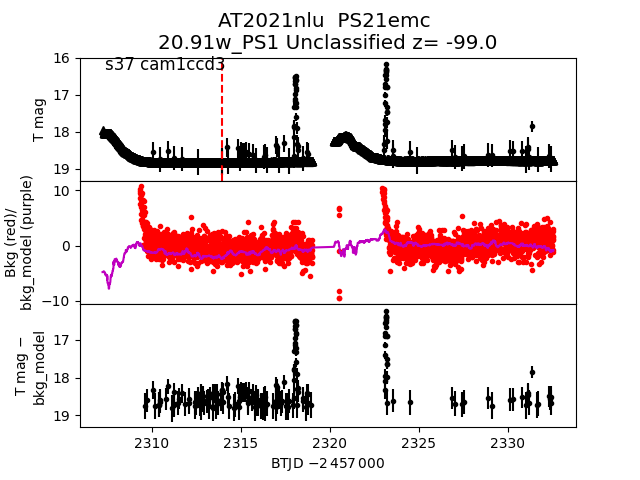
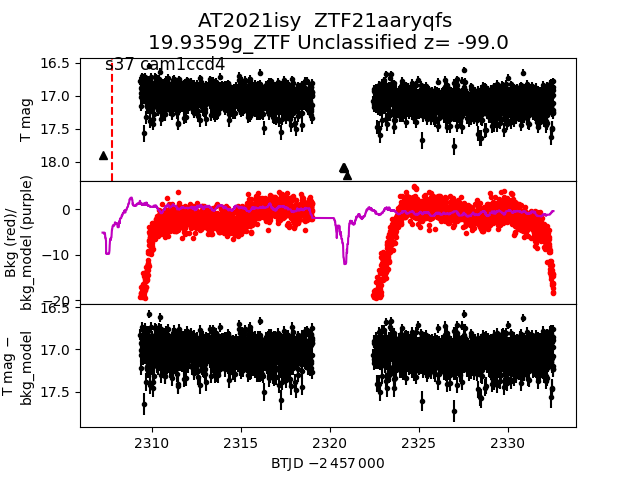
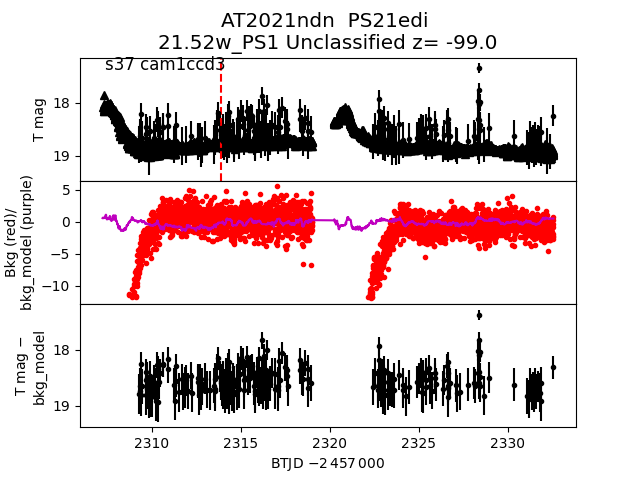
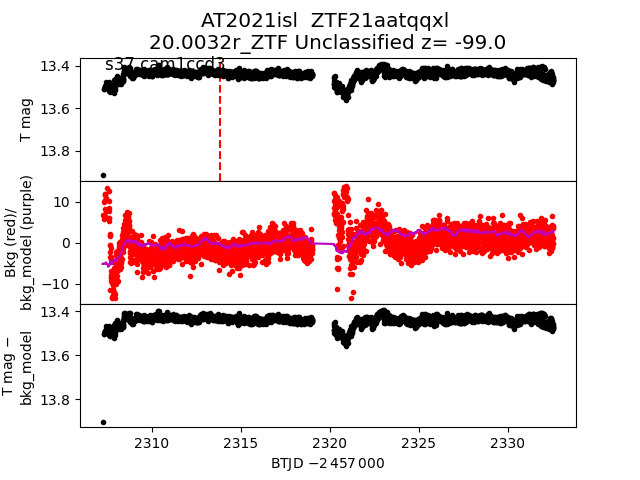
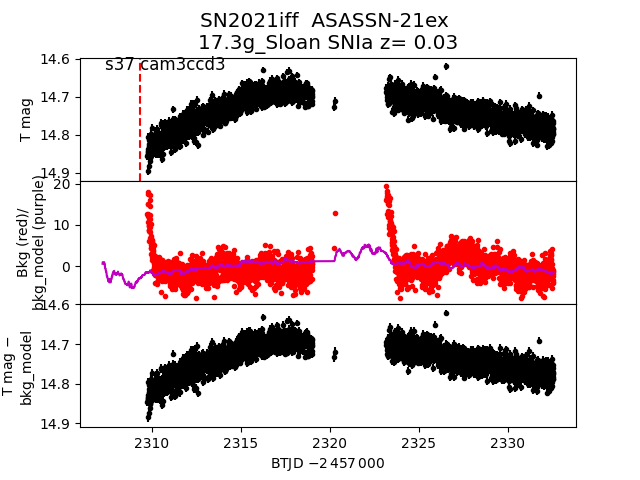
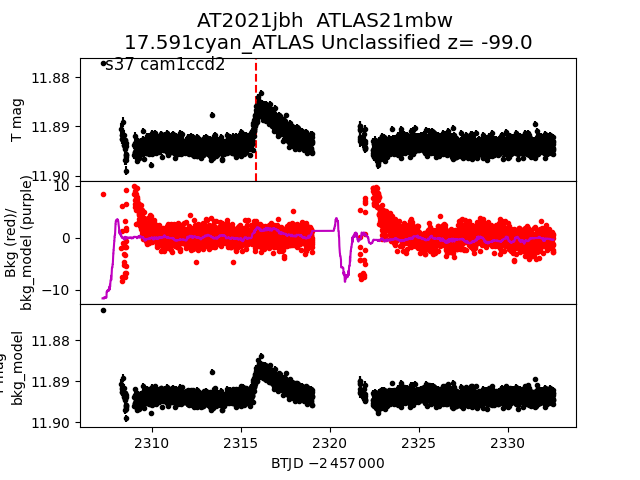
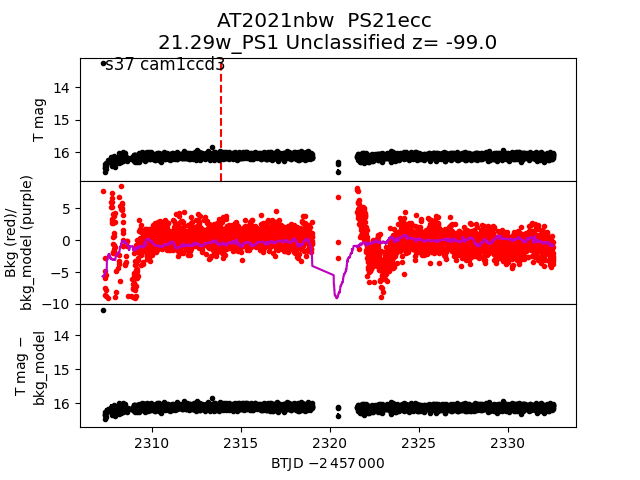
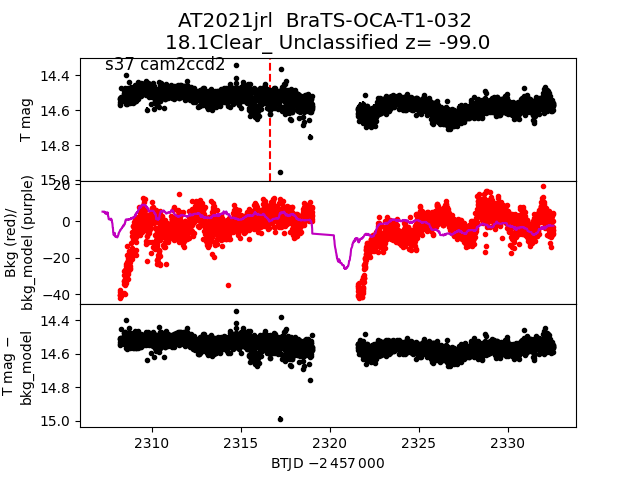
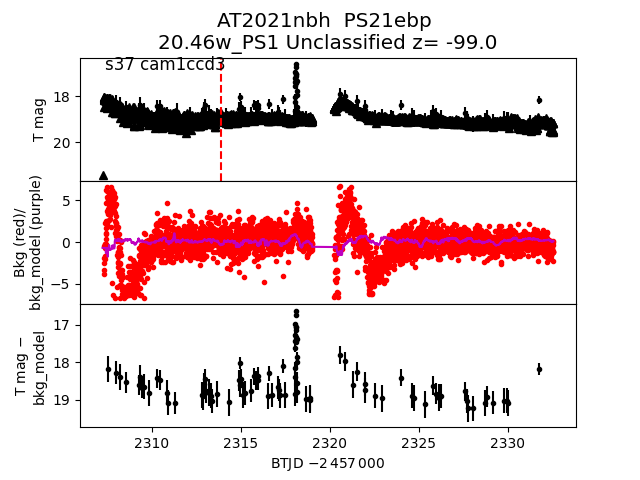
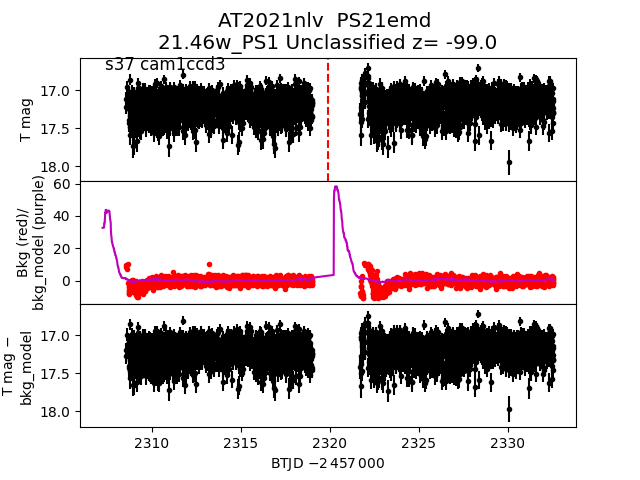
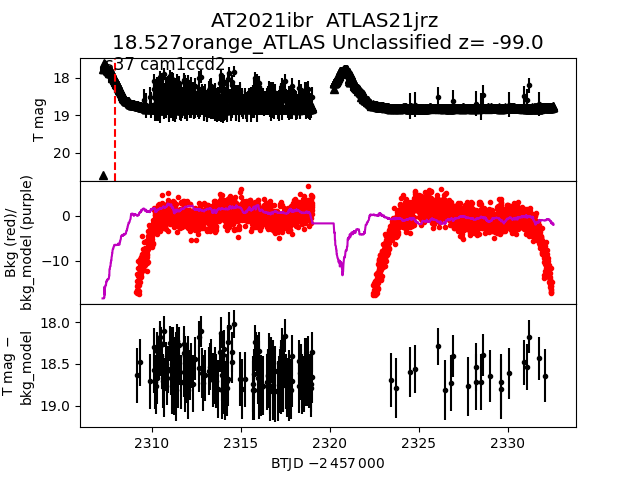
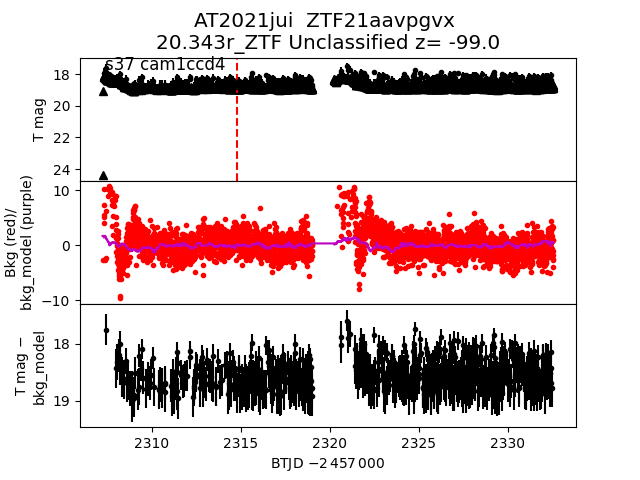
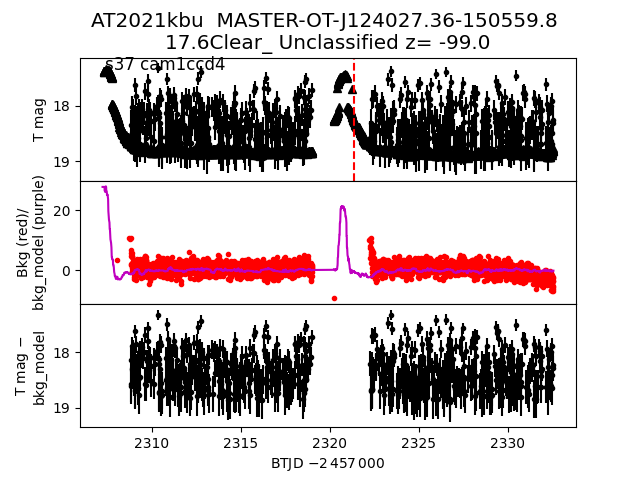
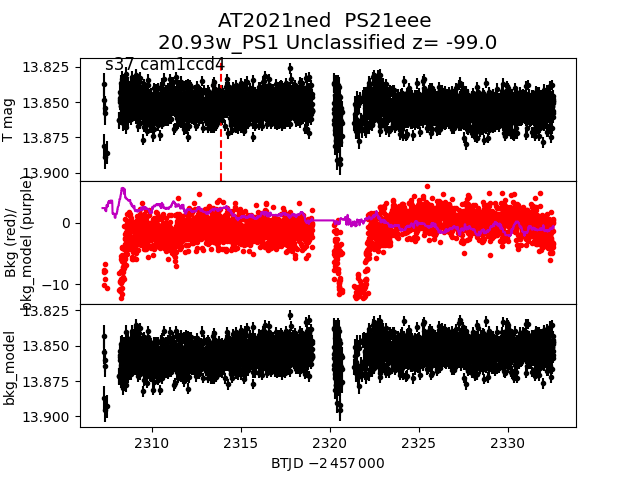
Each figure has three panels. The top panel shows the transient light curve, the middle panel shows the local background (estimated in an annulus), and the bottom panel shows a "background-model corrected" light curve. Details about the background model are in the README.
The vertical red line marks the time of discovery reported to TNS. Other useful metadata from TNS is in the figure title.
Note that the top and bottom panel are in magnitudes, while the middle panel is in differential flux units. The magnitudes are calibrated to the flux in the reference image used for image subtraction. Thus, flux from the host galaxy is included in these magnitudes.
3-sigma upper limits are plotted as triangles with no errorbars. A typical limiting magnitude is 19.6 in 30 minutes or 18.4 in 200 seconds (for low backgrounds).
The links allow you to download the light curve data as a text file.
More details in the README.
2021kkl
 2021imt
 2021jaa
 2021ksl
 2021nlk
 2021mzy
 2021kox
 2021jah
 2021jbu
 2021knn
 2021jbp
 2021kiq
 2021jby
 2021isk
 2021kjy
 2021klj
 2021jbe
 2021jlm
 2021knm
 2021myb
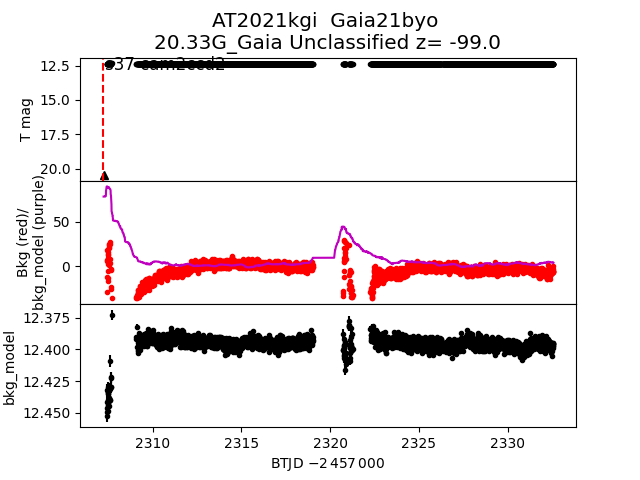
 2021kgi
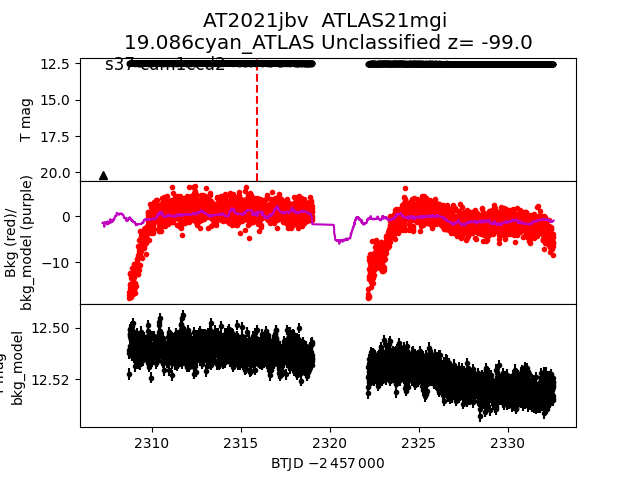
 2021jbv
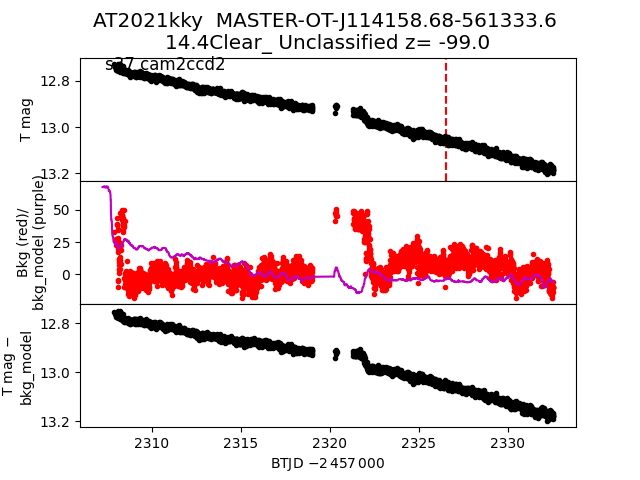
 2021kky
 2021kmj
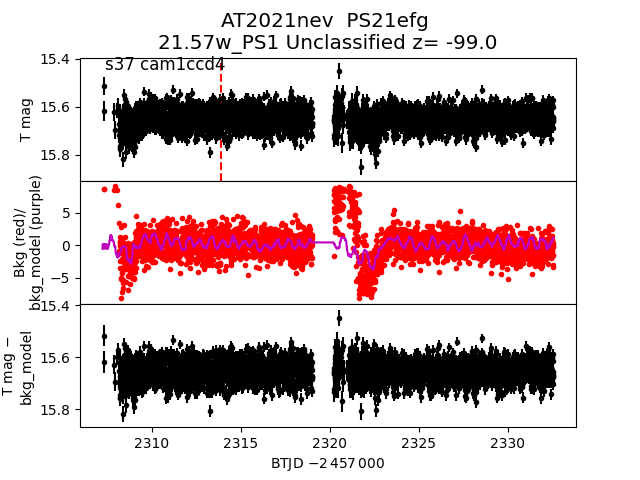
 2021nev
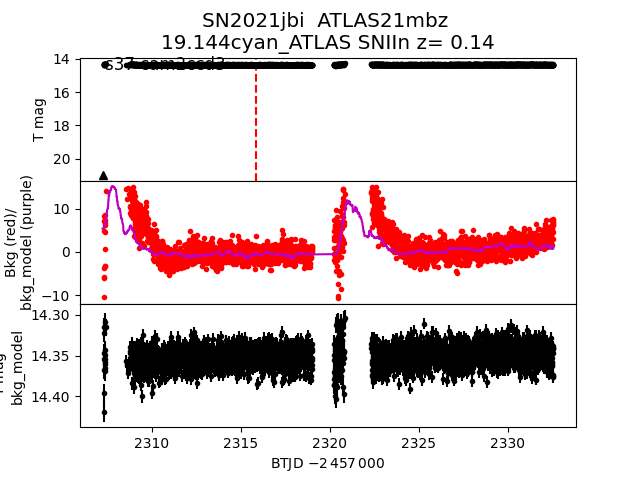
 2021jbi
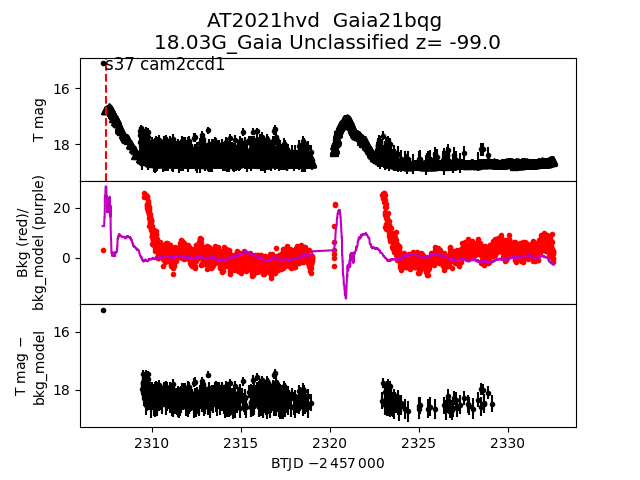
 2021hvd
 2021hvr
 2021ism
 2021jtw
 2021ndl
 2021ijh
 2021nmj
 2021kei
 2021juc
 2021knp
 2021kmm
 2021kdl
 2021ifv
 2021nlu
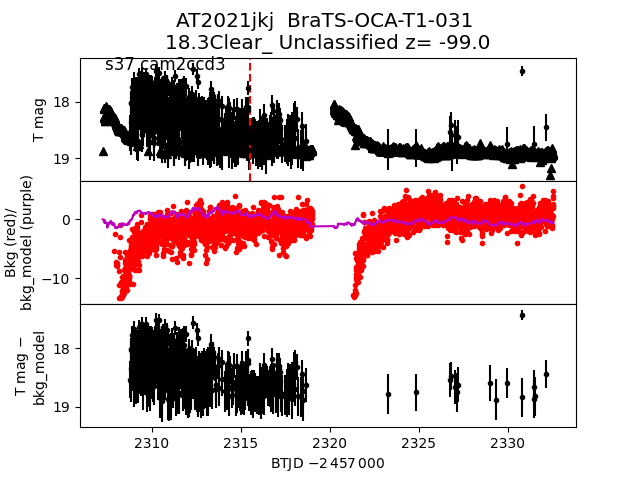
 2021jkj
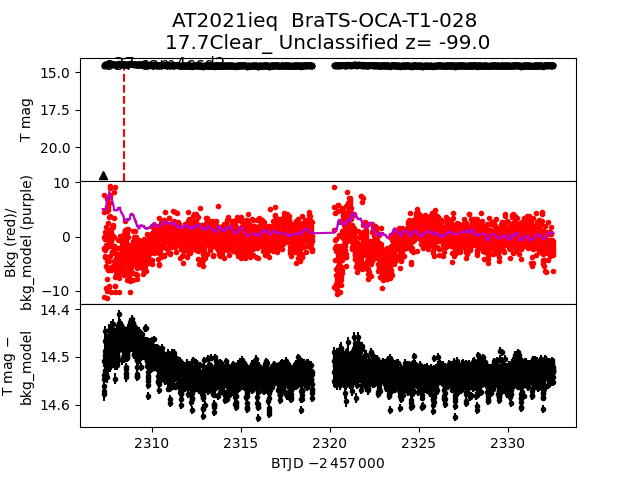
 2021ieq
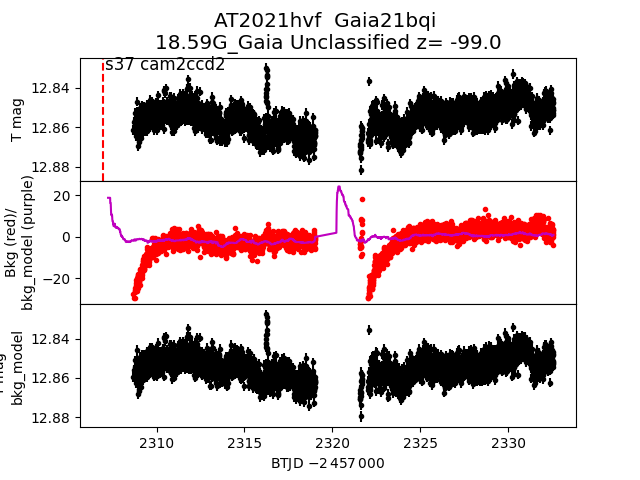
 2021hvf
 2021isy
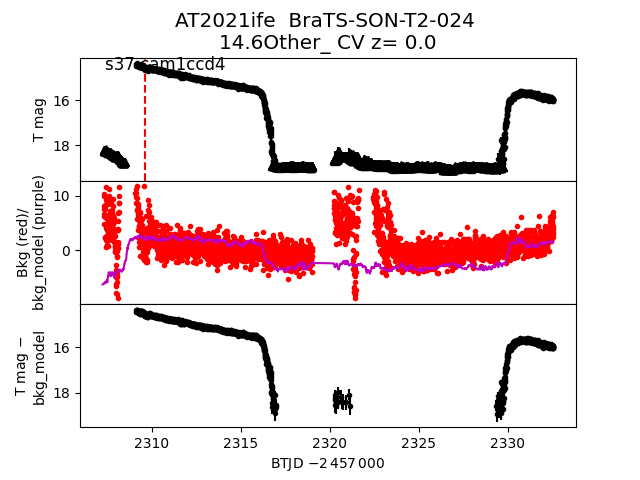
 2021ife
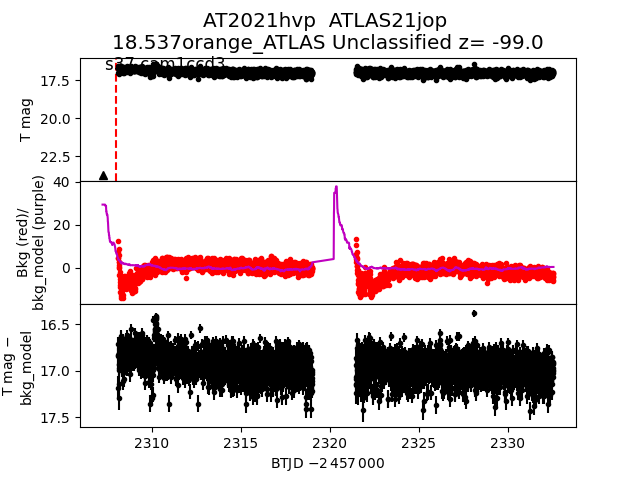
 2021hvp
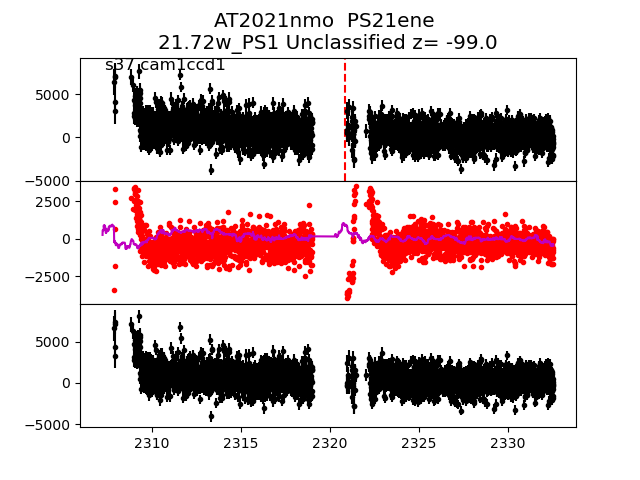
 2021nmo
 2021ndn
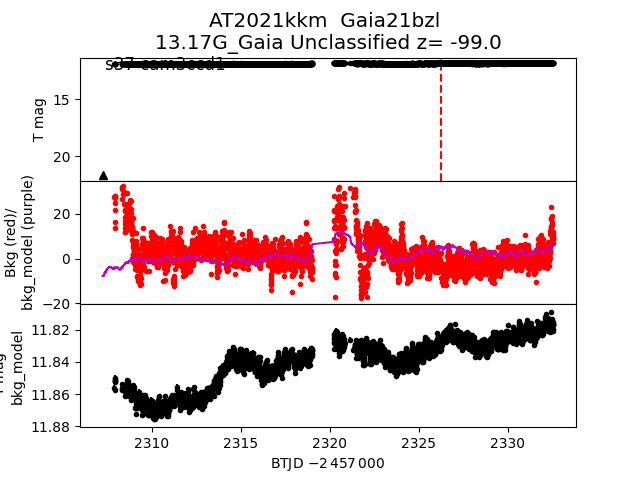
 2021kkm
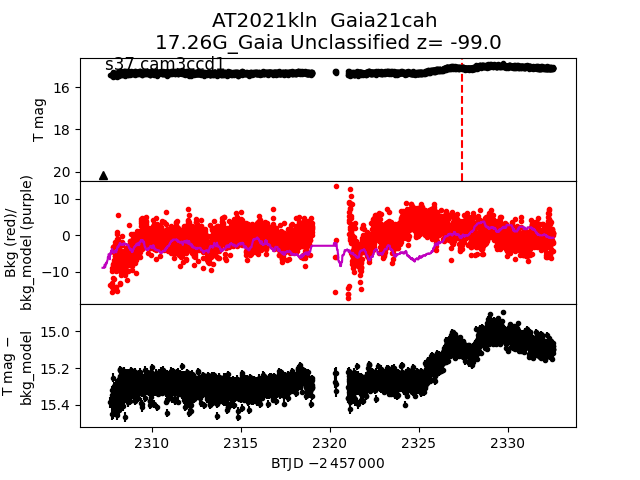
 2021kln
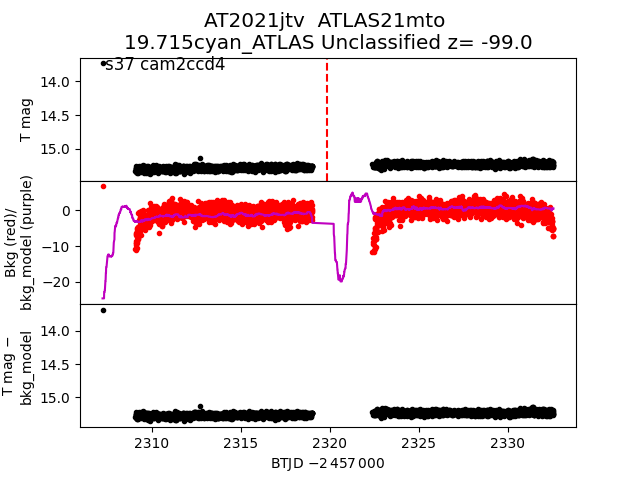
 2021jtv
 2021isl
 2021iff
 2021jbh
 2021nbw
 2021jrl
 2021nbh
 2021nlv
 2021ibr
 2021jui
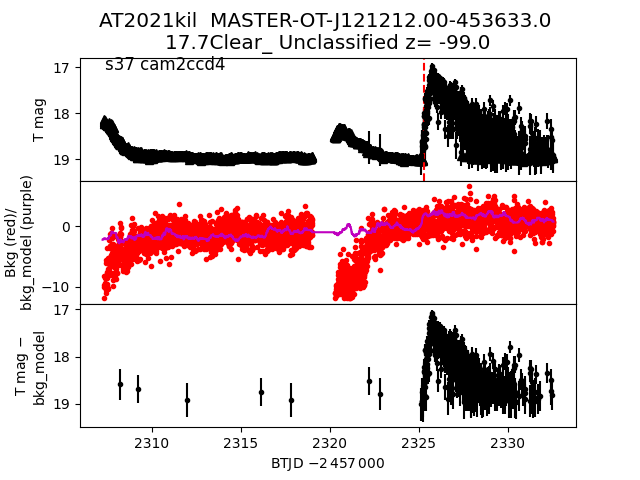
 2021kil
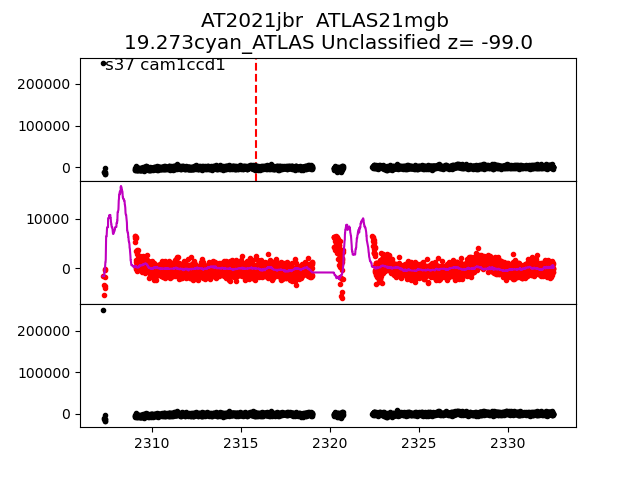
 2021jbr
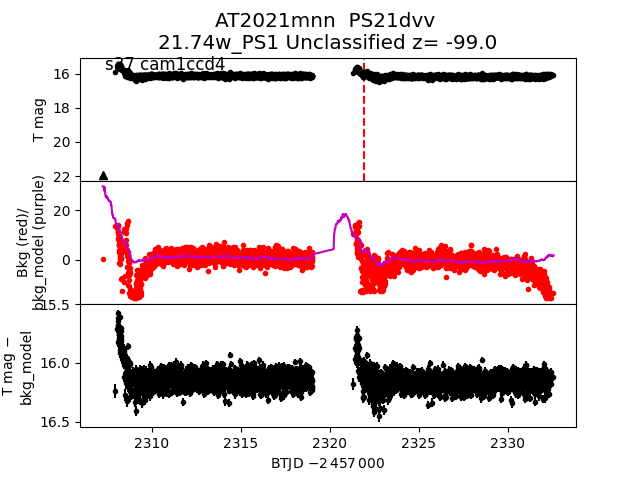
 2021mnn
 2021kbu
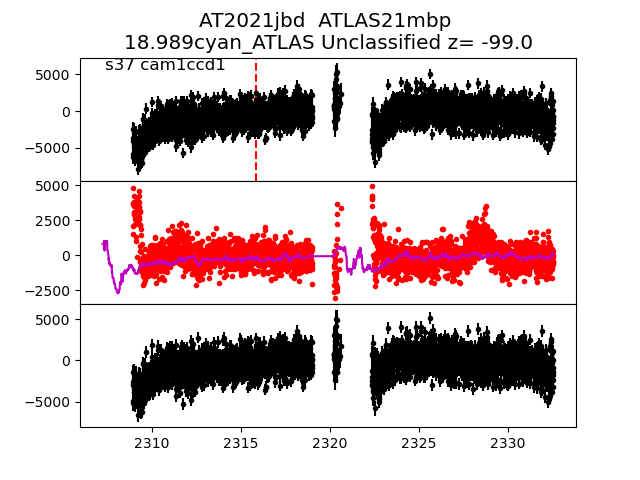
 2021jbd
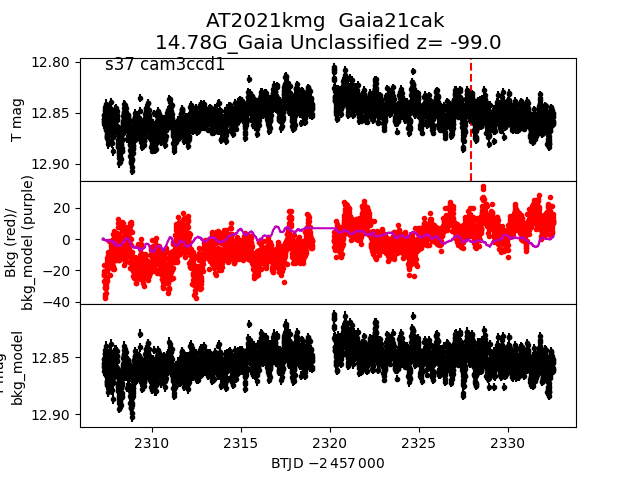
 2021kmg
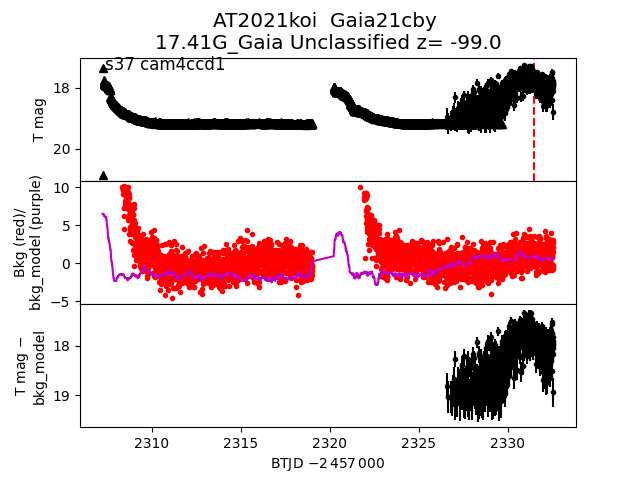
 2021koi
 2021ned
 2021kkt