all transients in sector36 (55 total)
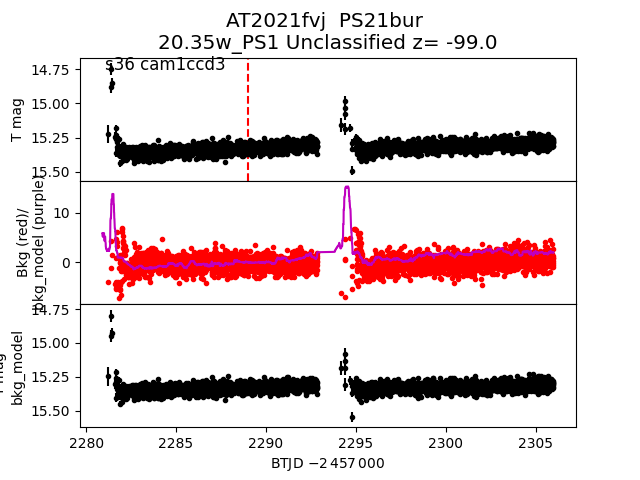
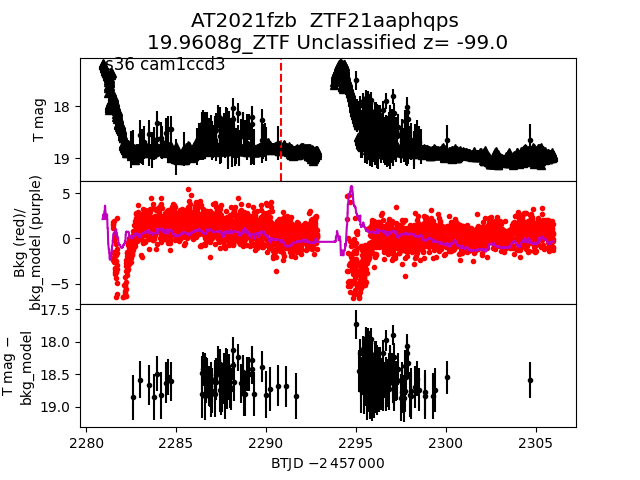
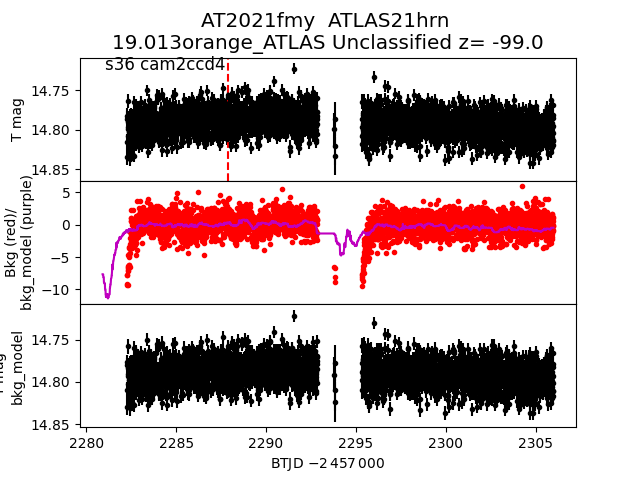
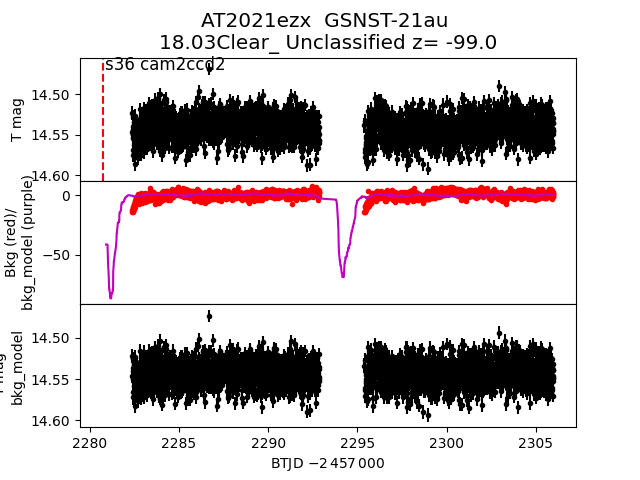
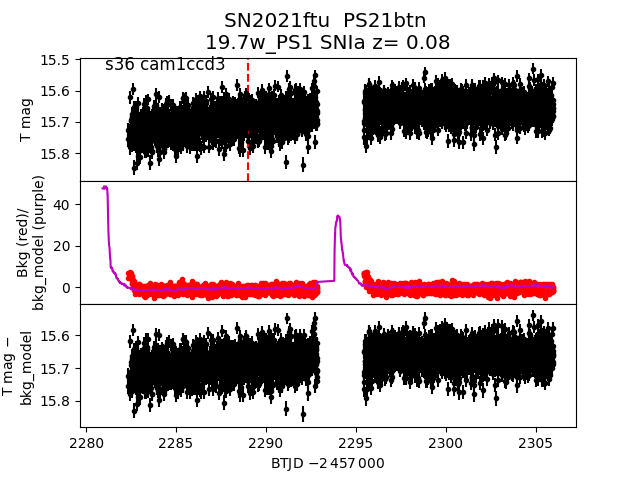
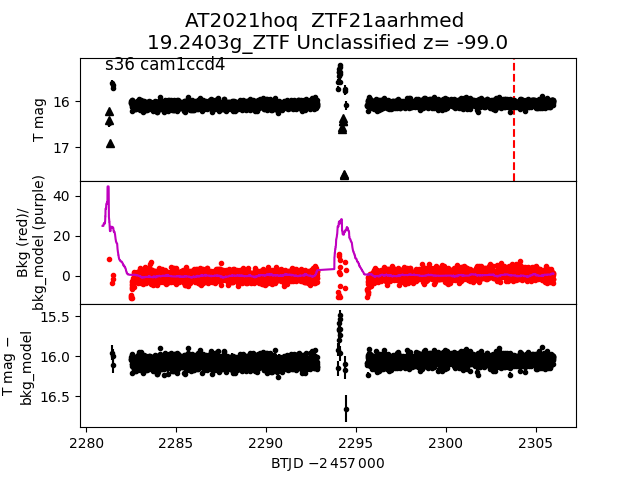
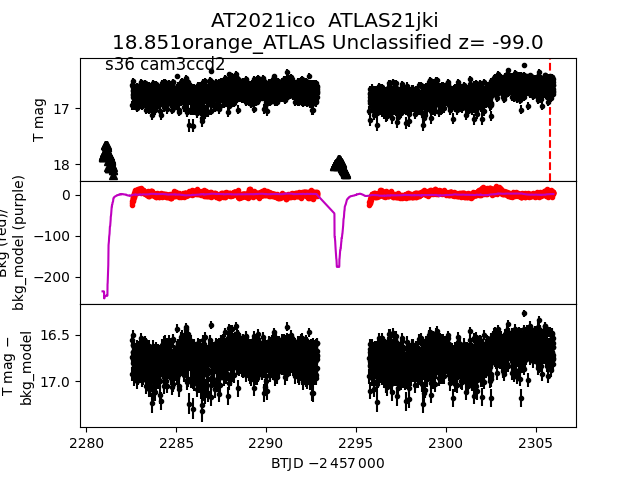
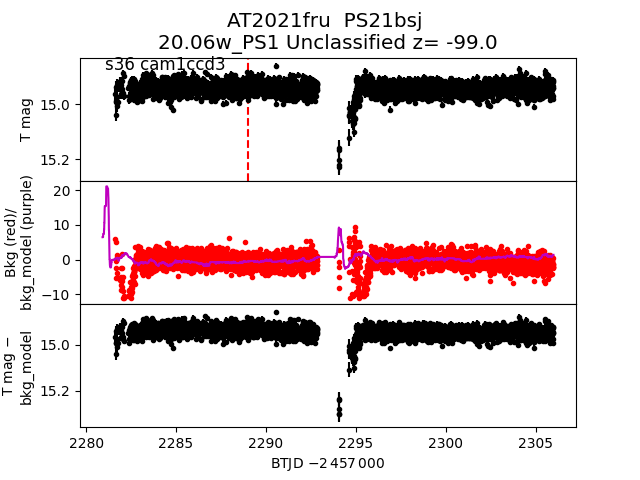
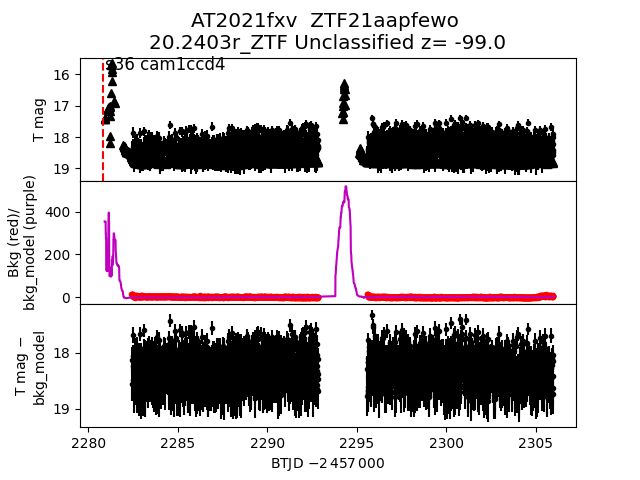
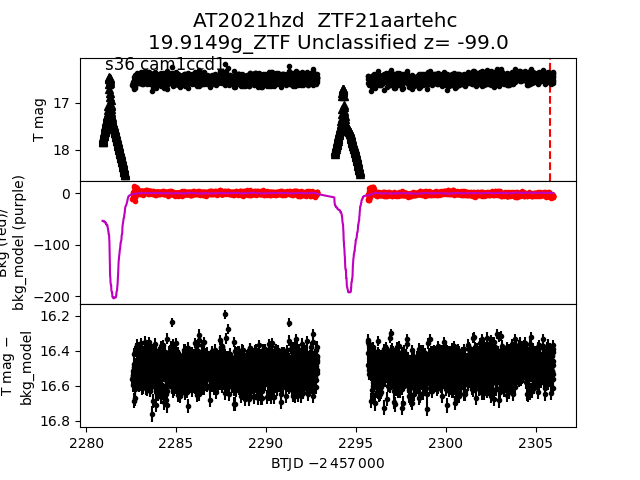
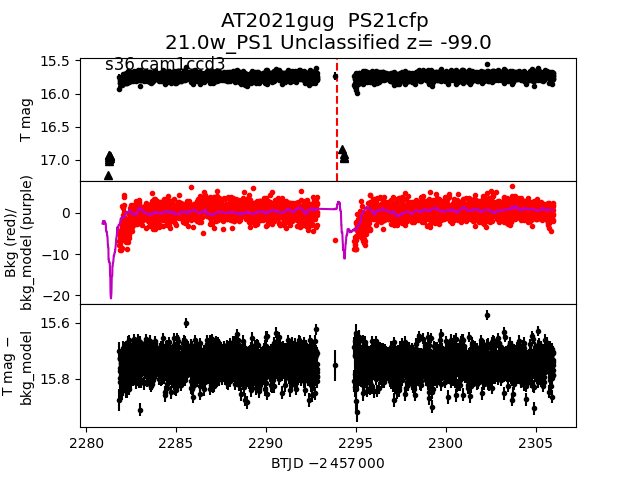
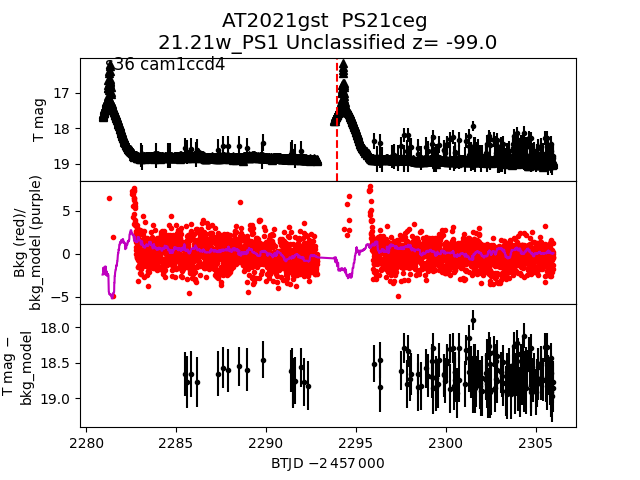
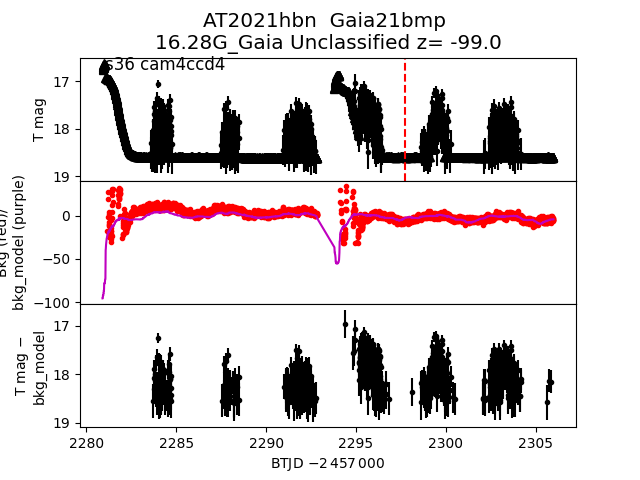
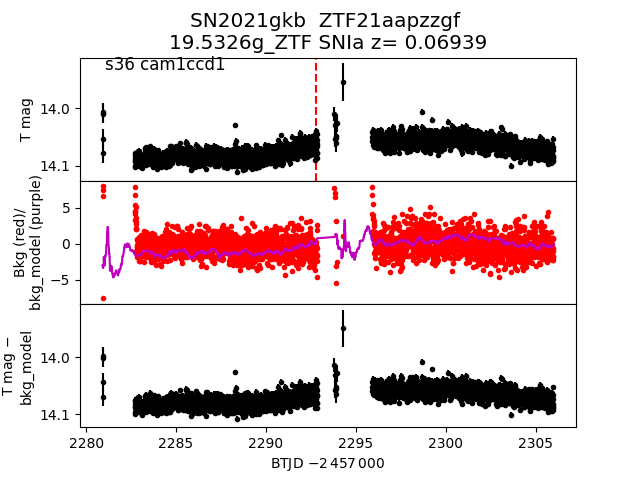
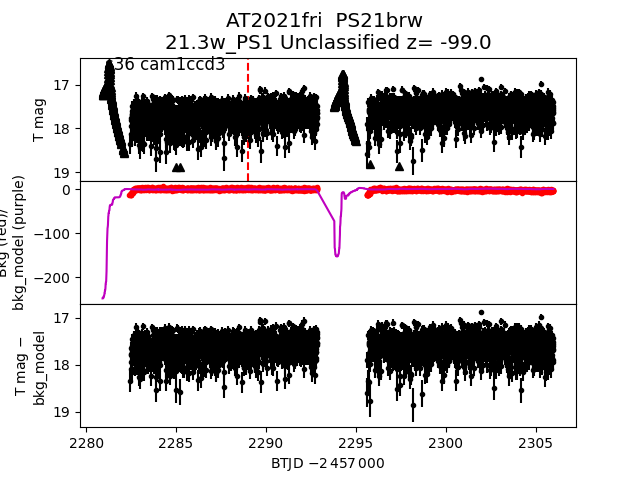
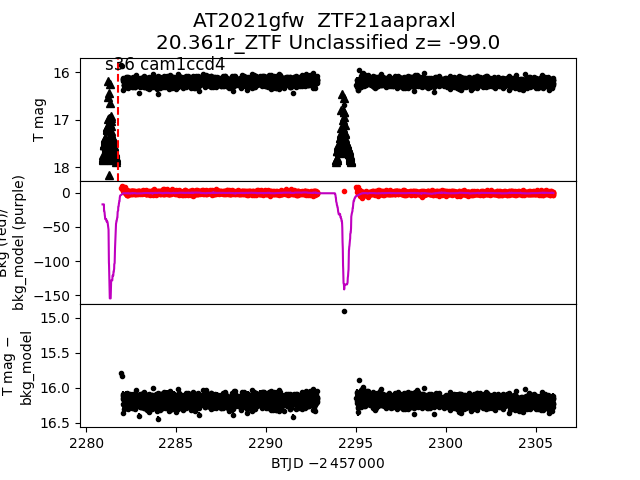
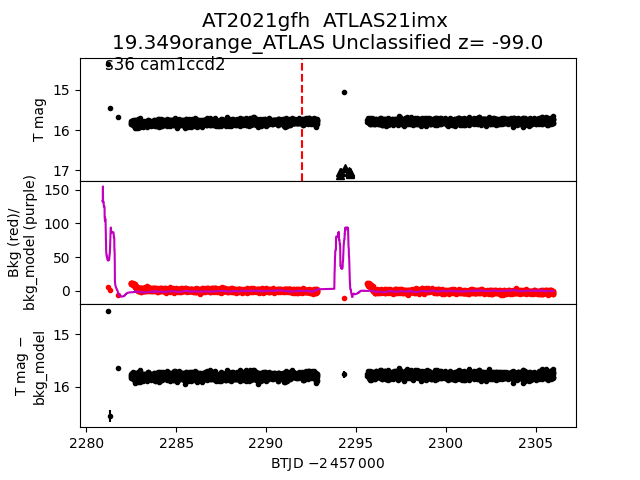
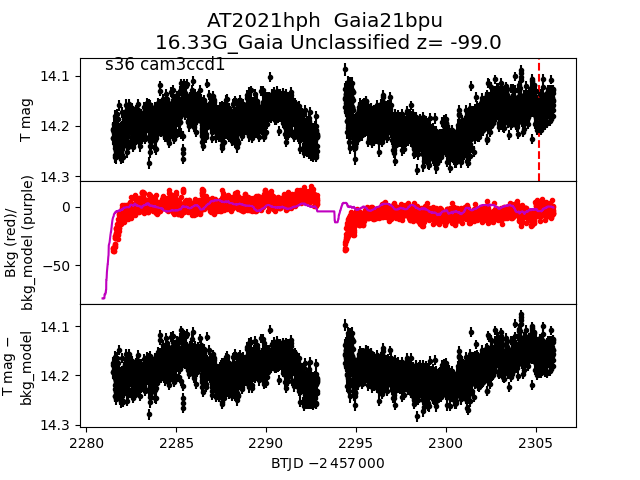
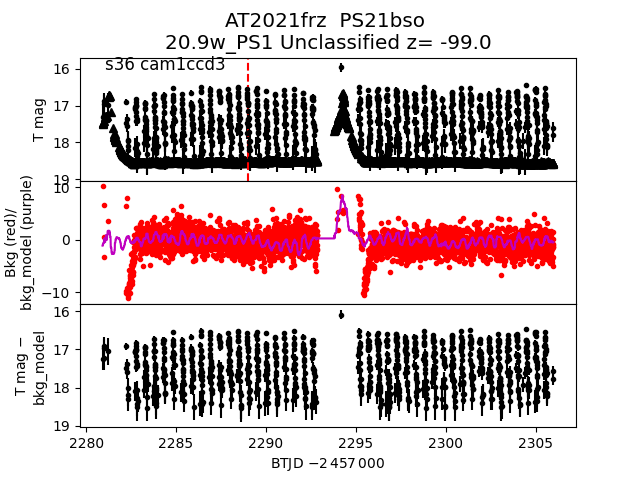
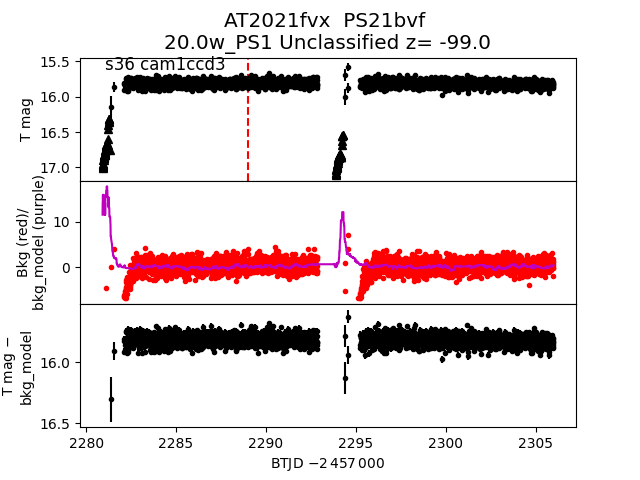
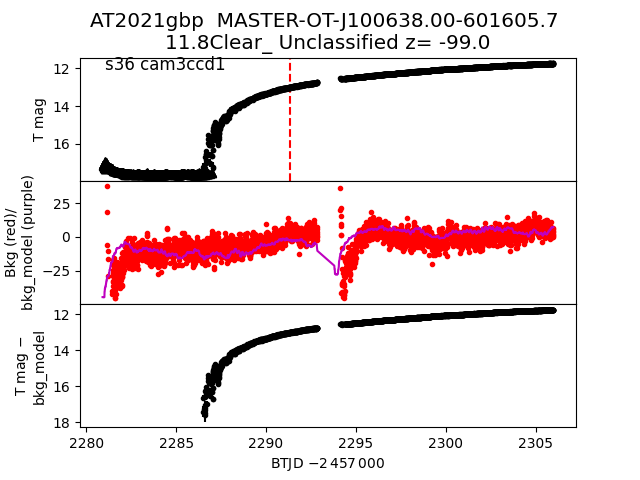
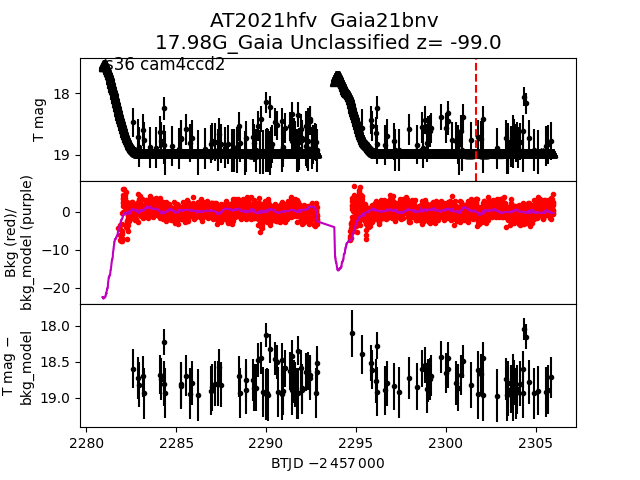
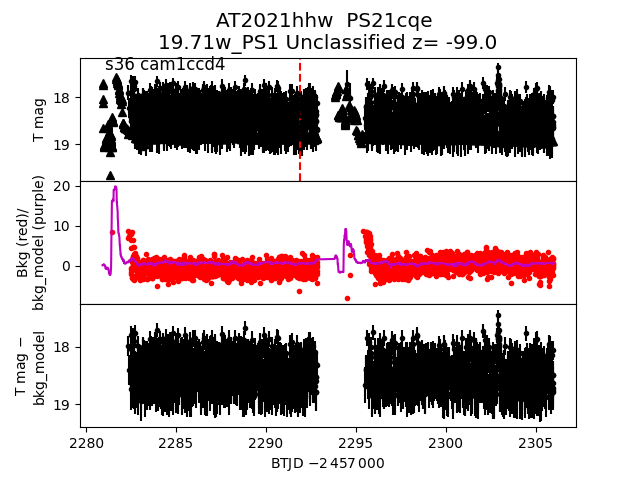
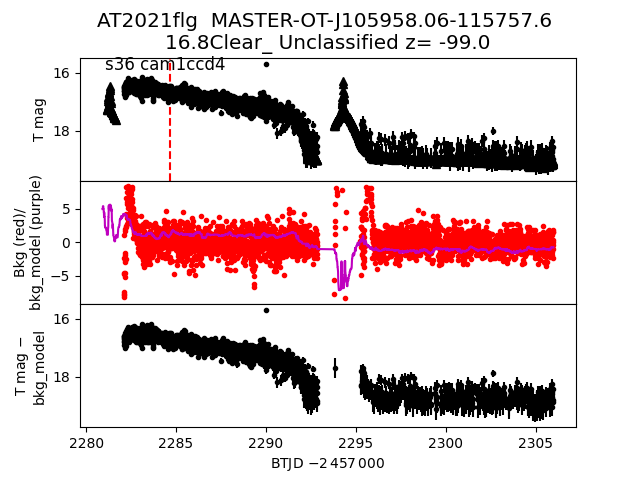
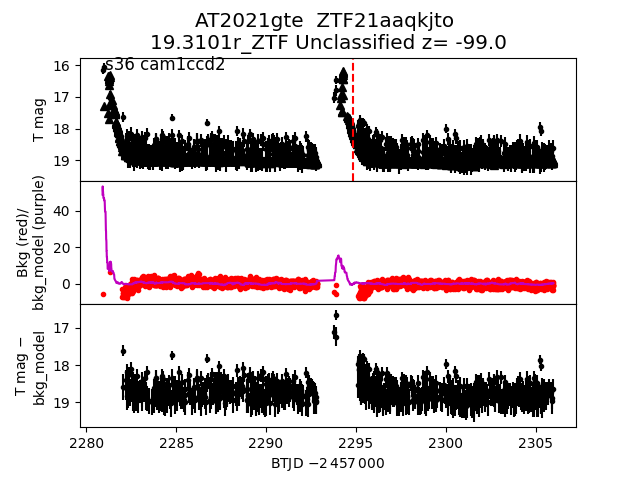
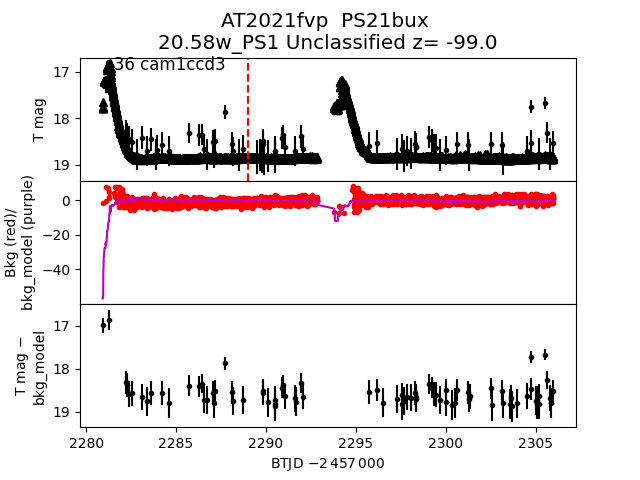
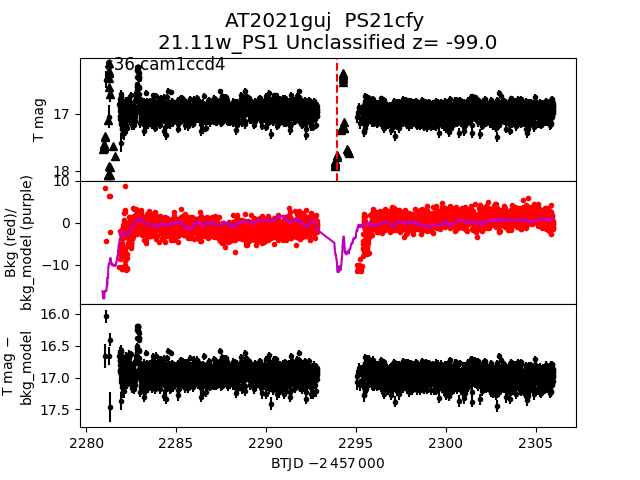
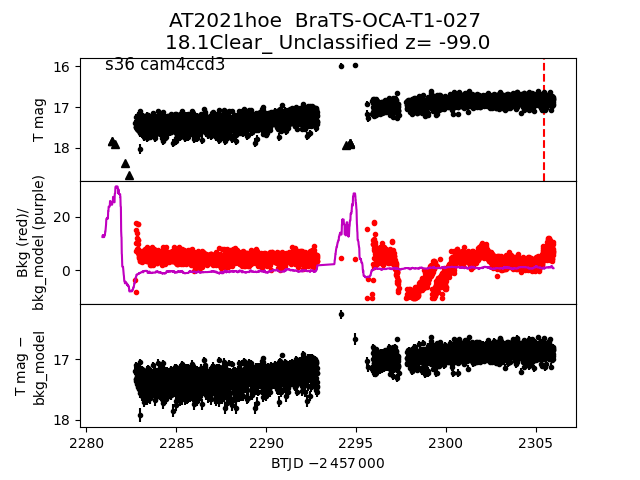
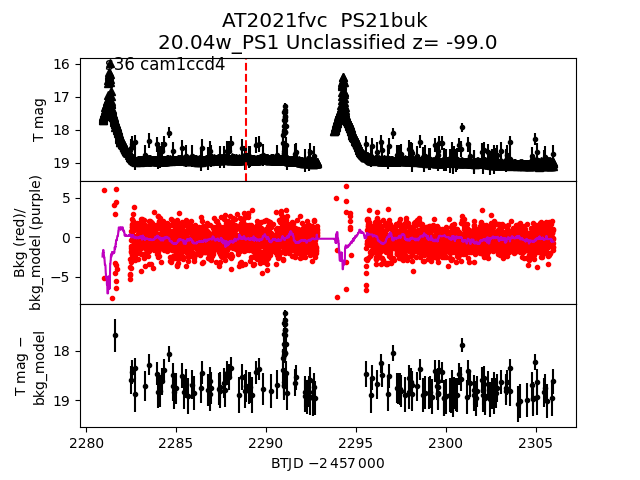
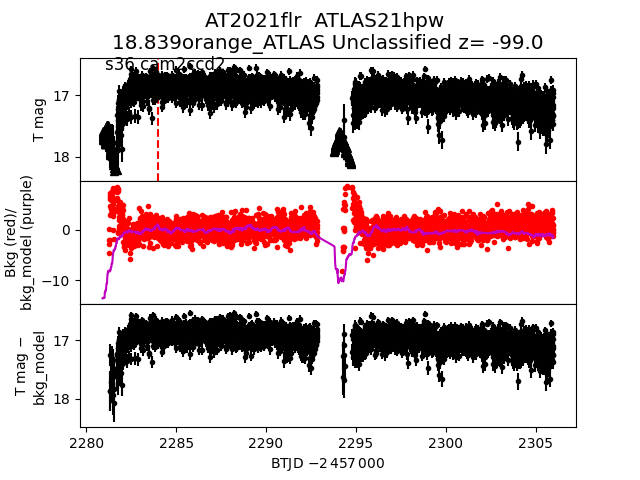
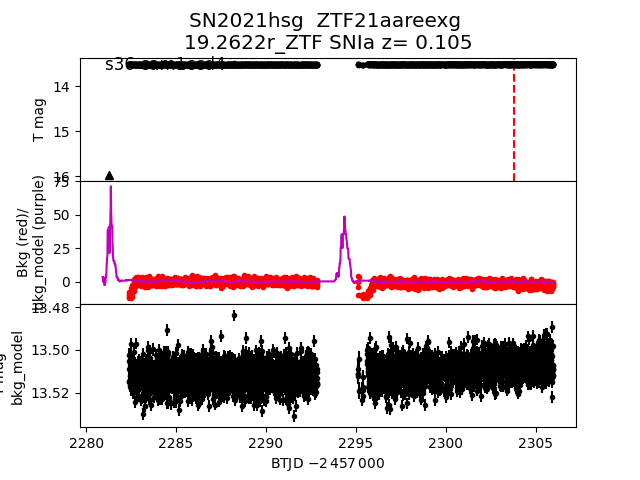
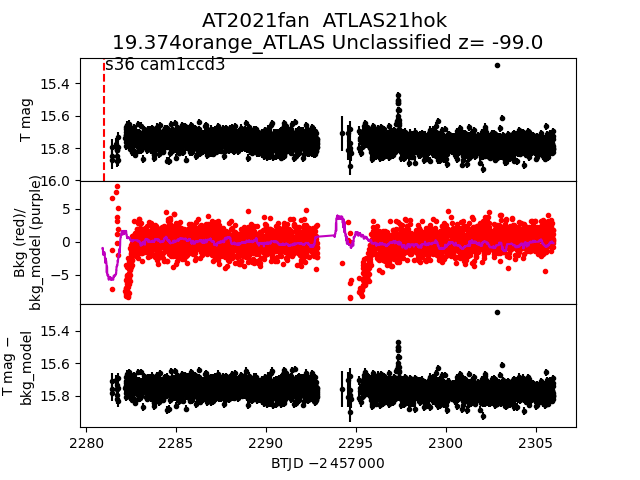
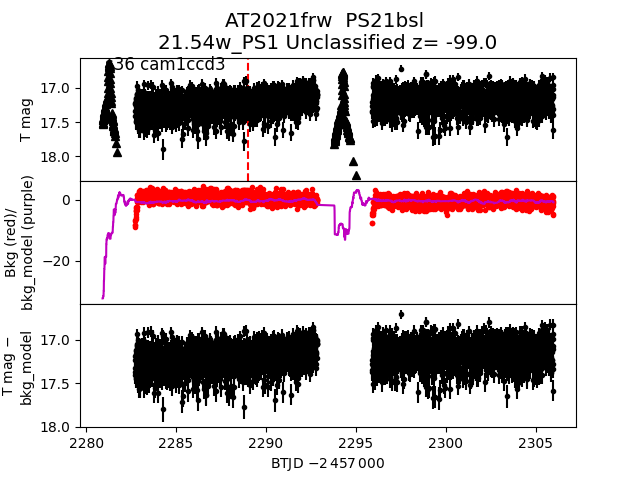
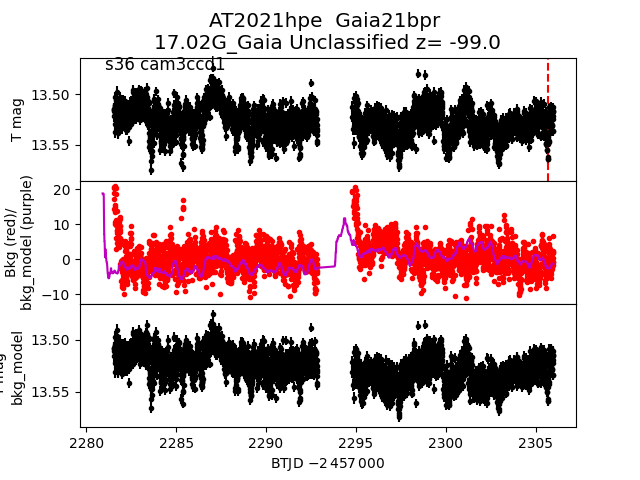
Each figure has three panels. The top panel shows the transient light curve, the middle panel shows the local background (estimated in an annulus), and the bottom panel shows a "background-model corrected" light curve. Details about the background model are in the README.
The vertical red line marks the time of discovery reported to TNS. Other useful metadata from TNS is in the figure title.
Note that the top and bottom panel are in magnitudes, while the middle panel is in differential flux units. The magnitudes are calibrated to the flux in the reference image used for image subtraction. Thus, flux from the host galaxy is included in these magnitudes.
3-sigma upper limits are plotted as triangles with no errorbars. A typical limiting magnitude is 19.6 in 30 minutes or 18.4 in 200 seconds (for low backgrounds).
The links allow you to download the light curve data as a text file.
More details in the README.
2021fzb
 2021fmy
 2021ezx
 2021ftu
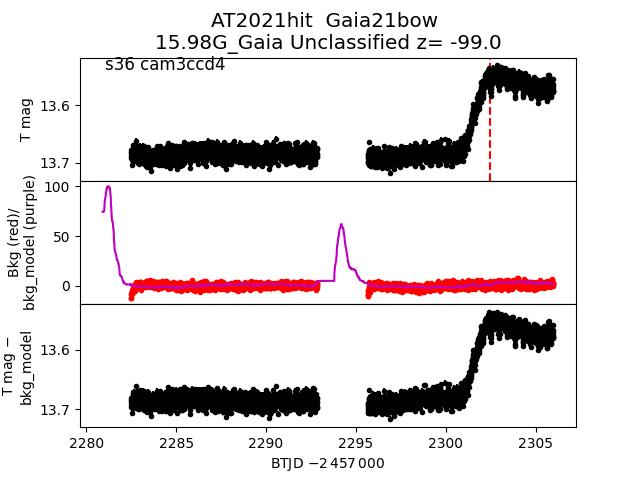
 2021hit
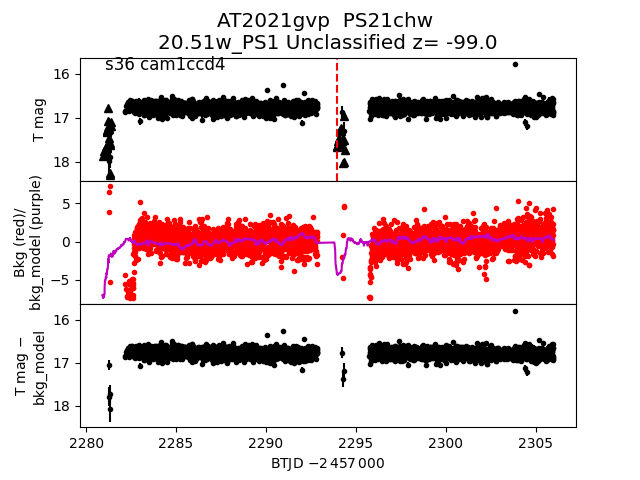
 2021gvp
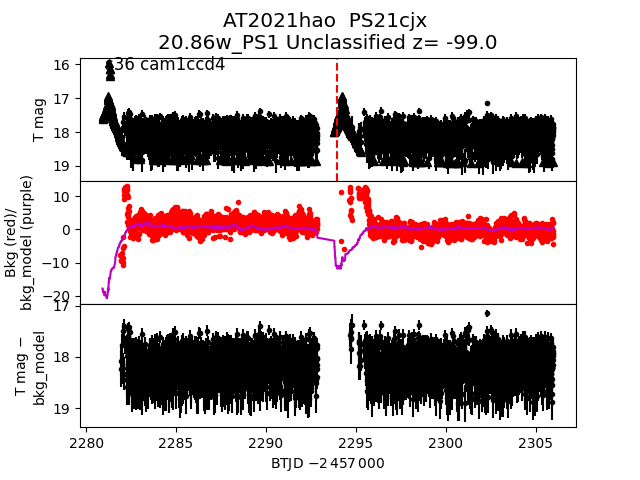
 2021hao
 2021hoq
 2021ico
 2021fru
 2021fxv
 2021hzd
 2021gug
 2021gst
 2021hbn
 2021gkb
 2021fri
 2021gfw
 2021gfh
 2021hph
 2021frz
 2021fvx
 2021gbp
 2021hfv
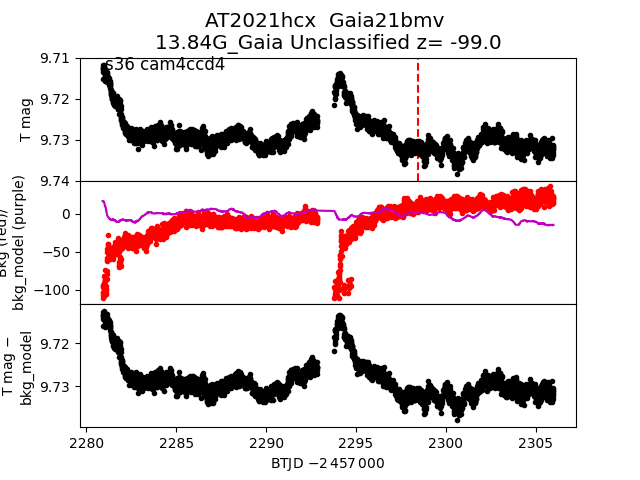
 2021hcx
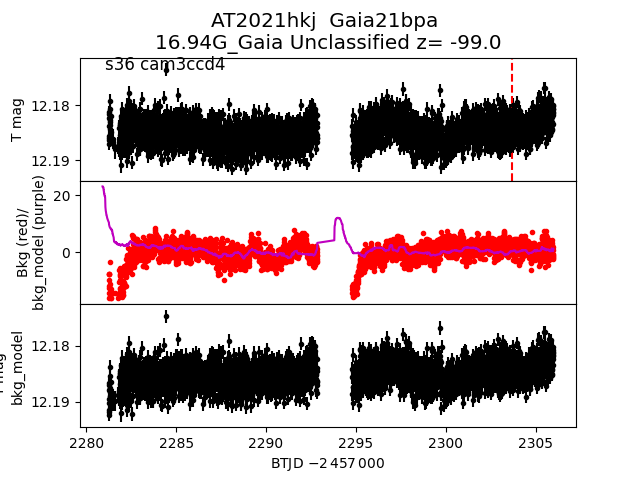
 2021hkj
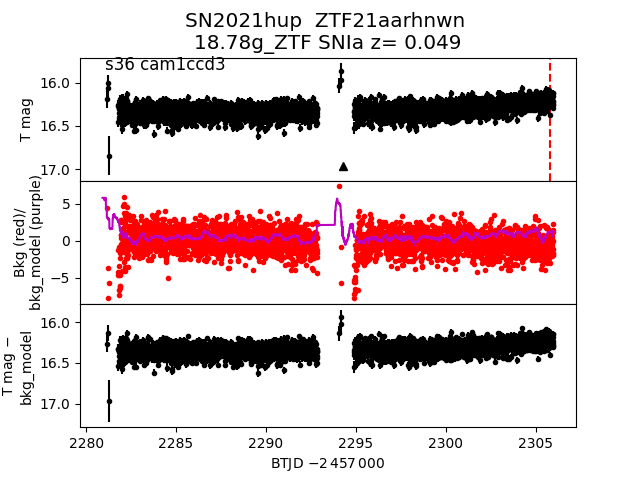
 2021hup
 2021hhw
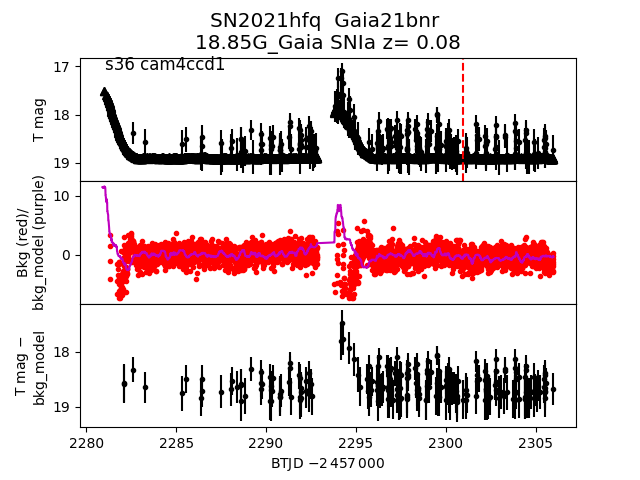
 2021hfq
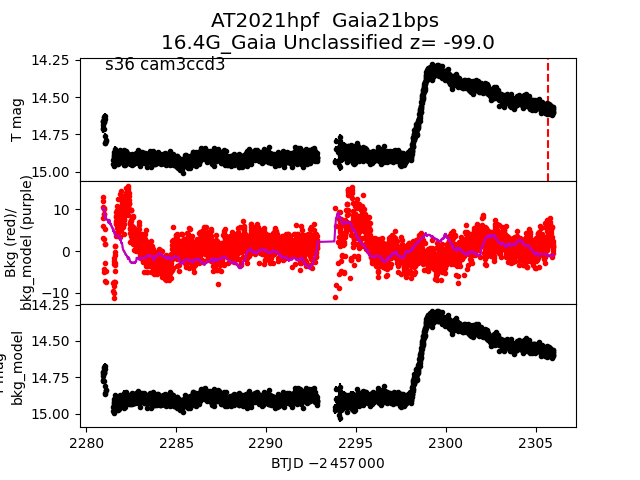
 2021hpf
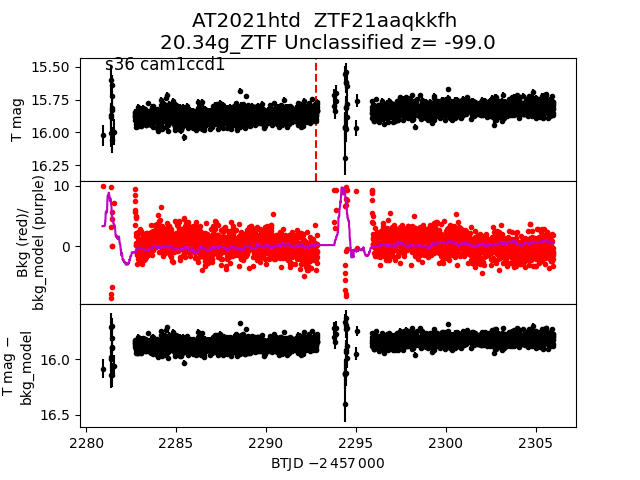
 2021htd
 2021flg
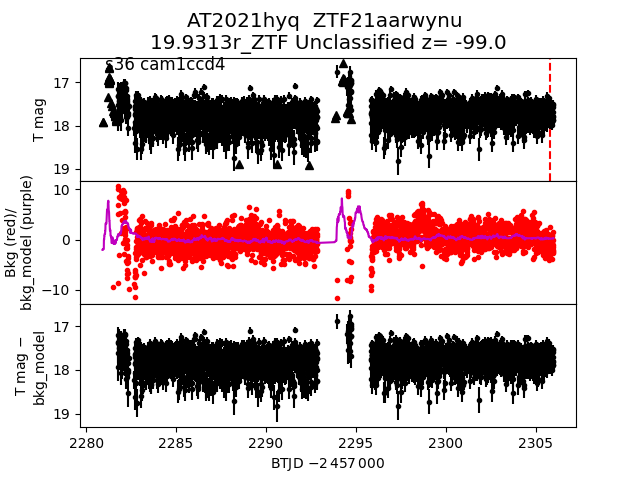
 2021hyq
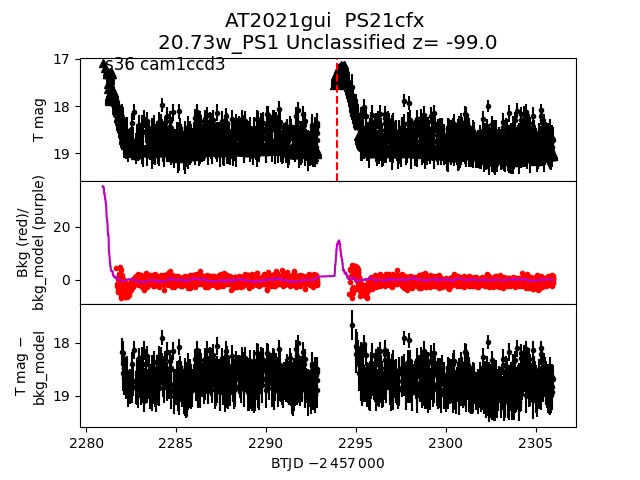
 2021gui
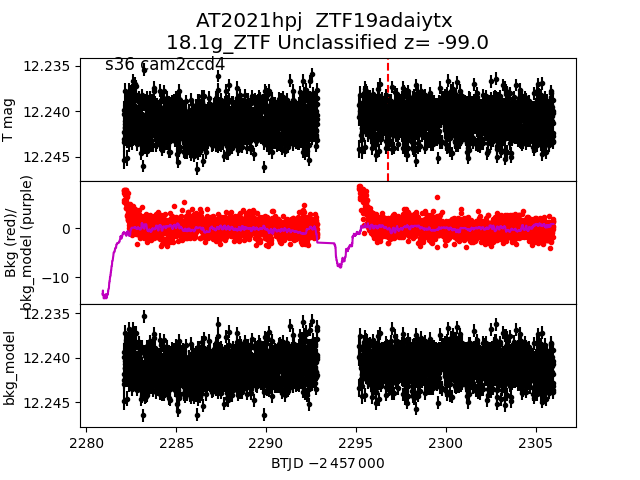
 2021hpj
 2021gte
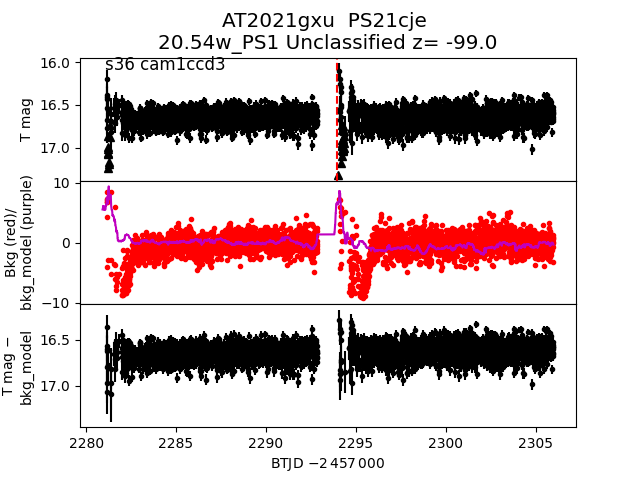
 2021gxu
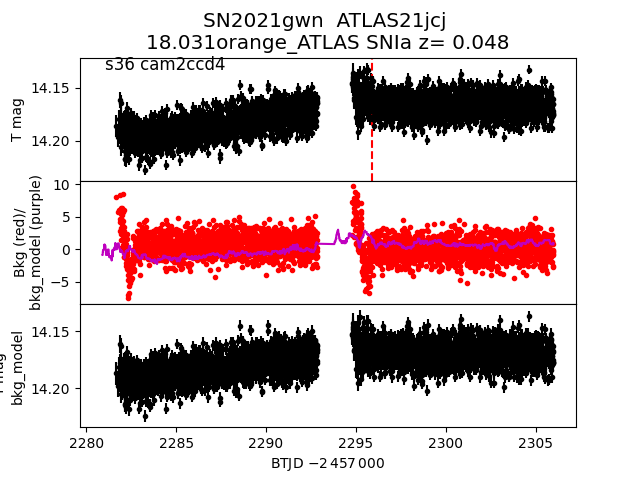
 2021gwn
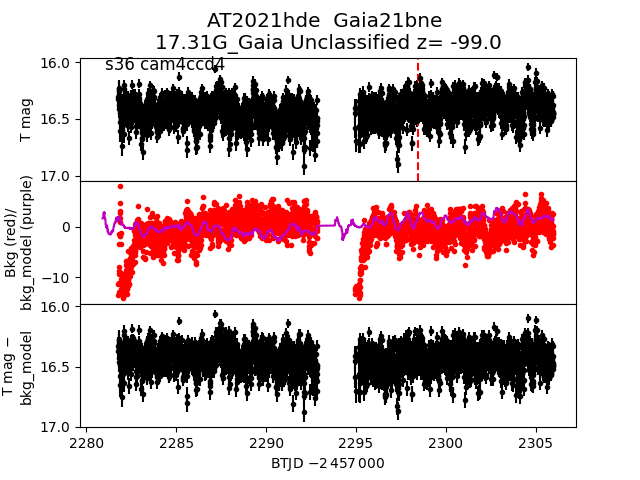
 2021hde
 2021fvp
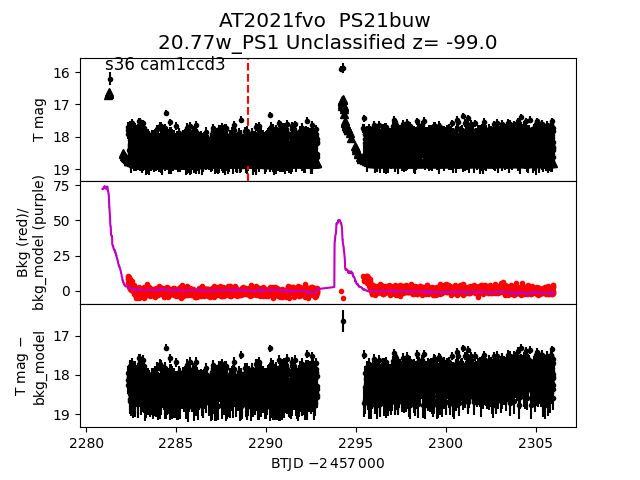
 2021fvo
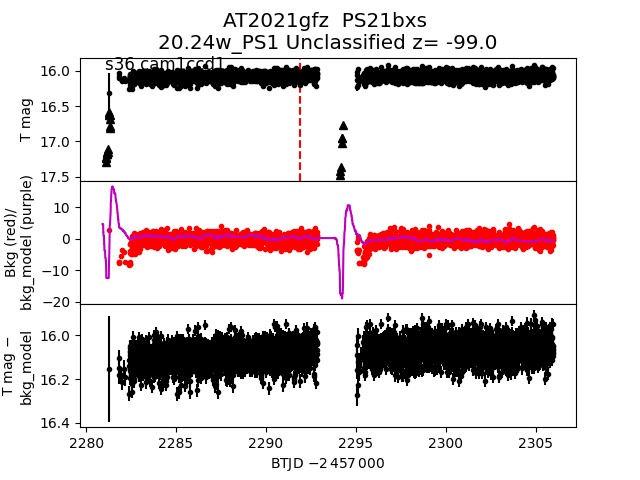
 2021gfz
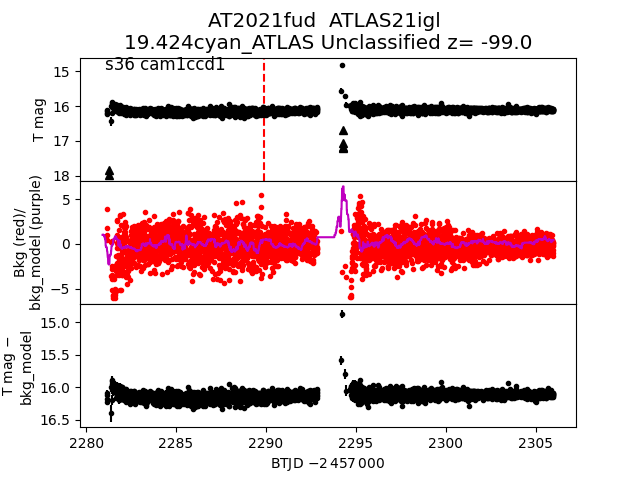
 2021fud
 2021guj
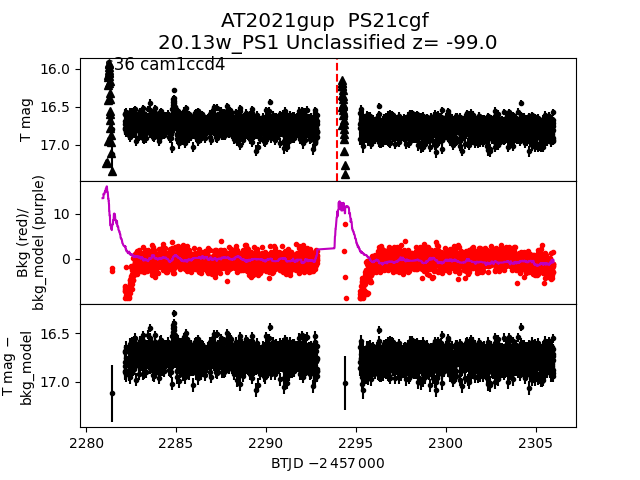
 2021gup
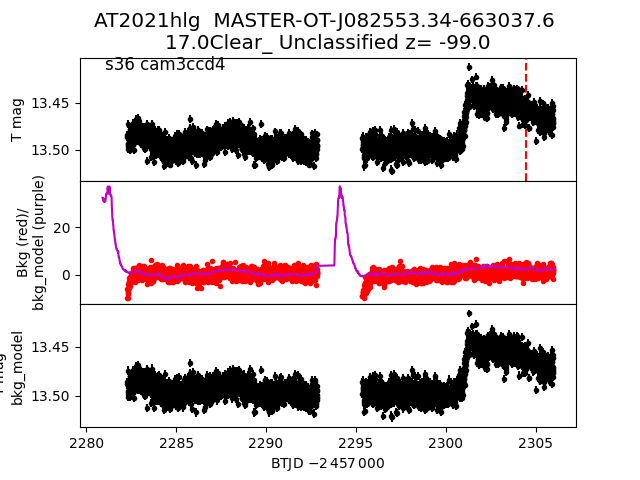
 2021hlg
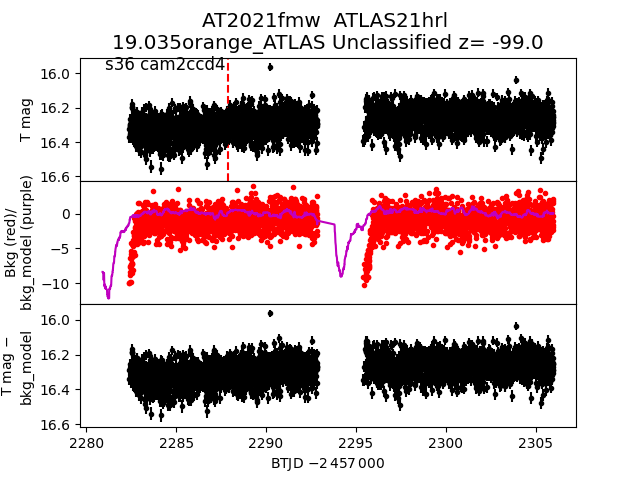
 2021fmw
 2021hoe
 2021fvc
 2021flr
 2021hsg
 2021fan
 2021frw
 2021hpe
 2021fvj