all transients in sector35 (83 total)
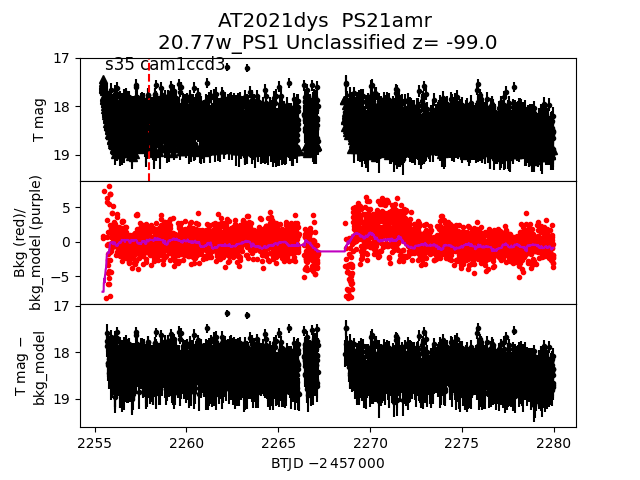
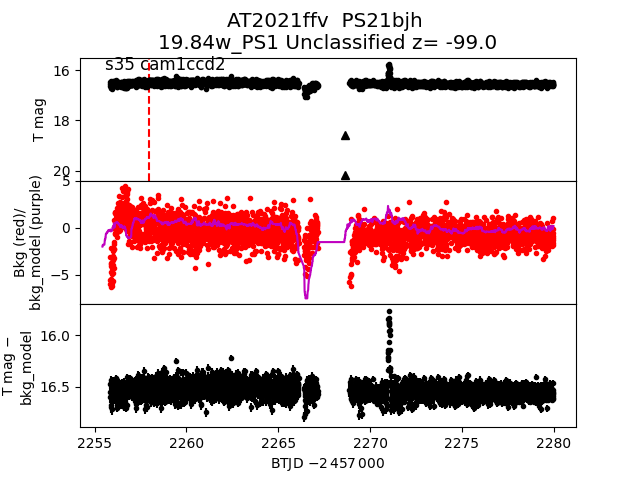
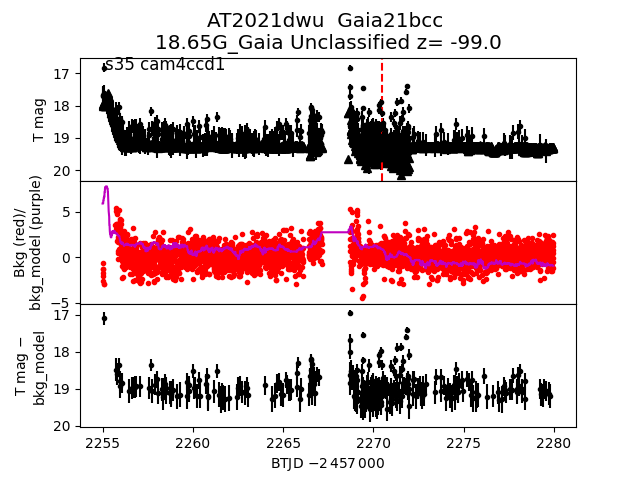
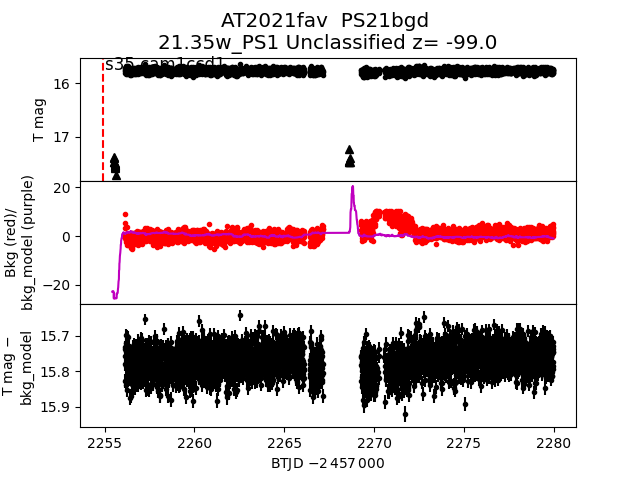
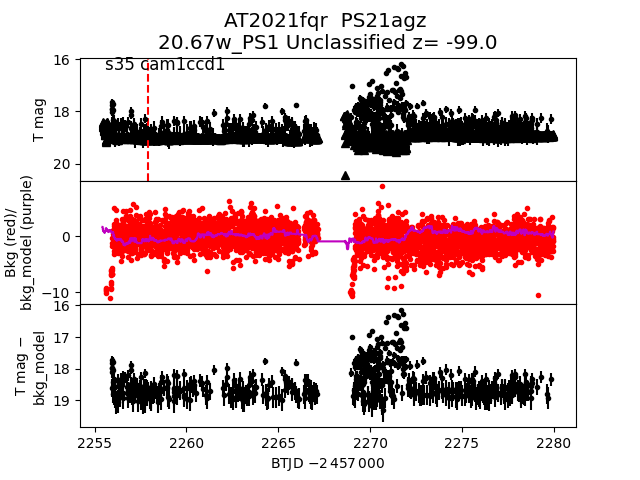
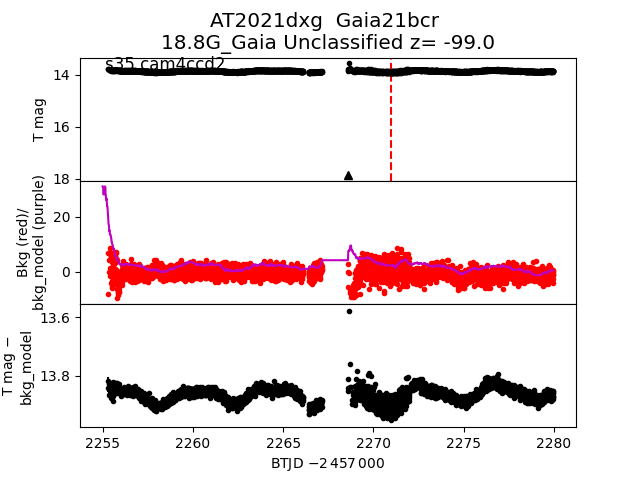
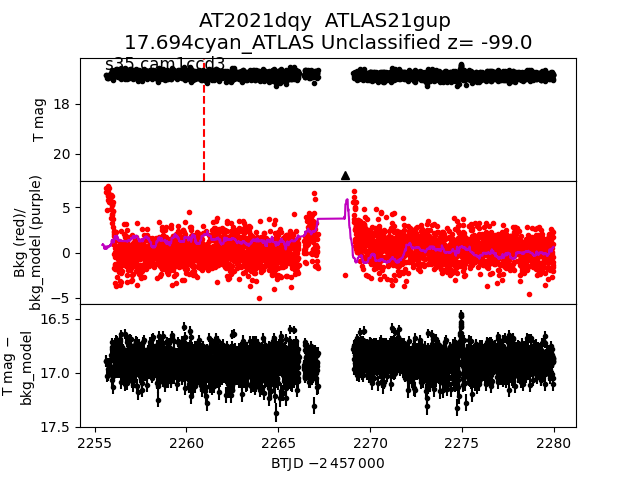
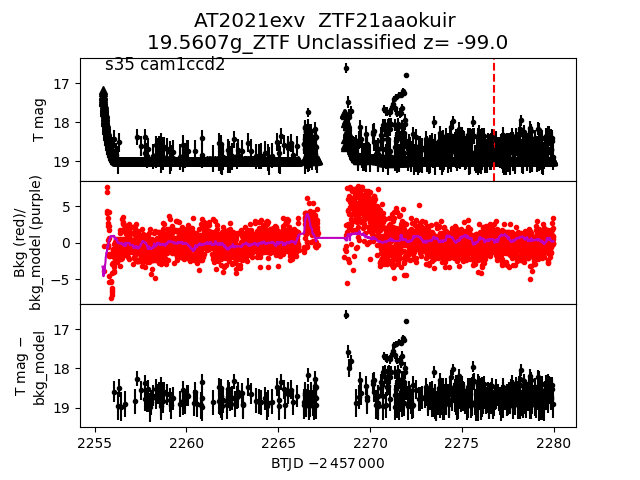
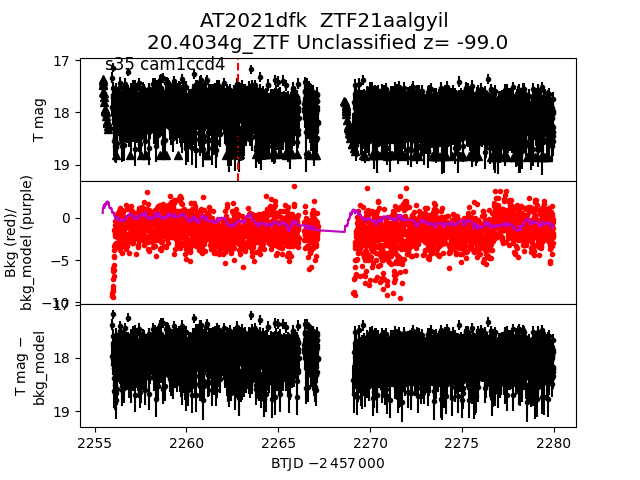
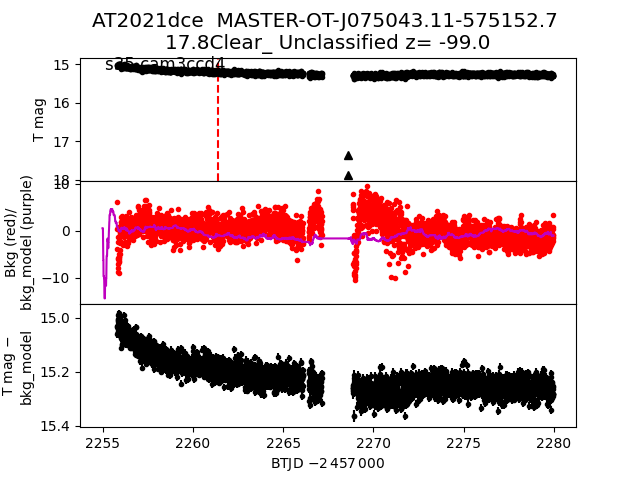
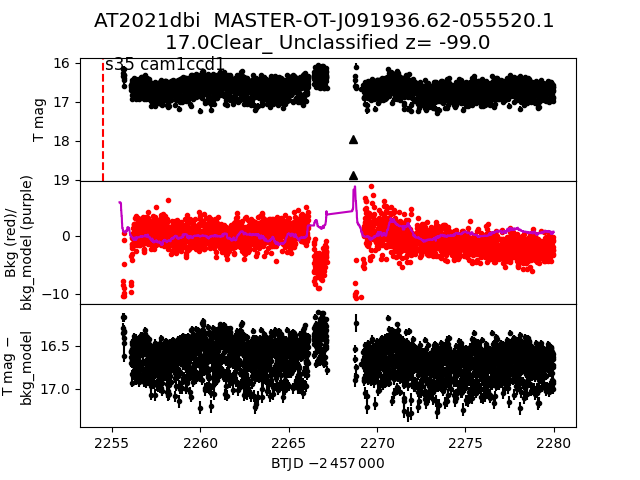
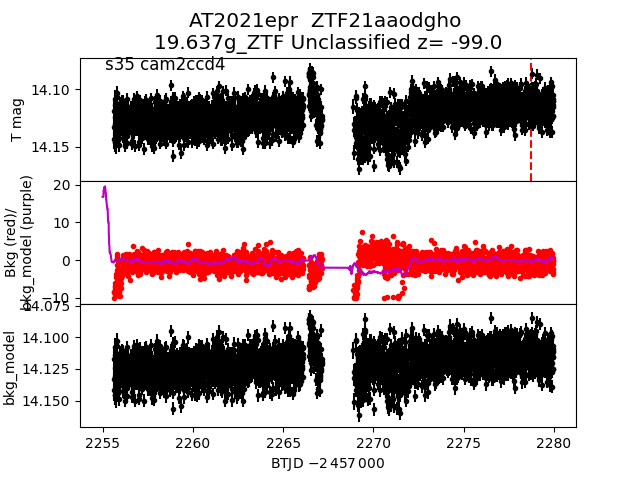
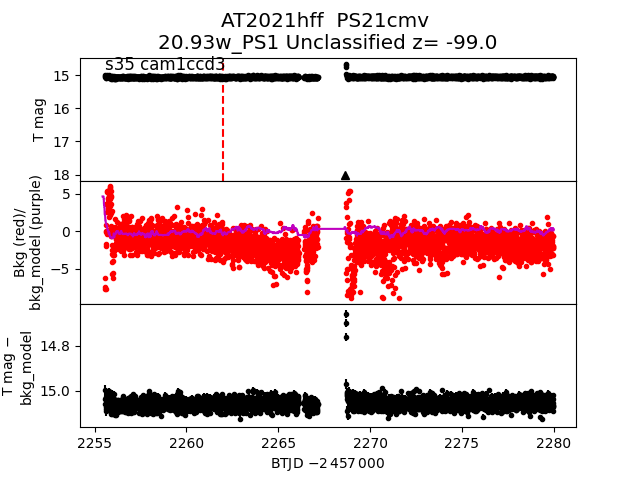
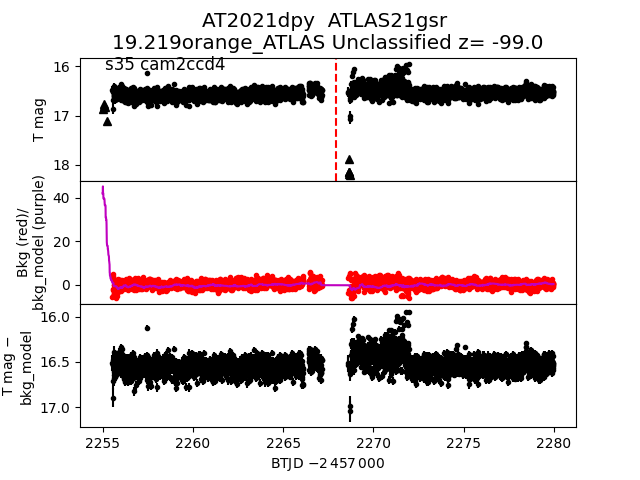
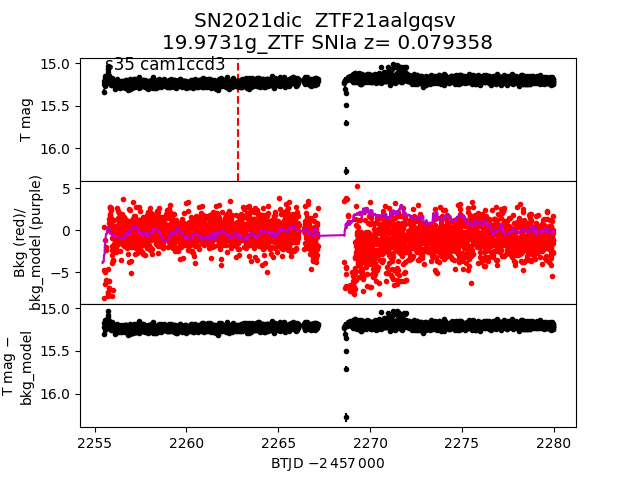
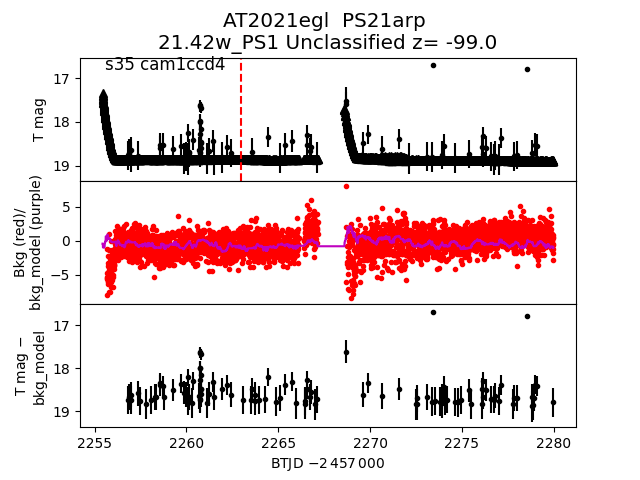
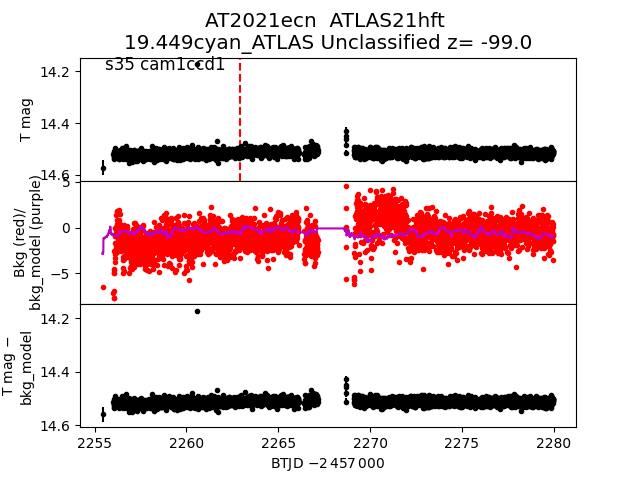
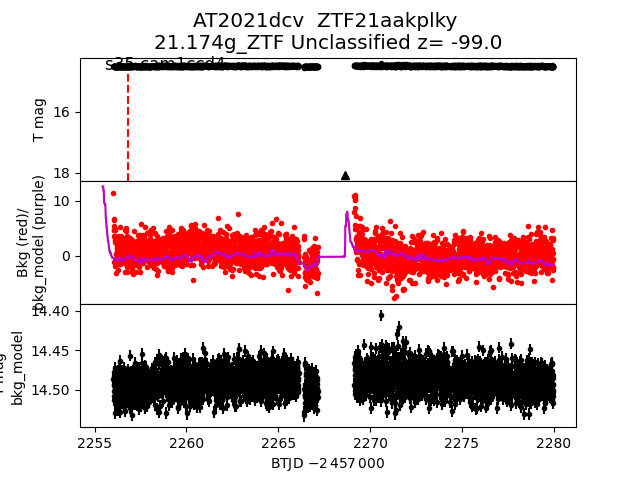
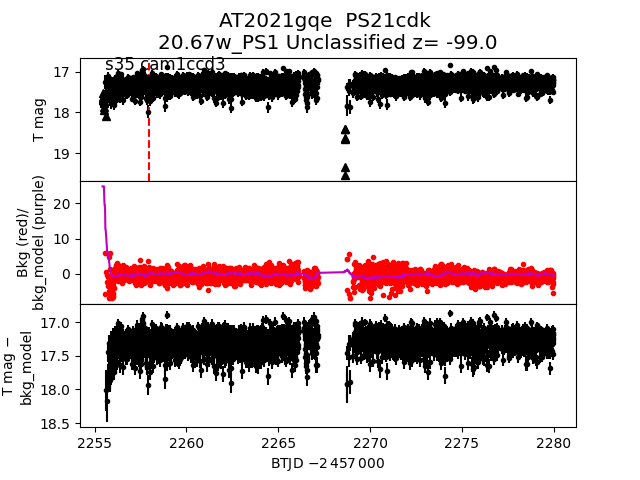
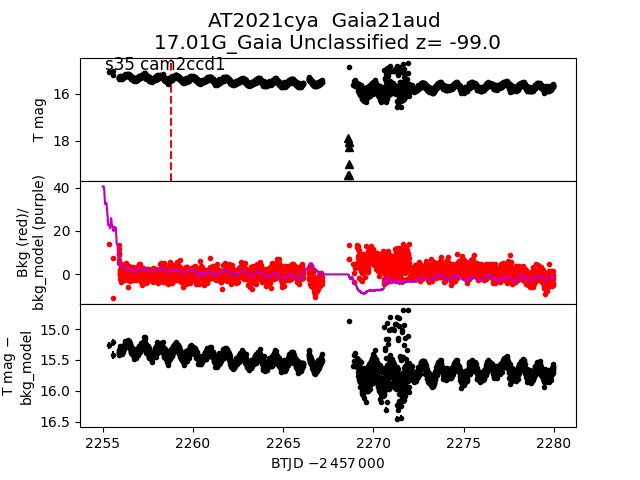
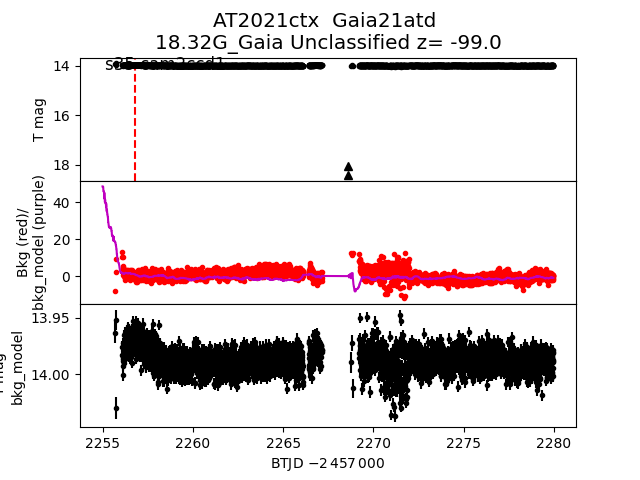
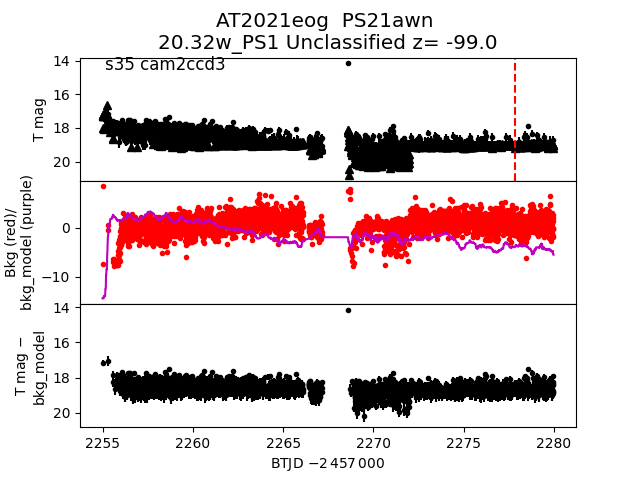
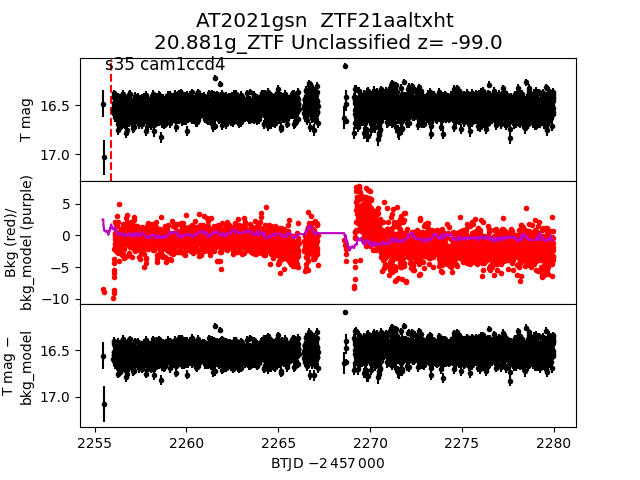
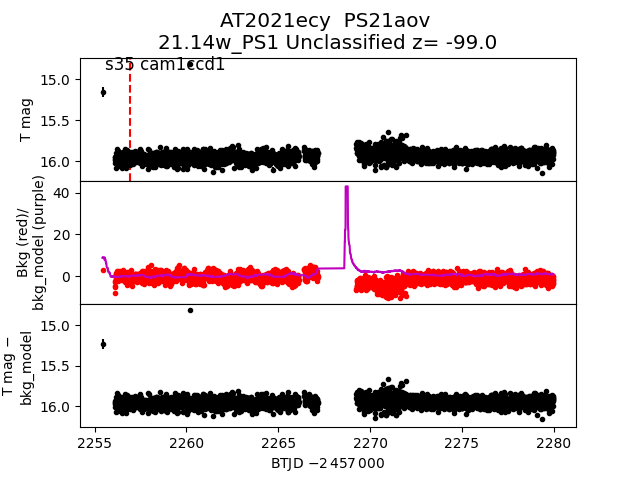
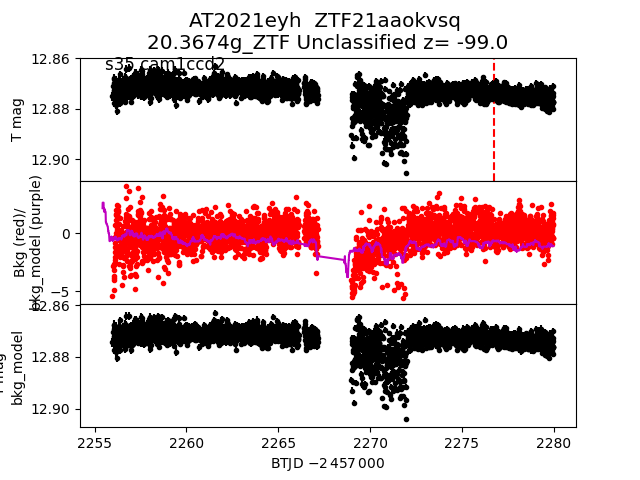
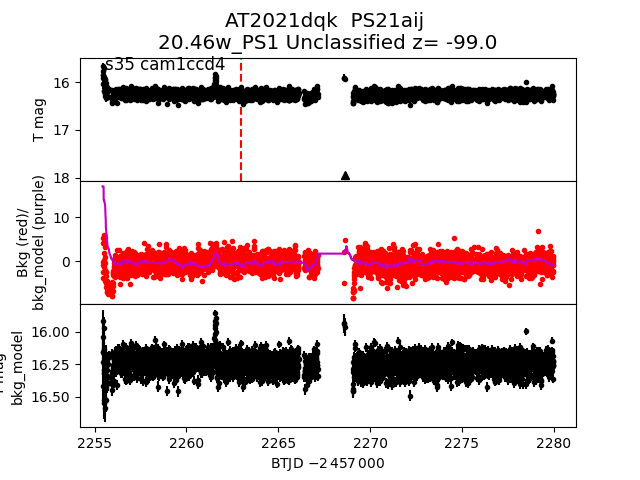
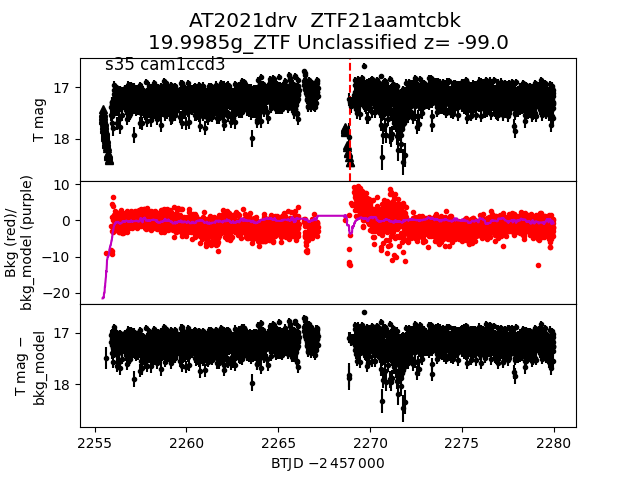
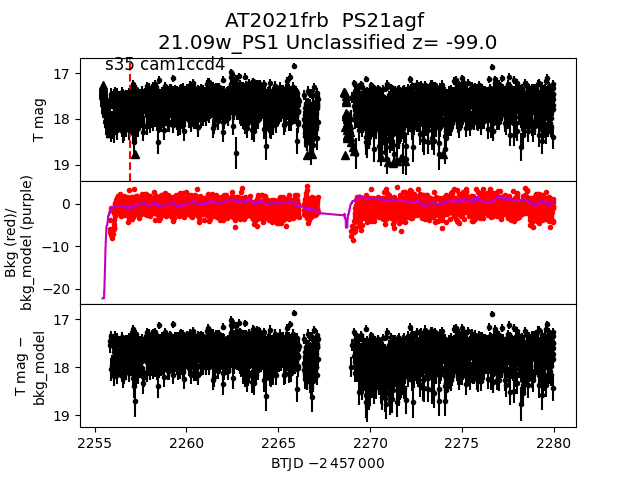
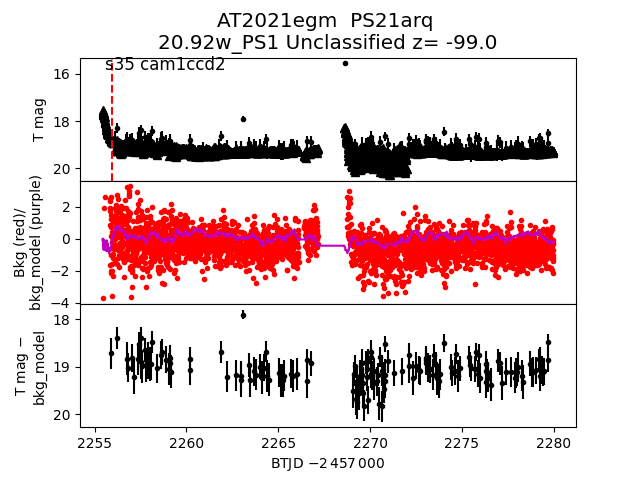
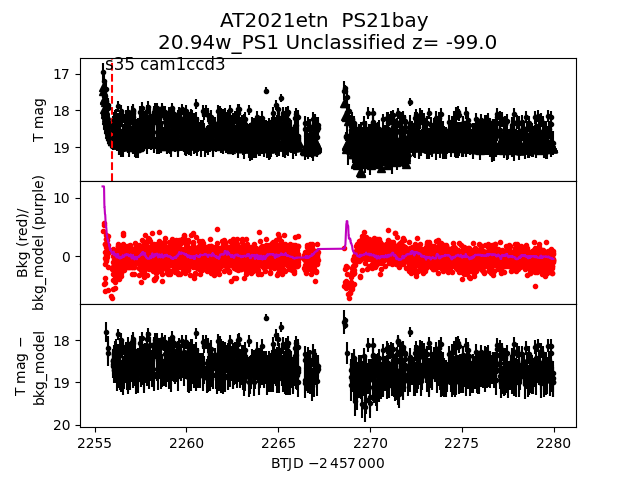
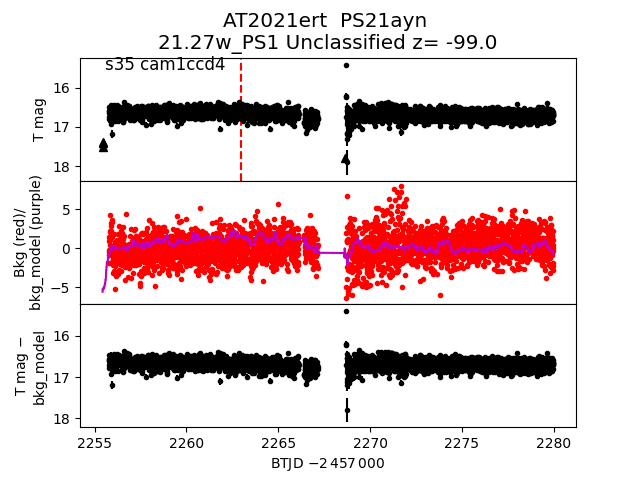
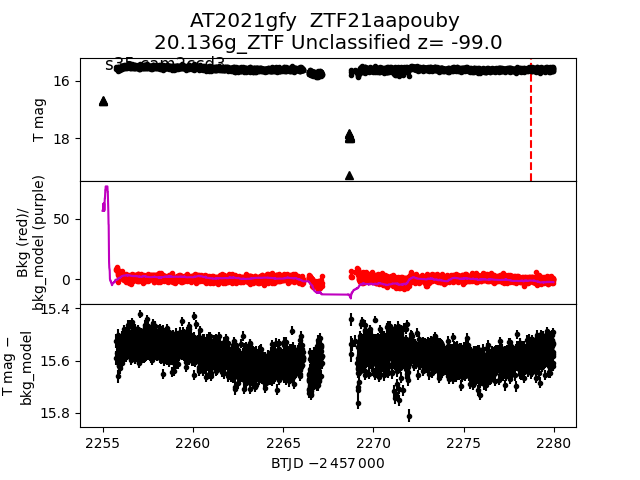
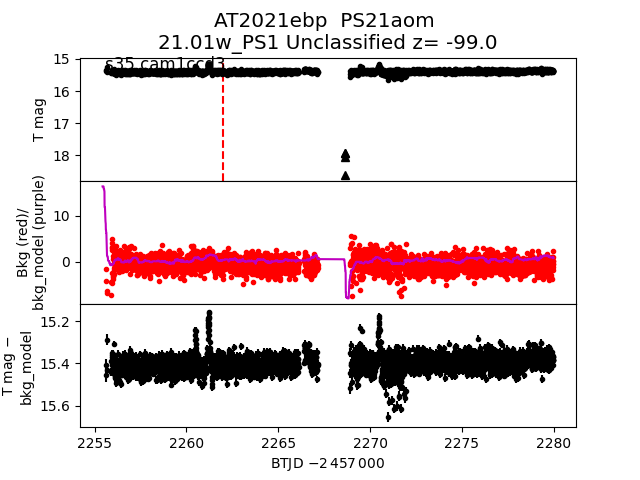
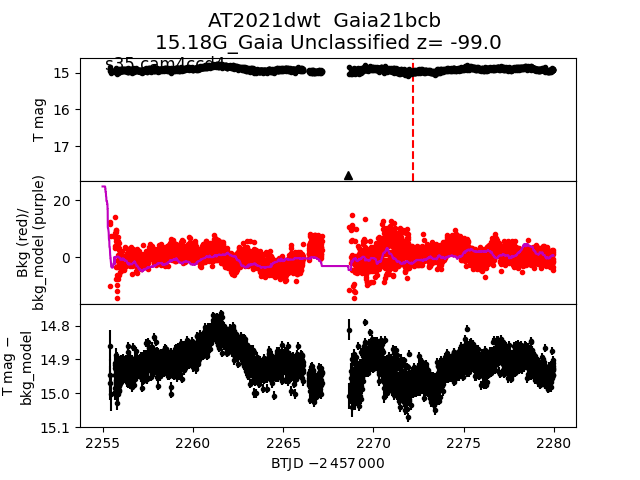
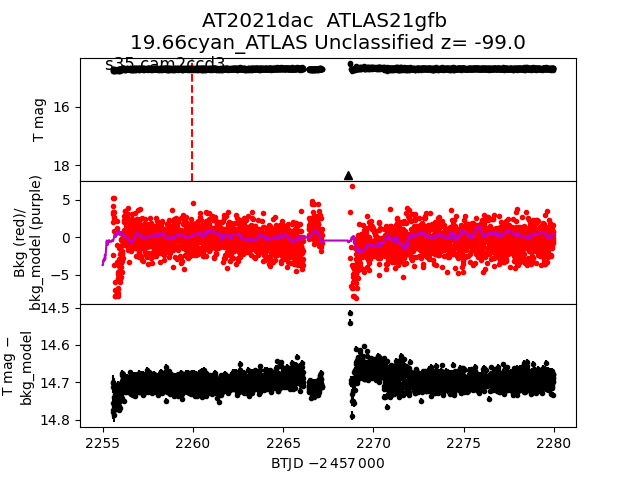
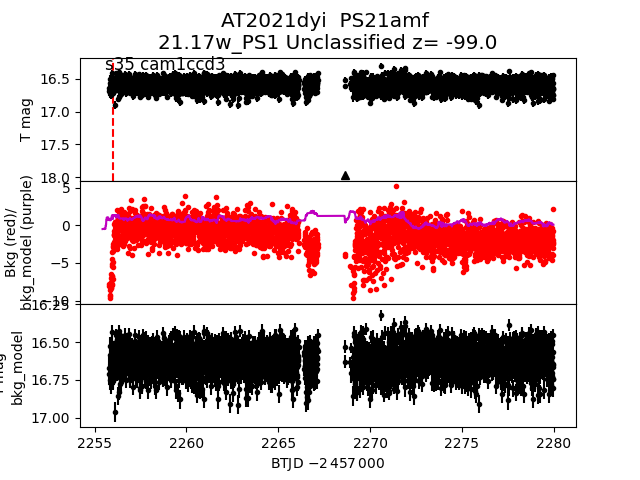
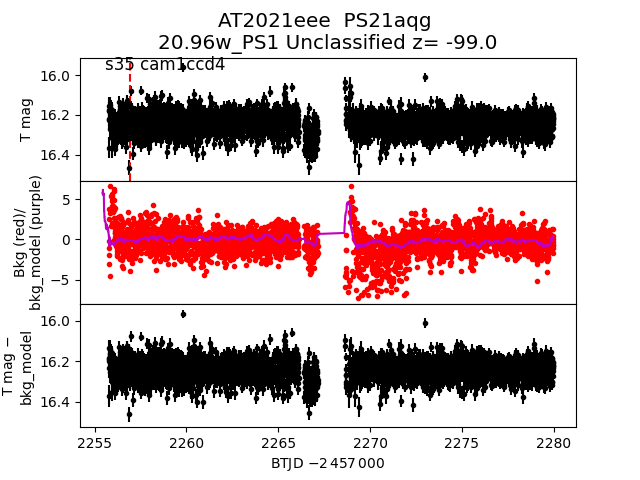
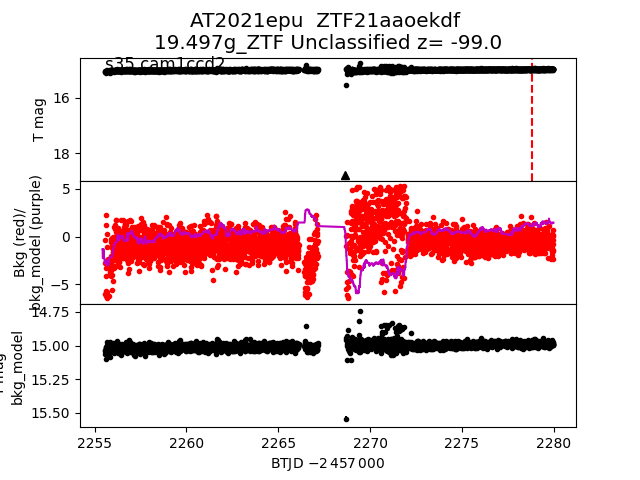
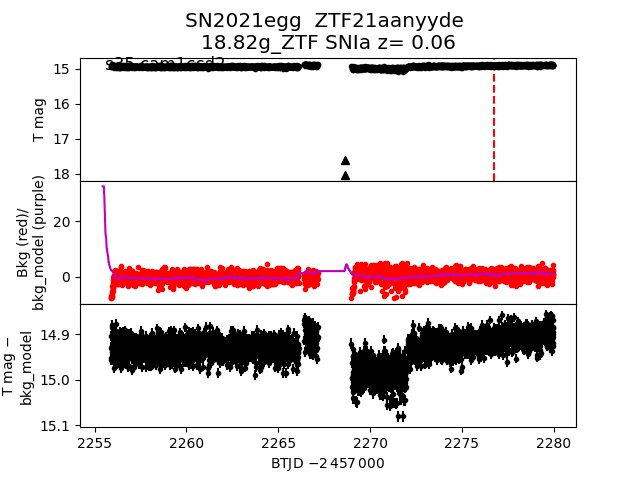
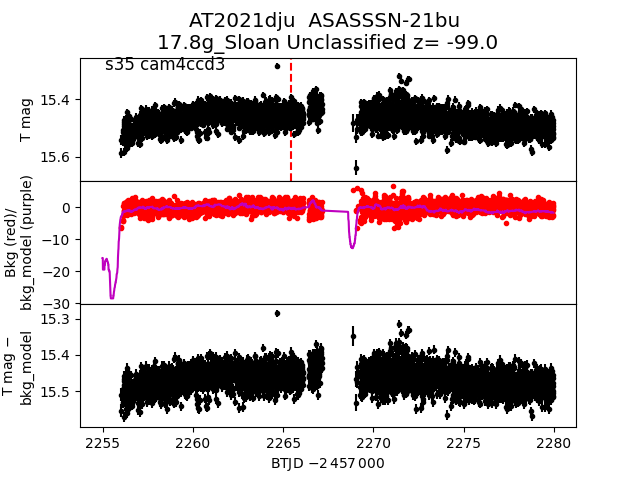
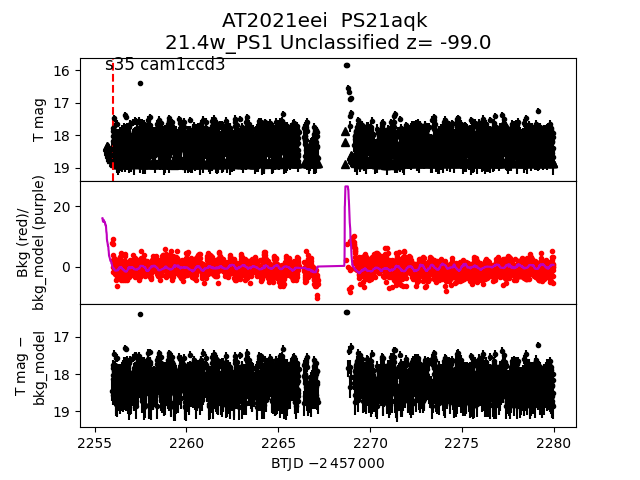
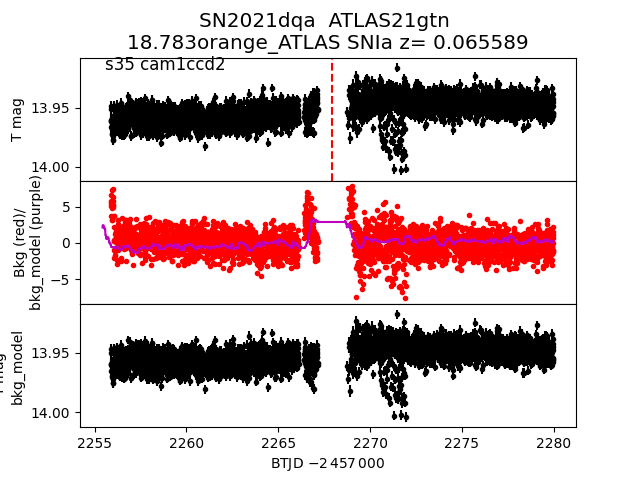
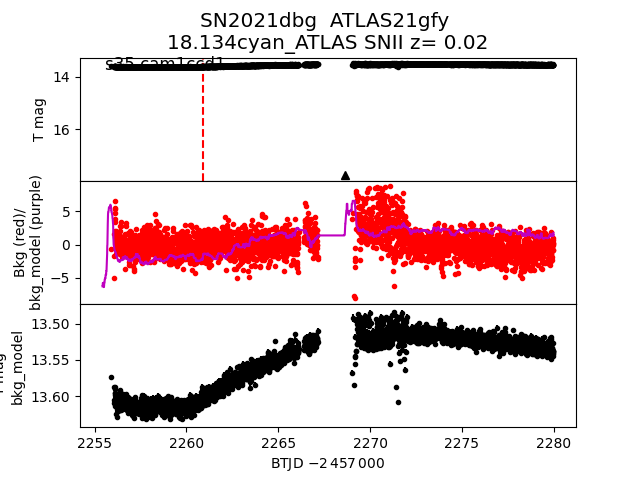
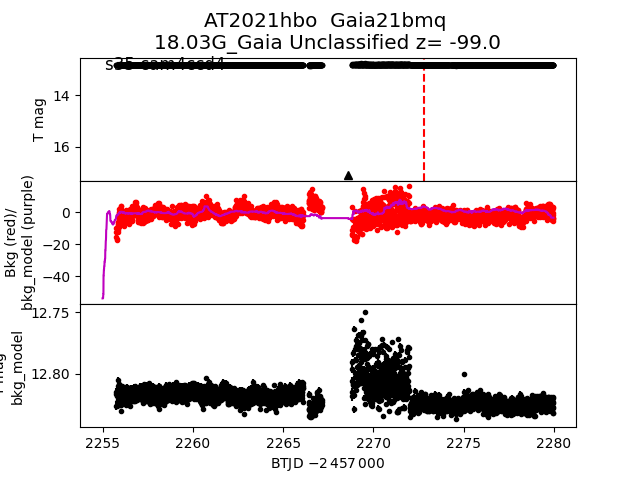
Each figure has three panels. The top panel shows the transient light curve, the middle panel shows the local background (estimated in an annulus), and the bottom panel shows a "background-model corrected" light curve. Details about the background model are in the README.
The vertical red line marks the time of discovery reported to TNS. Other useful metadata from TNS is in the figure title.
Note that the top and bottom panel are in magnitudes, while the middle panel is in differential flux units. The magnitudes are calibrated to the flux in the reference image used for image subtraction. Thus, flux from the host galaxy is included in these magnitudes.
3-sigma upper limits are plotted as triangles with no errorbars. A typical limiting magnitude is 19.6 in 30 minutes or 18.4 in 200 seconds (for low backgrounds).
The links allow you to download the light curve data as a text file.
More details in the README.
2021ffv
 2021dwu
 2021fav
 2021fqr
 2021dxg
 2021dqy
 2021exv
 2021dfk
 2021dce
 2021dbi
 2021epr
 2021hff
 2021dpy
 2021dic
 2021egl
 2021ecn
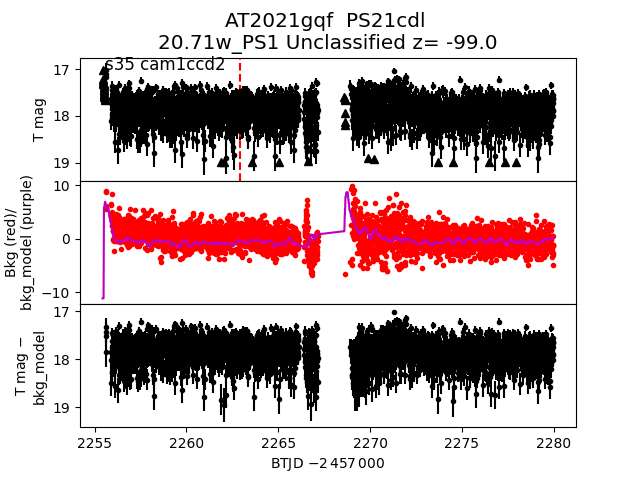
 2021gqf
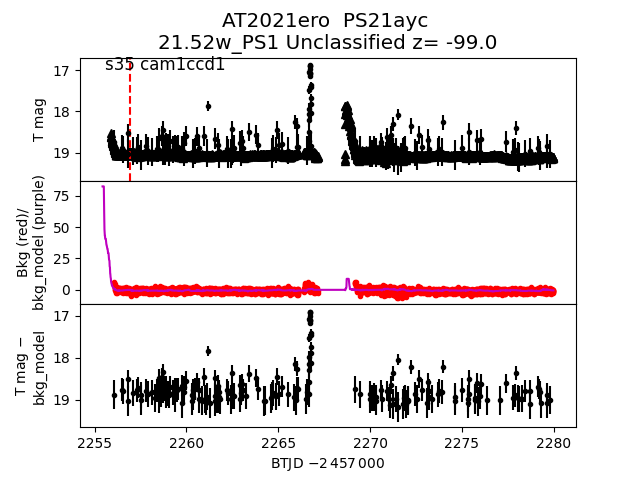
 2021ero
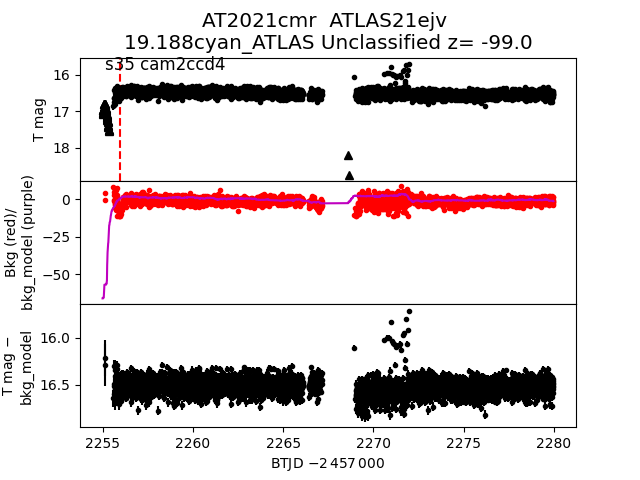
 2021cmr
 2021dcv
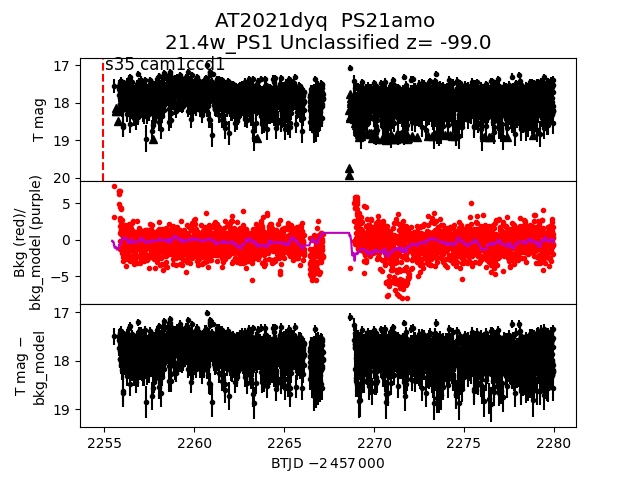
 2021dyq
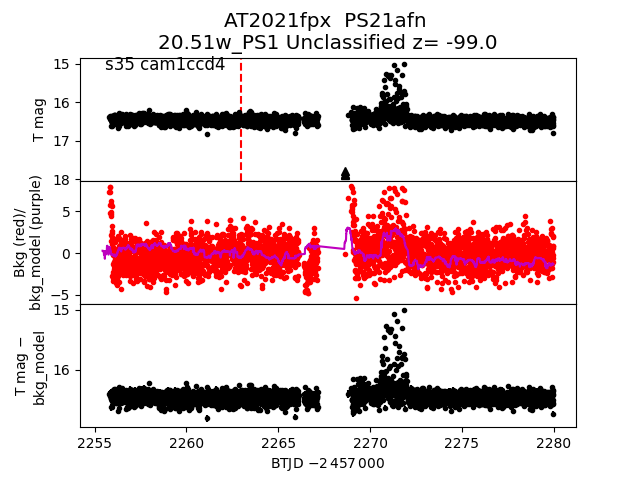
 2021fpx
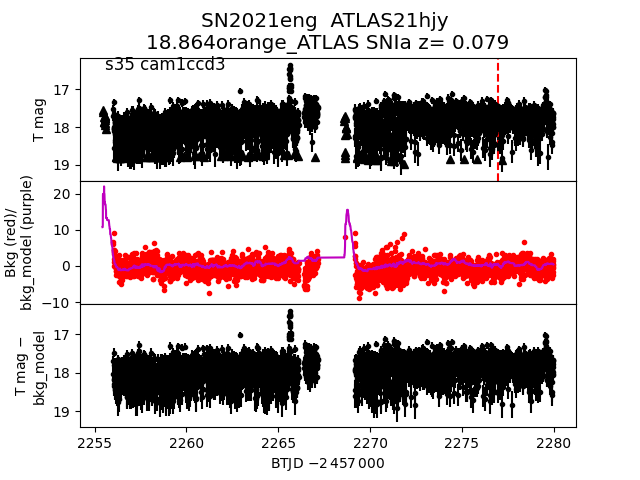
 2021eng
 2021gqe
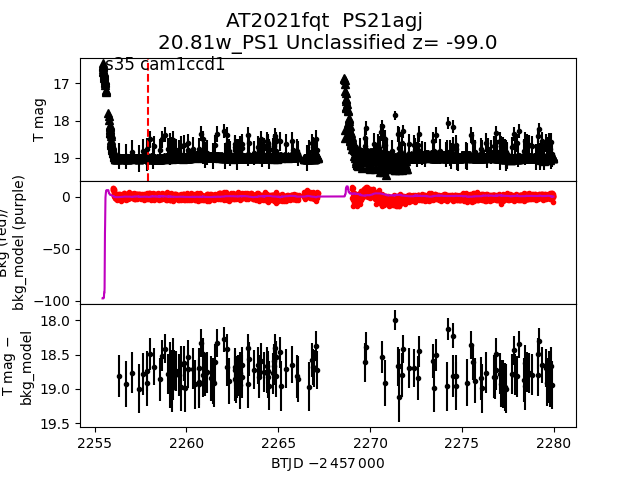
 2021fqt
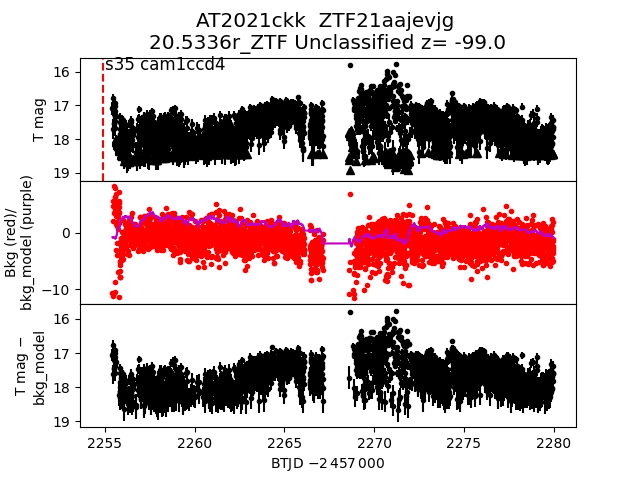
 2021ckk
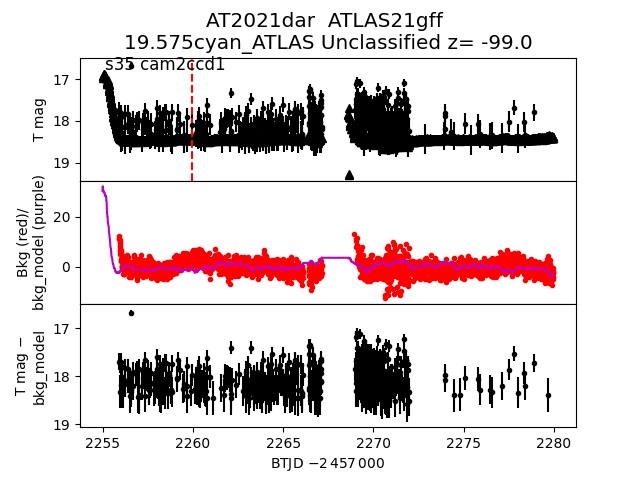
 2021dar
 2021cya
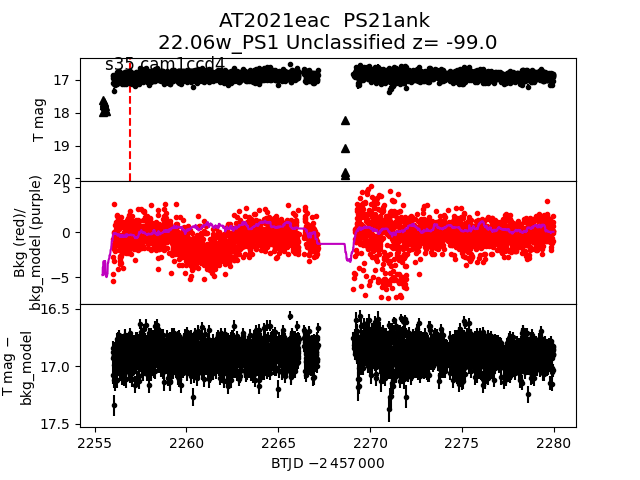
 2021eac
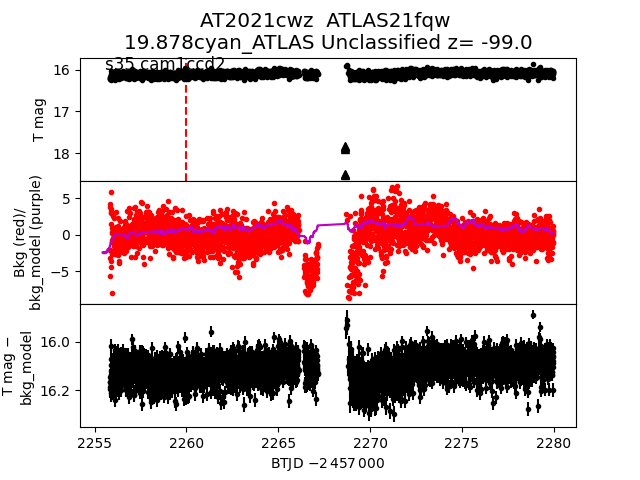
 2021cwz
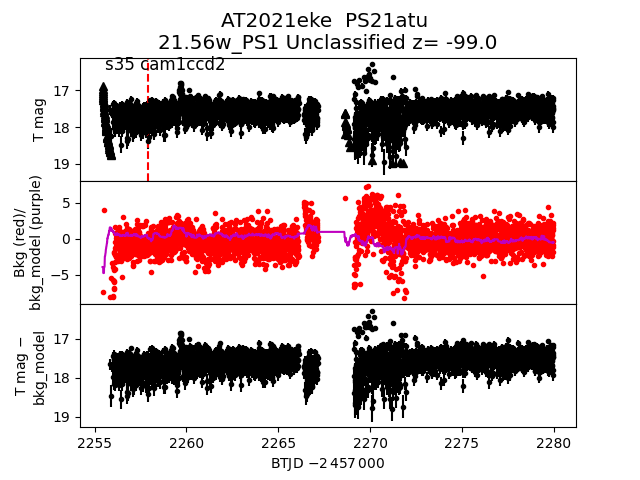
 2021eke
 2021ctx
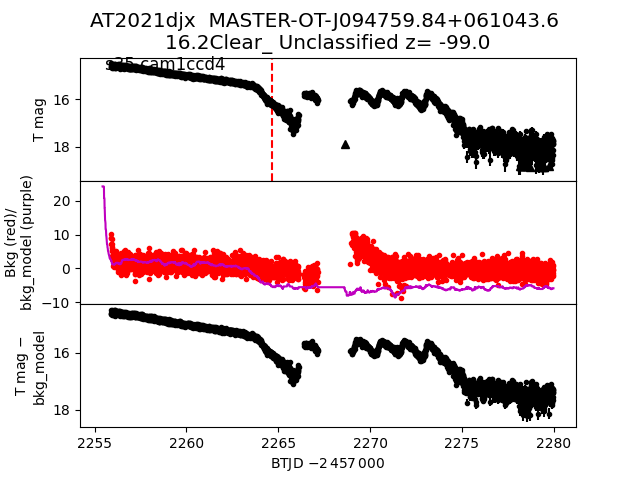
 2021djx
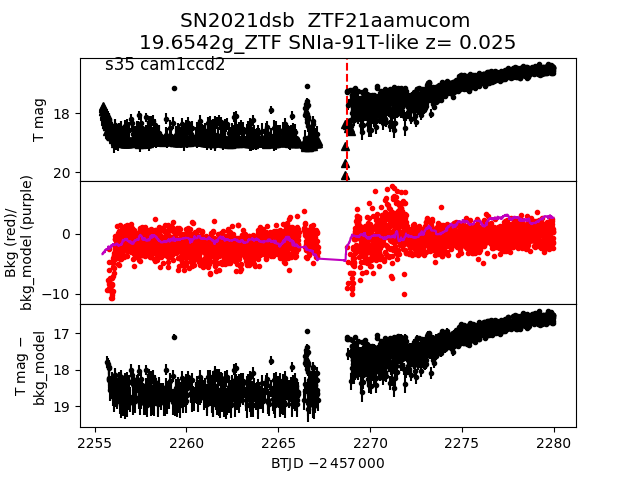
 2021dsb
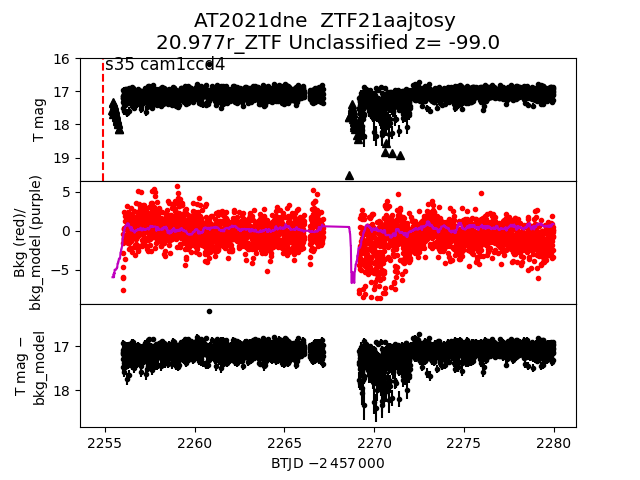
 2021dne
 2021eog
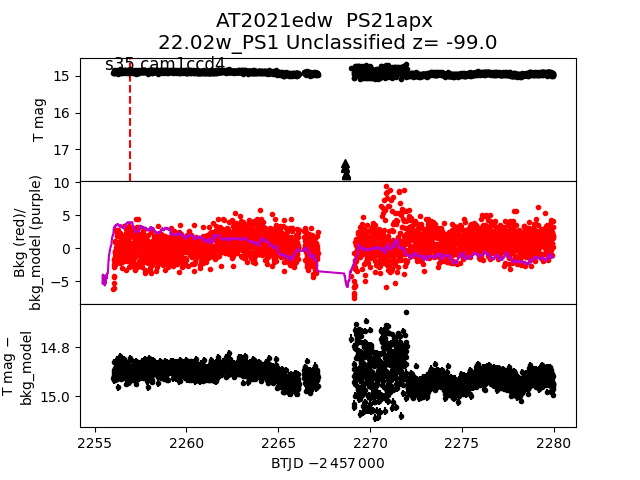
 2021edw
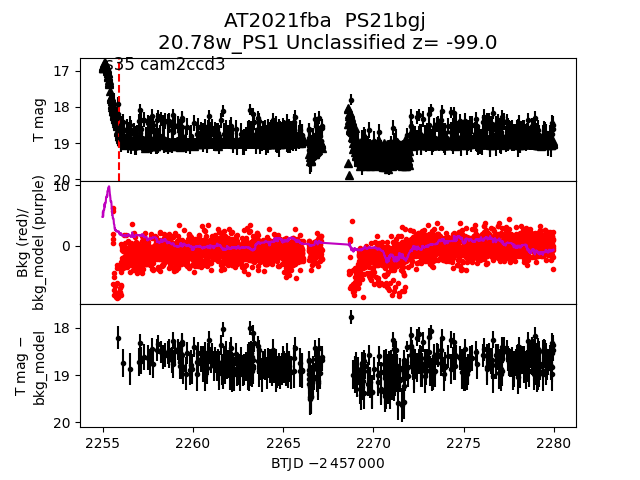
 2021fba
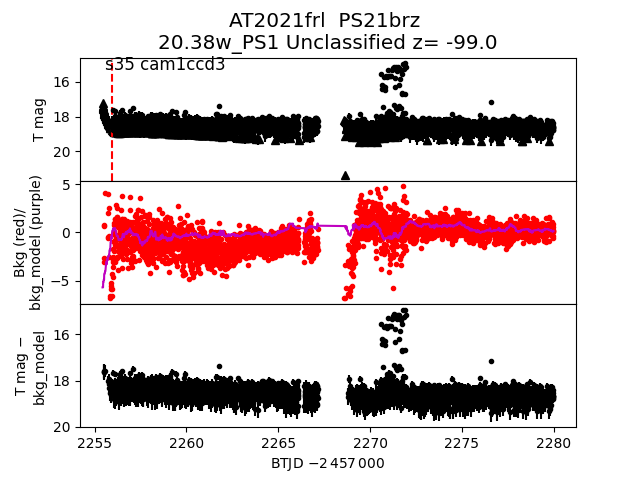
 2021frl
 2021gsn
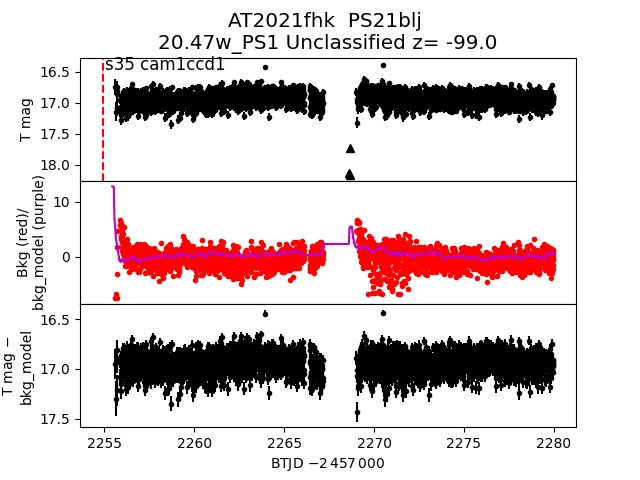
 2021fhk
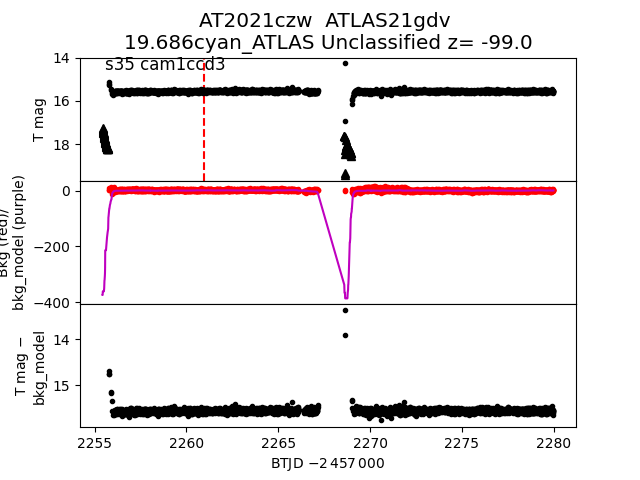
 2021czw
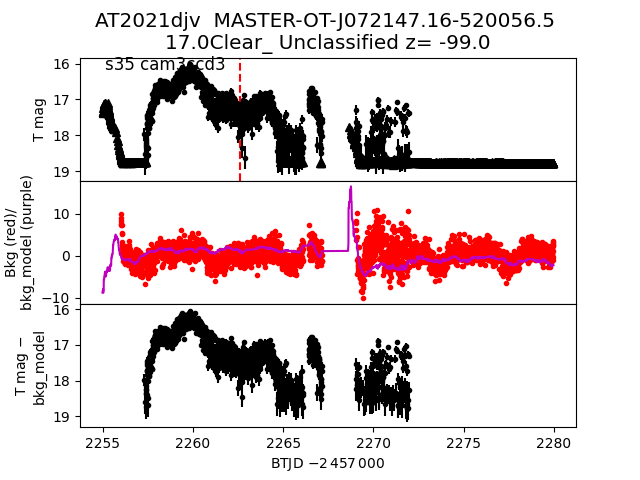
 2021djv
 2021ecy
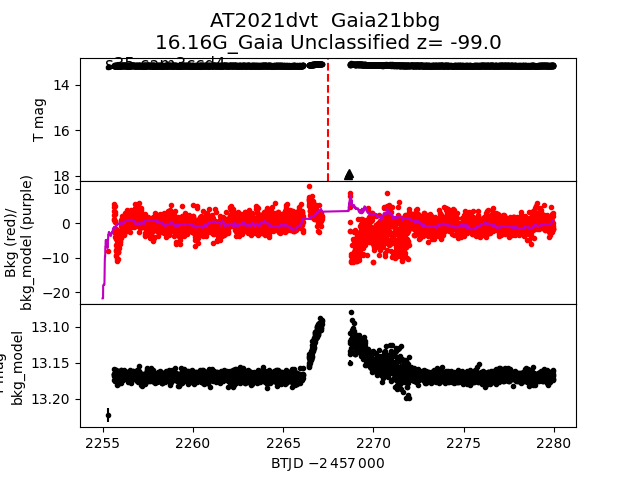
 2021dvt
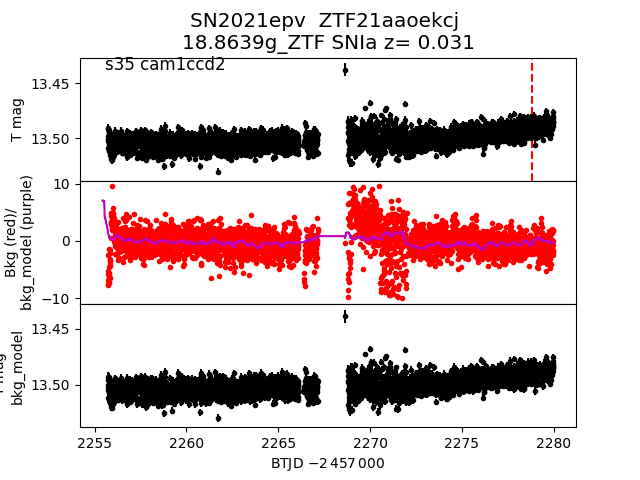
 2021epv
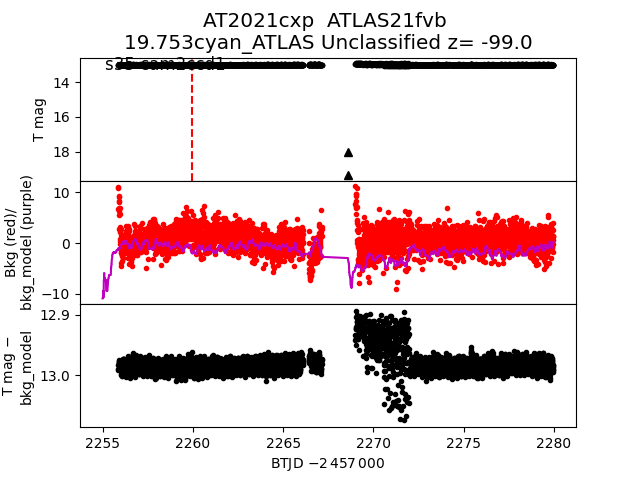
 2021cxp
 2021eyh
 2021dqk
 2021drv
 2021frb
 2021egm
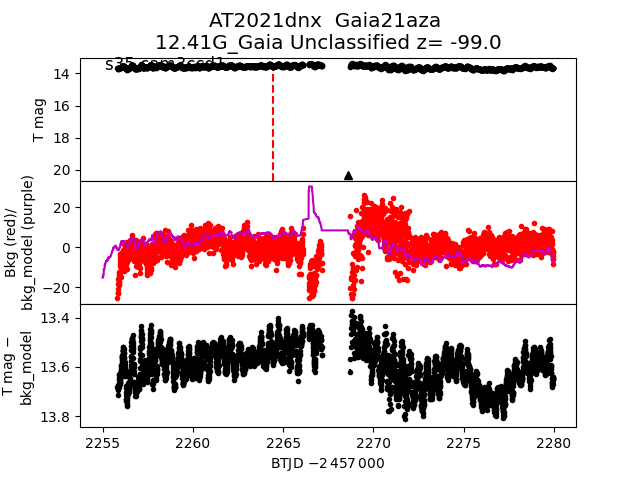
 2021dnx
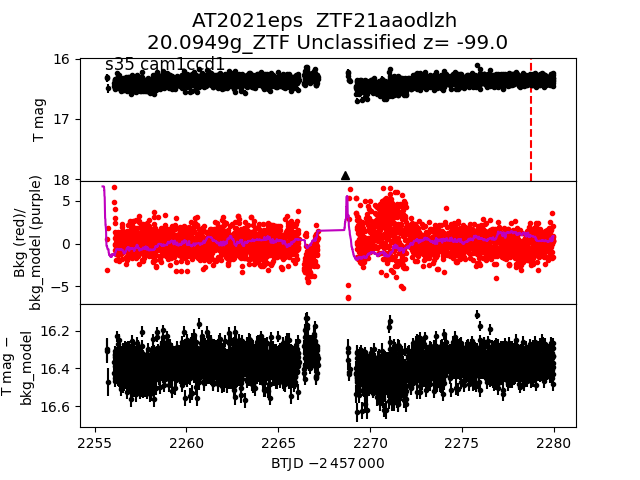
 2021eps
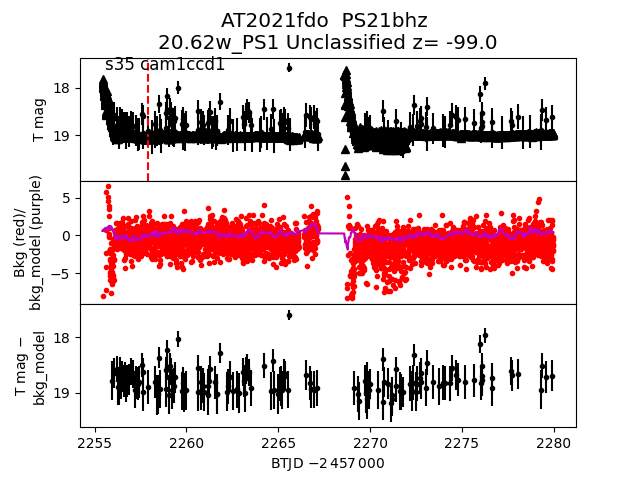
 2021fdo
 2021etn
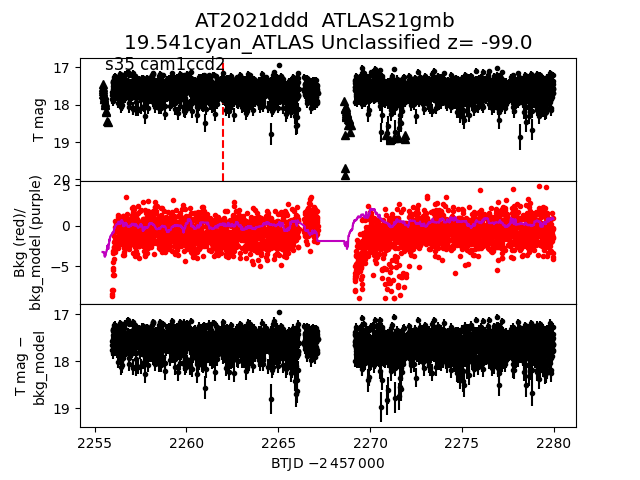
 2021ddd
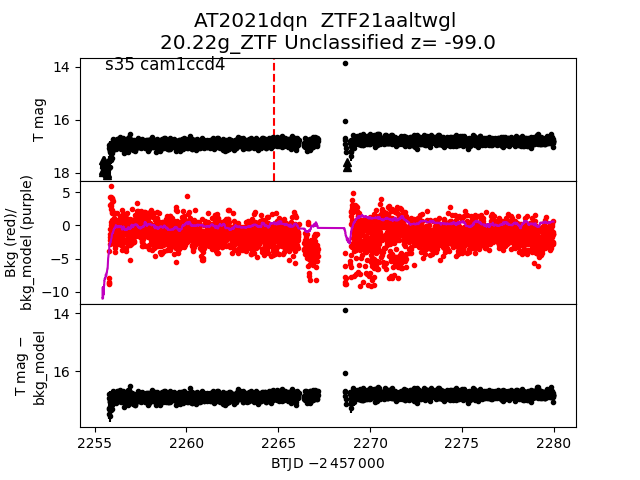
 2021dqn
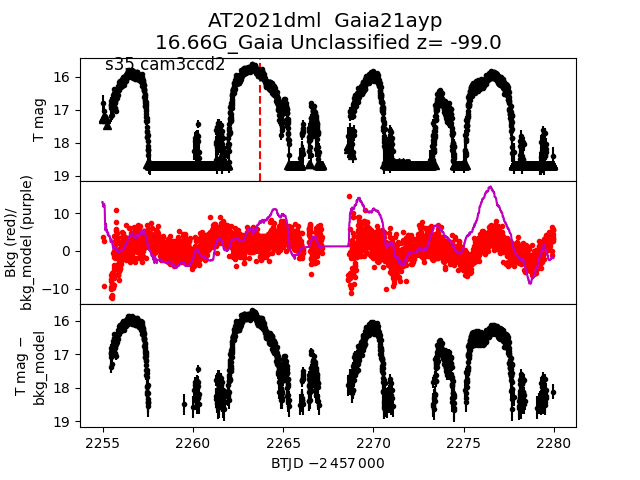
 2021dml
 2021ert
 2021gfy
 2021ebp
 2021dwt
 2021dac
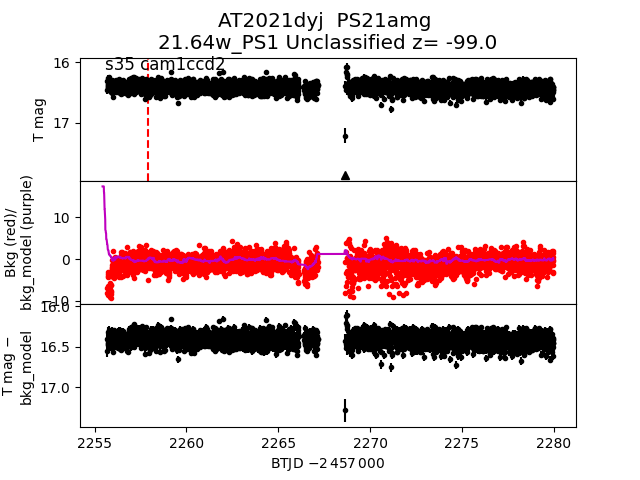
 2021dyj
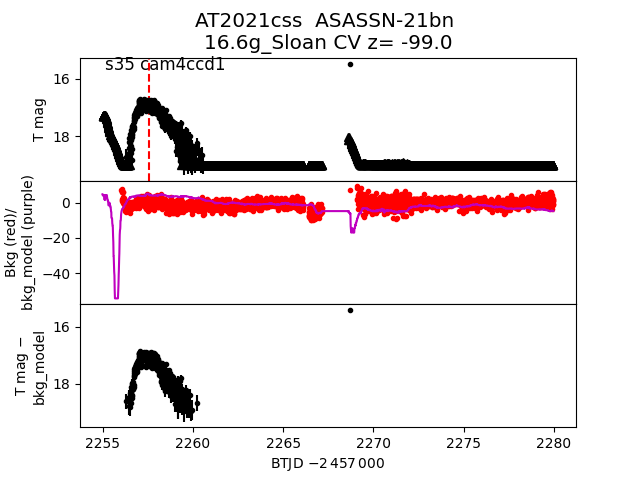
 2021css
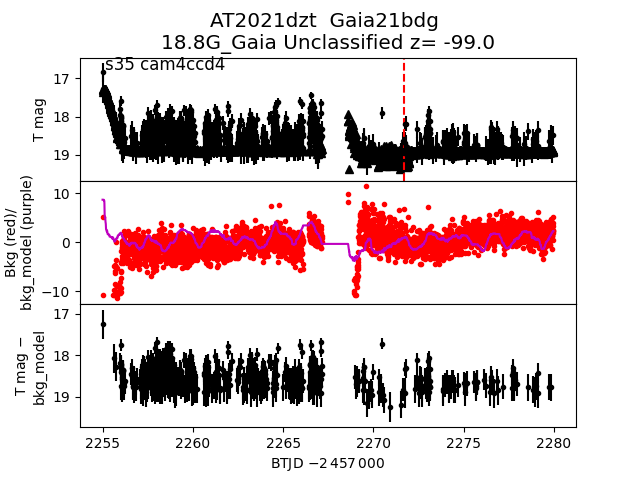
 2021dzt
 2021dyi
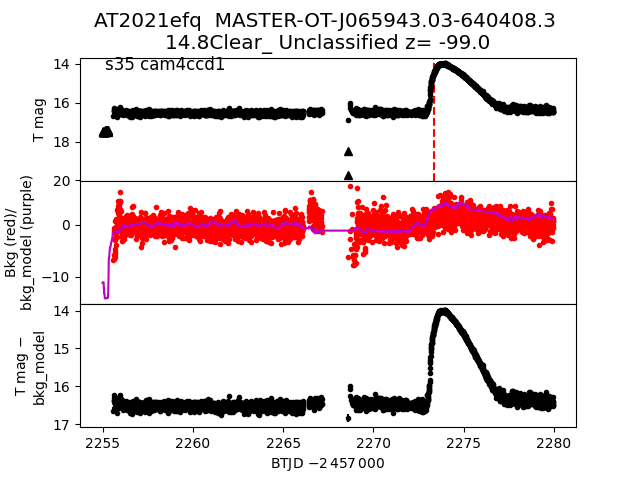
 2021efq
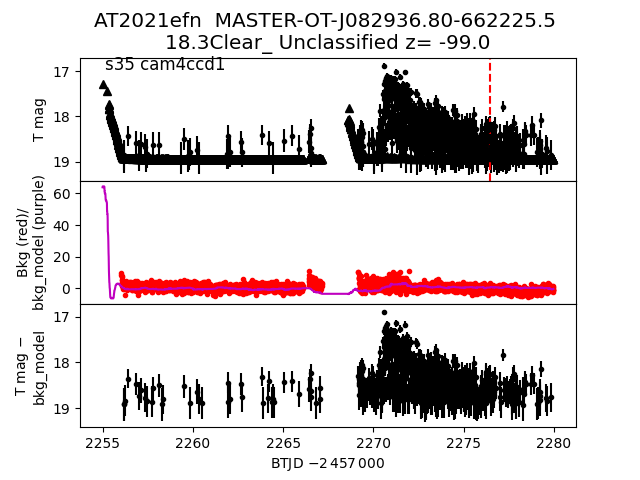
 2021efn
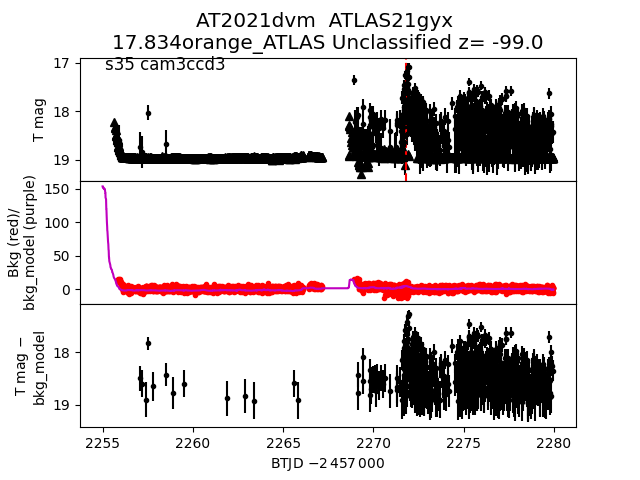
 2021dvm
 2021eee
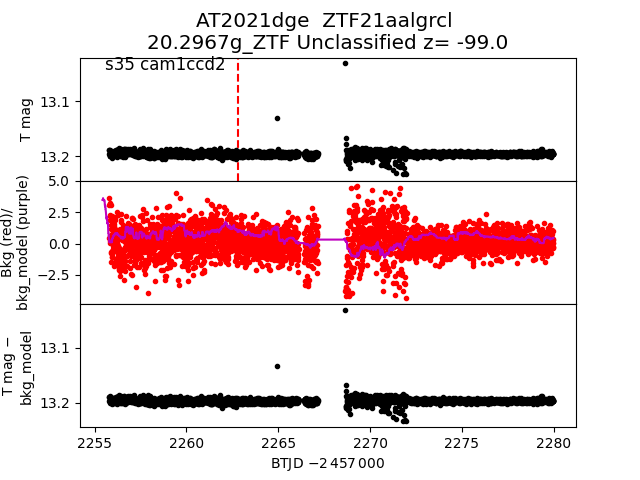
 2021dge
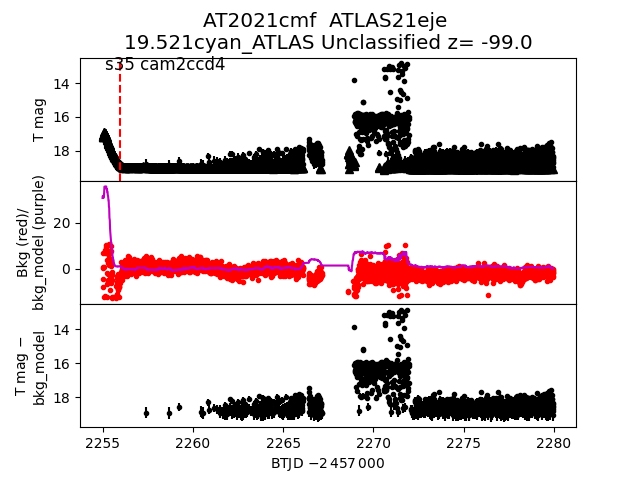
 2021cmf
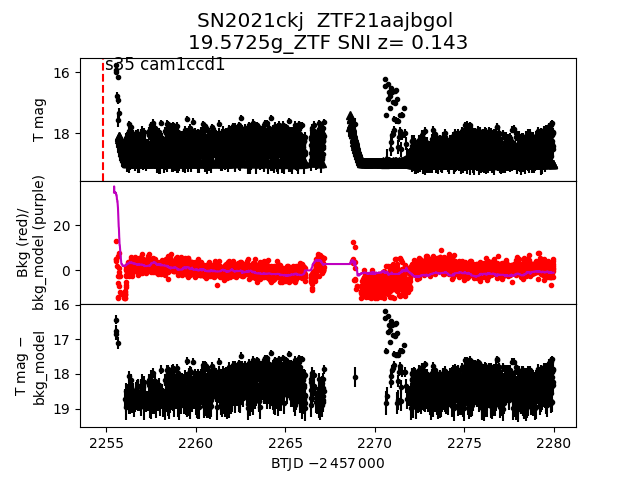
 2021ckj
 2021epu
 2021egg
 2021dju
 2021eei
 2021dqa
 2021dbg
 2021hbo
 2021dys