all transients in sector34 (75 total)
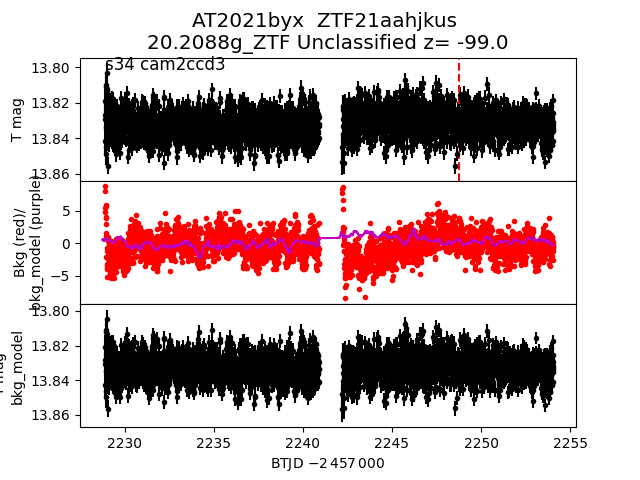
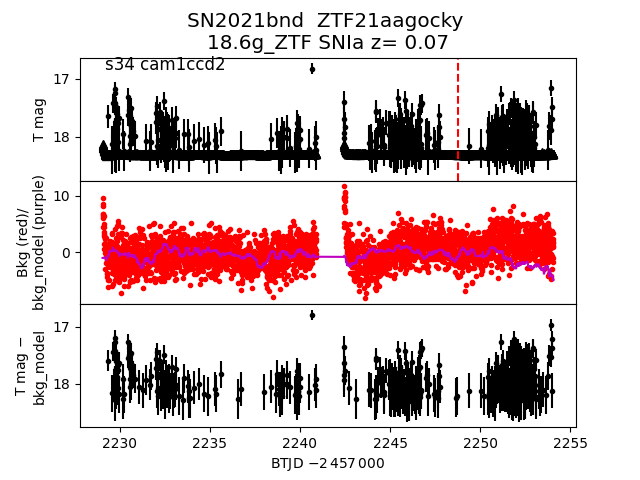
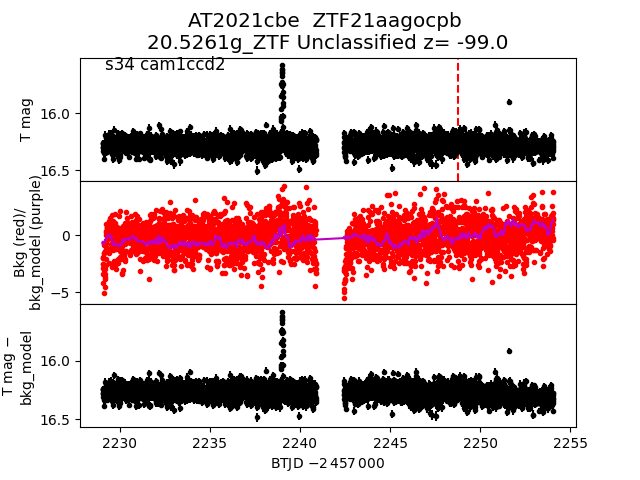
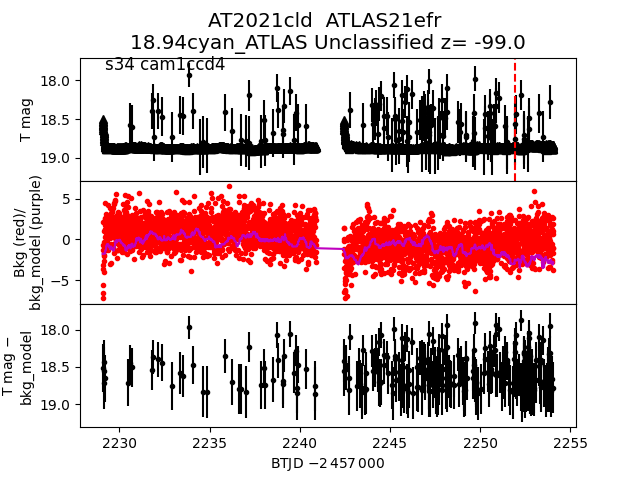
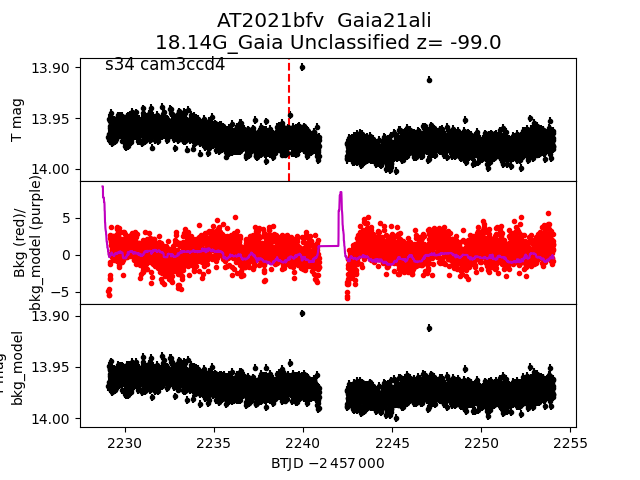
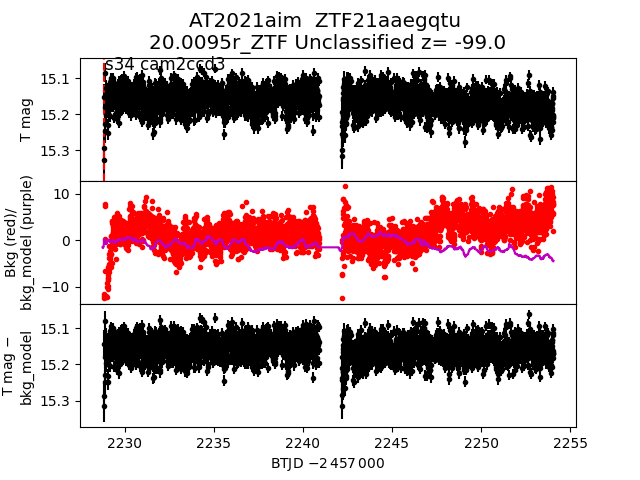
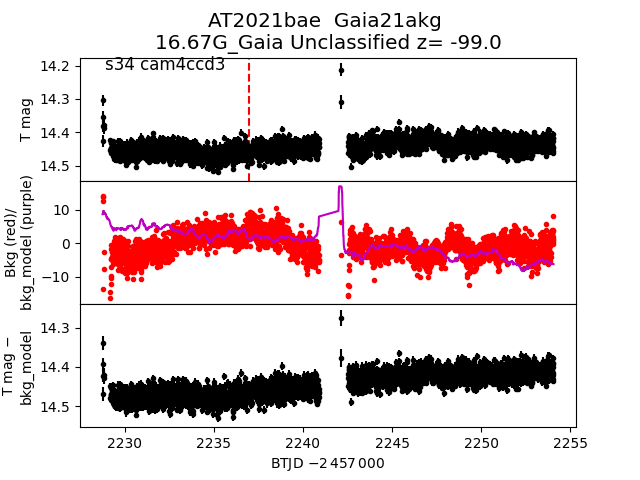
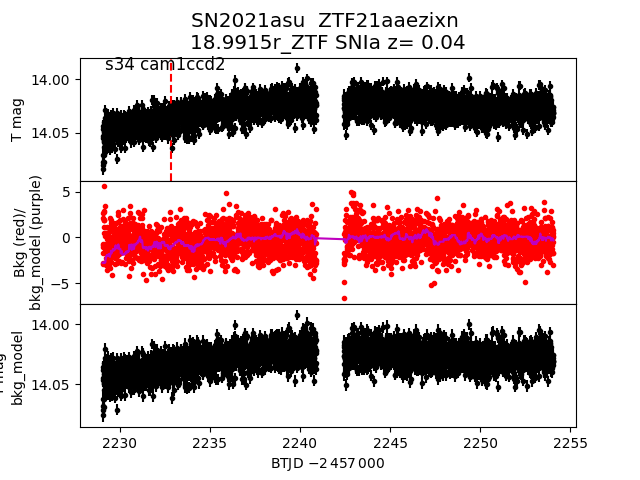
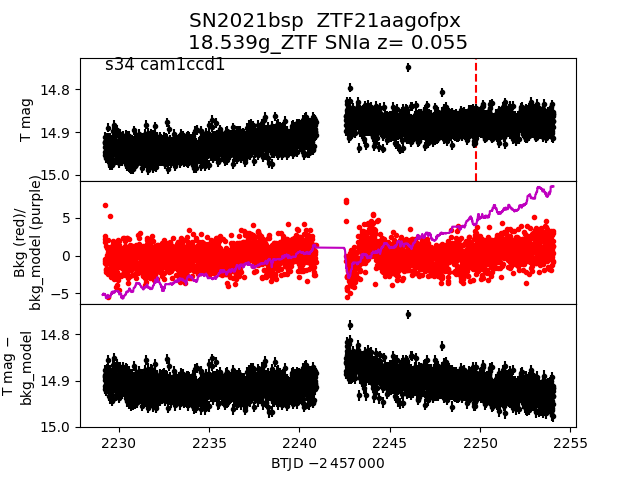
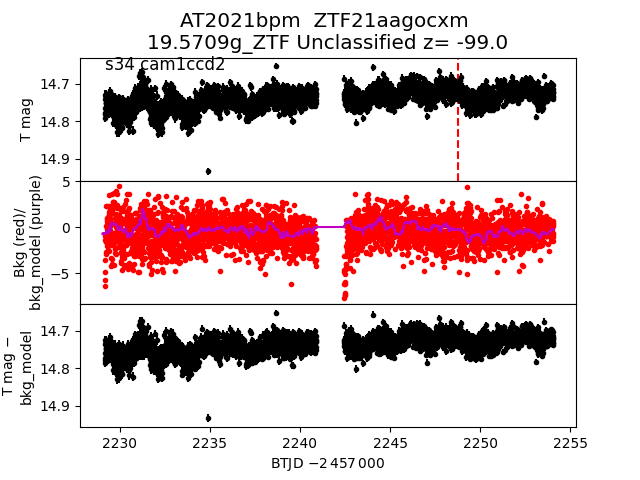
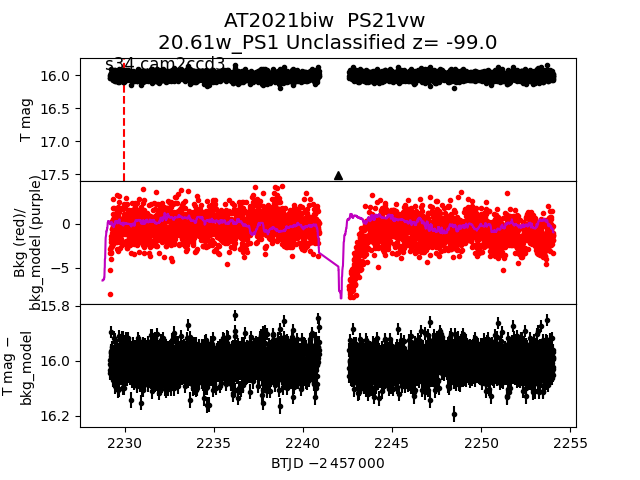
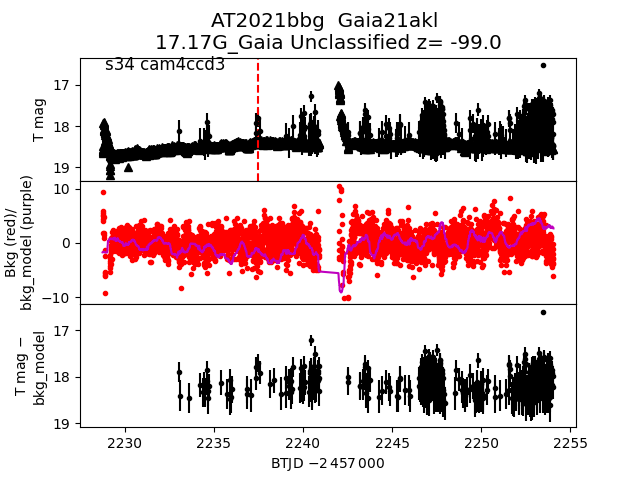
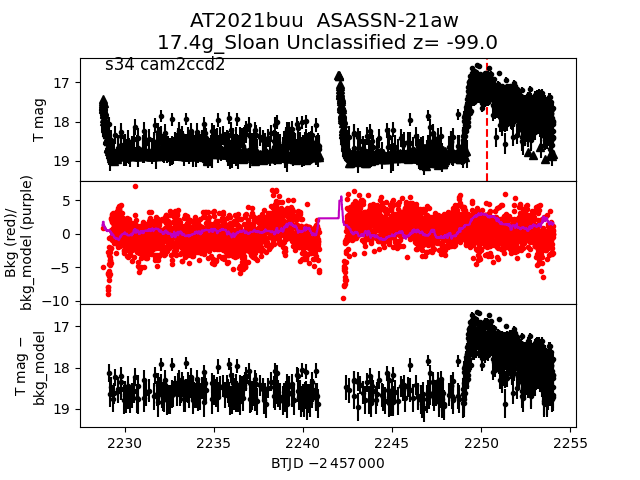
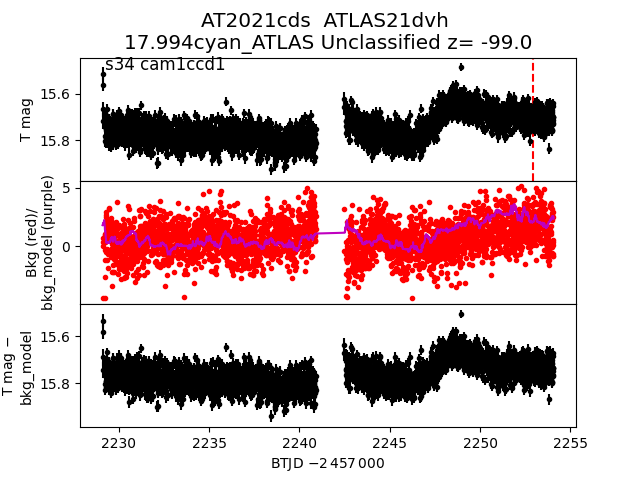
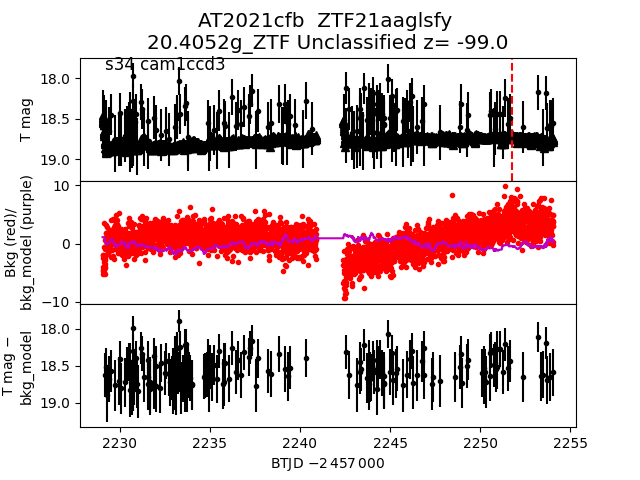
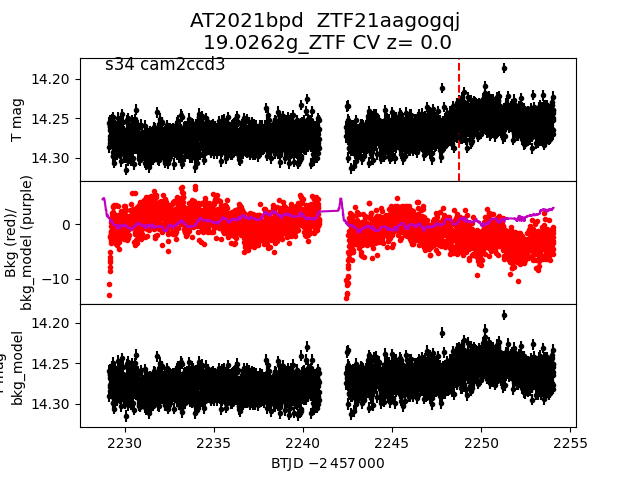
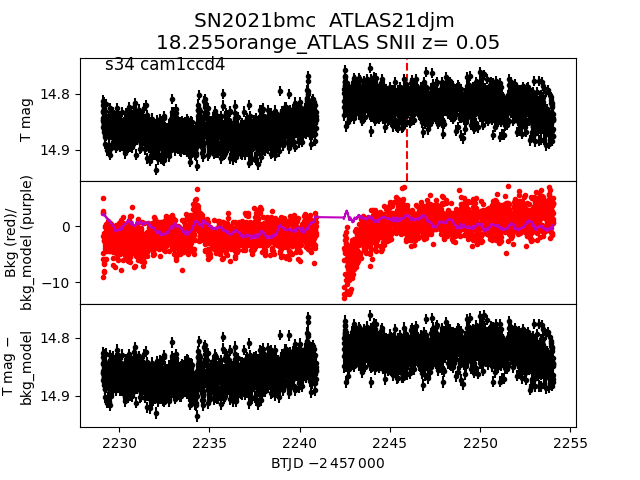
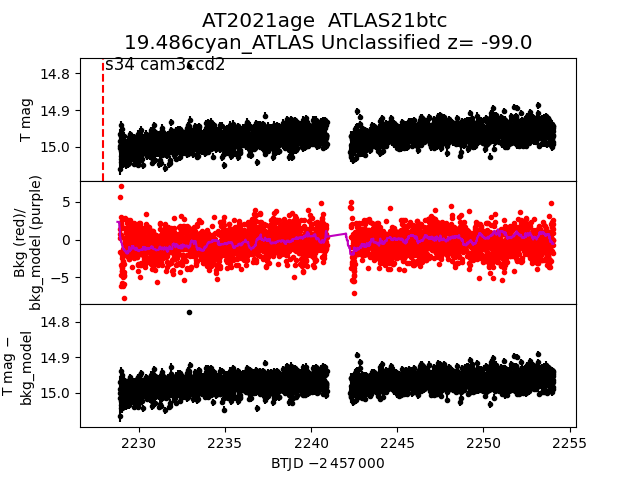
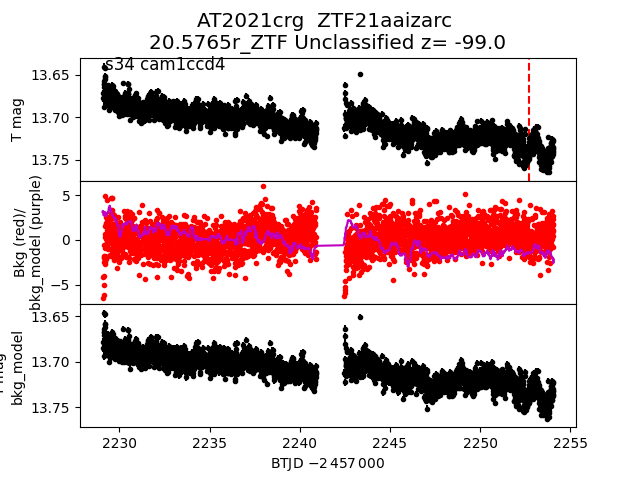
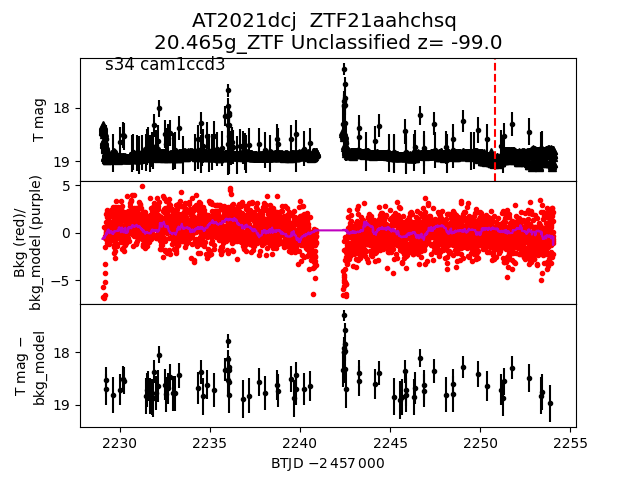
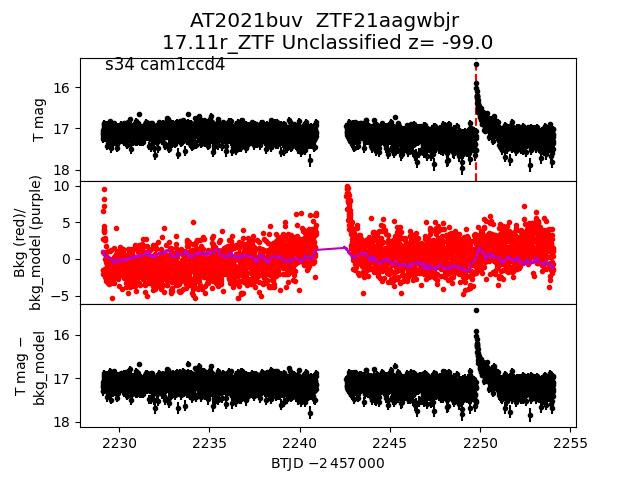
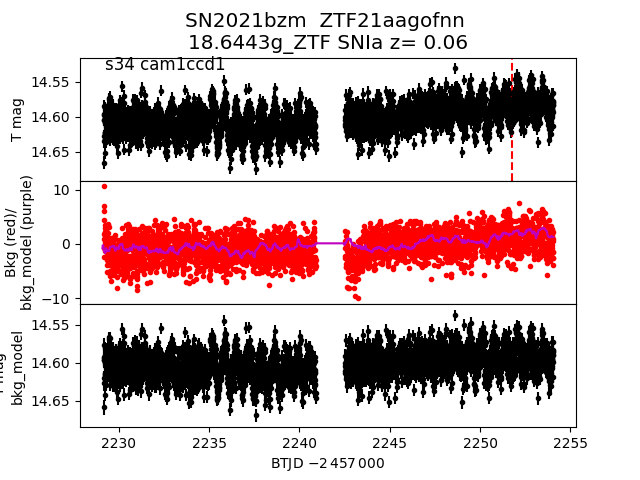
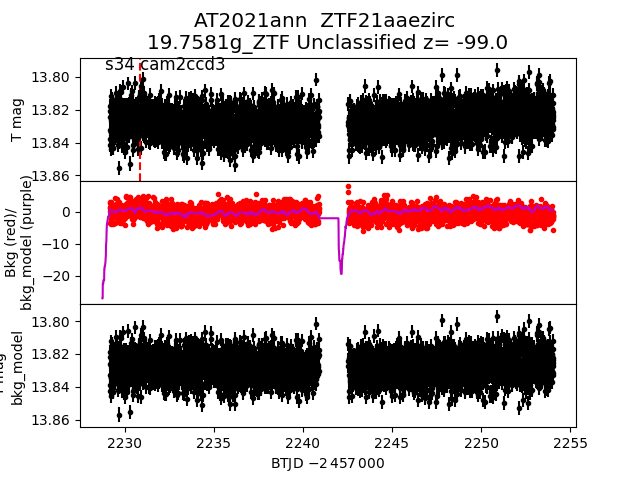
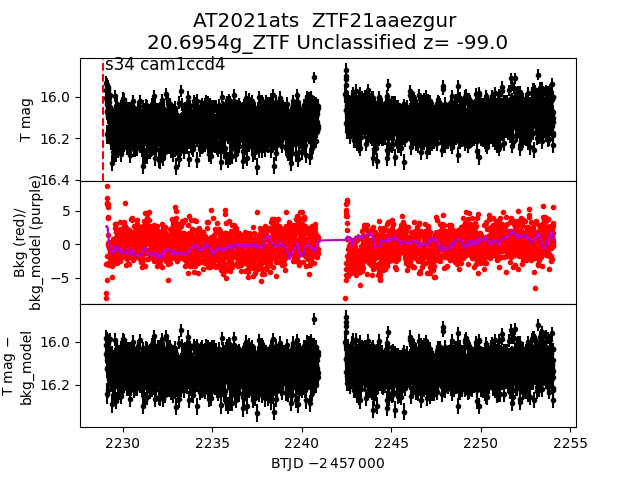
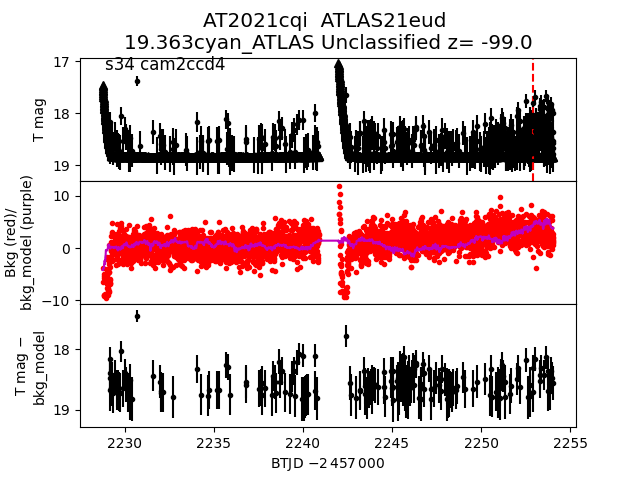
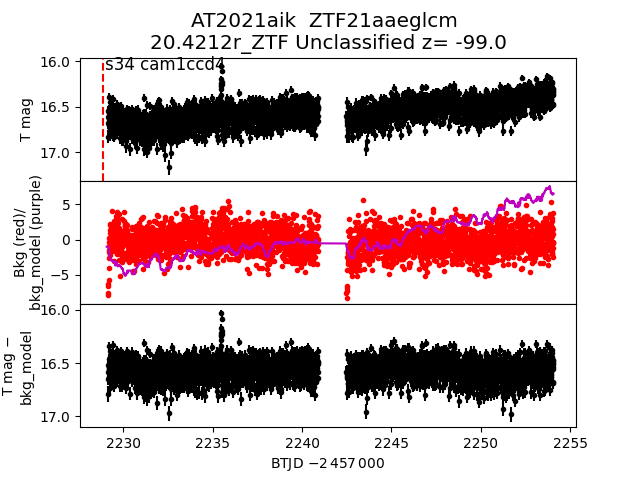
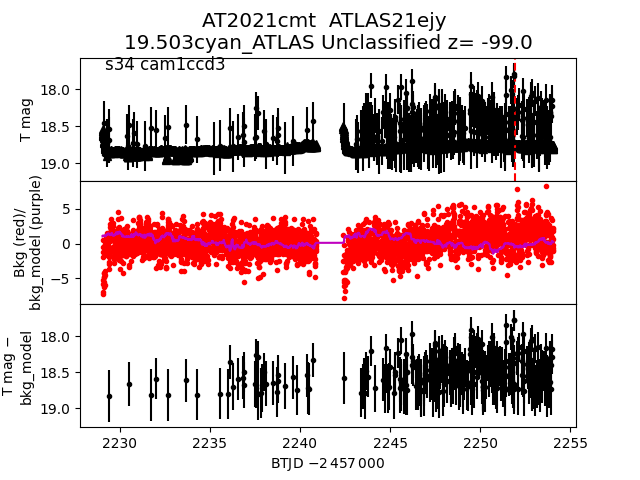
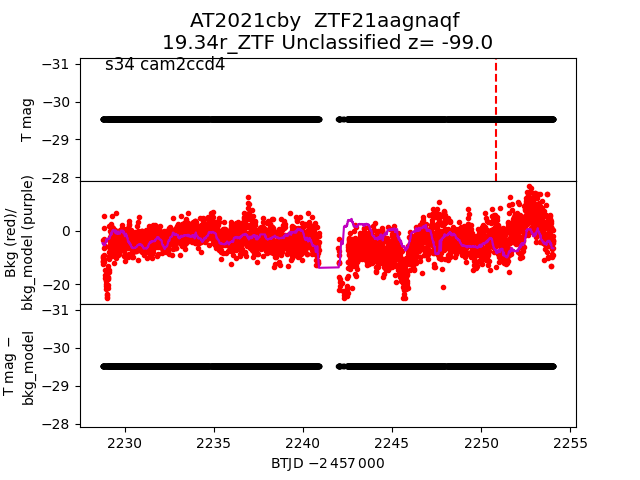
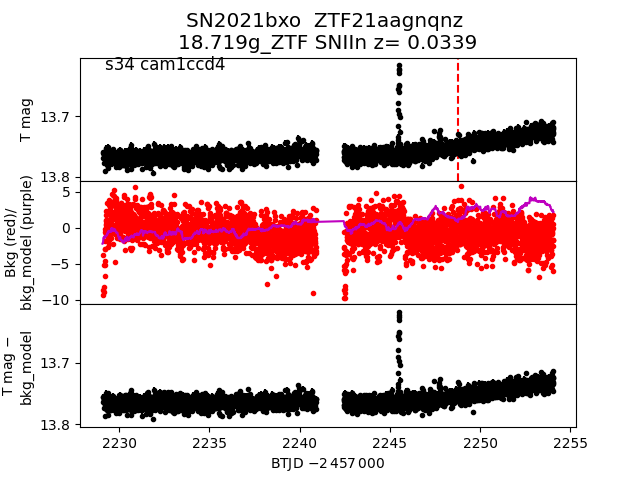
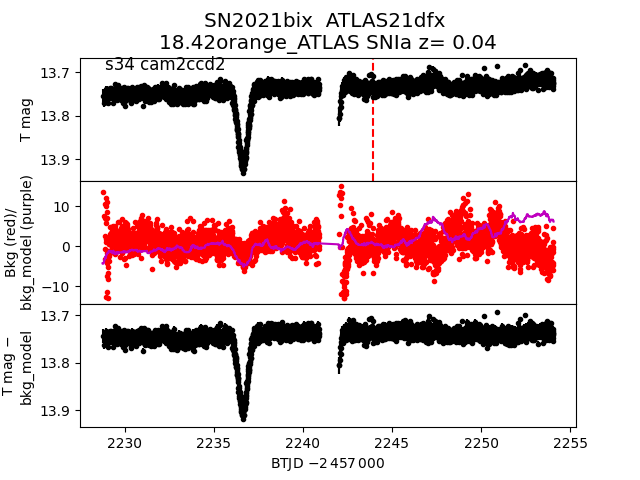
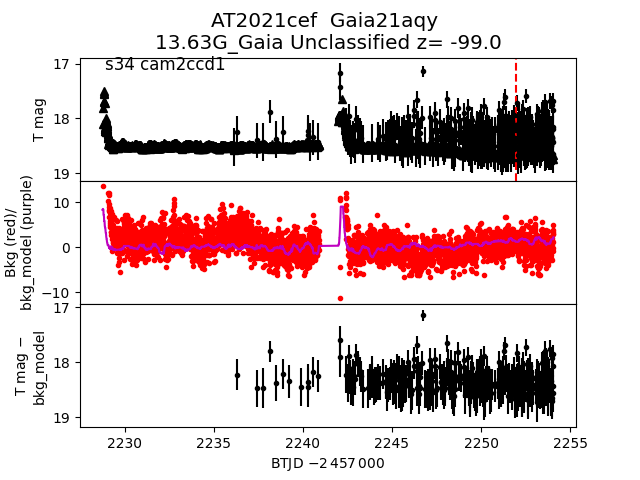
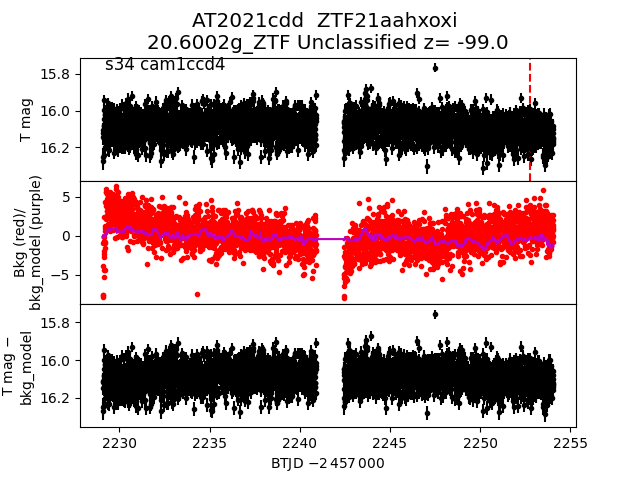
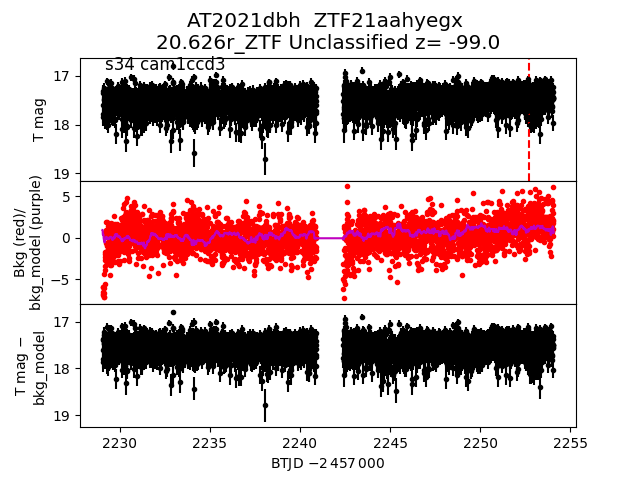
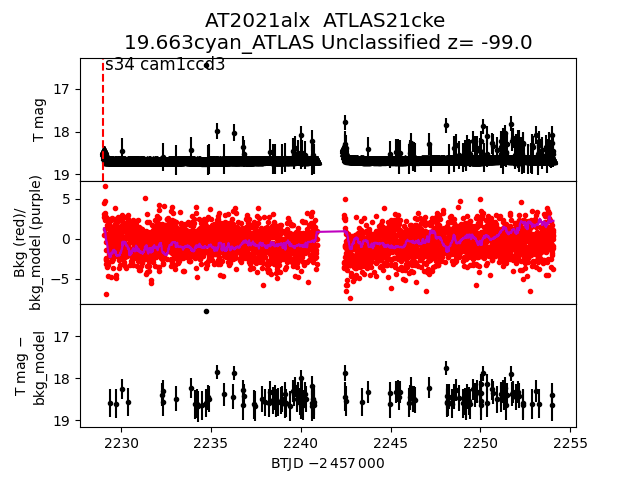
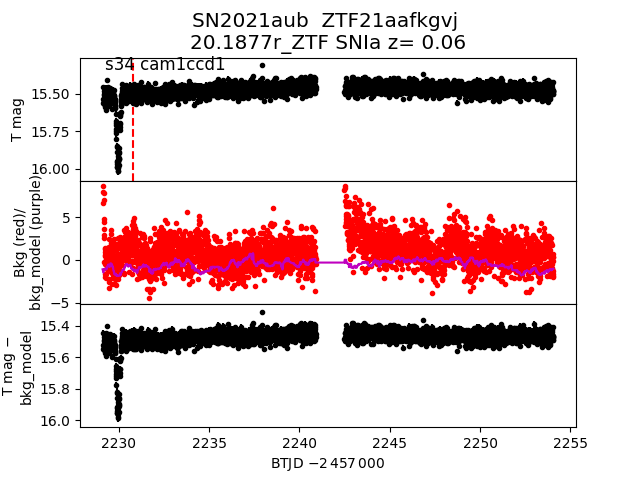
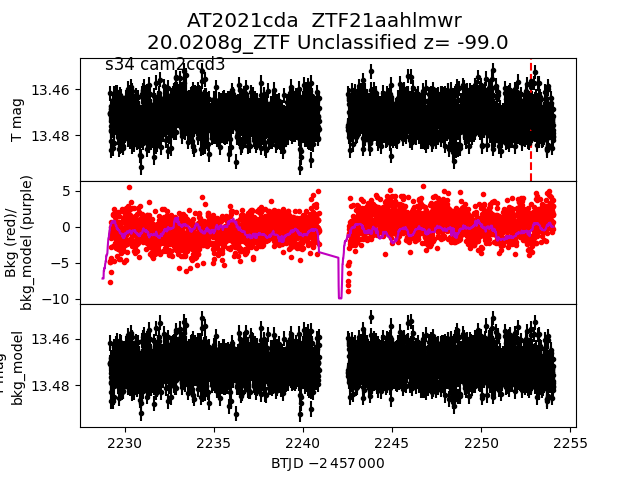
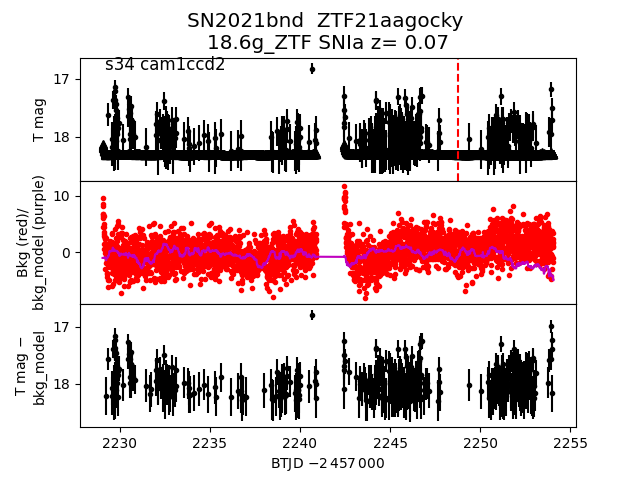
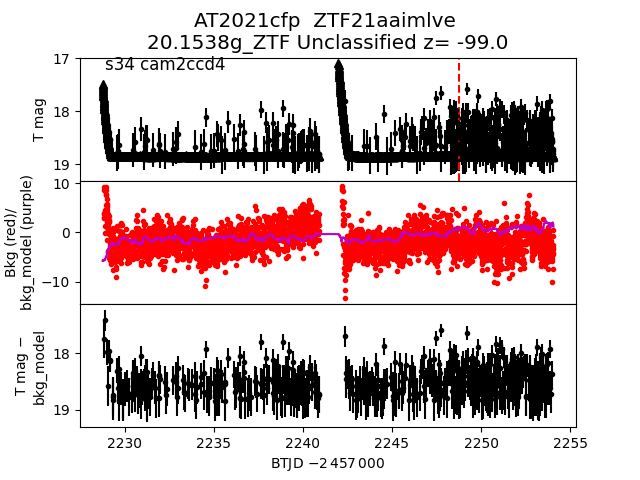
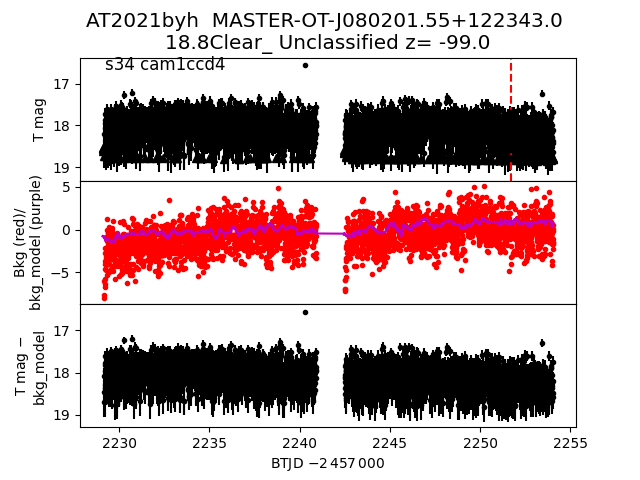
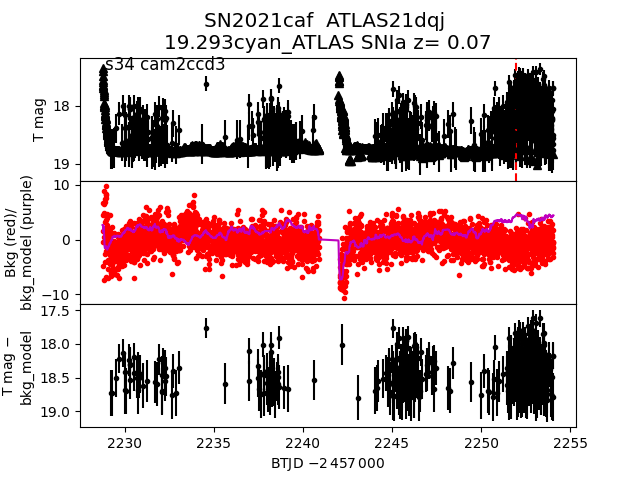
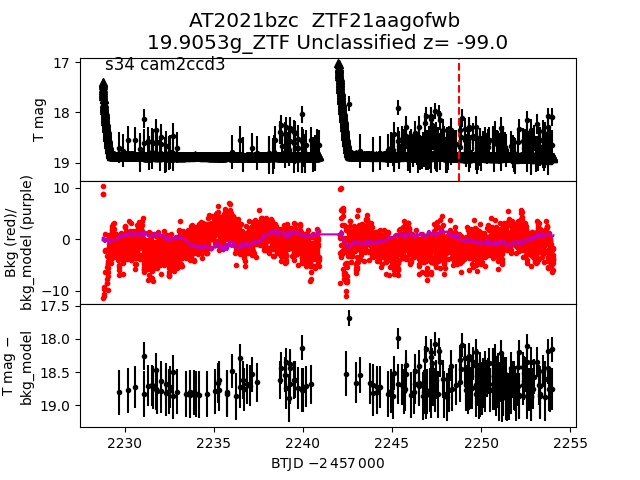
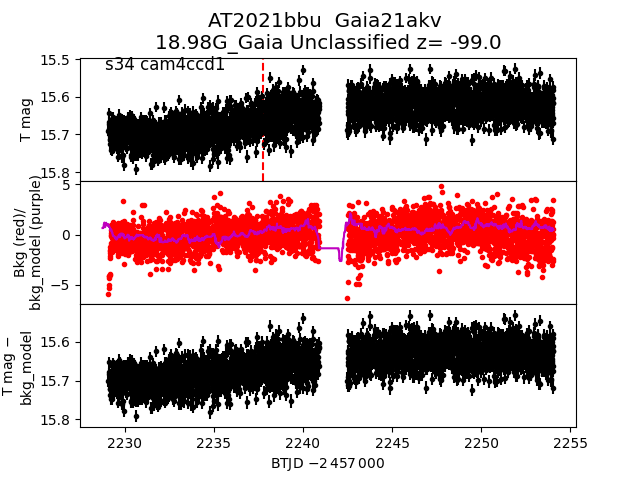
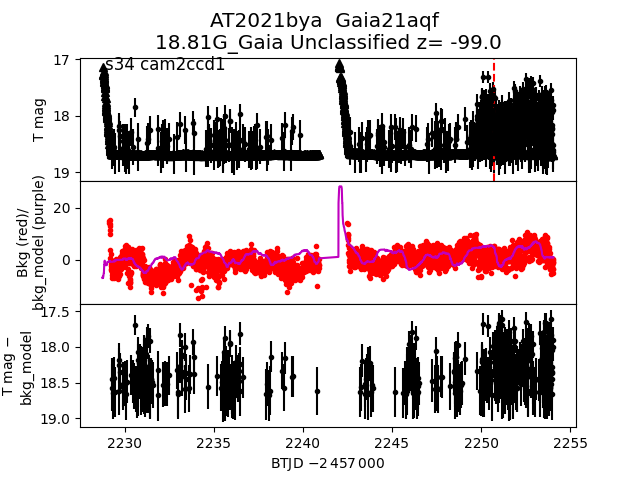
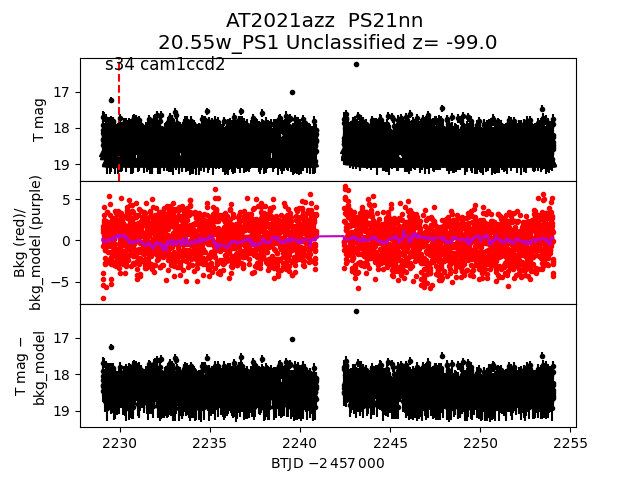
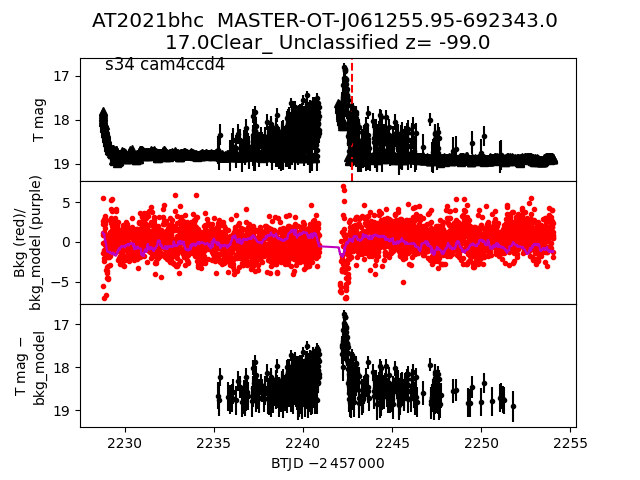
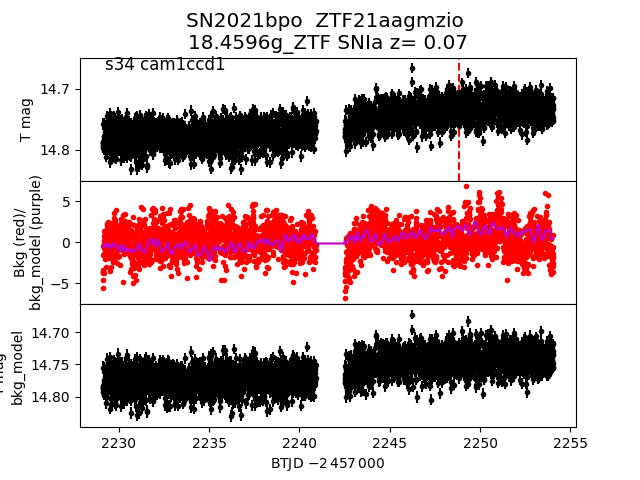
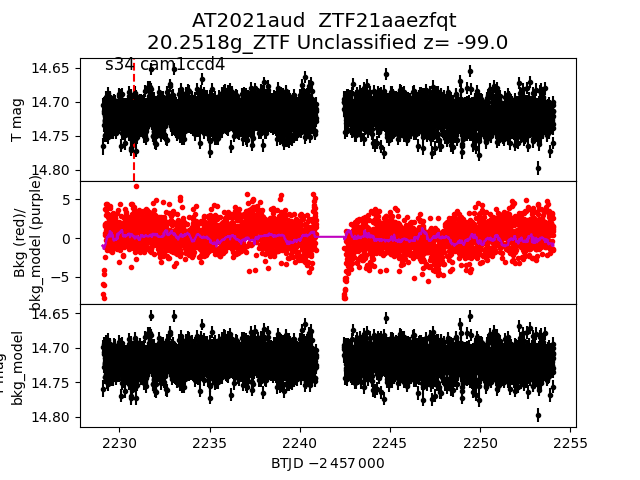
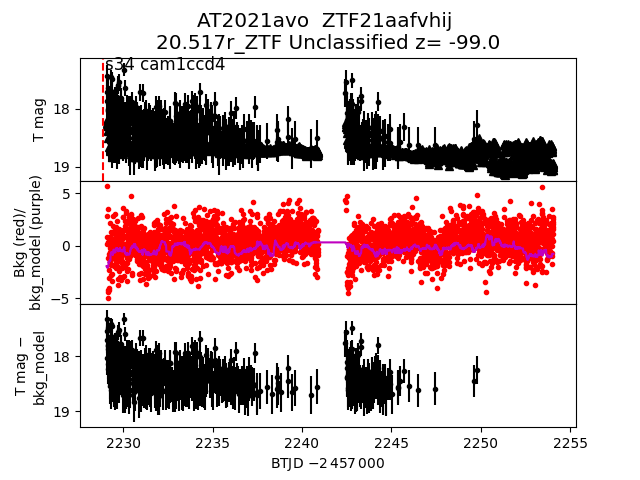
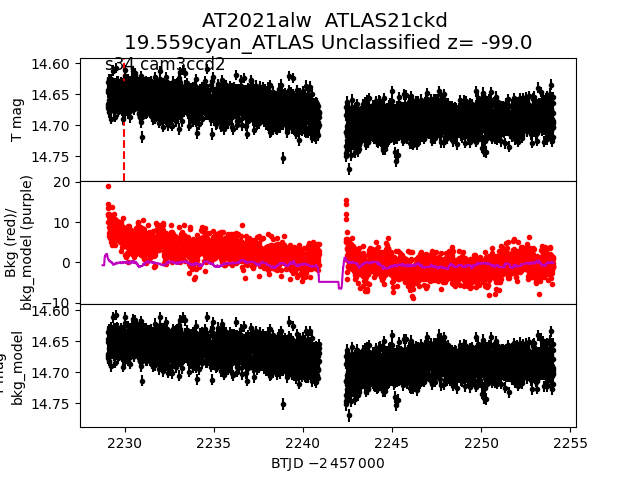
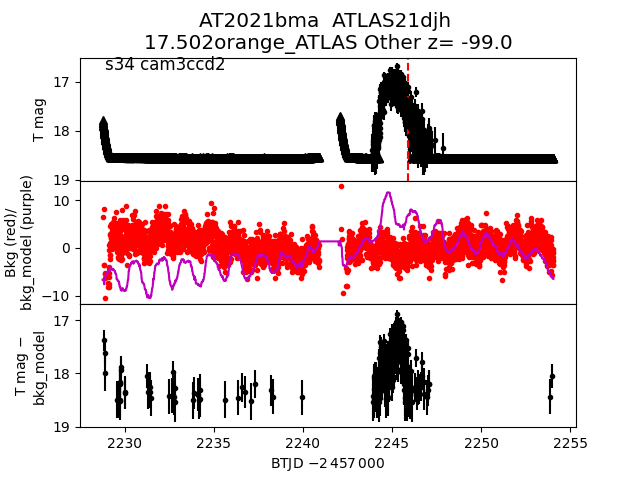
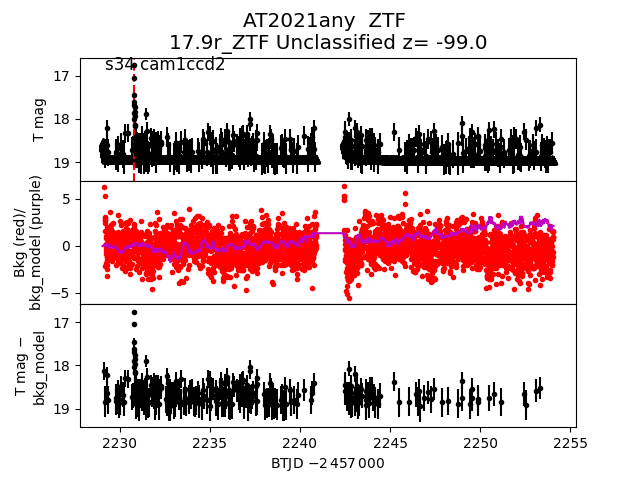
Each figure has three panels. The top panel shows the transient light curve, the middle panel shows the local background (estimated in an annulus), and the bottom panel shows a "background-model corrected" light curve. Details about the background model are in the README.
The vertical red line marks the time of discovery reported to TNS. Other useful metadata from TNS is in the figure title.
Note that the top and bottom panel are in magnitudes, while the middle panel is in differential flux units. The magnitudes are calibrated to the flux in the reference image used for image subtraction. Thus, flux from the host galaxy is included in these magnitudes.
3-sigma upper limits are plotted as triangles with no errorbars. A typical limiting magnitude is 19.6 in 30 minutes or 18.4 in 200 seconds (for low backgrounds).
The links allow you to download the light curve data as a text file.
More details in the README.
2021bnd
 2021cbe
 2021cld
 2021bfv
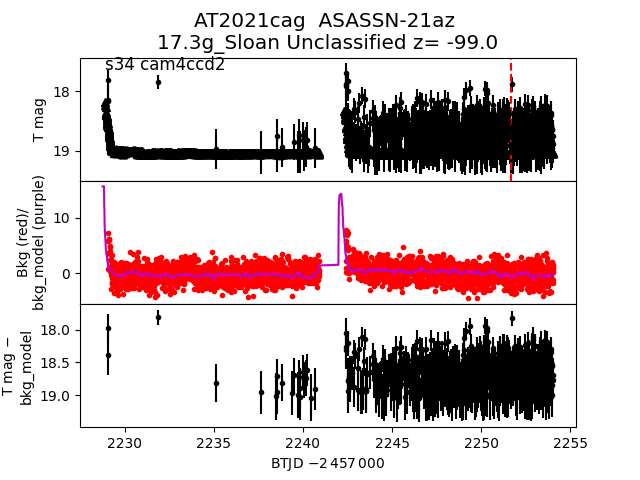
 2021cag
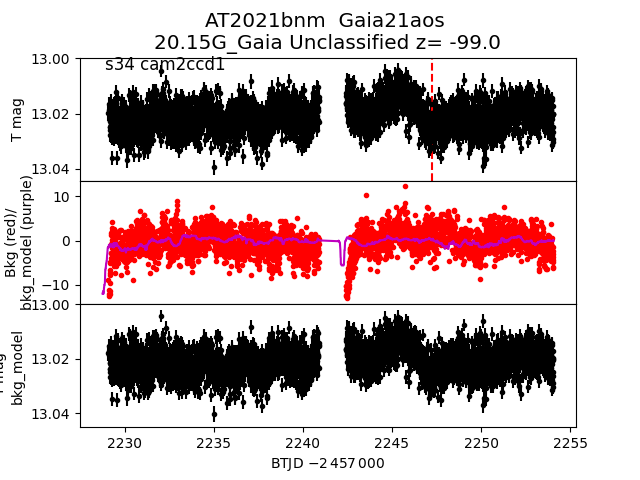
 2021bnm
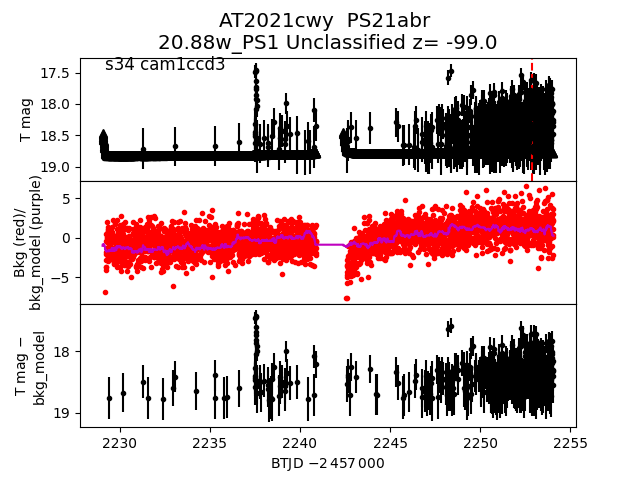
 2021cwy
 2021aim
 2021bae
 2021asu
 2021bsp
 2021bpm
 2021biw
 2021bbg
 2021buu
 2021cds
 2021cfb
 2021bpd
 2021bmc
 2021age
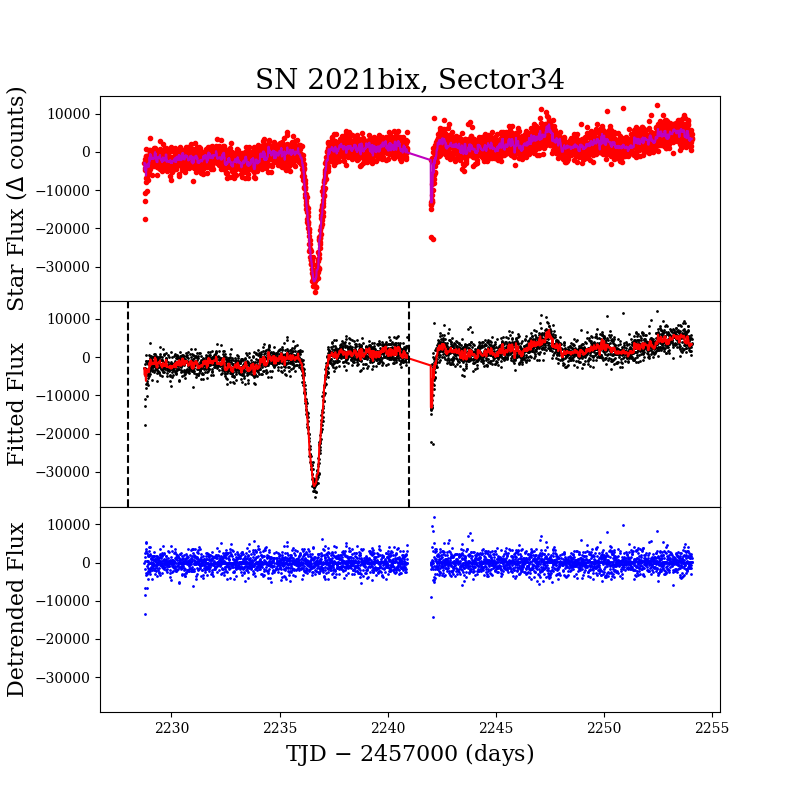
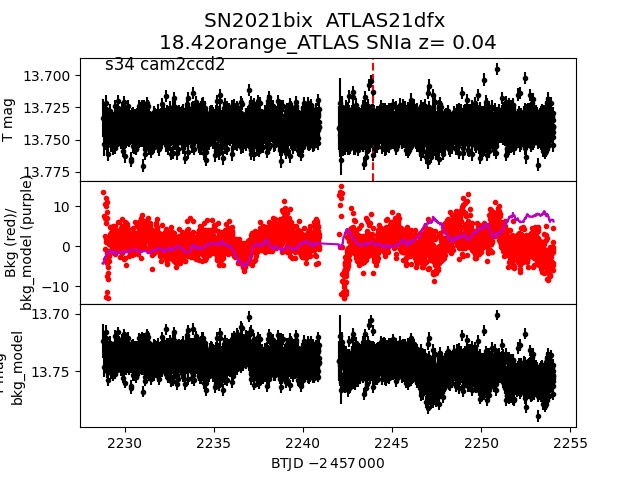
 2021bix
 2021crg
 2021dcj
 2021buv
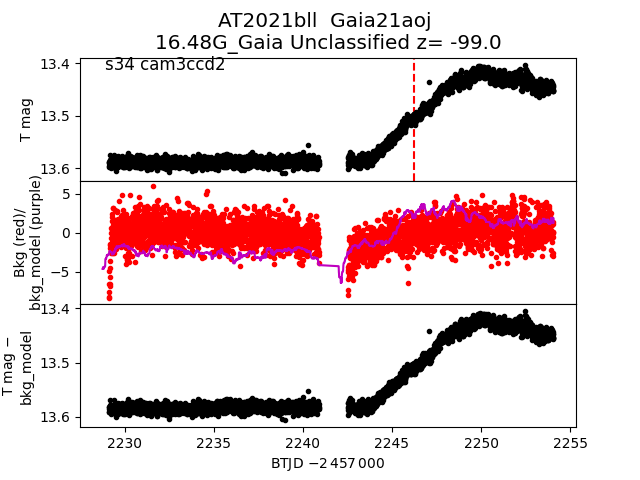
 2021bll
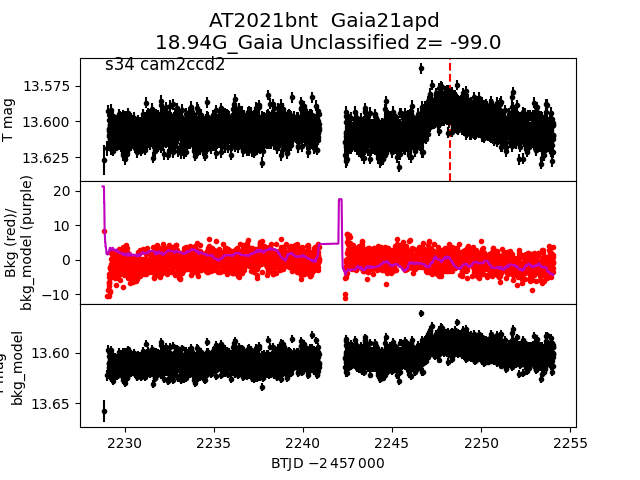
 2021bnt
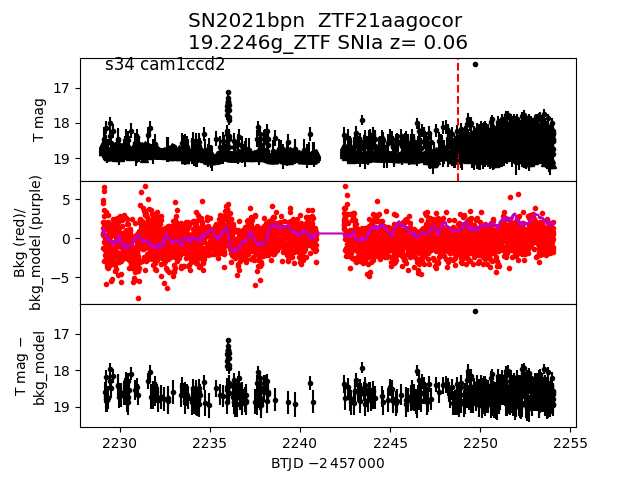
 2021bpn
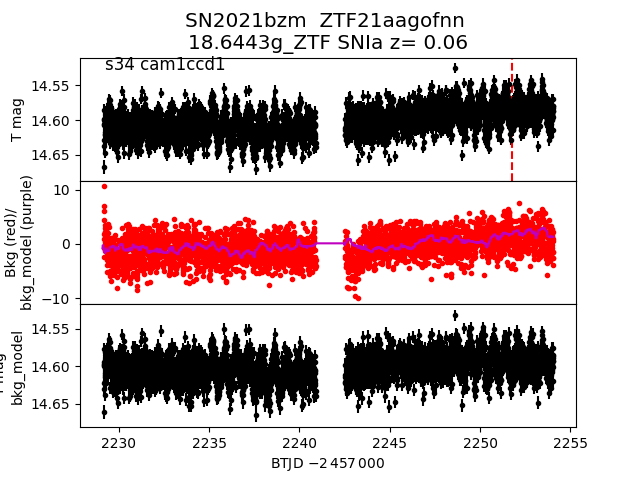
 2021bzm
 2021ann
 2021ats
 2021cqi
 2021aik
 2021bix_detrended
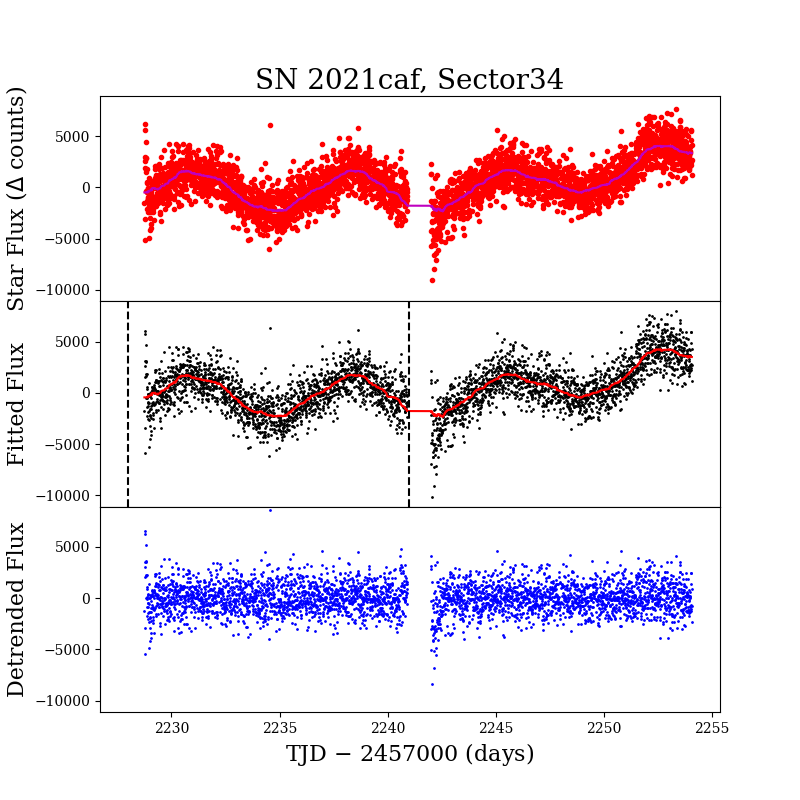
 2021caf_detrended
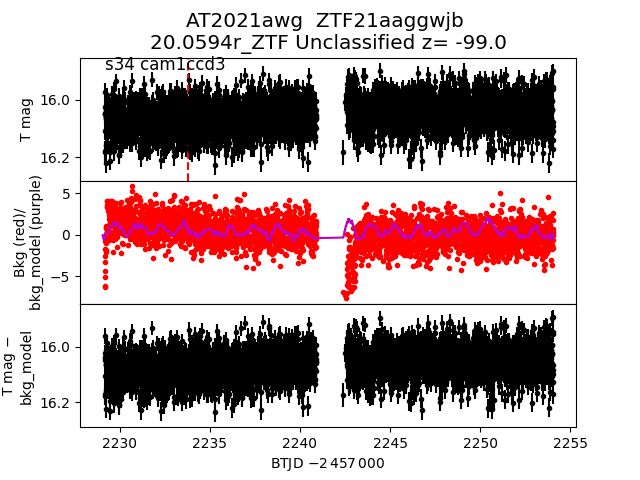
 2021awg
 2021cmt
 2021cby
 2021bxo
 2021bix
 2021cef
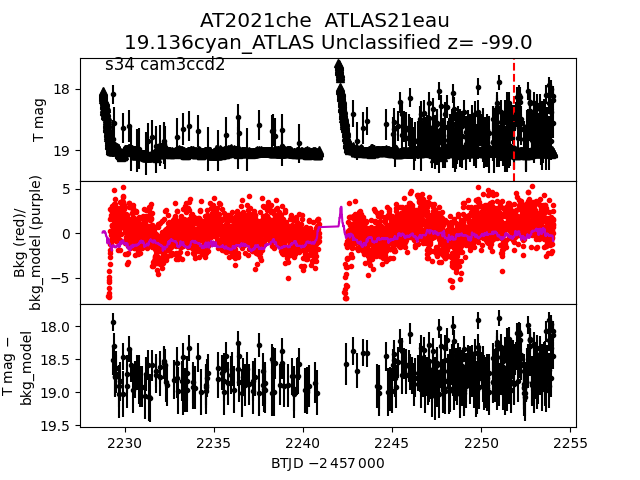
 2021che
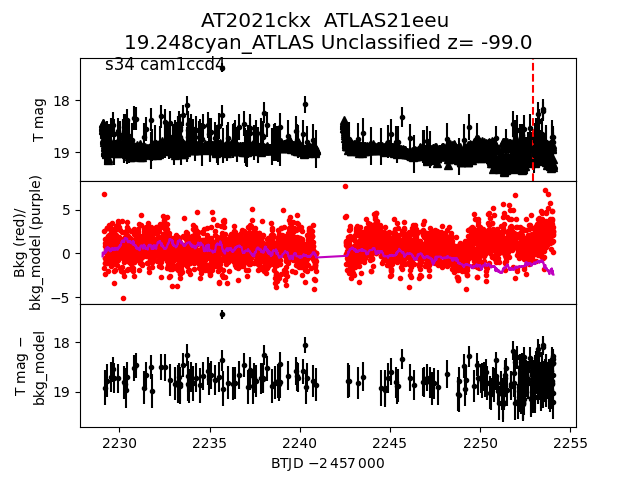
 2021ckx
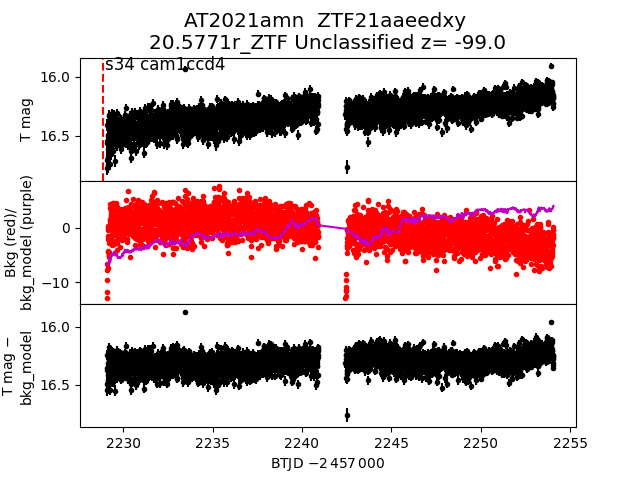
 2021amn
 2021cdd
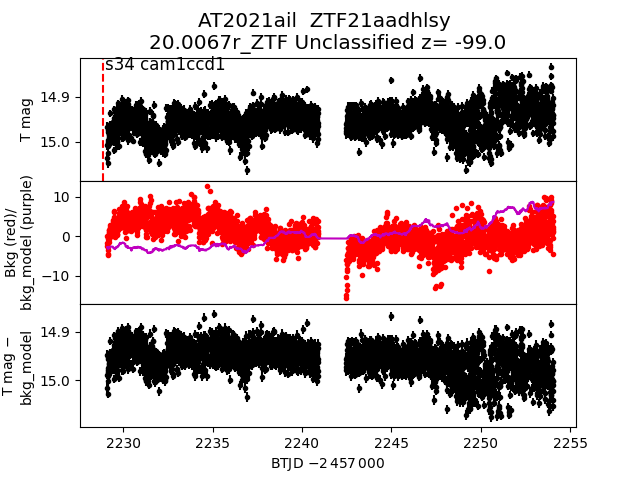
 2021ail
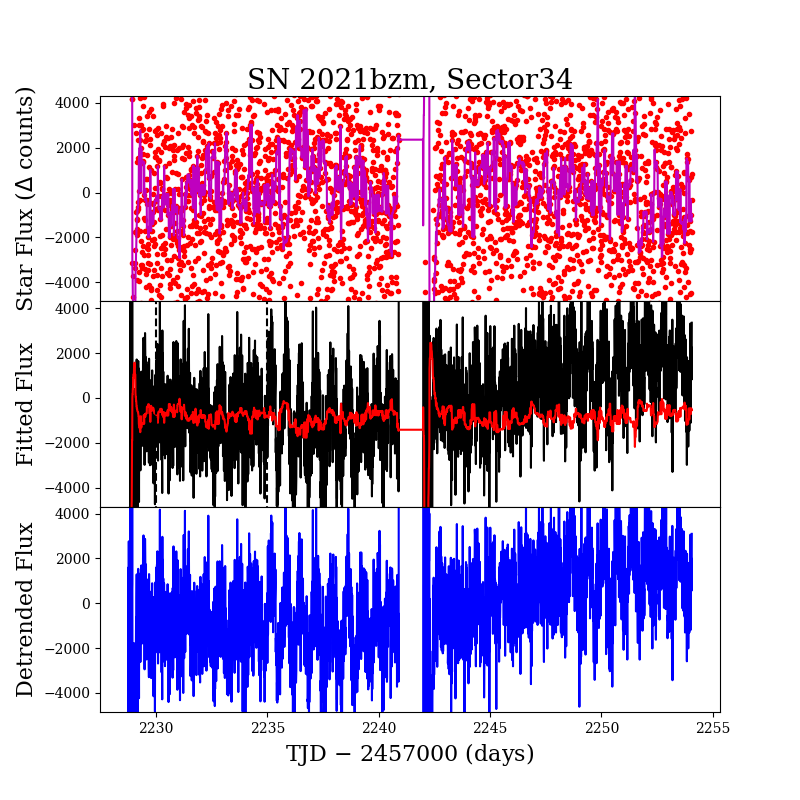
 2021bzm_detrended
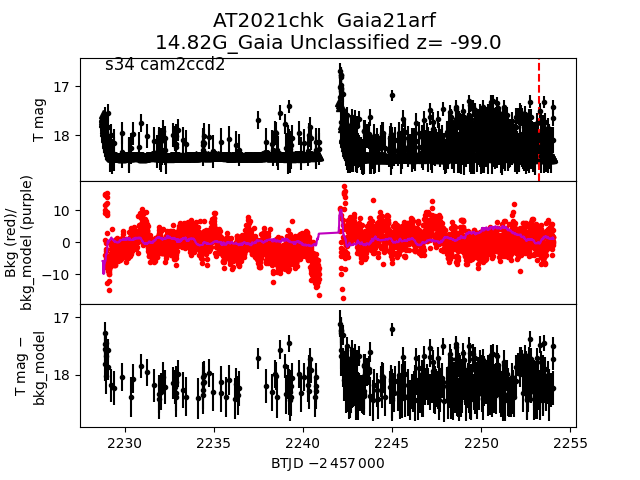
 2021chk
 2021dbh
 2021alx
 2021aub
 2021cda
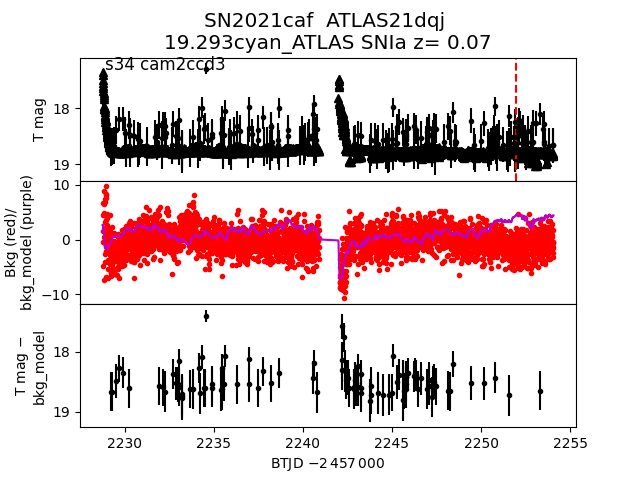
 2021caf
 2021bnd_detrended
 2021cfp
 2021byh
 2021caf
 2021bzc
 2021bzm
 2021bbu
 2021bya
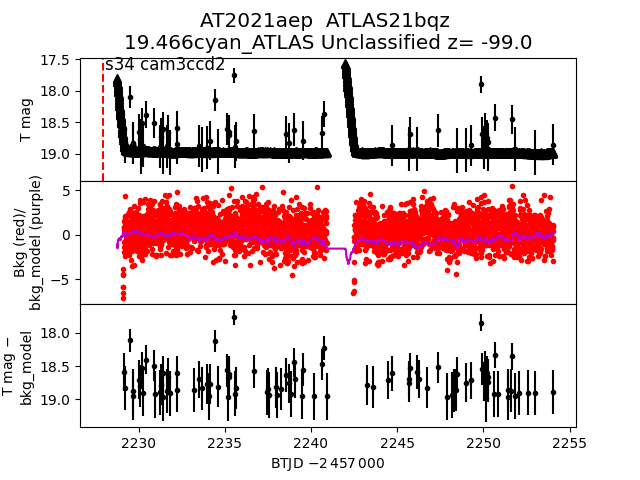
 2021aep
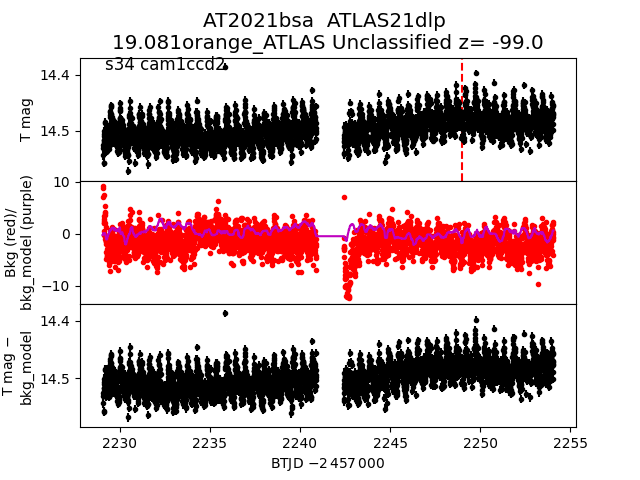
 2021bsa
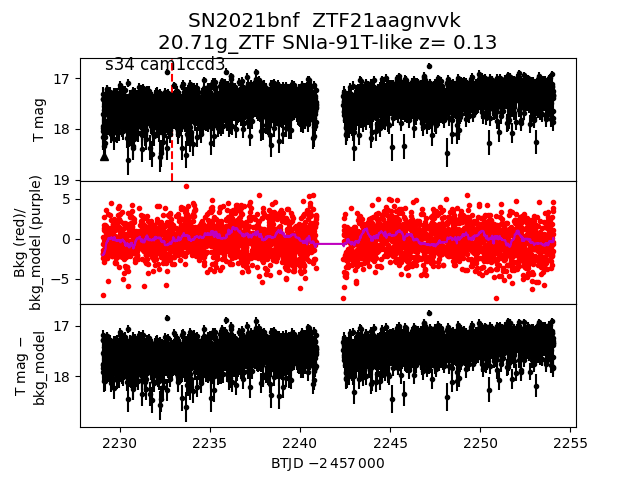
 2021bnf
 2021azz
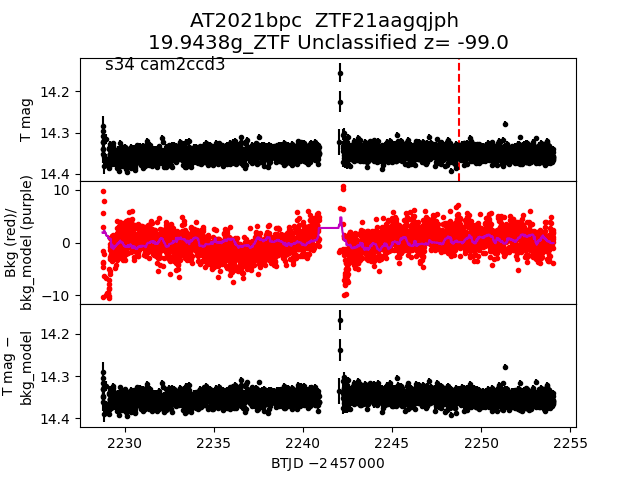
 2021bpc
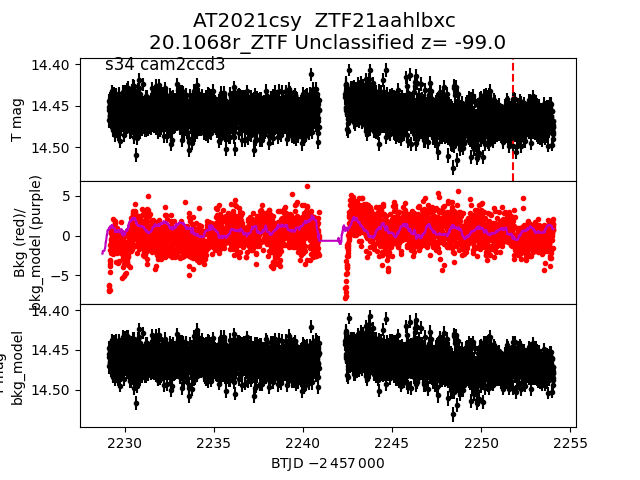
 2021csy
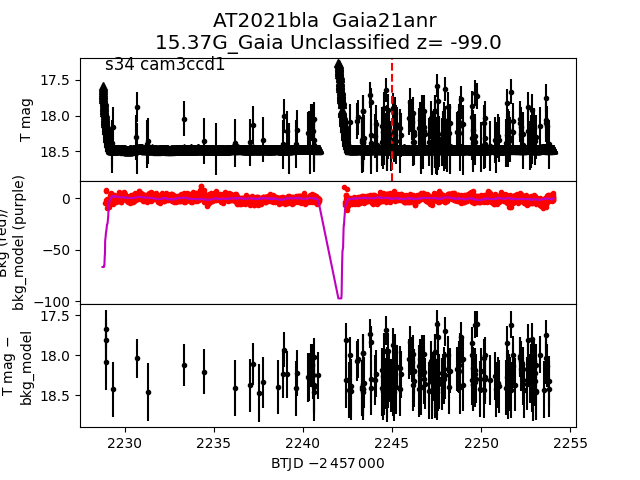
 2021bla
 2021bhc
 2021bpo
 2021aud
 2021avo
 2021alw
 2021bma
 2021any
 2021byx