all transients in sector33 (24 total)
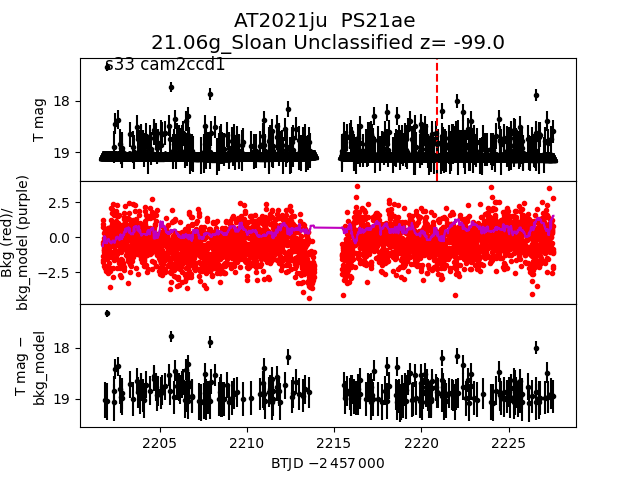
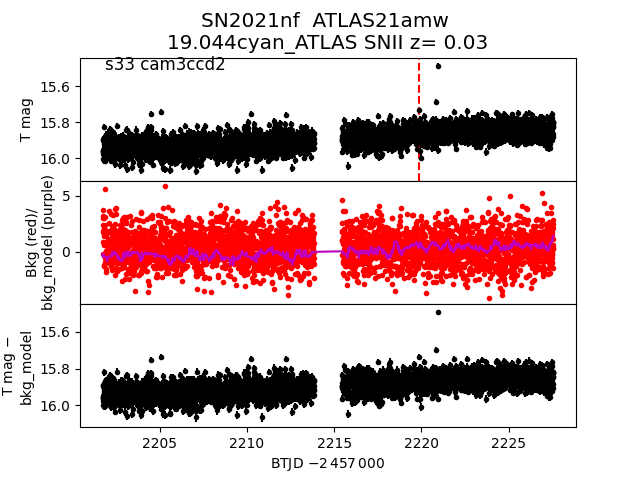
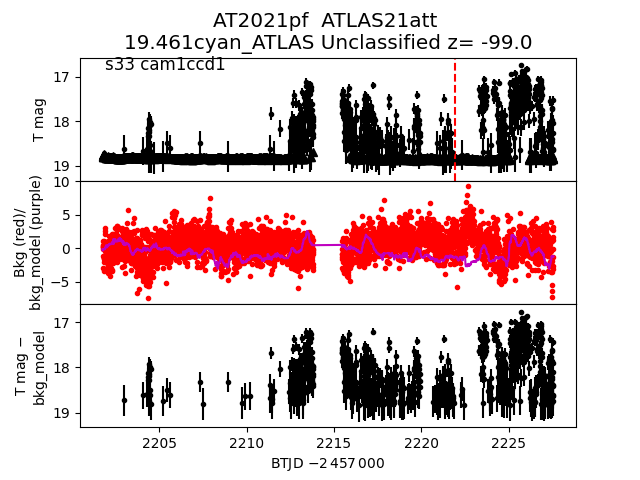
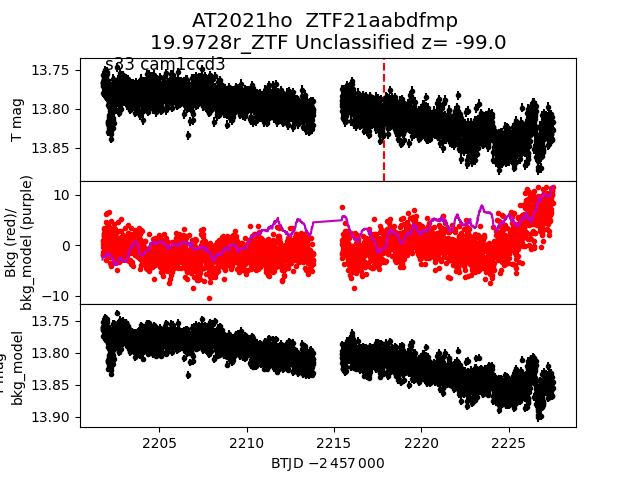
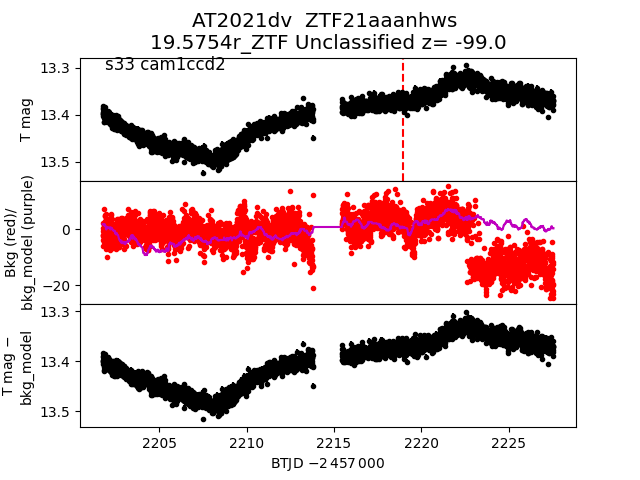
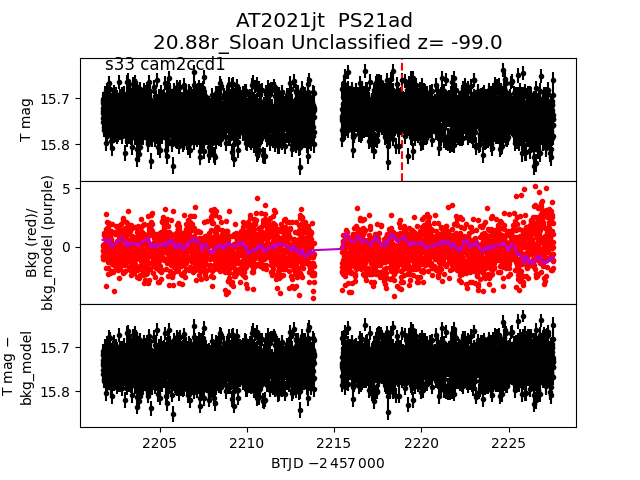
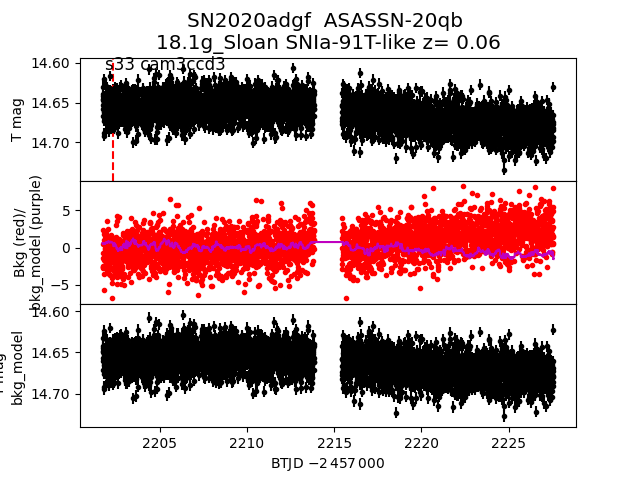
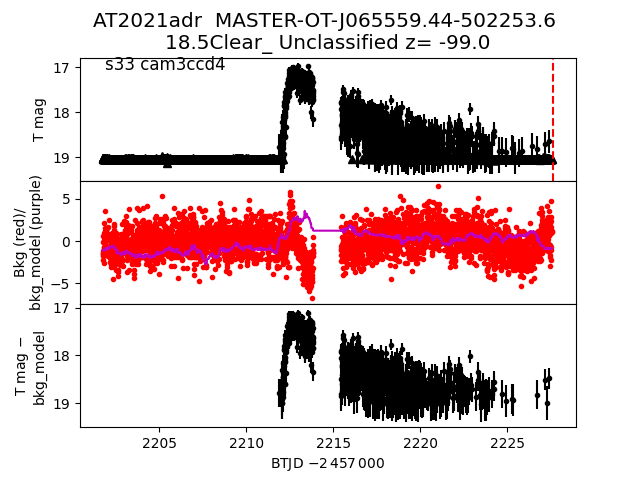
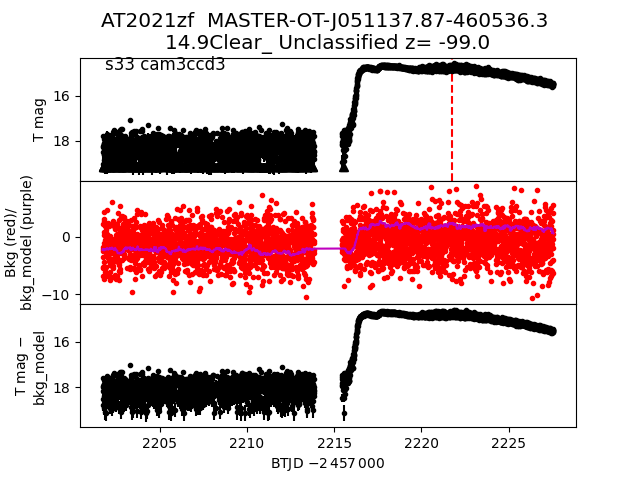
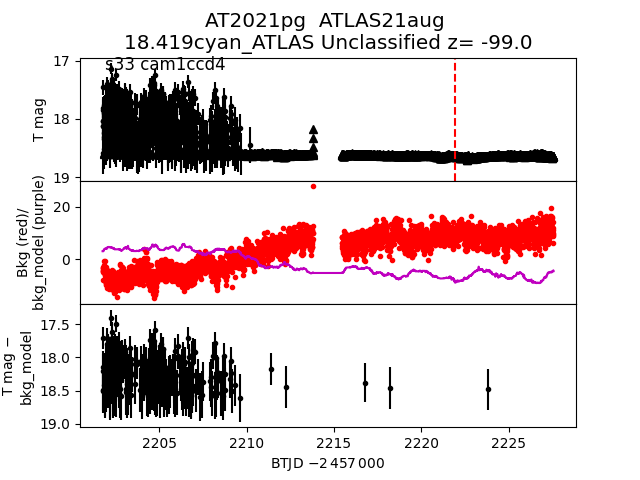
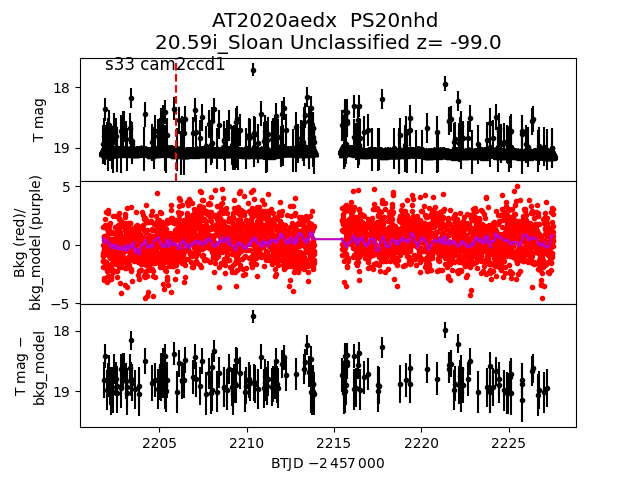
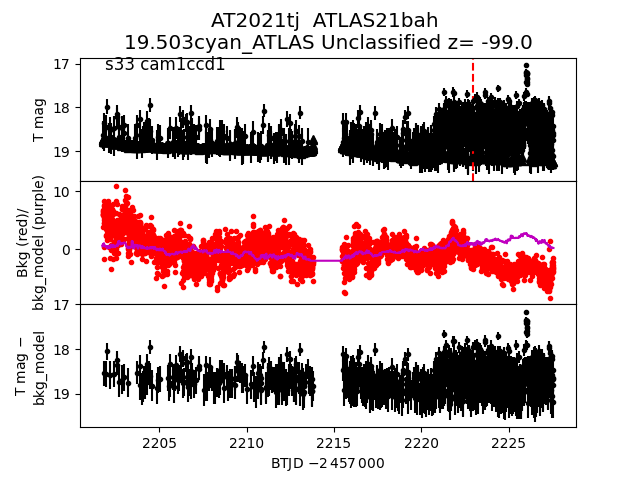
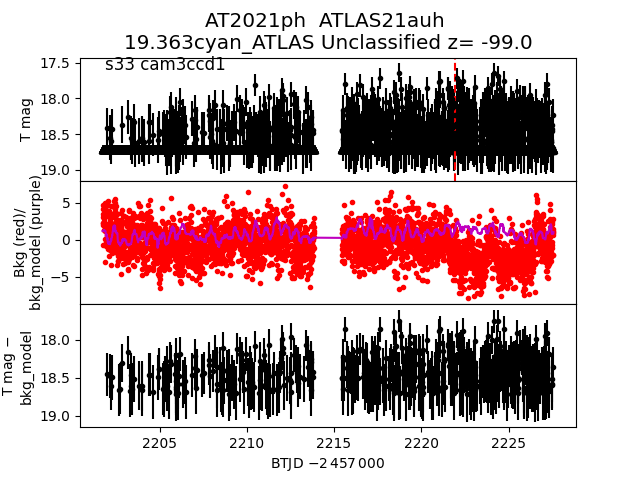
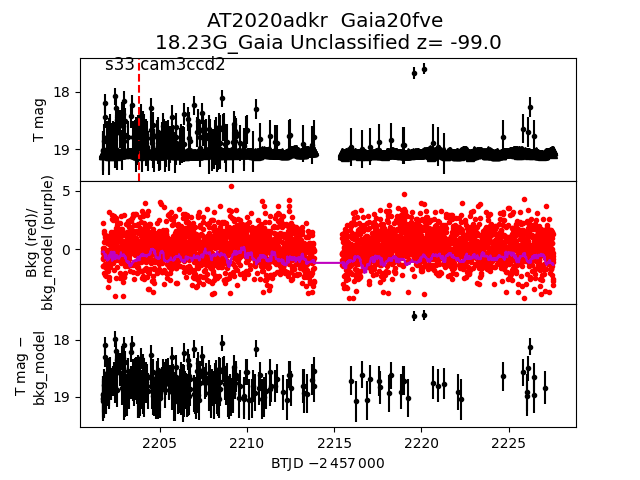
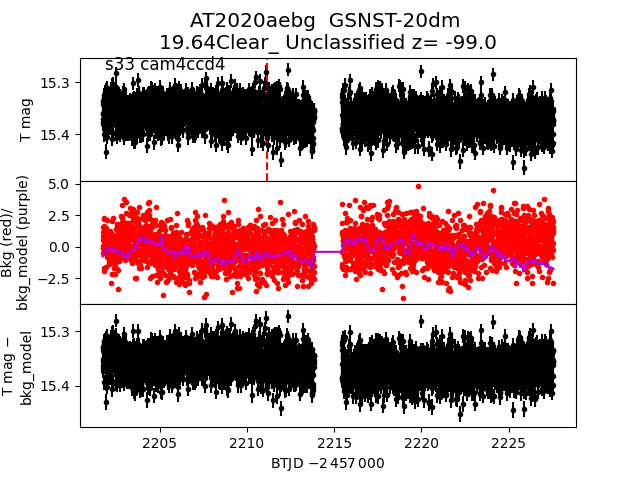
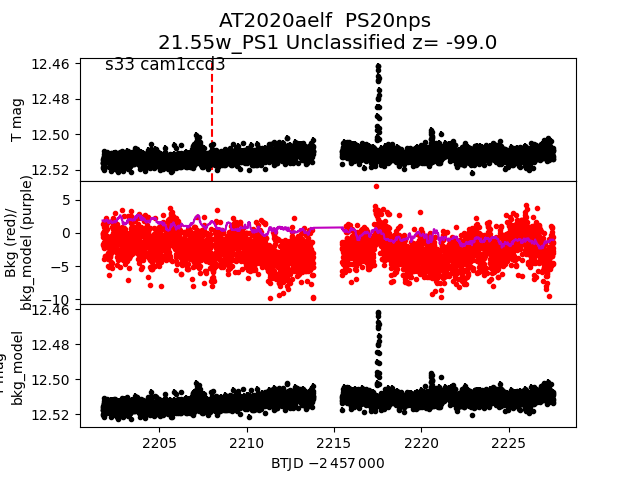
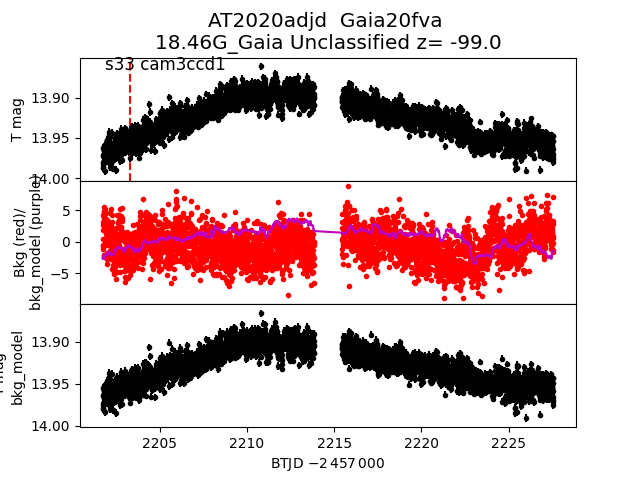
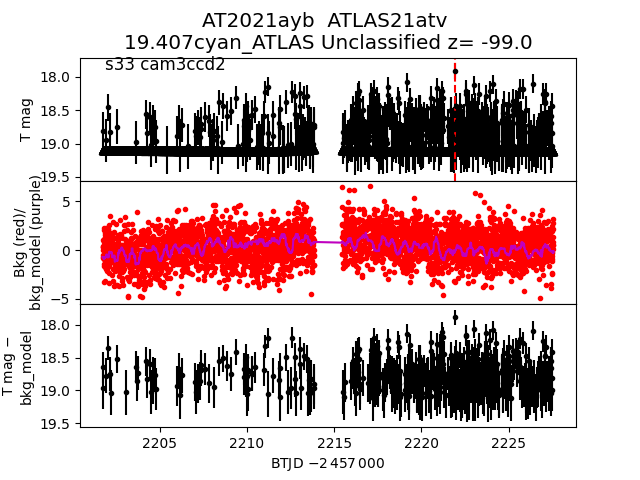
Each figure has three panels. The top panel shows the transient light curve, the middle panel shows the local background (estimated in an annulus), and the bottom panel shows a "background-model corrected" light curve. Details about the background model are in the README.
The vertical red line marks the time of discovery reported to TNS. Other useful metadata from TNS is in the figure title.
Note that the top and bottom panel are in magnitudes, while the middle panel is in differential flux units. The magnitudes are calibrated to the flux in the reference image used for image subtraction. Thus, flux from the host galaxy is included in these magnitudes.
3-sigma upper limits are plotted as triangles with no errorbars. A typical limiting magnitude is 19.6 in 30 minutes or 18.4 in 200 seconds (for low backgrounds).
The links allow you to download the light curve data as a text file.
More details in the README.
2021nf
 2021pf
 2021ho
 2021dv
 2021jt
 2020adgf
 2021adr
 2021zf
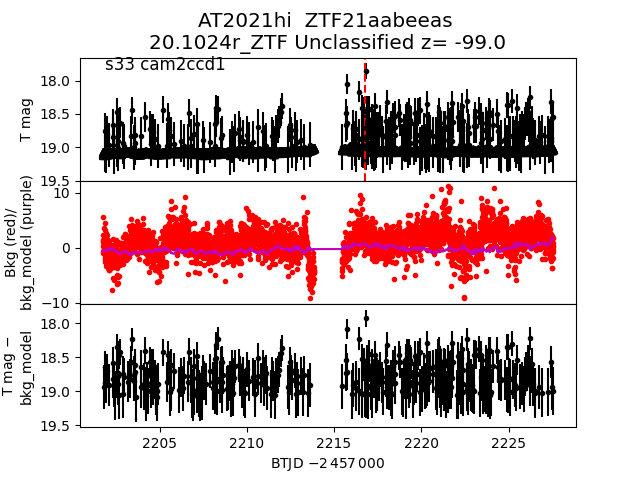
 2021hi
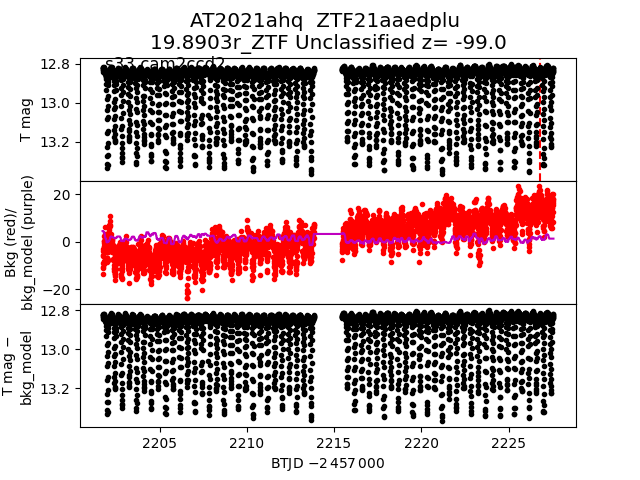
 2021ahq
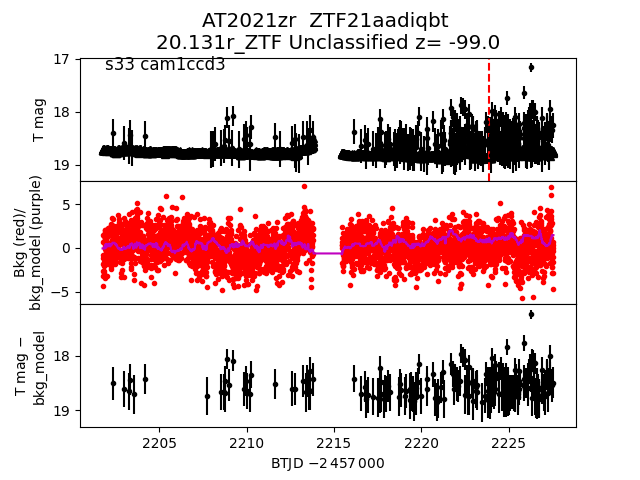
 2021zr
 2021pg
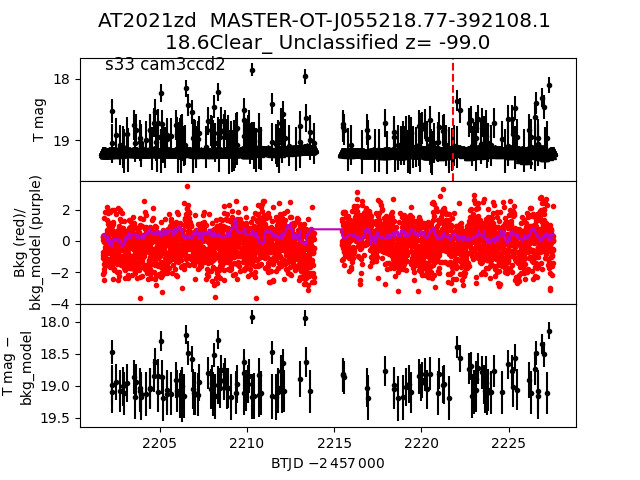
 2021zd
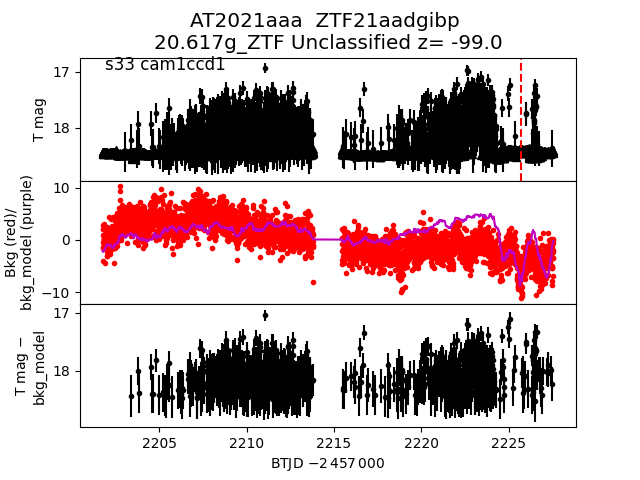
 2021aaa
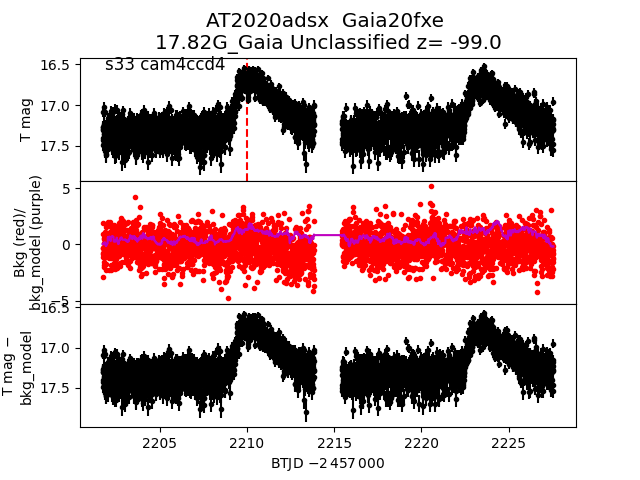
 2020adsx
 2020aedx
 2021tj
 2021ph
 2020adkr
 2020aebg
 2020aelf
 2020adjd
 2021ayb
 2021ju