sector32 supernovae (48 total)
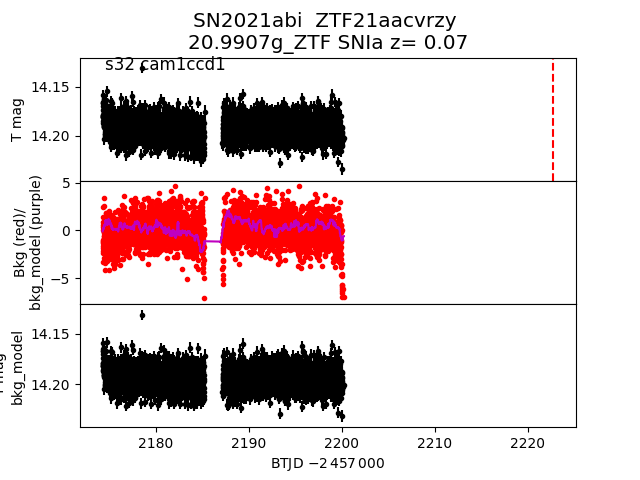
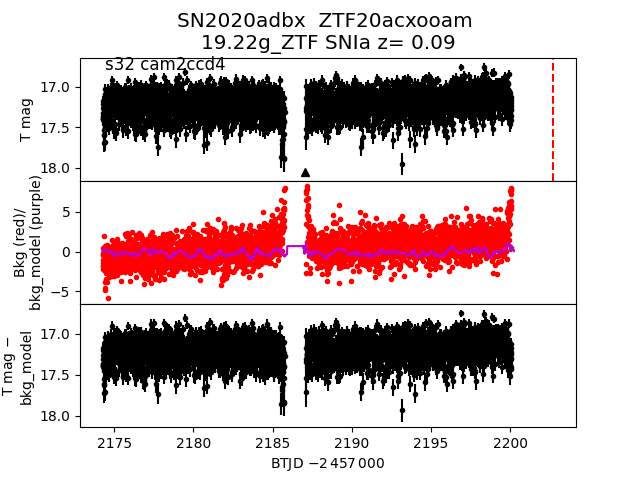
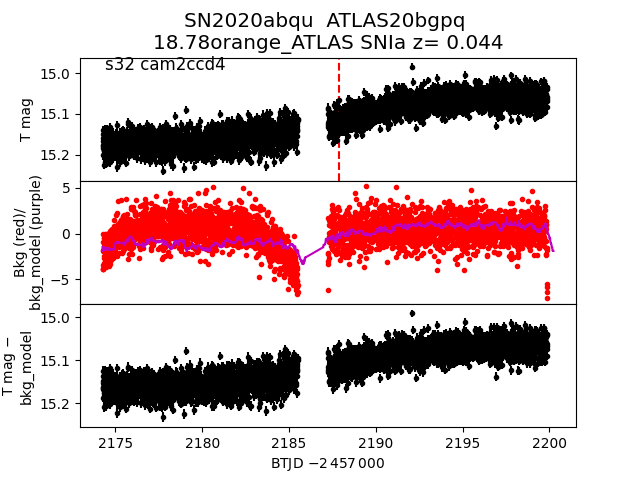
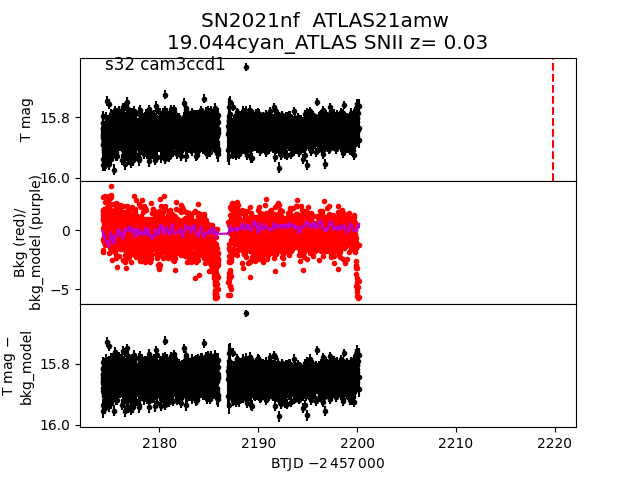
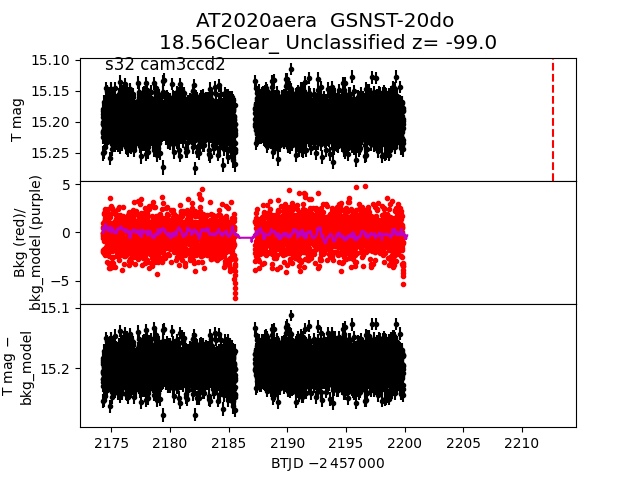
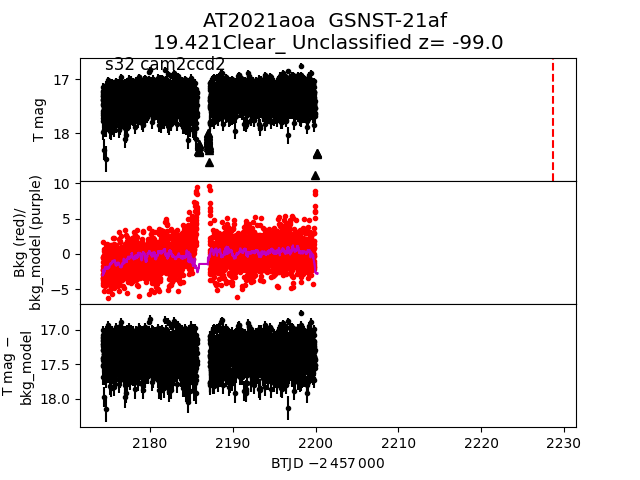
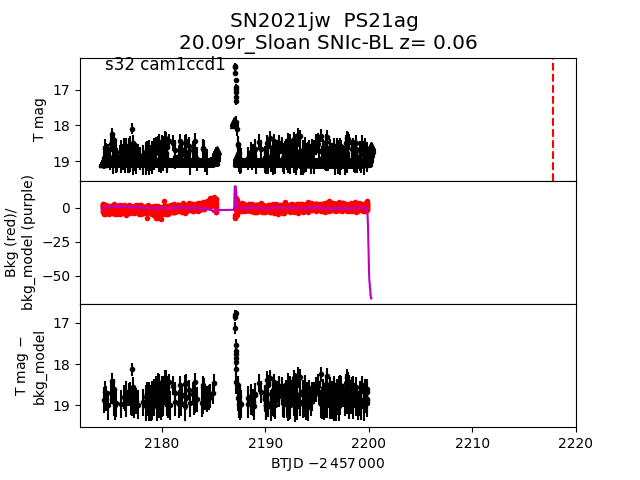
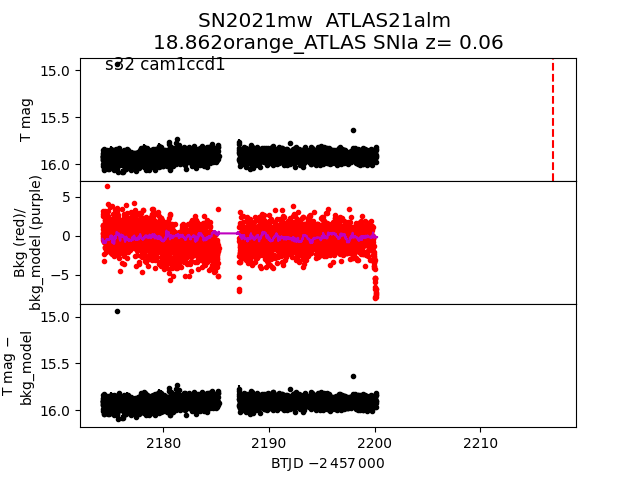
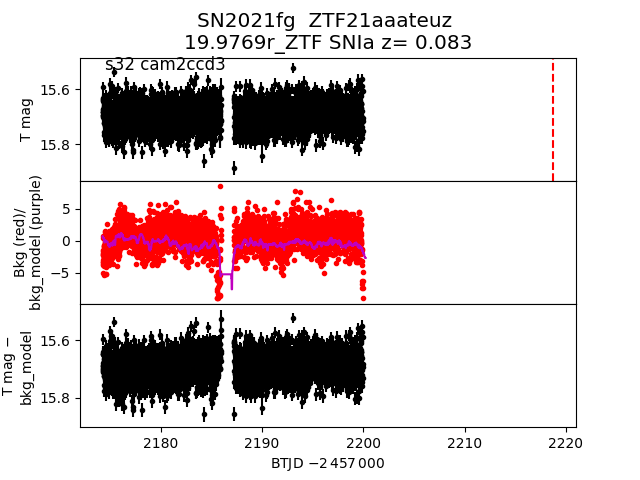
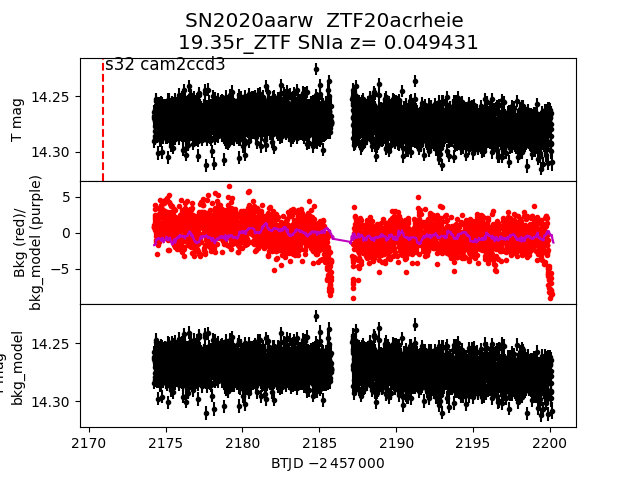
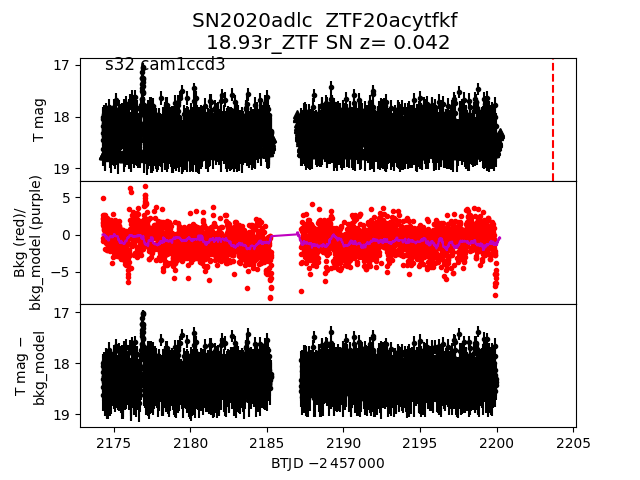
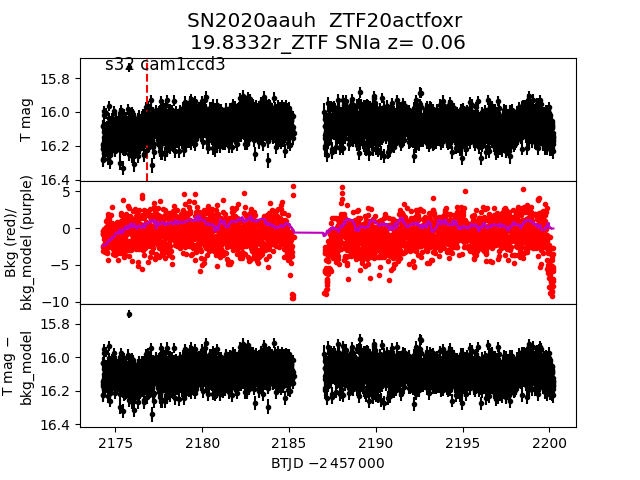
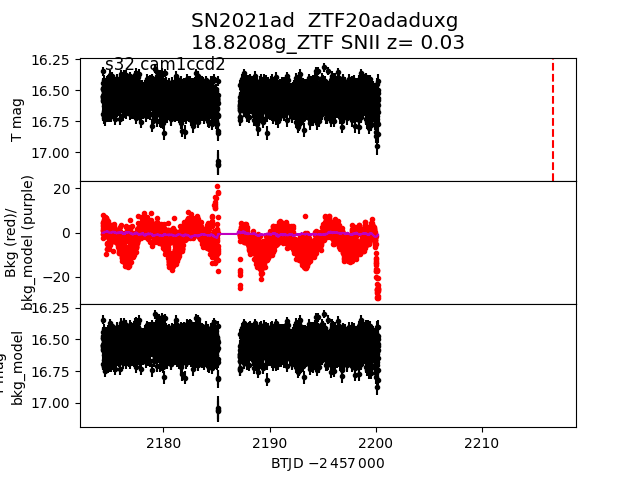
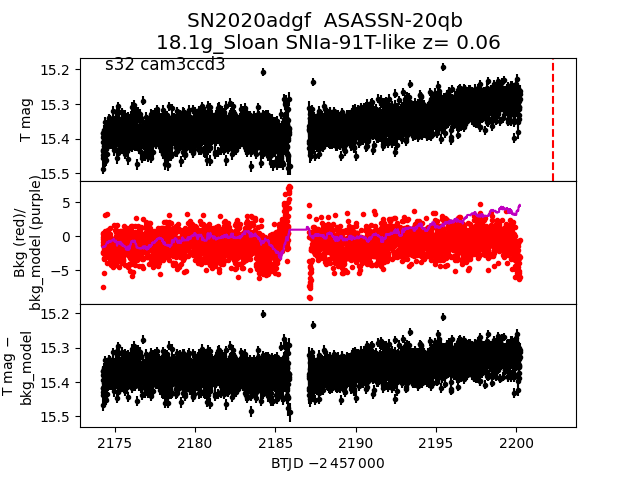
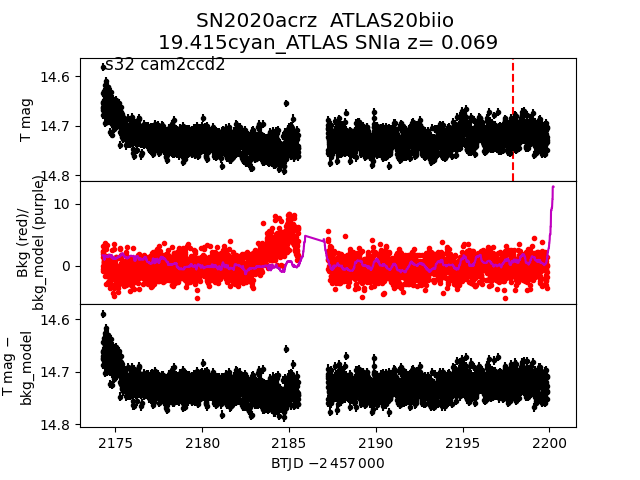
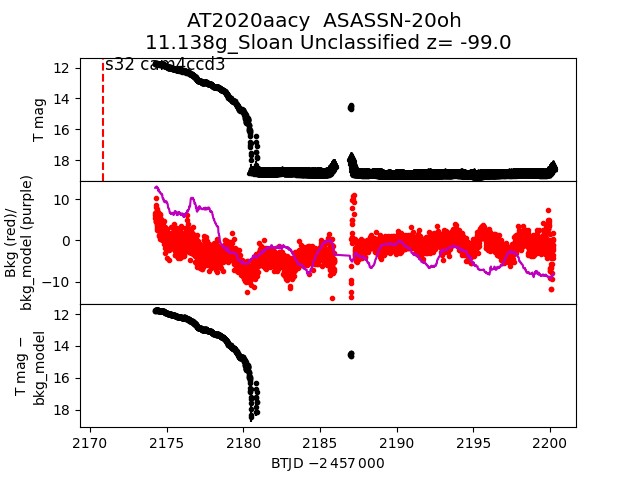
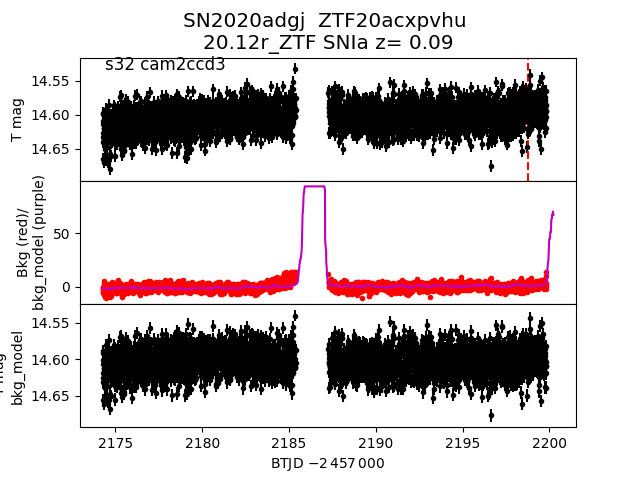
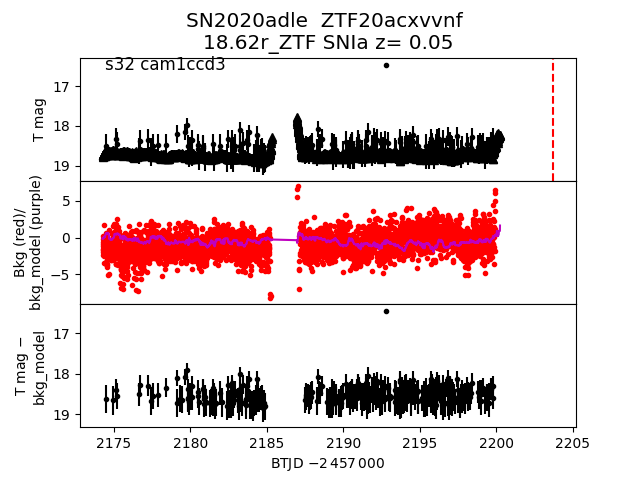
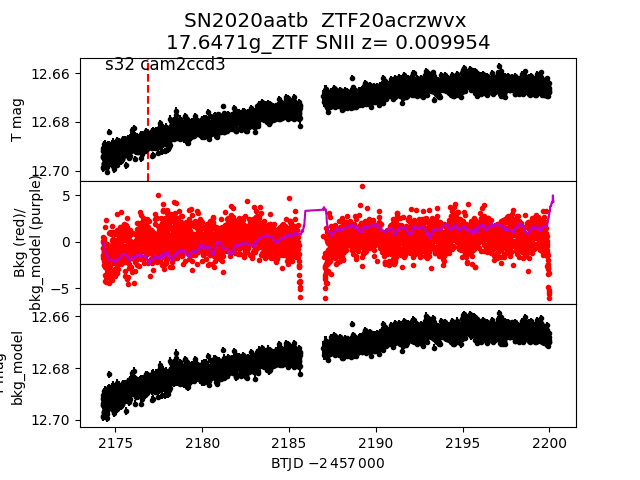
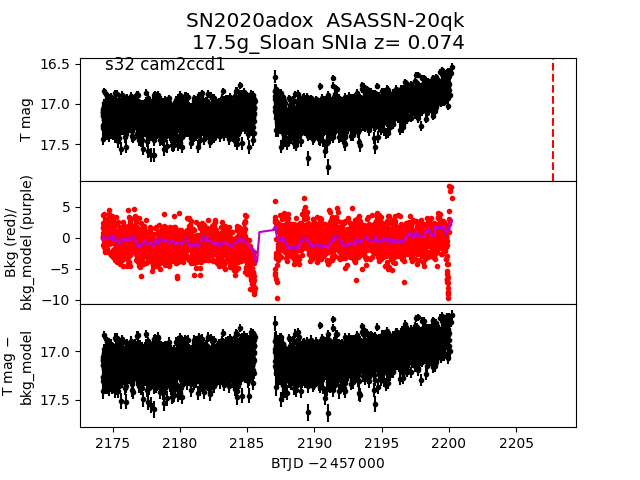
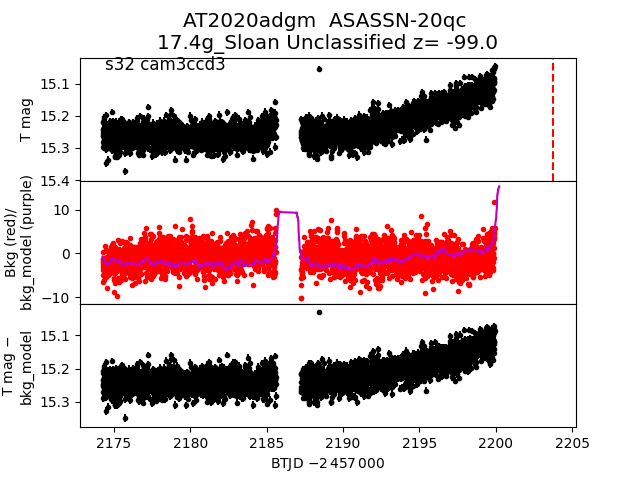
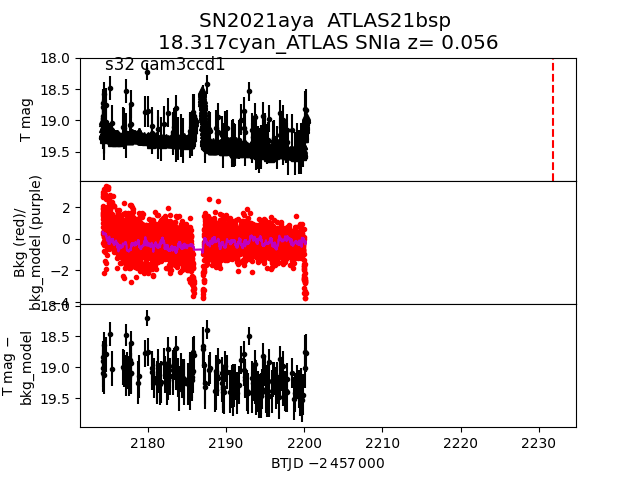
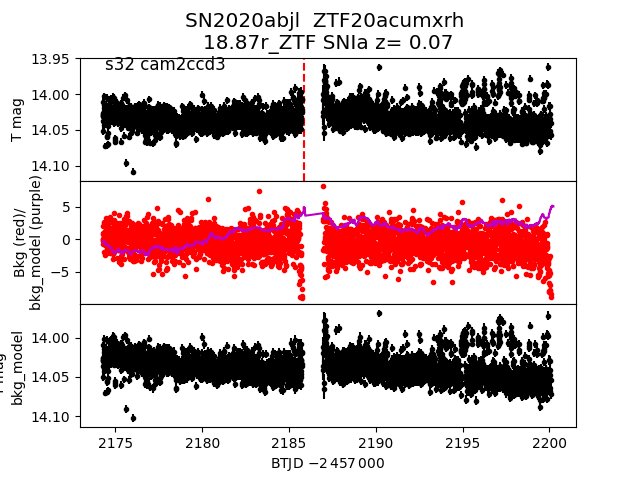
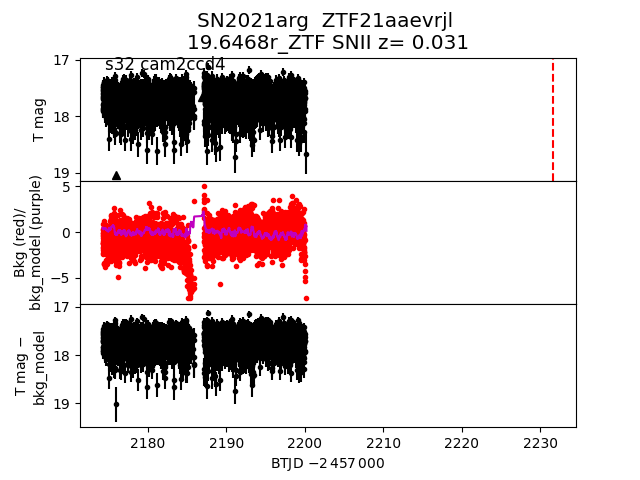
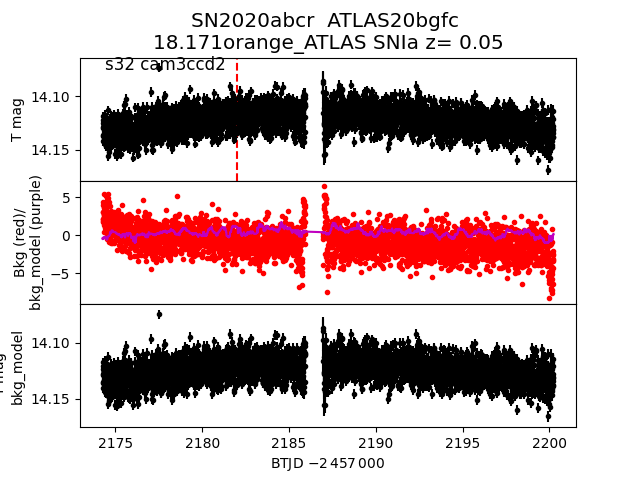
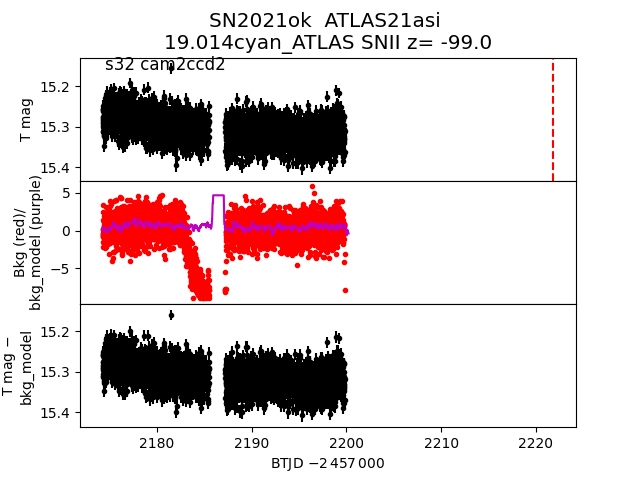
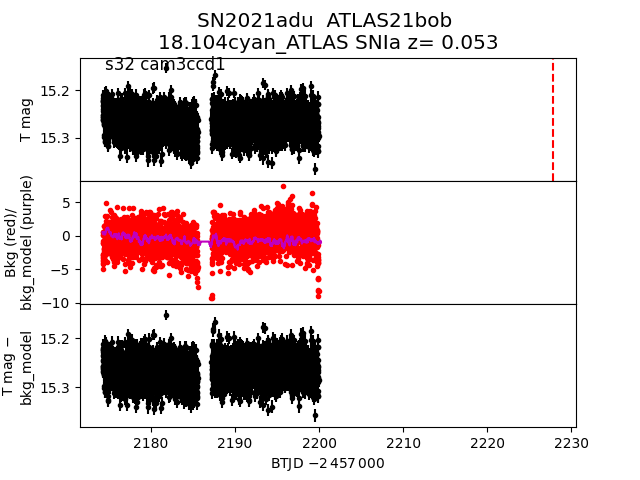
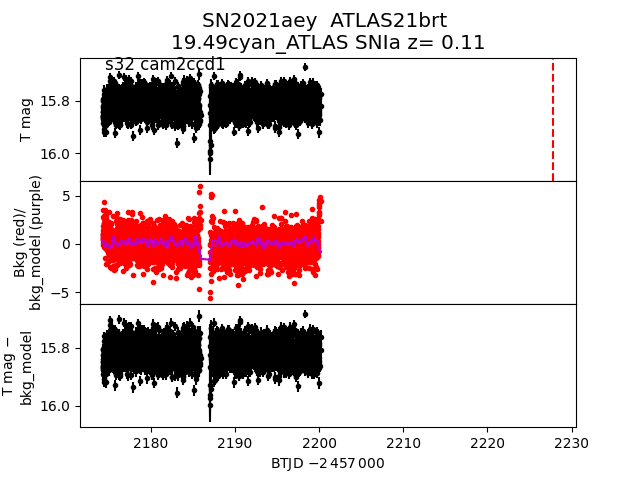
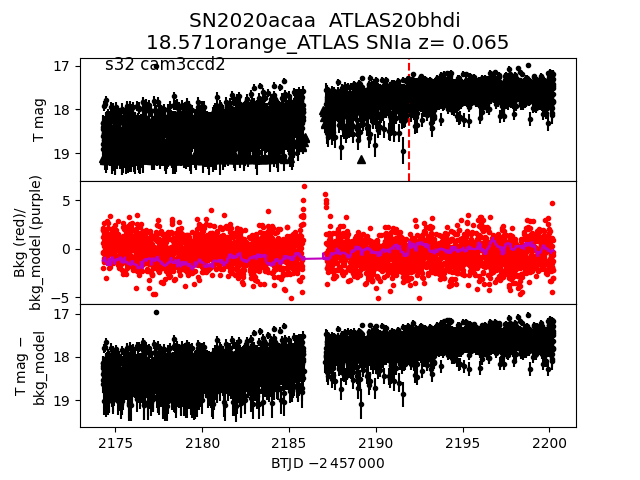
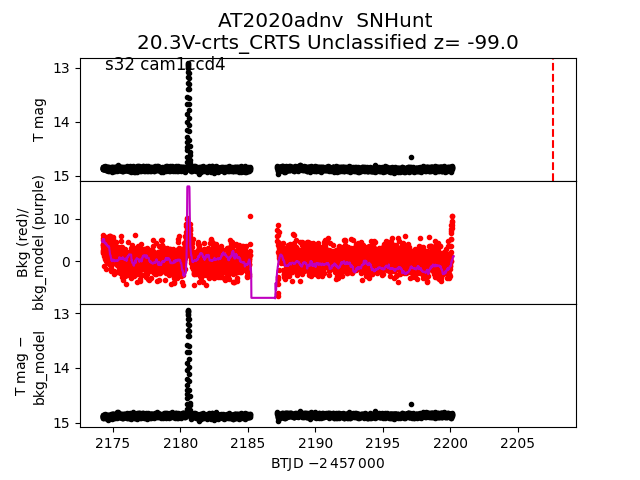
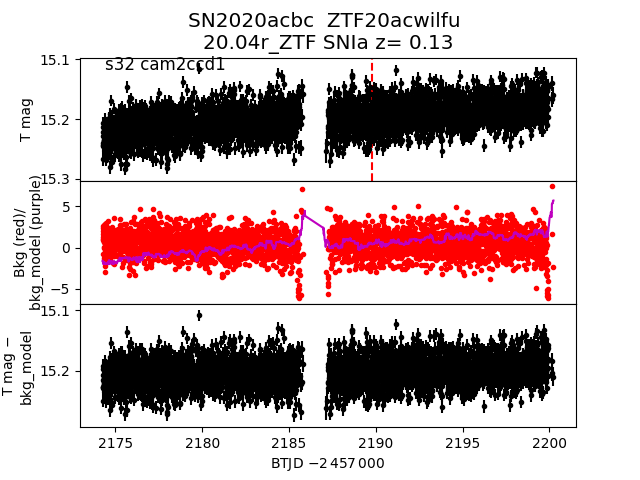
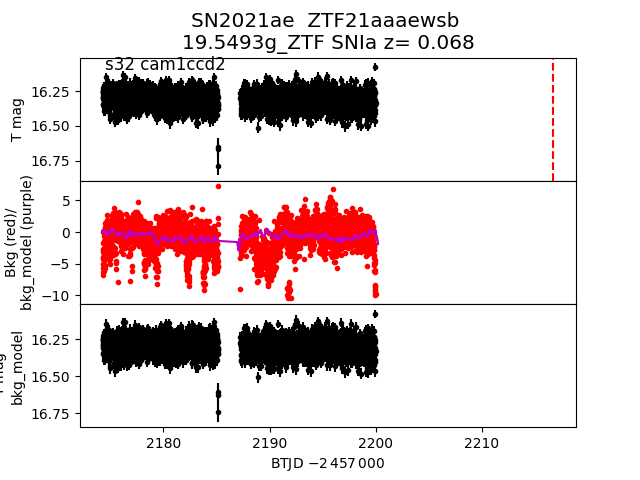
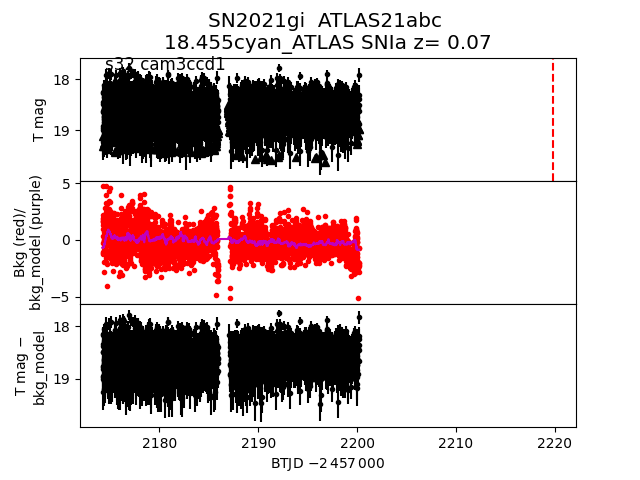
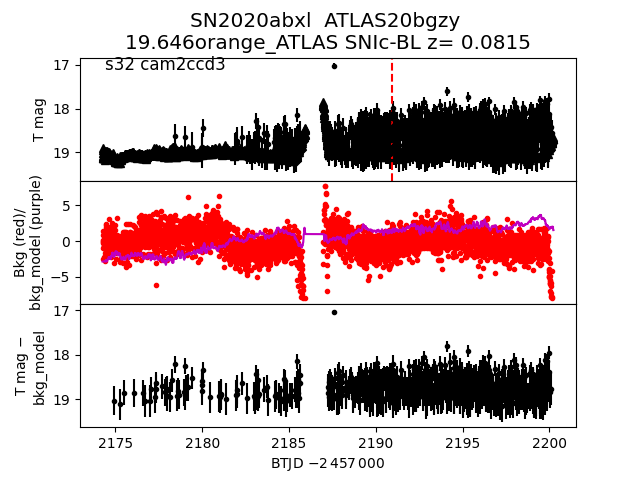
Each figure has three panels. The top panel shows the transient light curve, the middle panel shows the local background (estimated in an annulus), and the bottom panel shows a "background-model corrected" light curve. Details about the background model are in the README.
The vertical red line marks the time of discovery reported to TNS. Other useful metadata from TNS is in the figure title.
Note that the top and bottom panel are in magnitudes, while the middle panel is in differential flux units. The magnitudes are calibrated to the flux in the reference image used for image subtraction. Thus, flux from the host galaxy is included in these magnitudes.
3-sigma upper limits are plotted as triangles with no errorbars. A typical limiting magnitude is 19.6 in 30 minutes or 18.4 in 200 seconds (for low backgrounds).
The links allow you to download the light curve data as a text file.
More details in the README.
2020adbx
 2020abqu
 2021nf
 2020aera
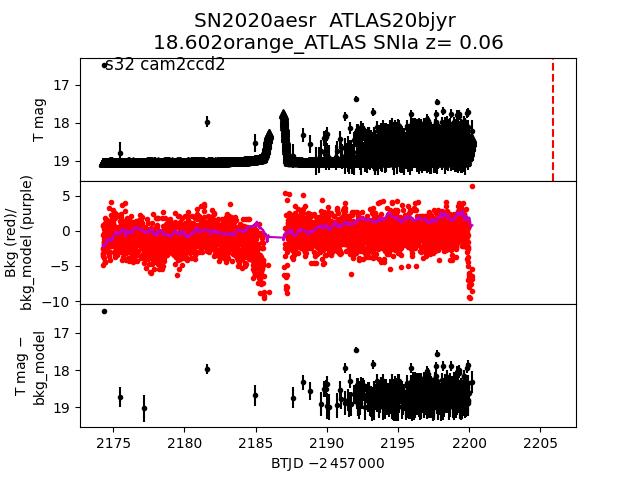
 2020aesr
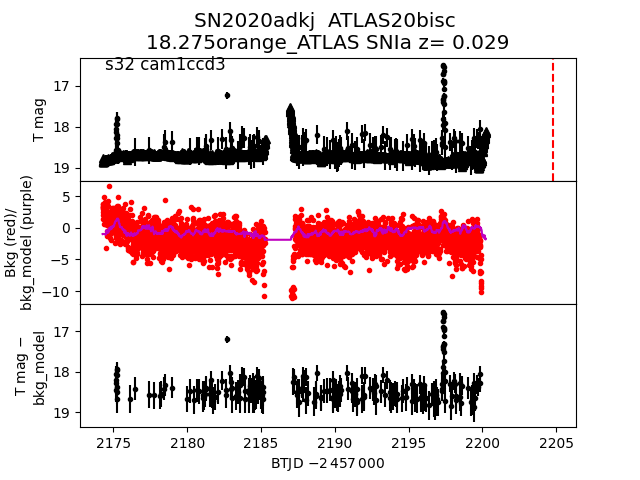
 2020adkj
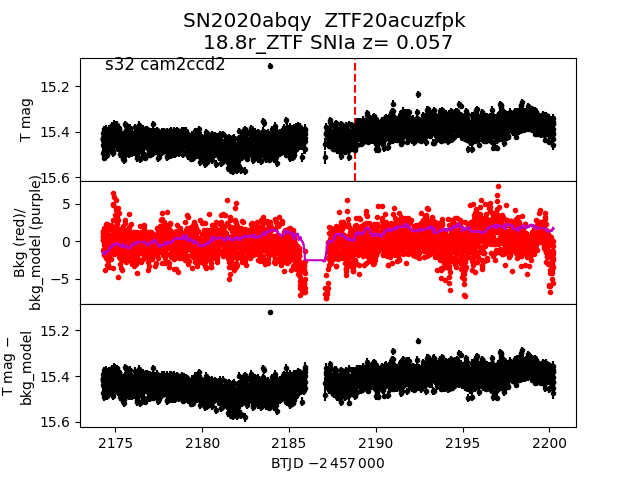
 2020abqy
 2021aoa
 2021jw
 2021mw
 2021fg
 2020aarw
 2020adlc
 2020aauh
 2021ad
 2020adgf
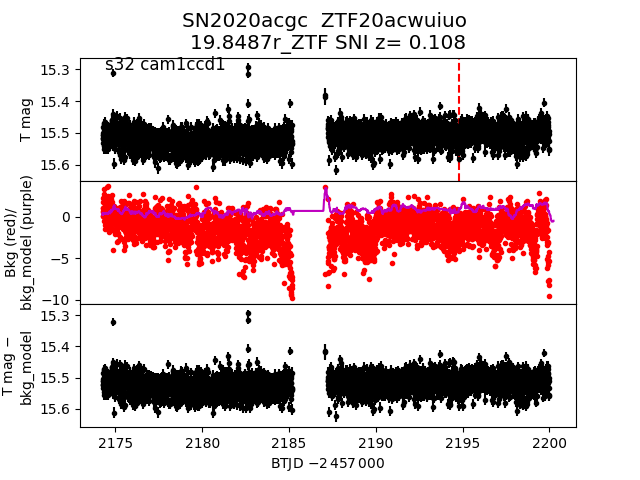
 2020acgc
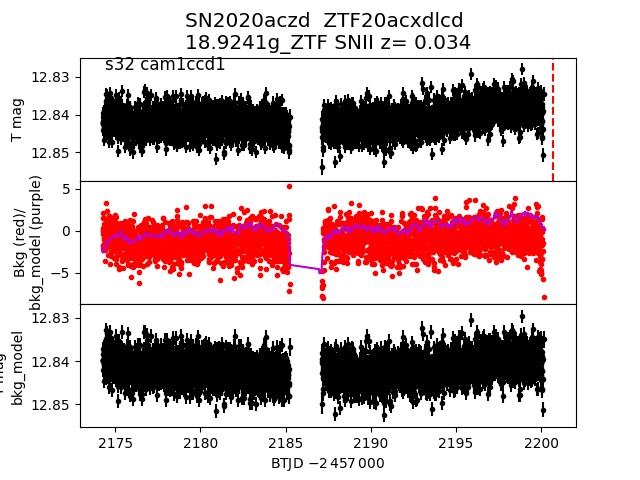
 2020aczd
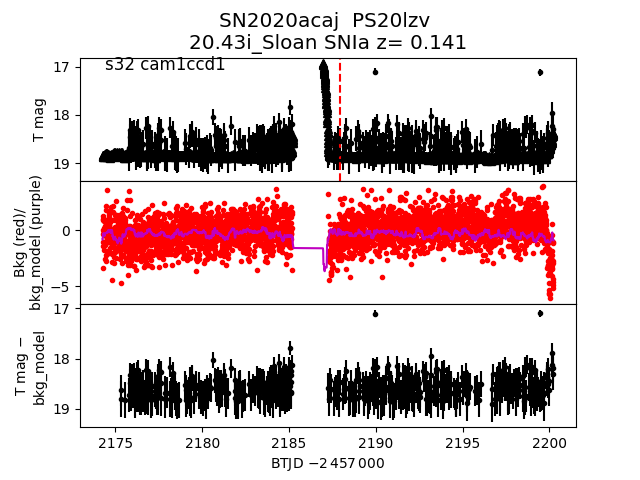
 2020acaj
 2020acrz
 2020aacy
 2020adgj
 2020adle
 2020aatb
 2020adox
 2020adgm
 2021aya
 2020abjl
 2021arg
 2020abcr
 2021ok
 2021adu
 2021aey
 2020acaa
 2020adnv
 2020acbc
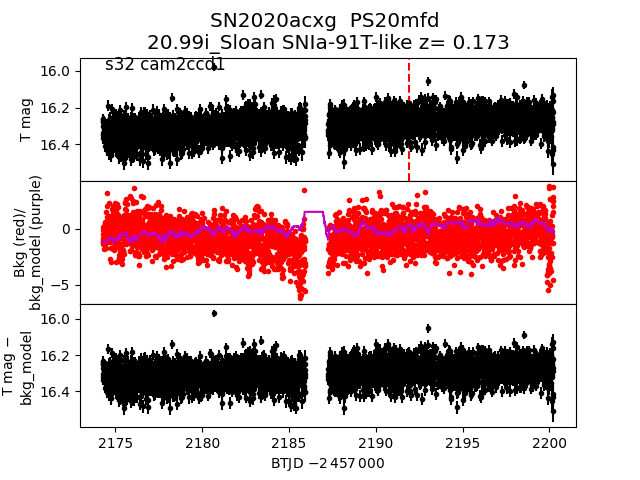
 2020acxg
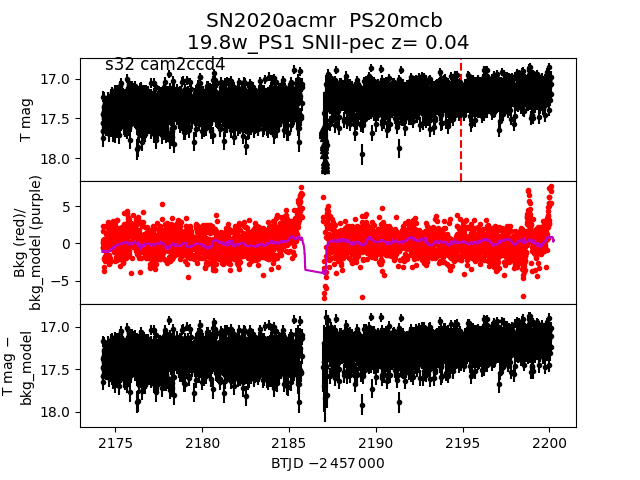
 2020acmr
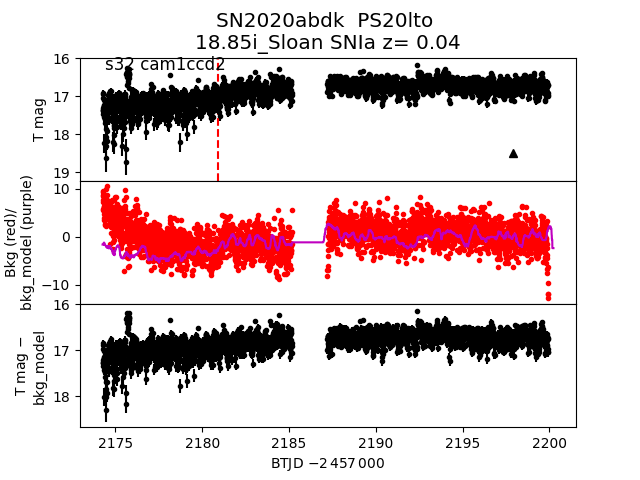
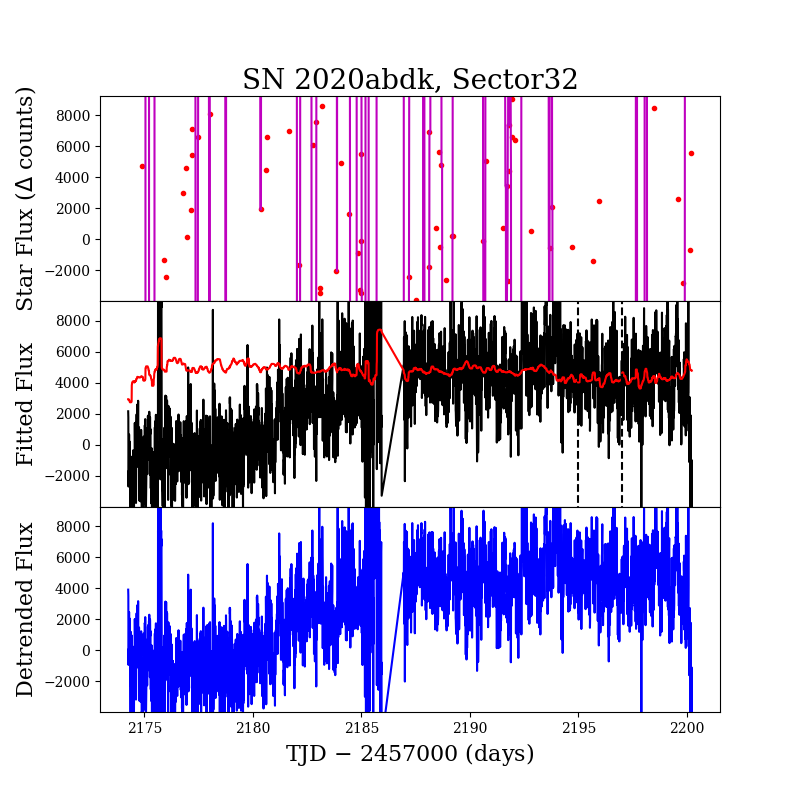
 2020abdk
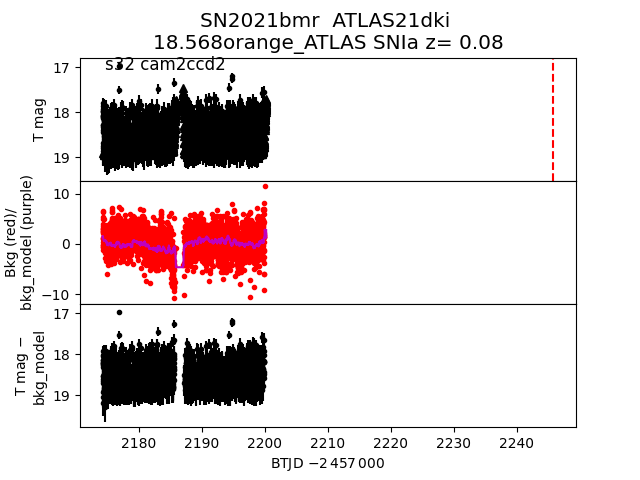
 2021bmr
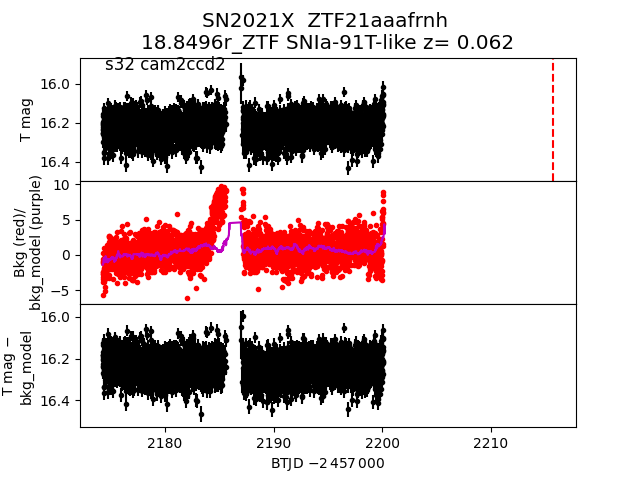
 2021X
2021X
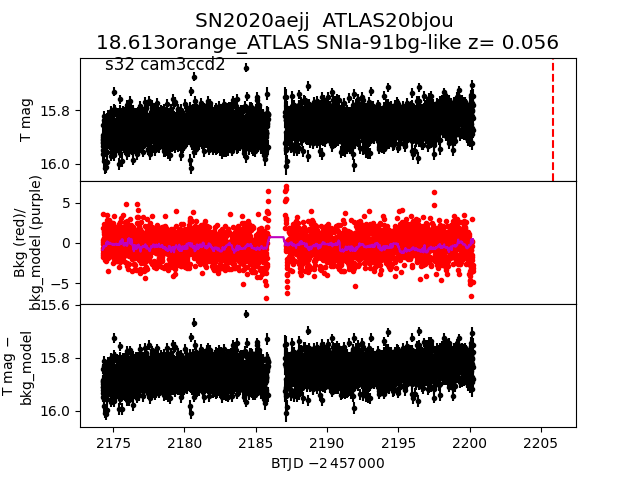
 2020aejj
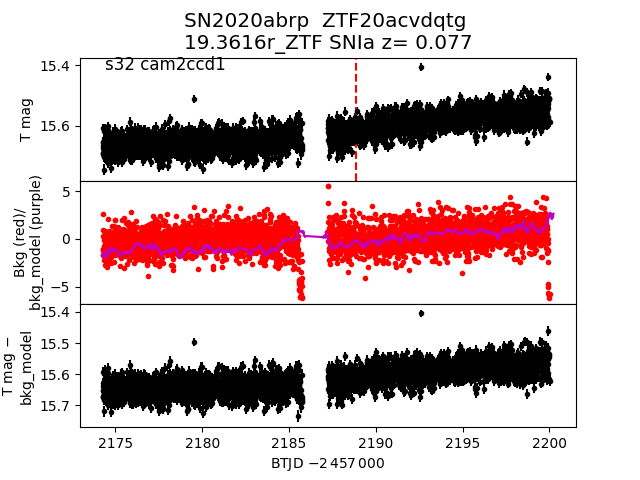
 2020abrp
 2021ae
 2021gi
 2020abdk
 2020abxl
 2021abi