sector31 supernovae (27 total)
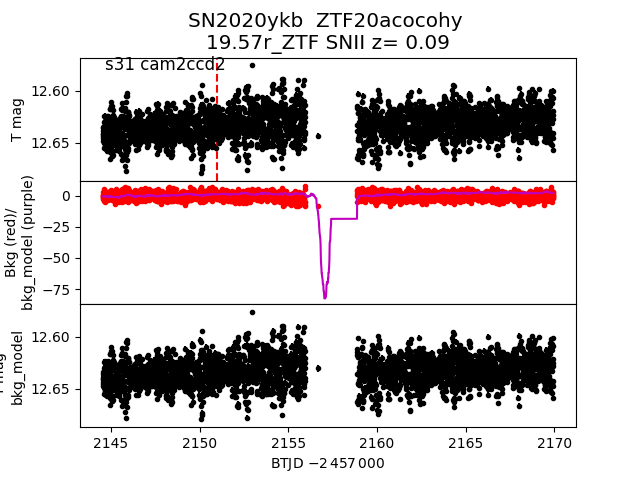
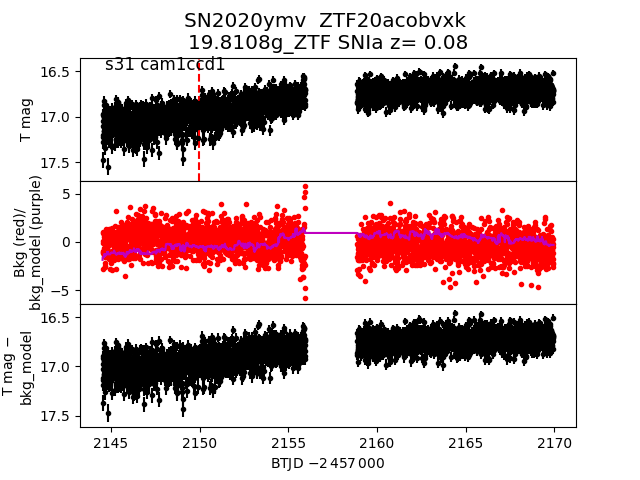
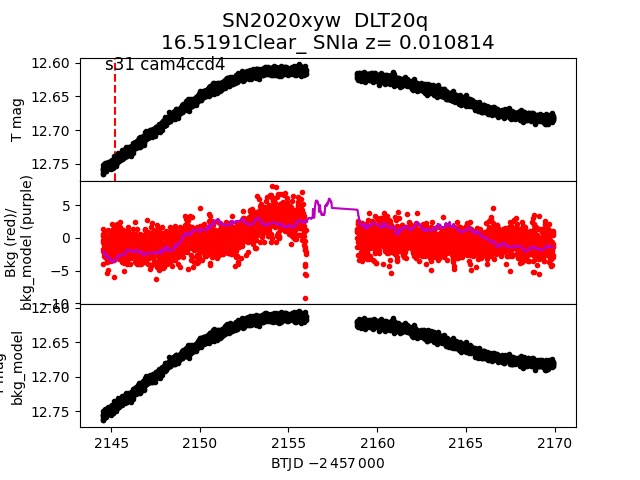
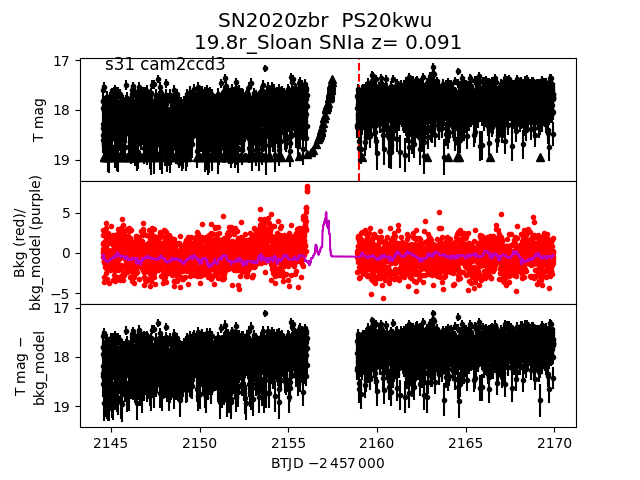
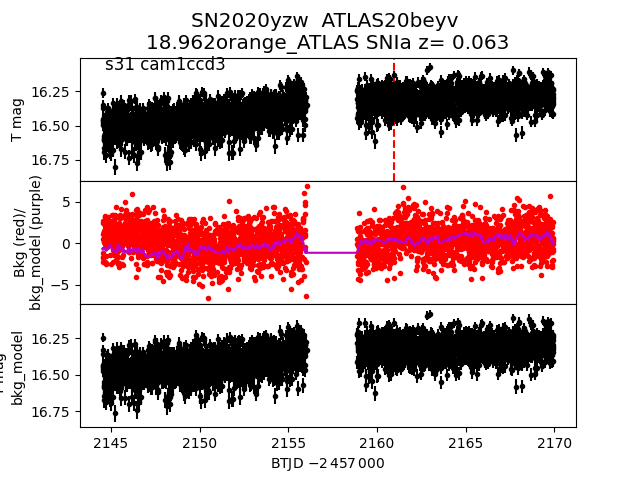
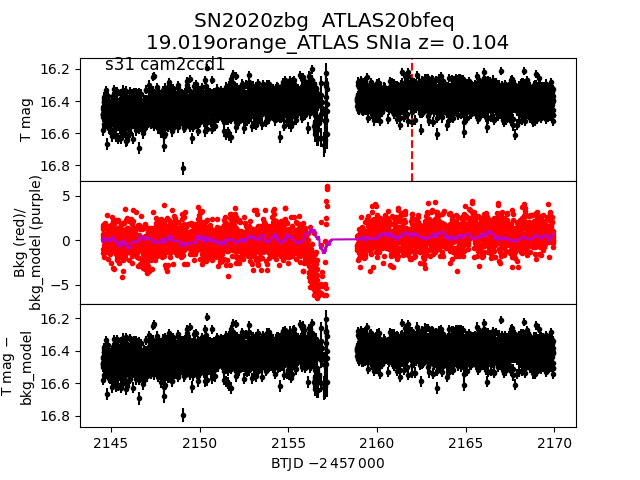
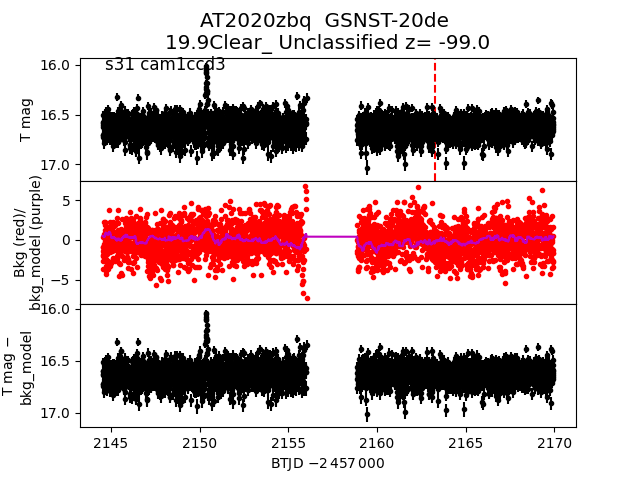
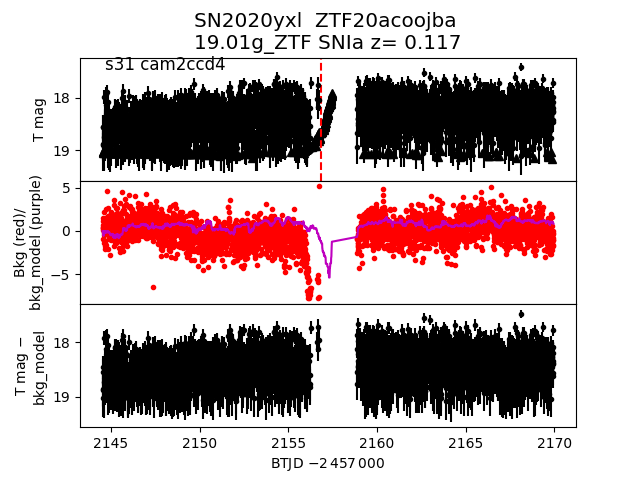
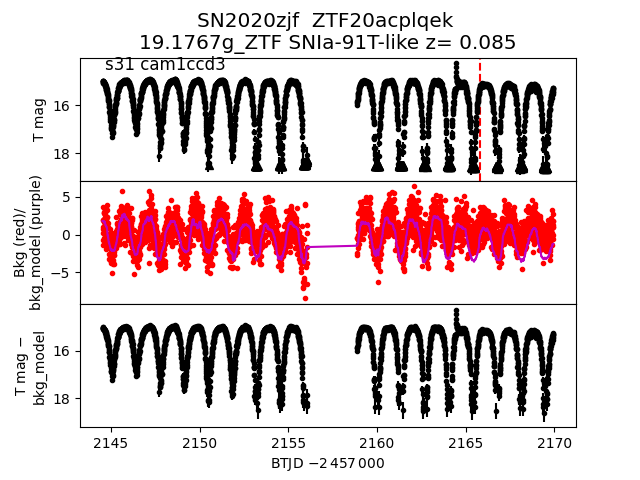
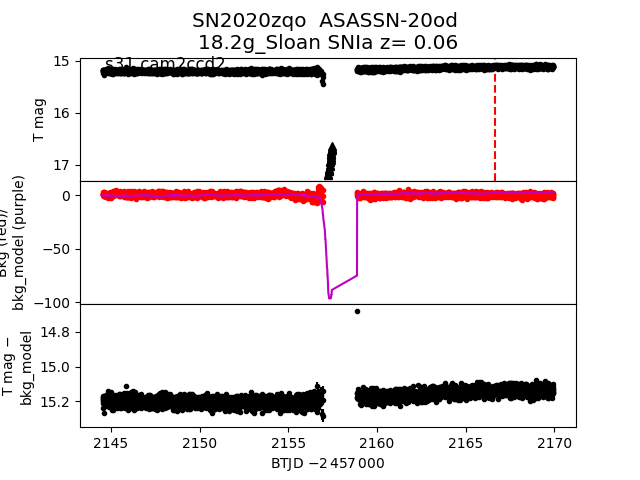
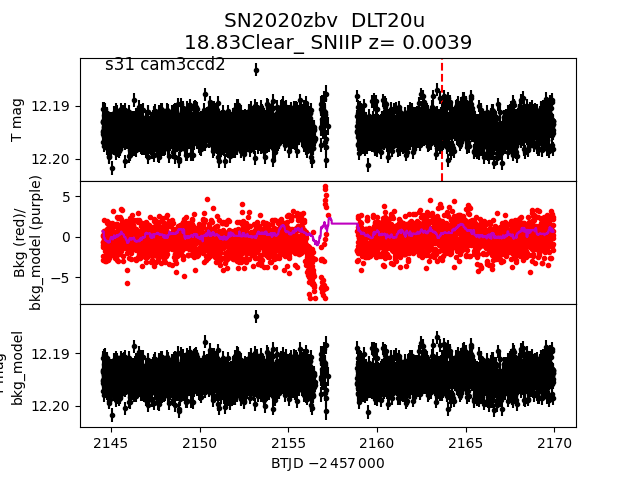
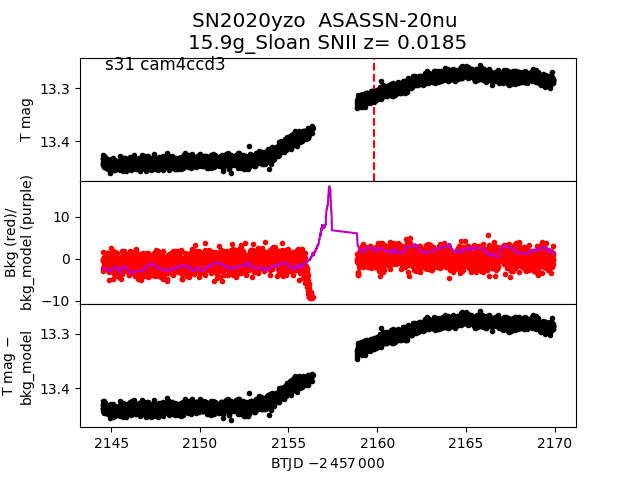
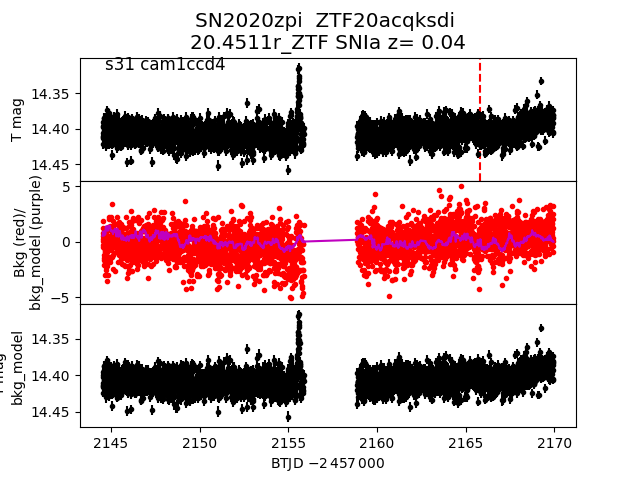
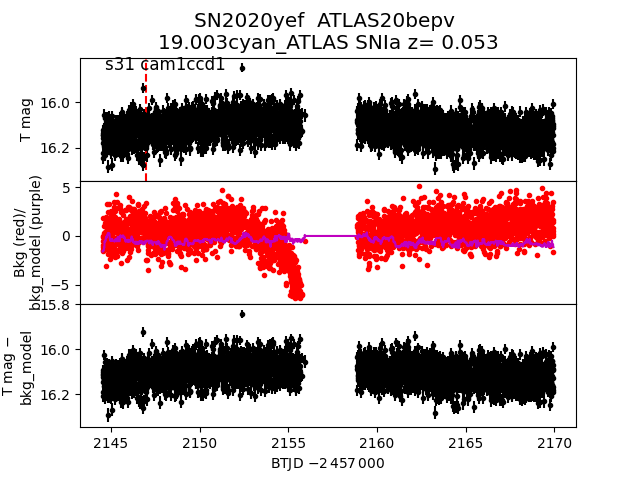
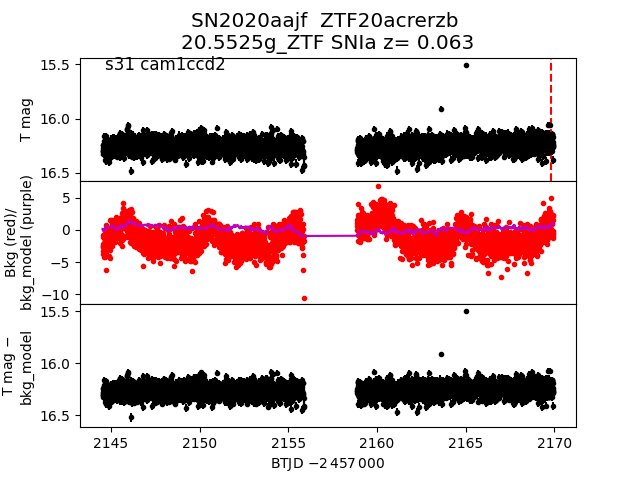
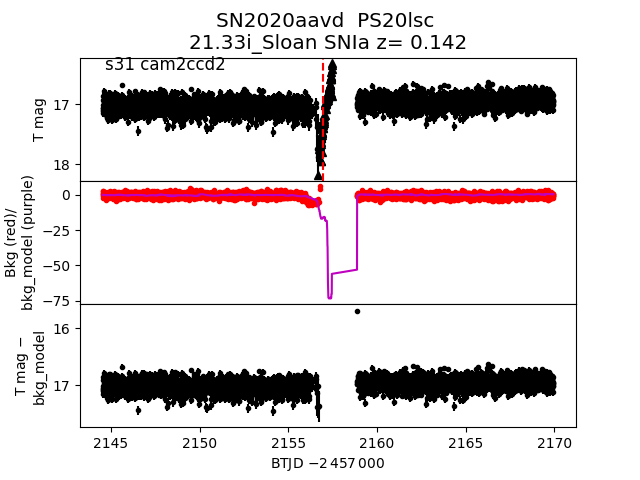
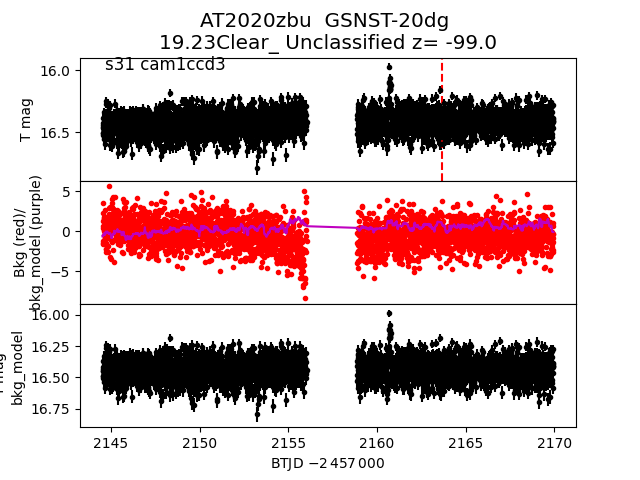
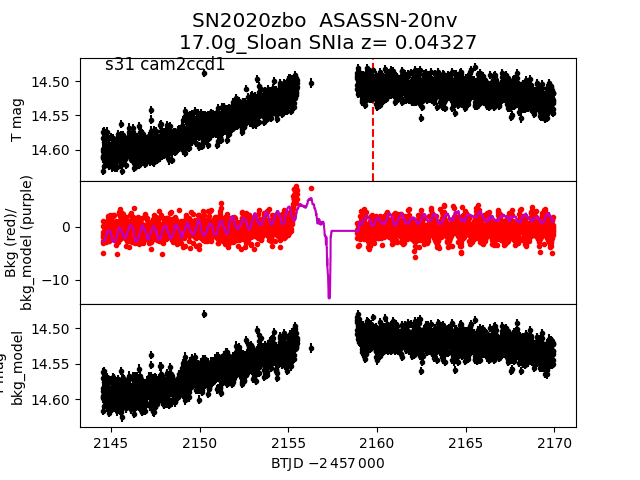
Each figure has three panels. The top panel shows the transient light curve, the middle panel shows the local background (estimated in an annulus), and the bottom panel shows a "background-model corrected" light curve. Details about the background model are in the README.
The vertical red line marks the time of discovery reported to TNS. Other useful metadata from TNS is in the figure title.
Note that the top and bottom panel are in magnitudes, while the middle panel is in differential flux units. The magnitudes are calibrated to the flux in the reference image used for image subtraction. Thus, flux from the host galaxy is included in these magnitudes.
3-sigma upper limits are plotted as triangles with no errorbars. A typical limiting magnitude is 19.6 in 30 minutes or 18.4 in 200 seconds (for low backgrounds).
The links allow you to download the light curve data as a text file.
More details in the README.
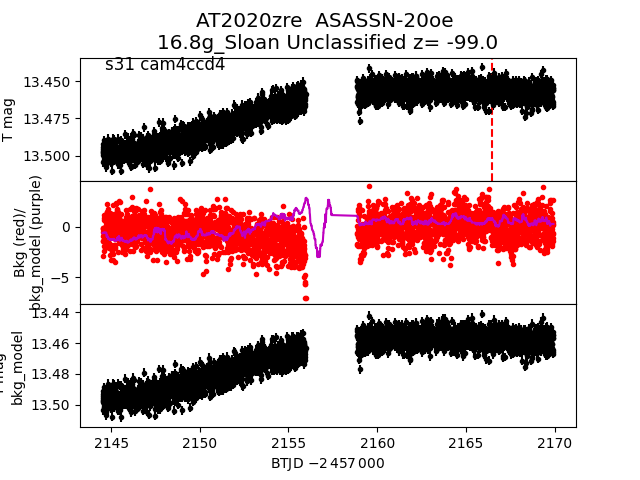
2020zre
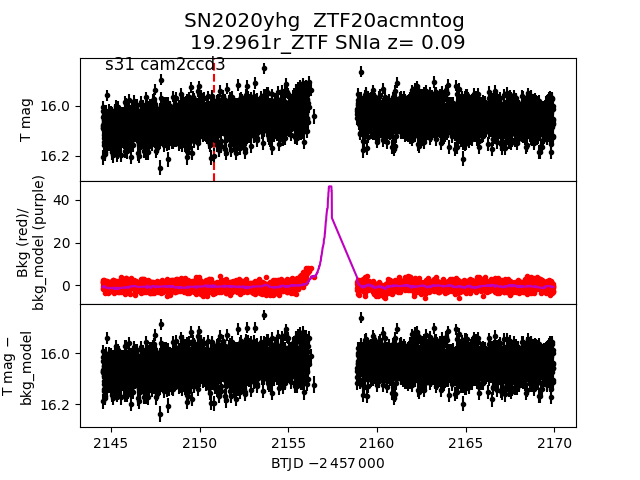
 2020yhg
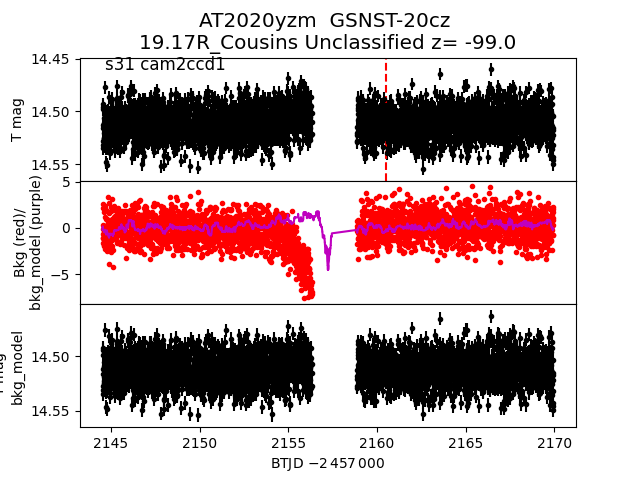
 2020yzm
 2020ymv
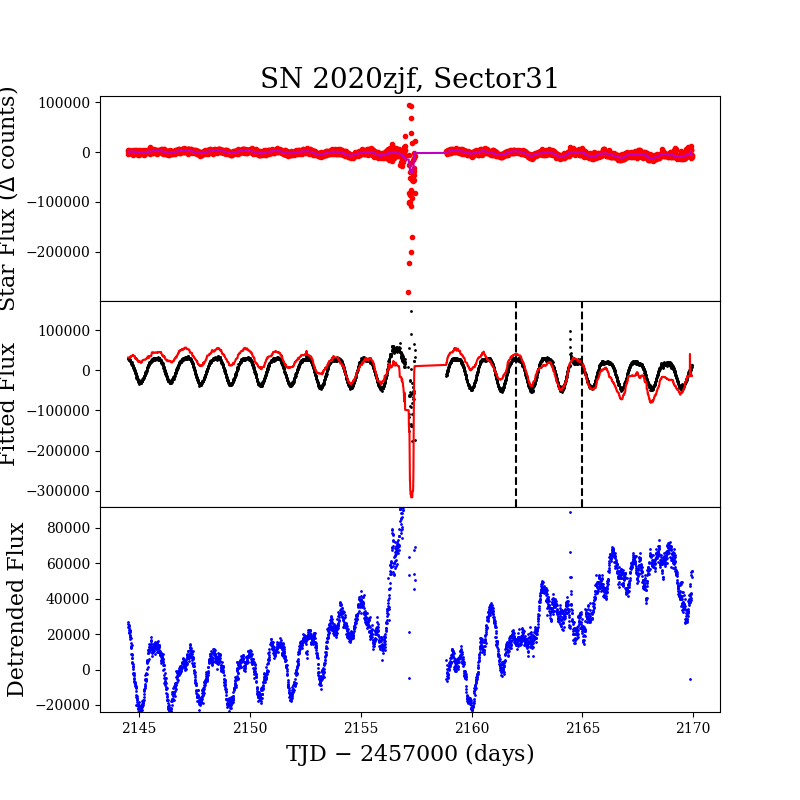
 2020zjf
 2020xyw
 2020zbr
 2020yzw
 2020zbg
 2020zbq
 2020yxl
 2020zjf
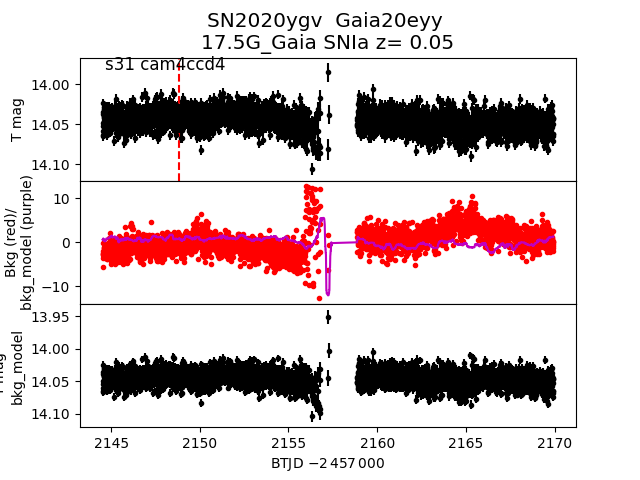
 2020ygv
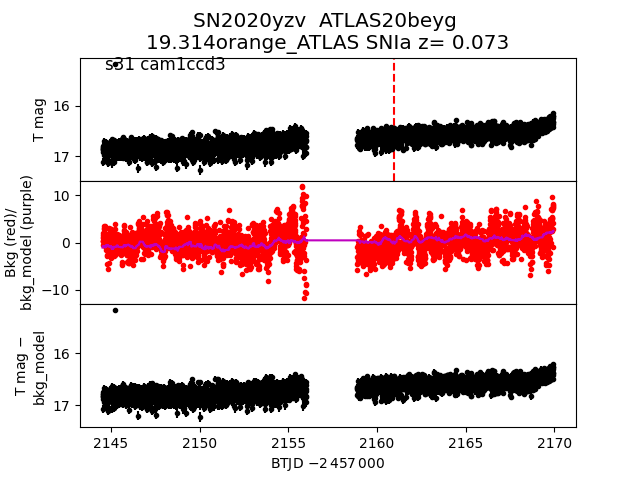
 2020yzv
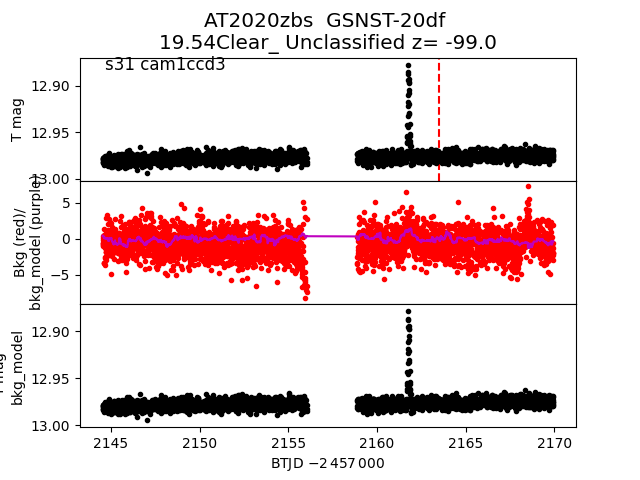
 2020zbs
 2020zqo
 2020zbv
 2020yzo
 2020zpi
 2020yef
 2020aajf
 2020aavd
 2020zbu
 2020zbo
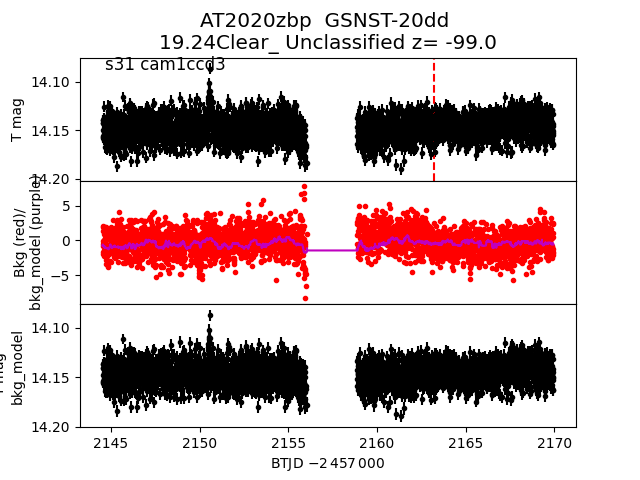
 2020zbp
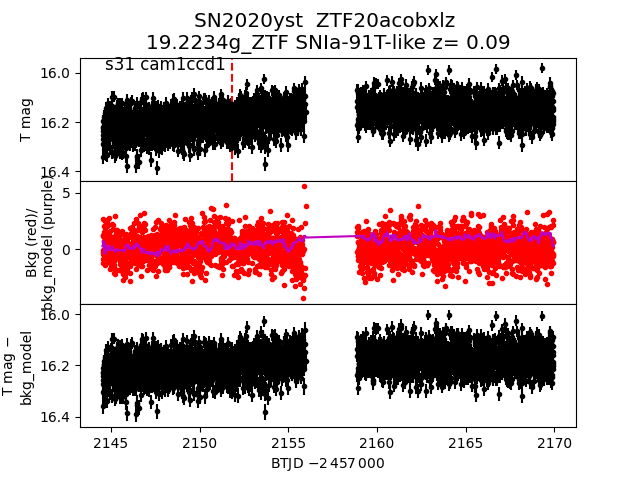
 2020yst
 2020ykb