all transients in sector31 (102 total)
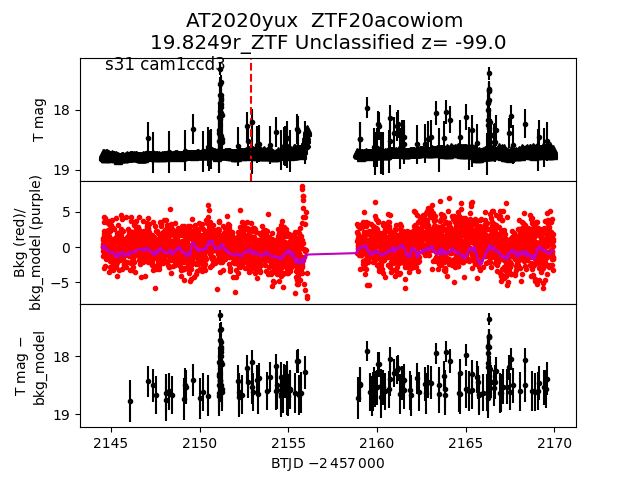
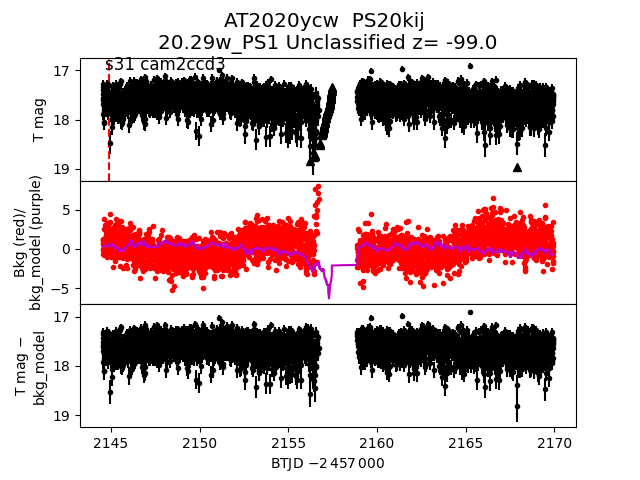
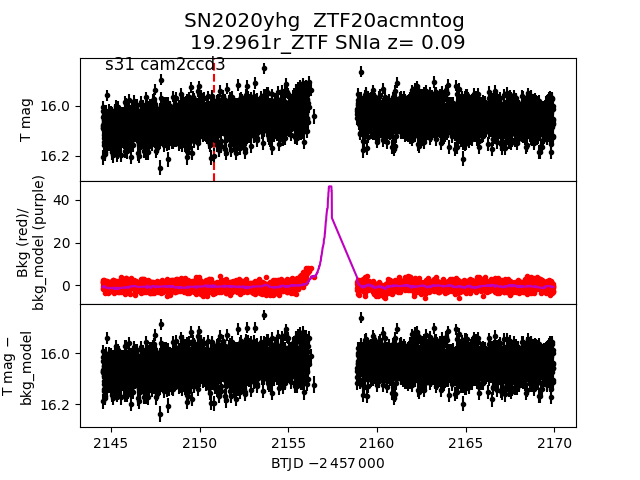
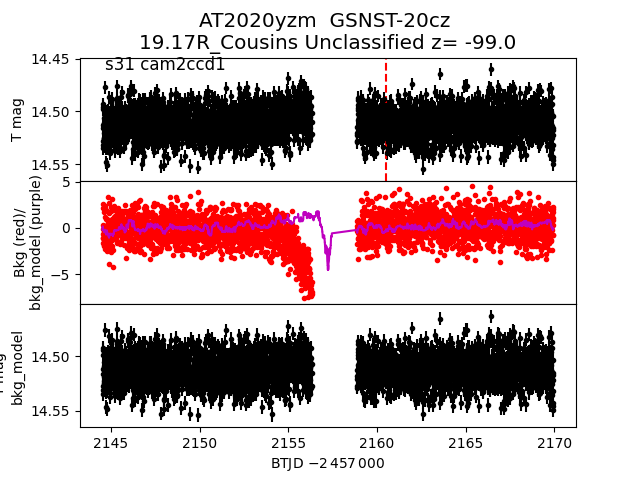
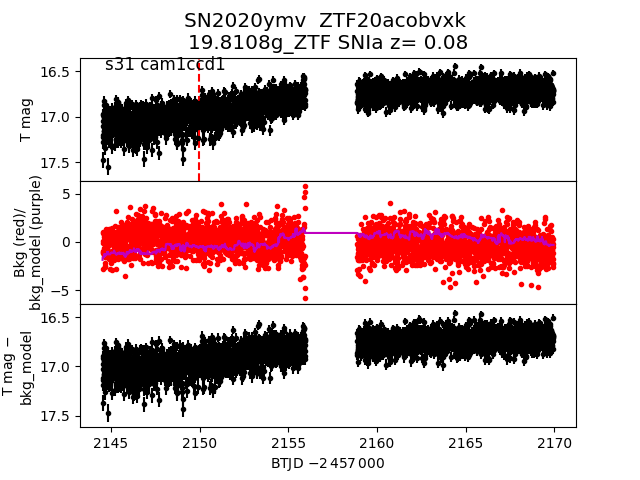
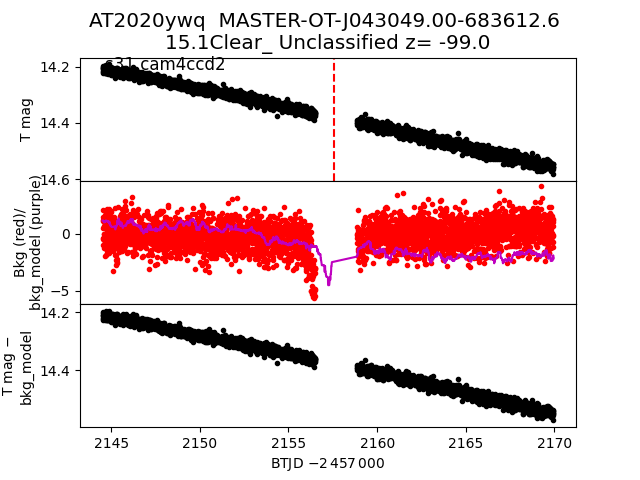
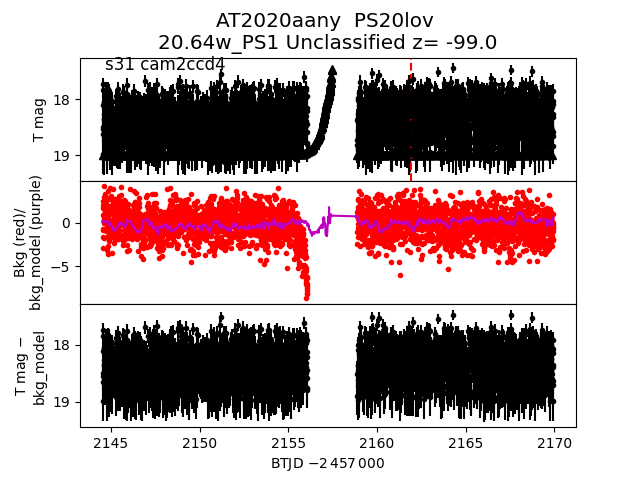
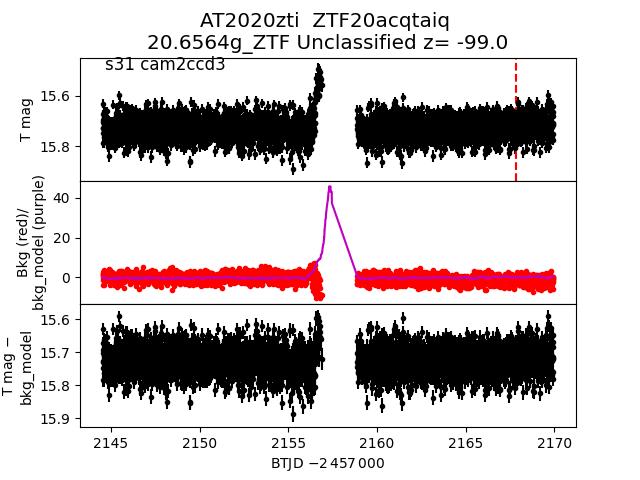
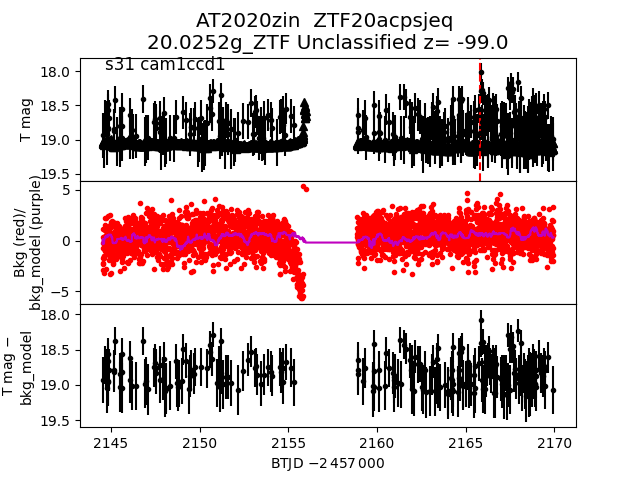
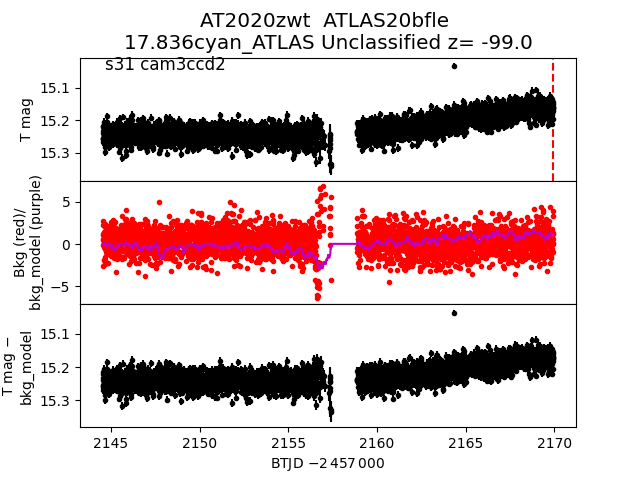
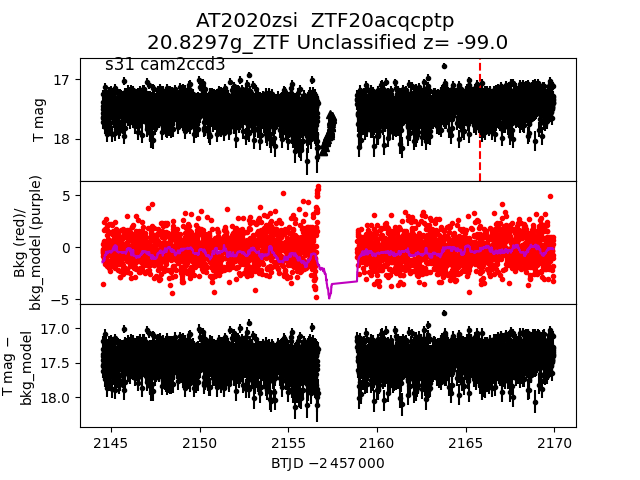
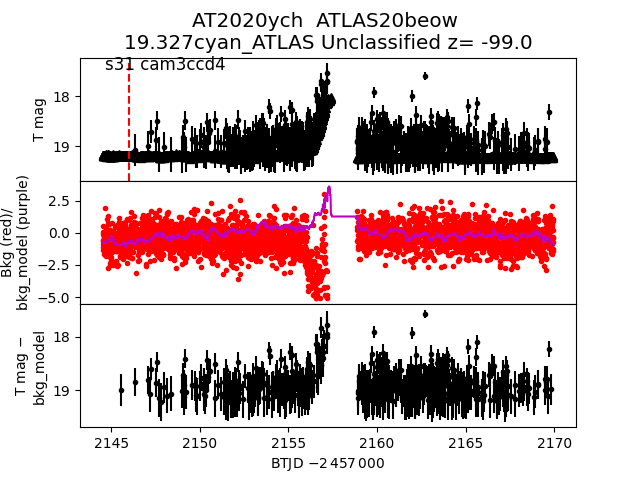
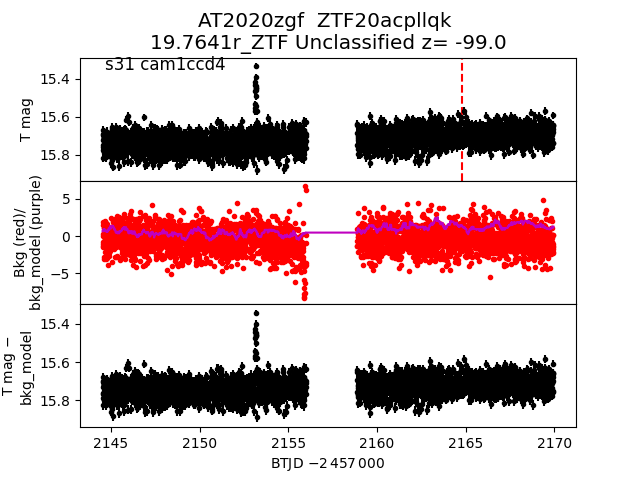
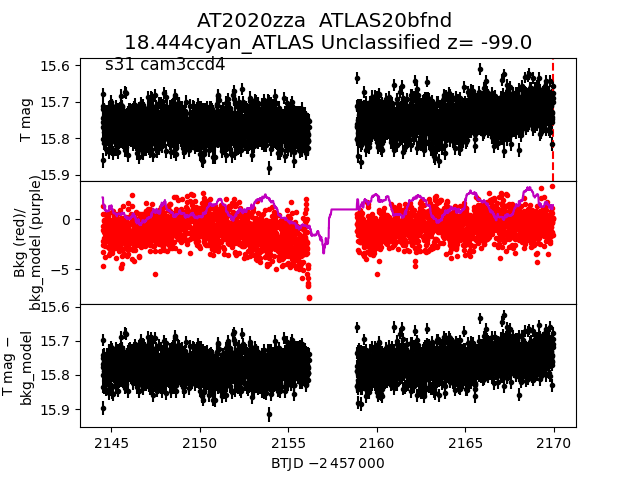
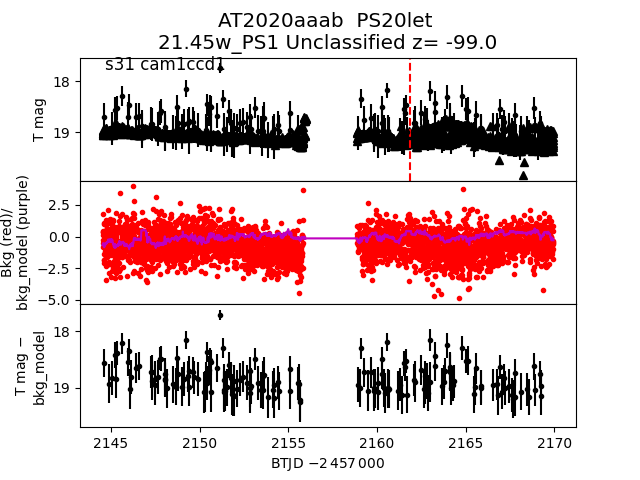
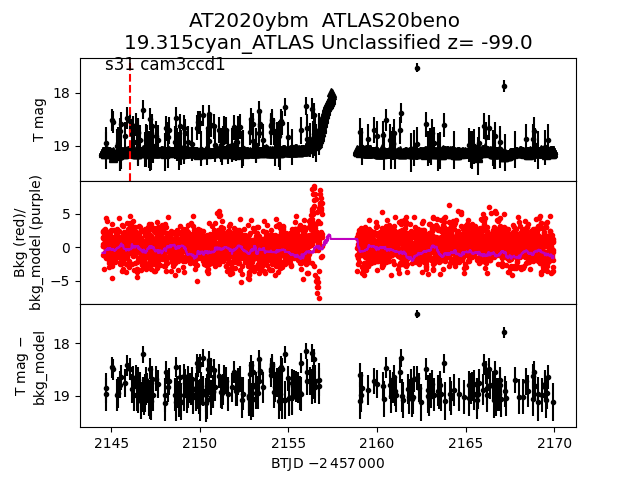
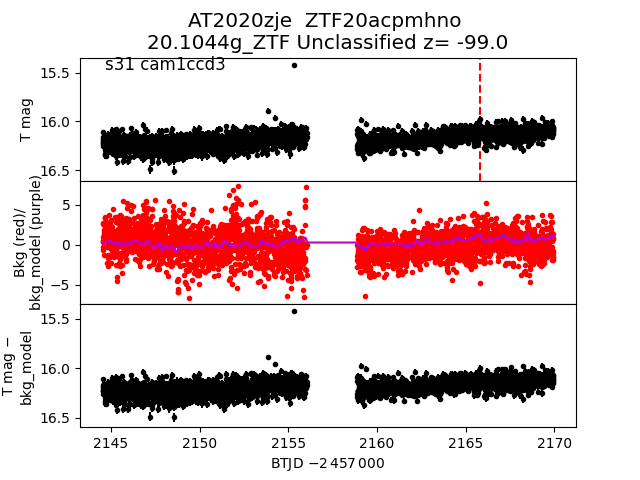
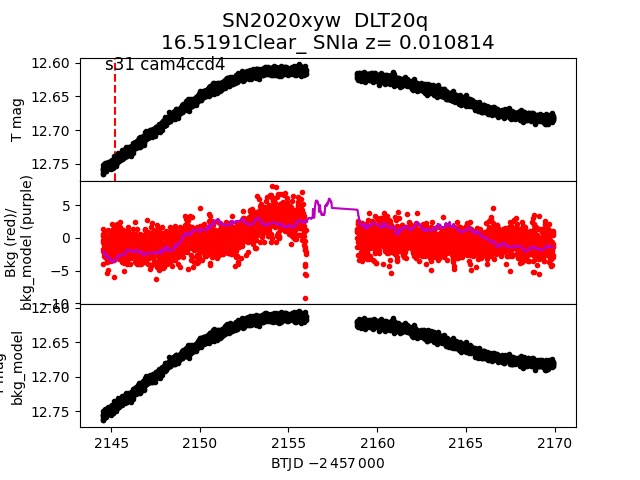
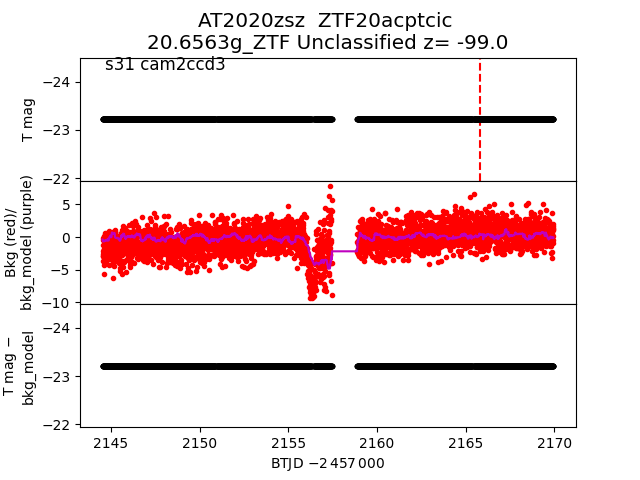
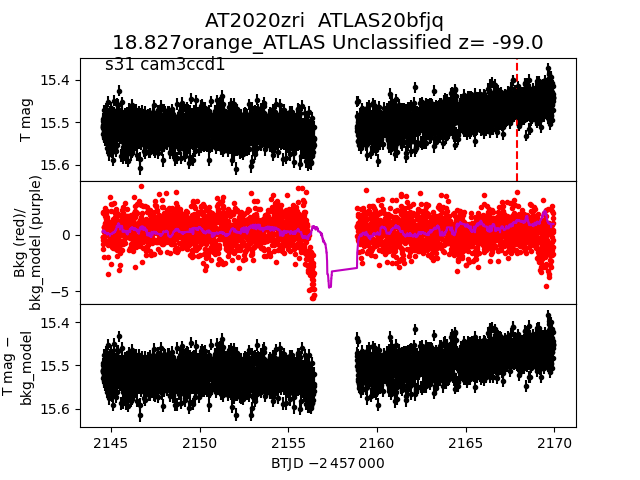
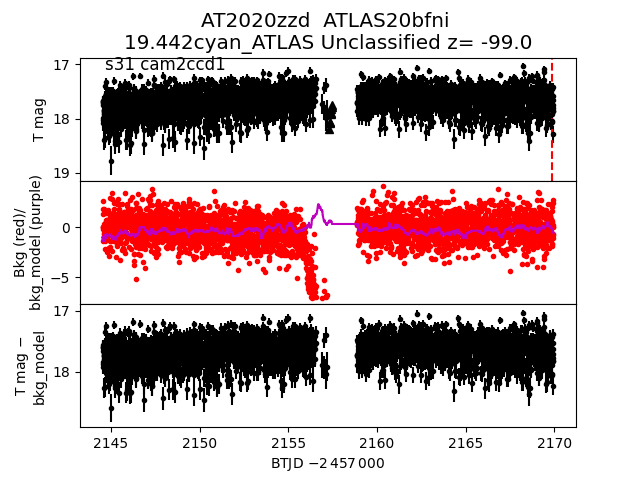
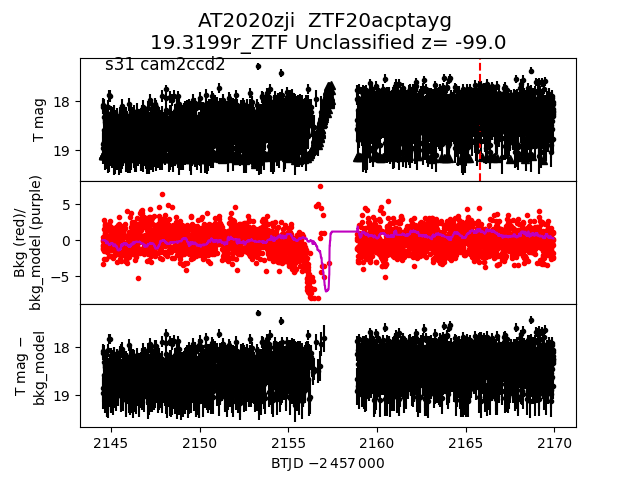
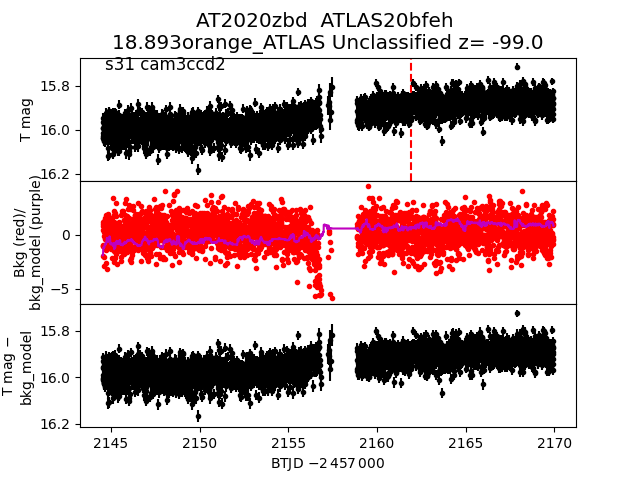
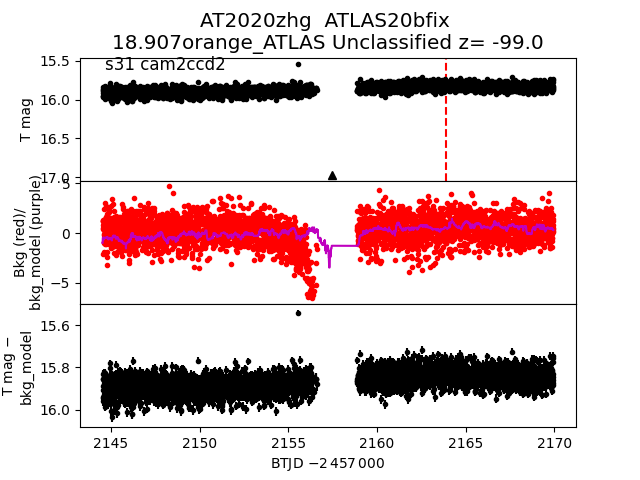
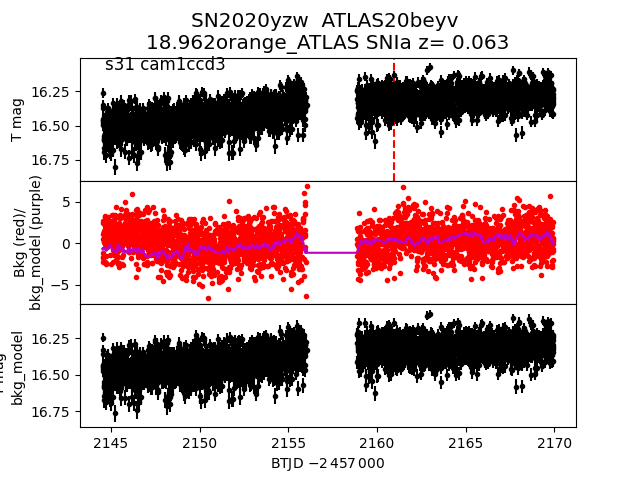
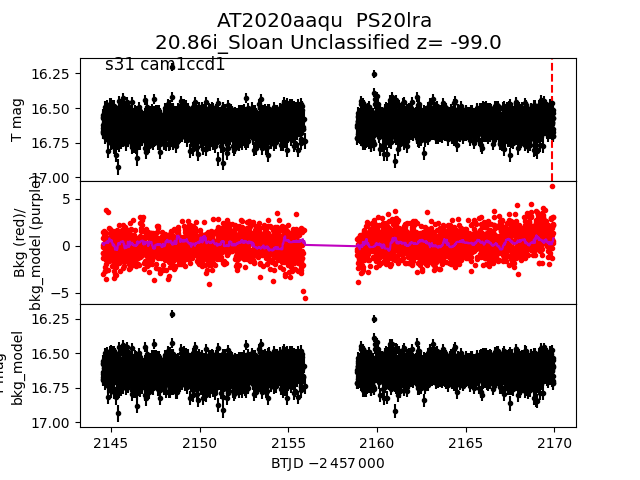
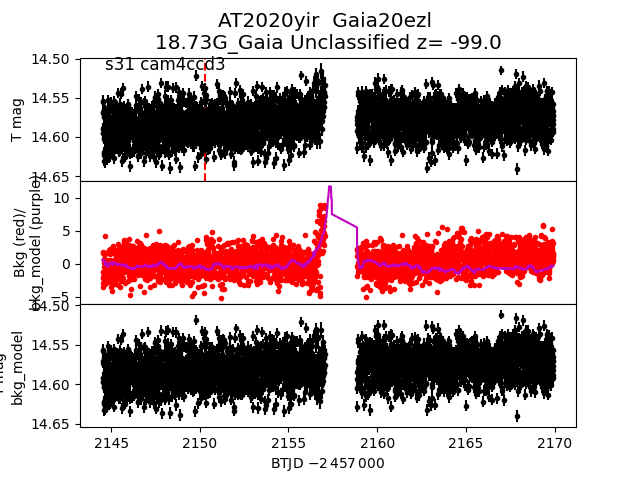
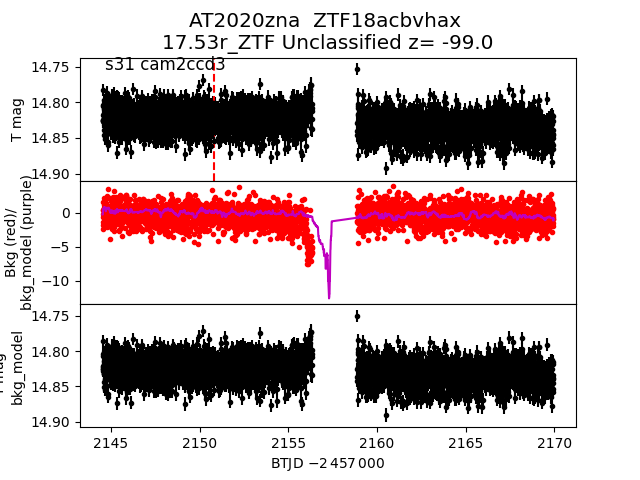
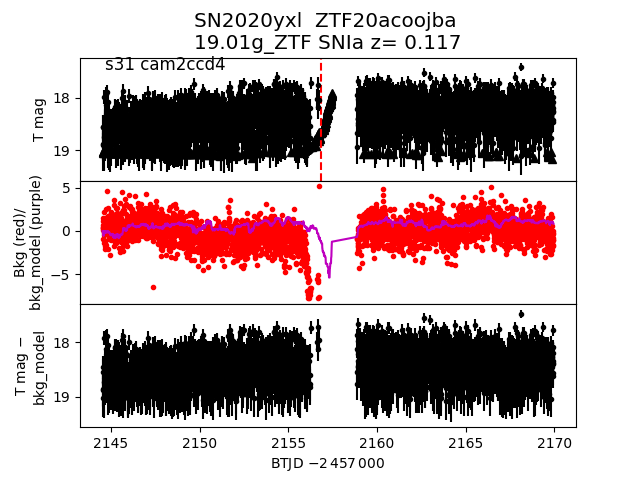
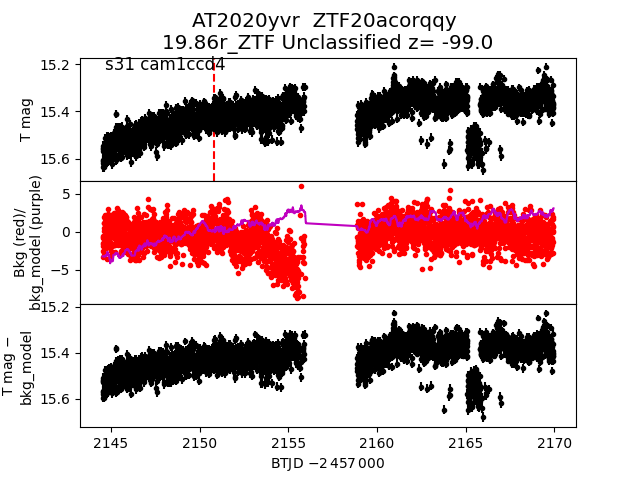
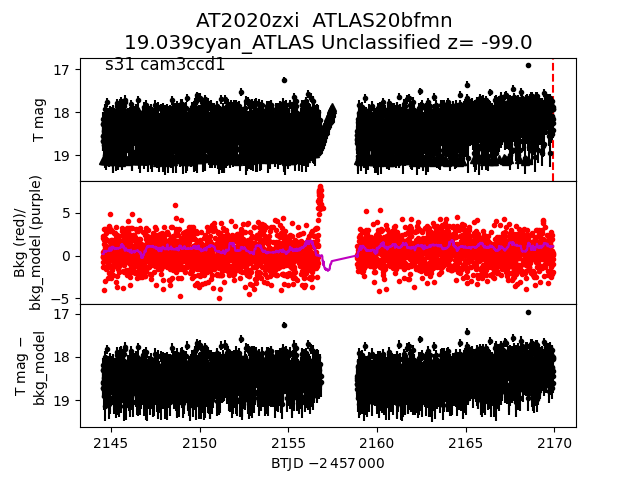
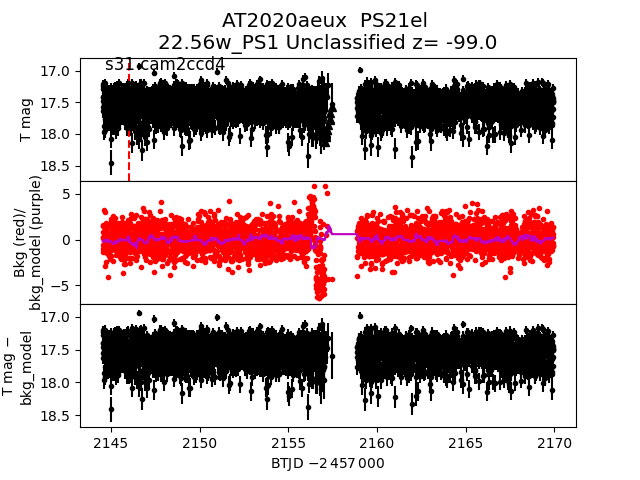
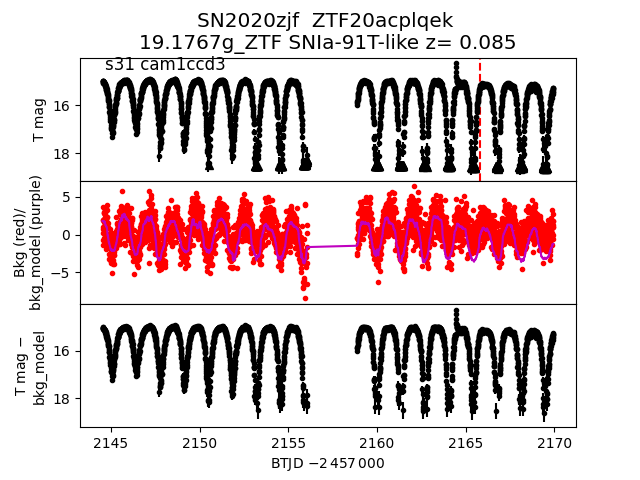
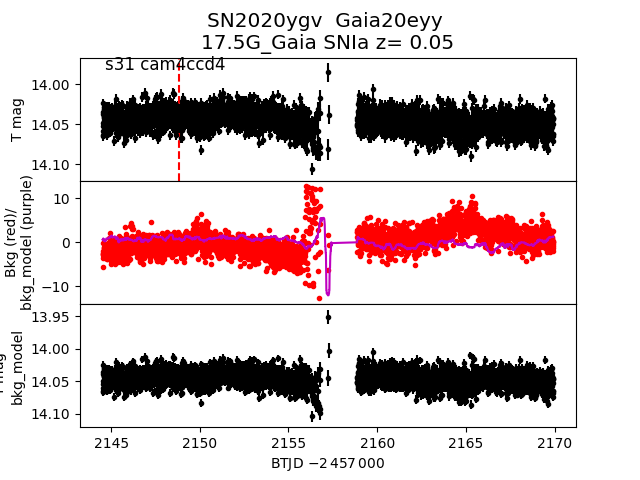
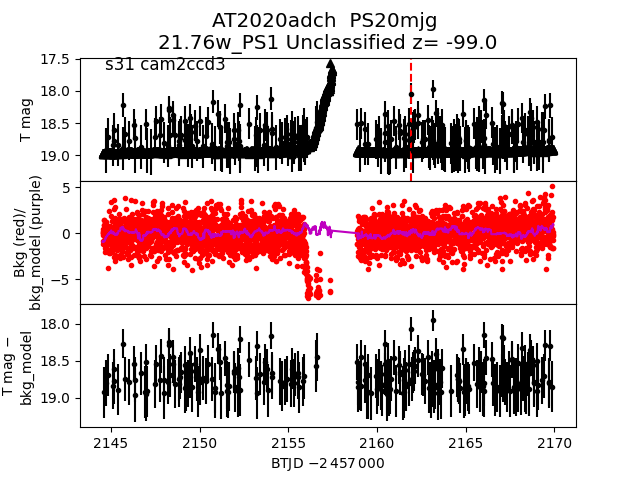
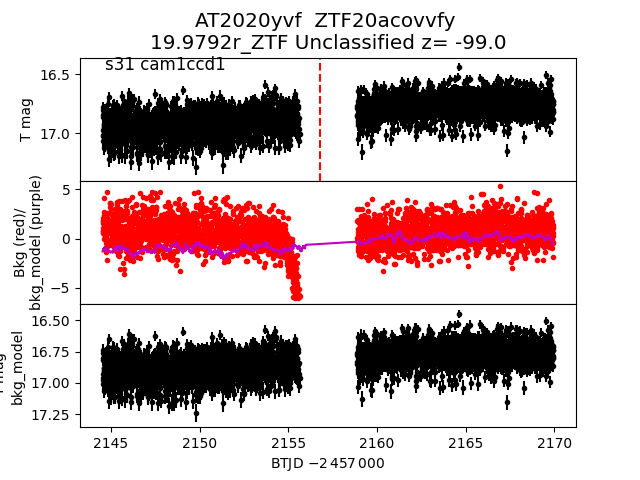
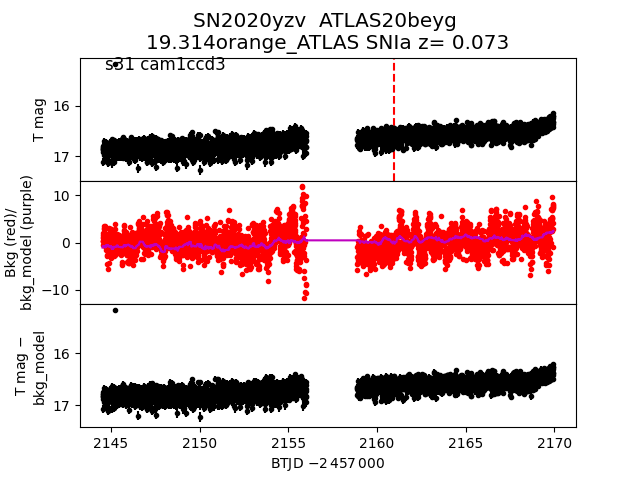
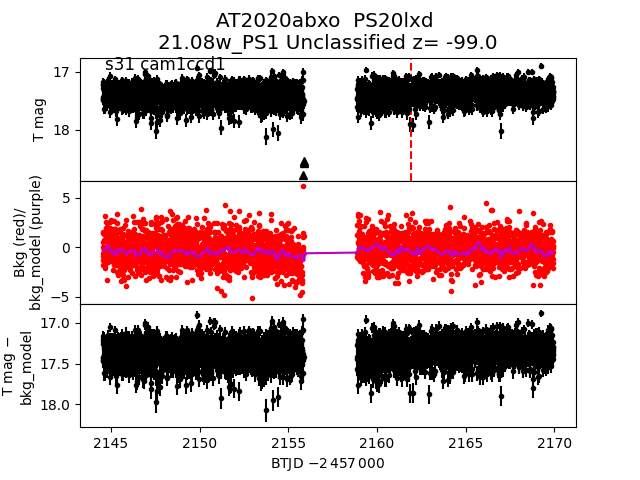
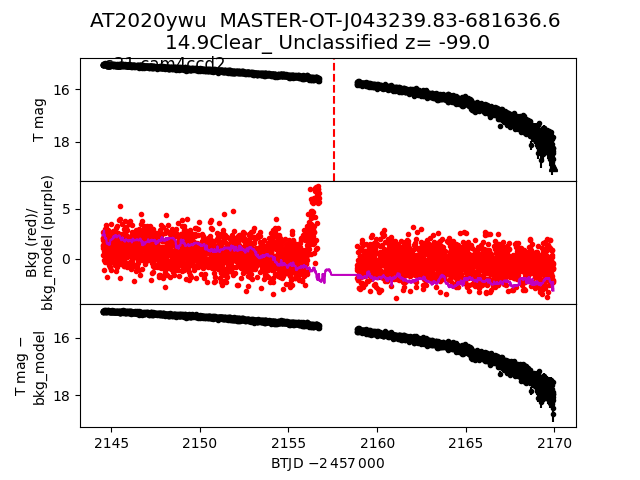
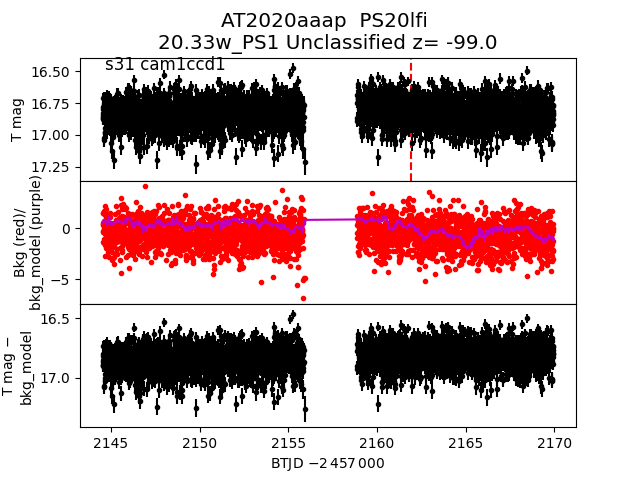
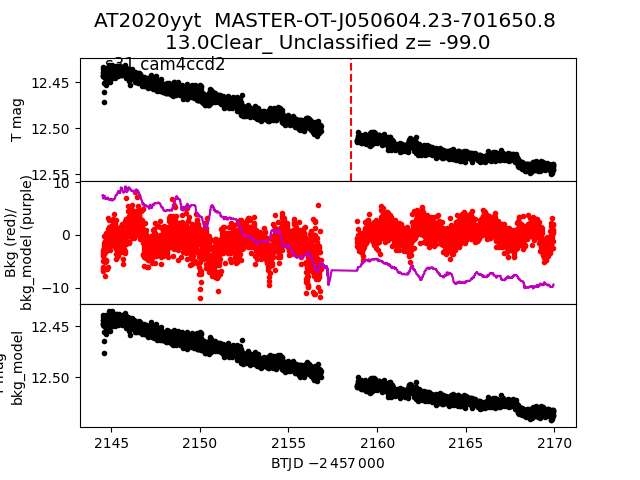
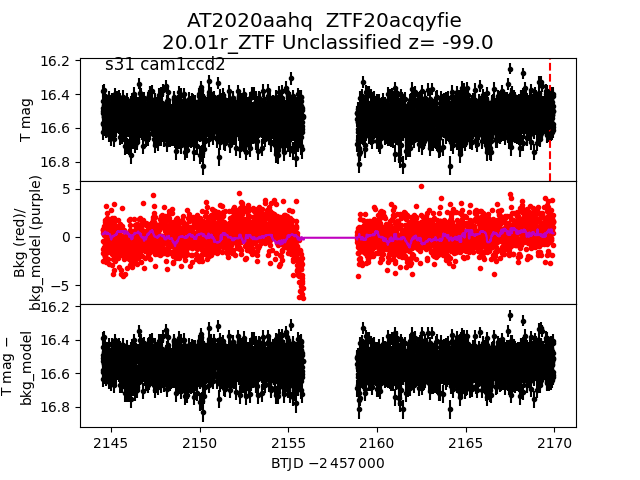
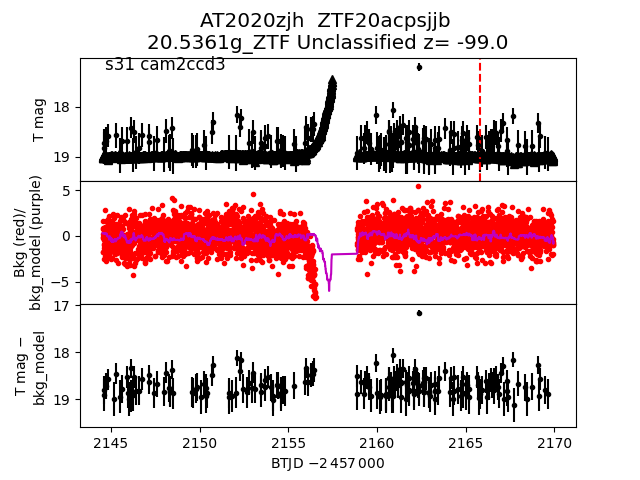
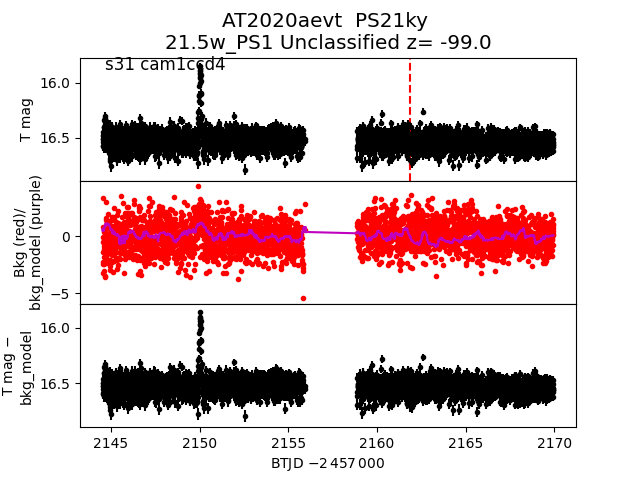
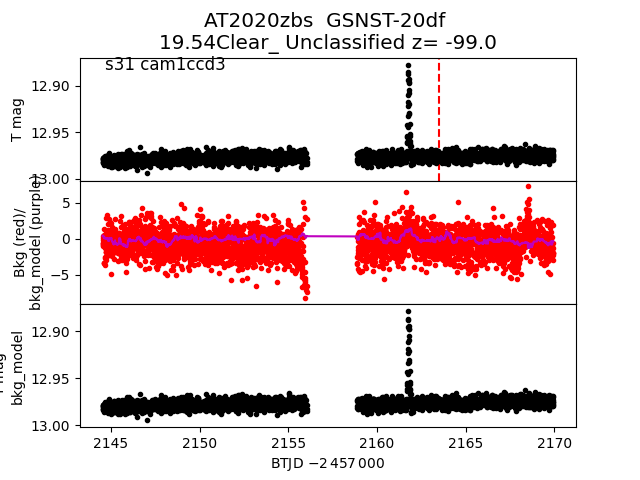
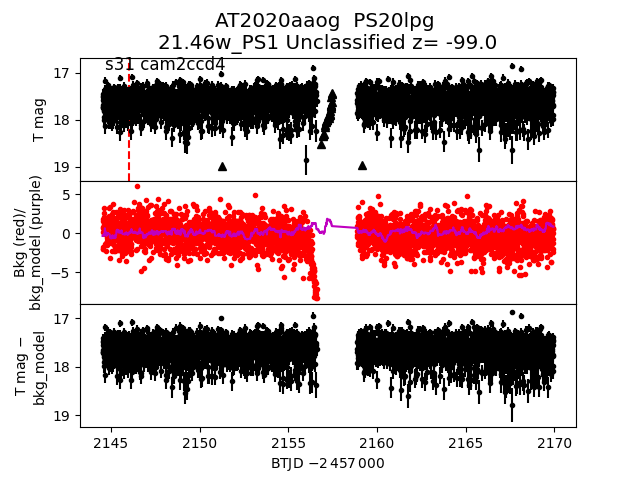
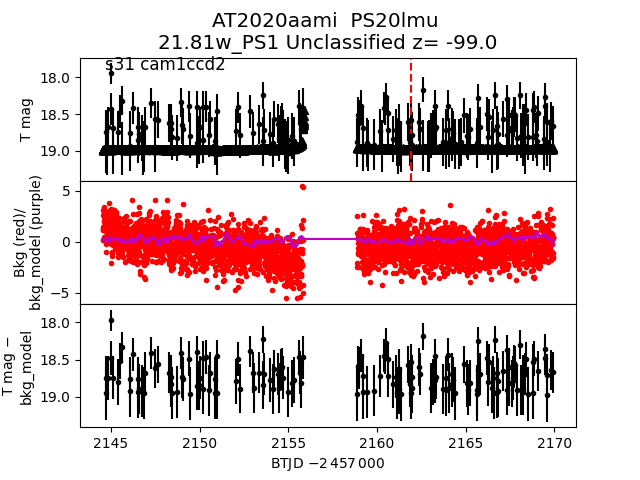
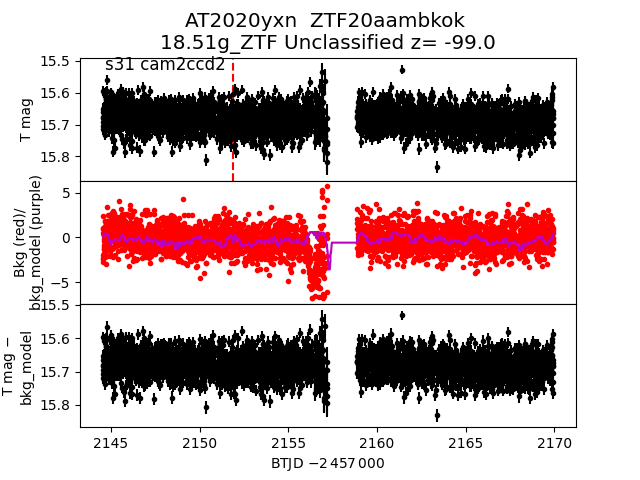
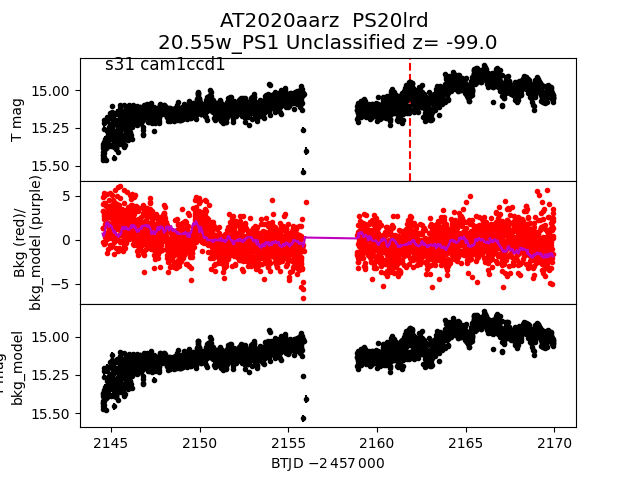
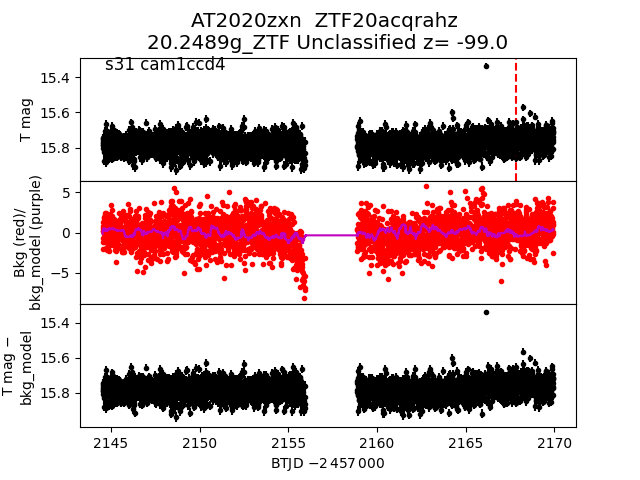
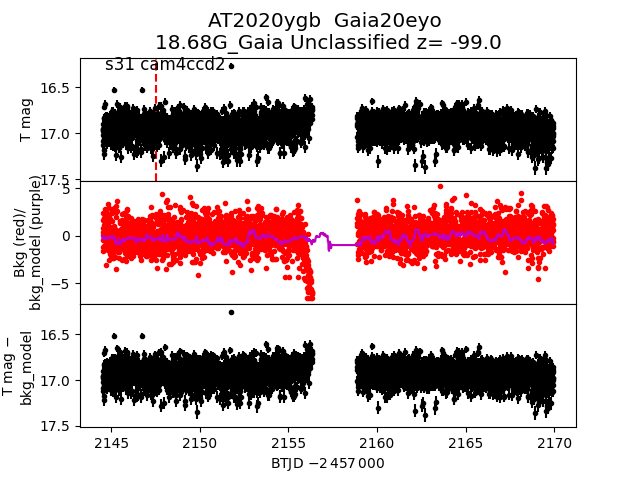
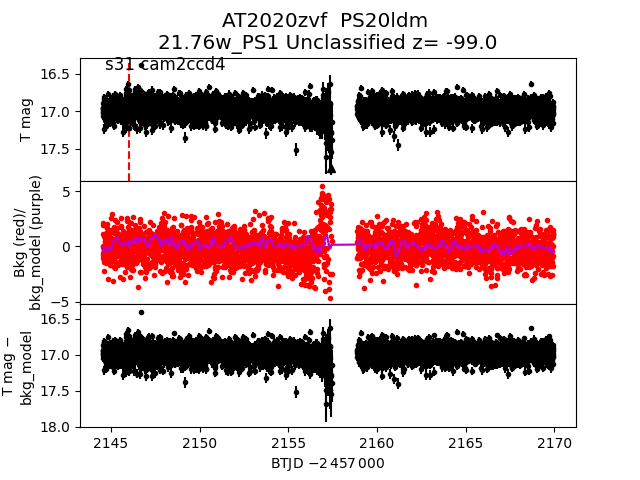
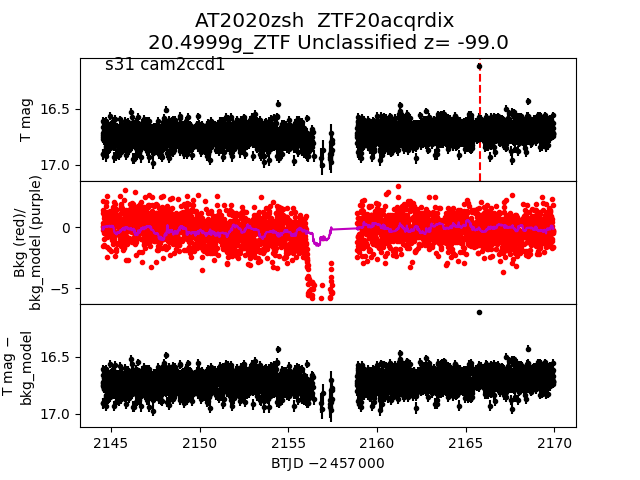
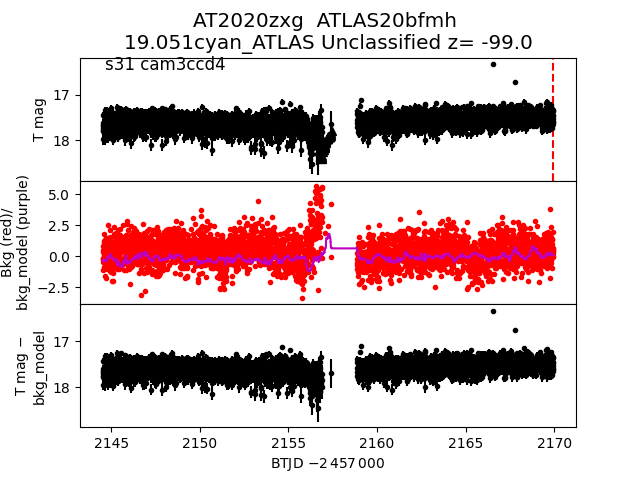
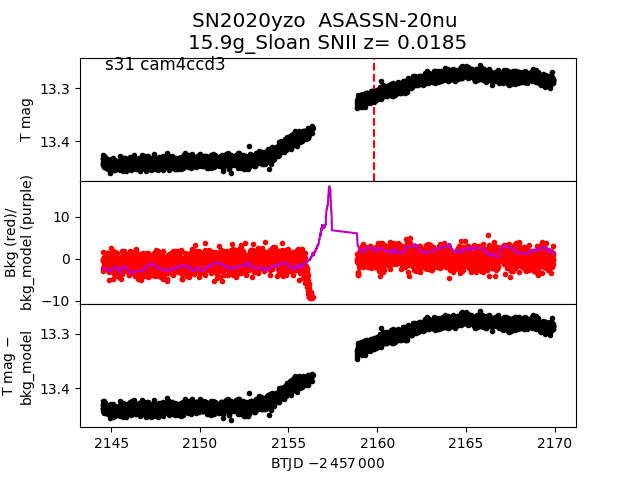
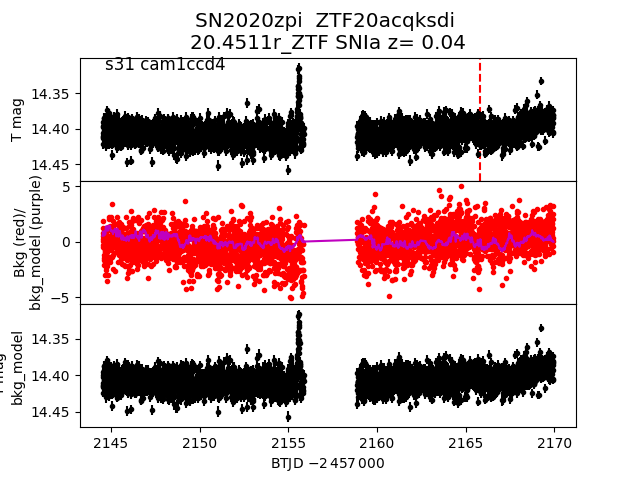
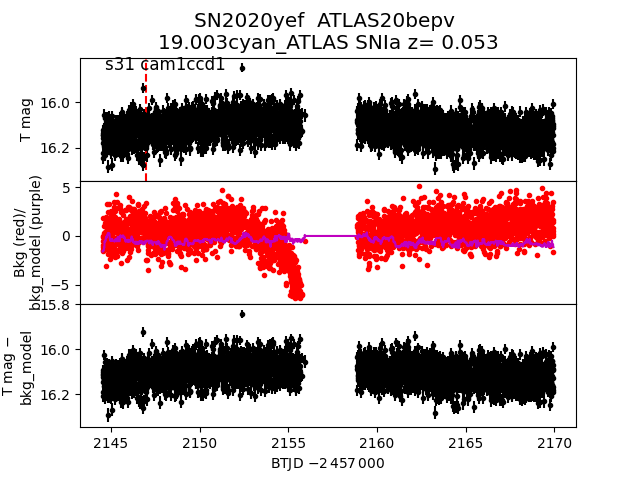
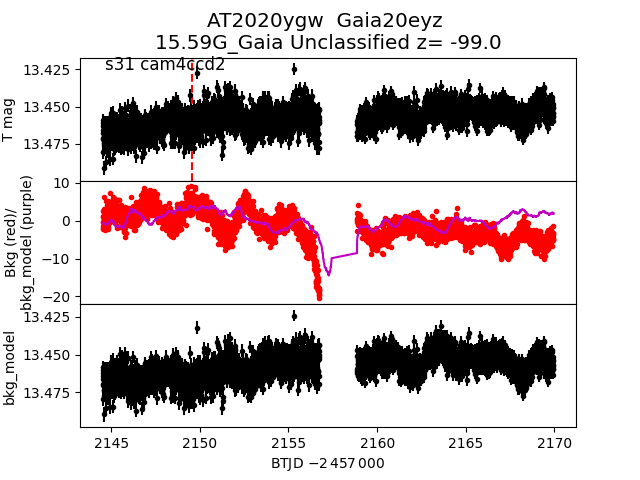
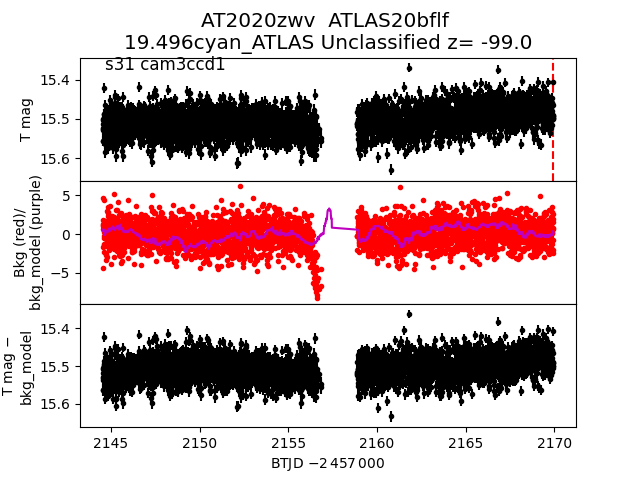
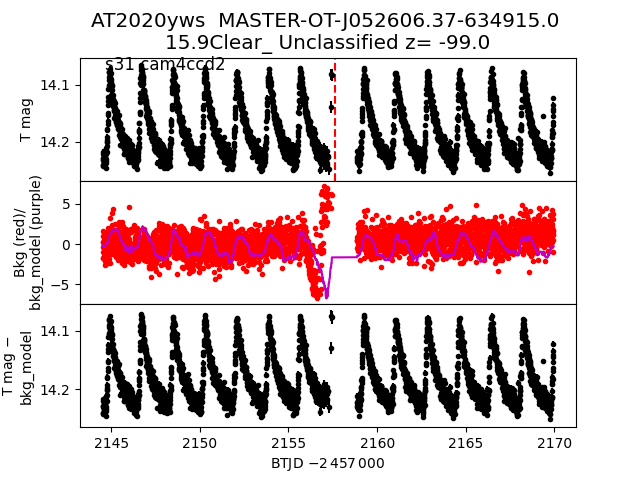
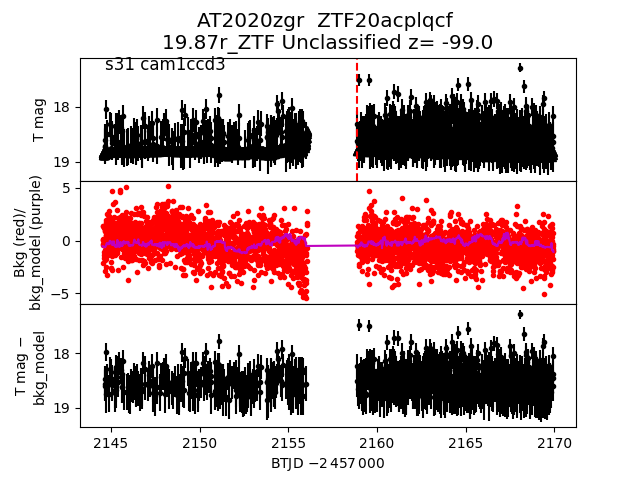
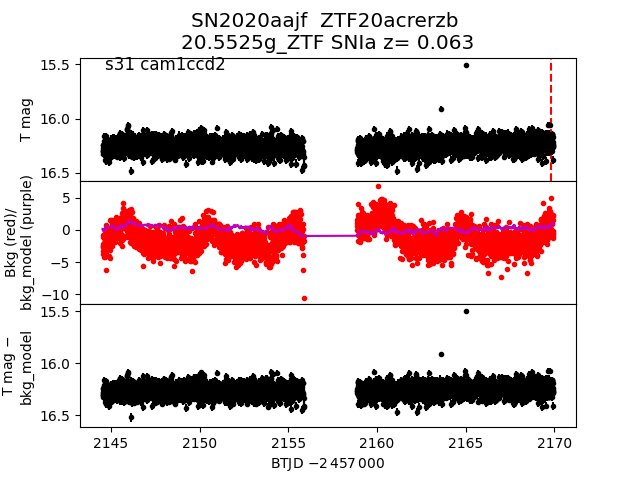
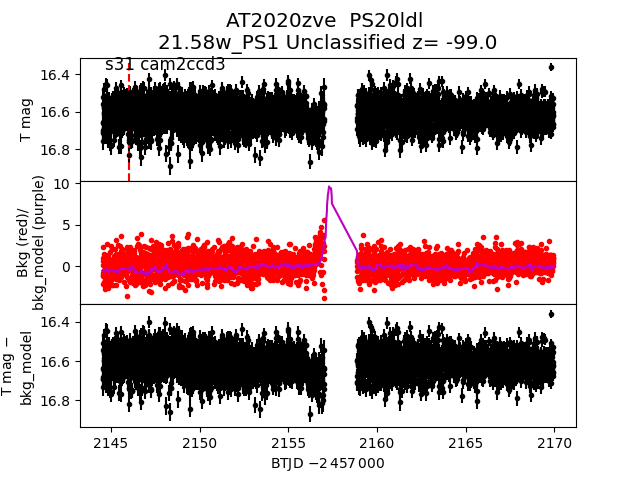
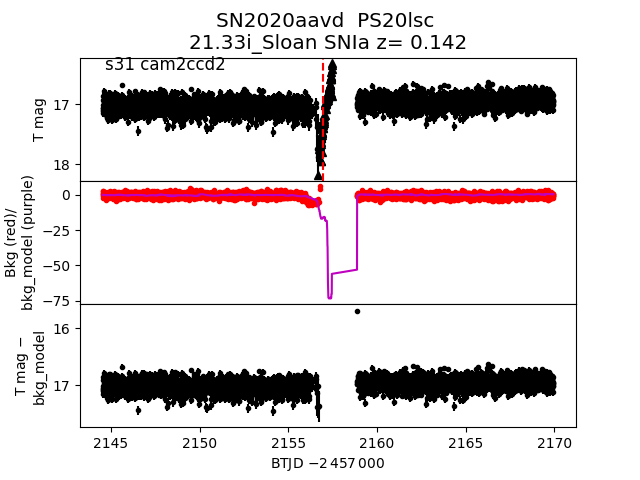
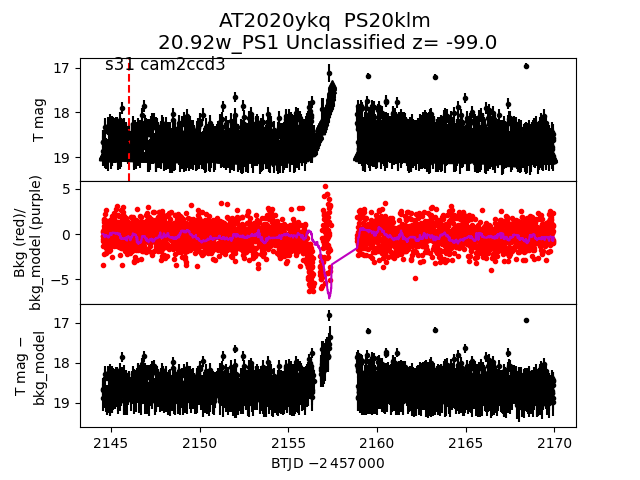
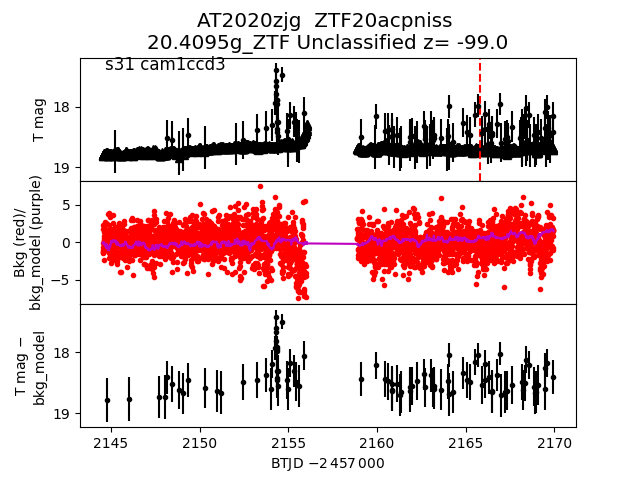
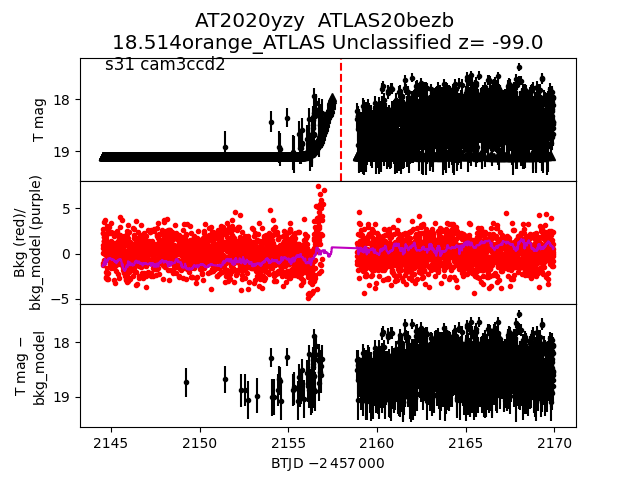
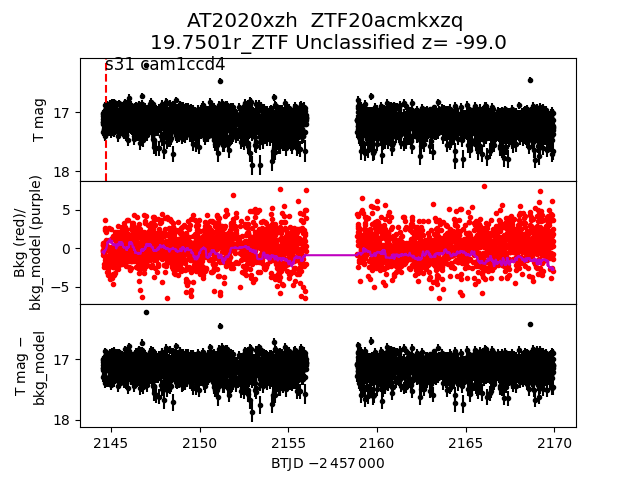
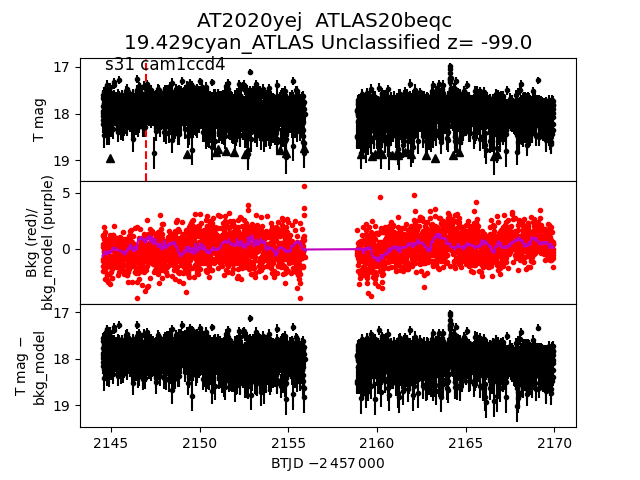
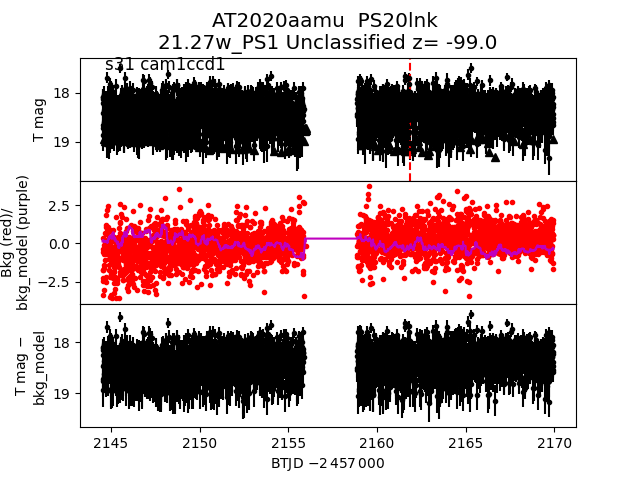
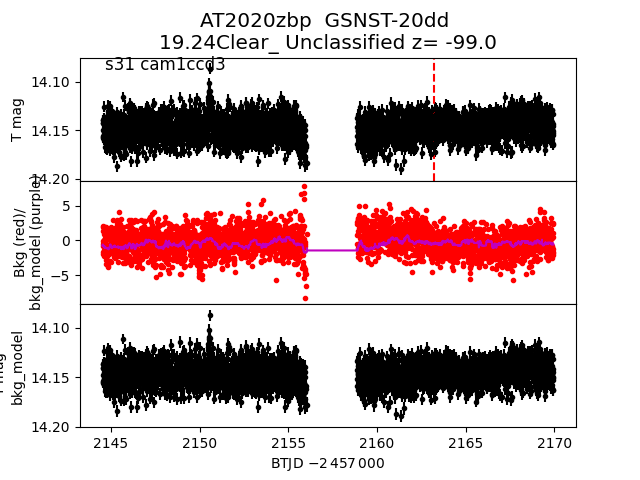
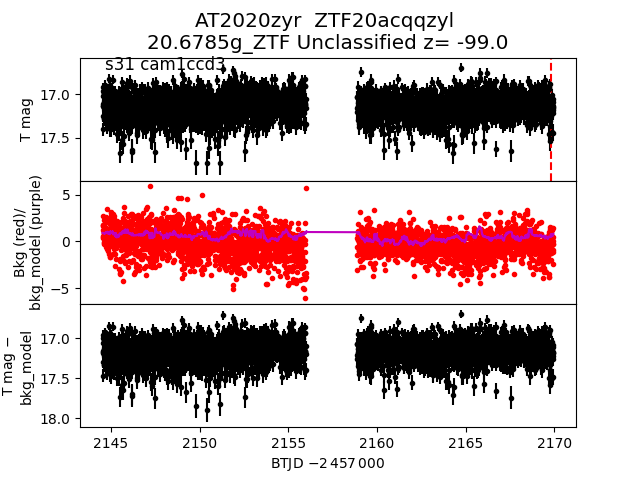
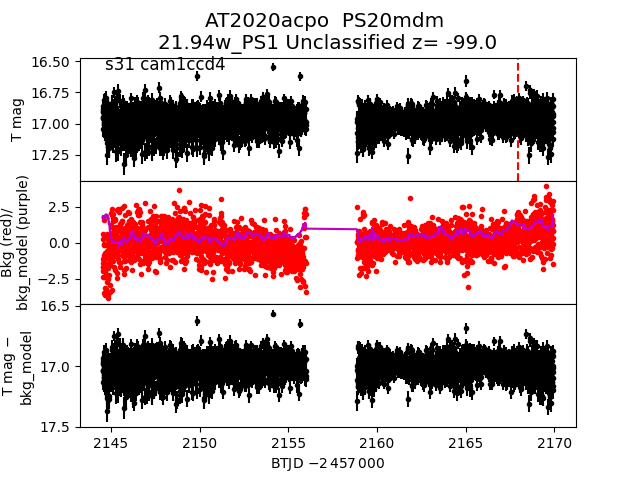
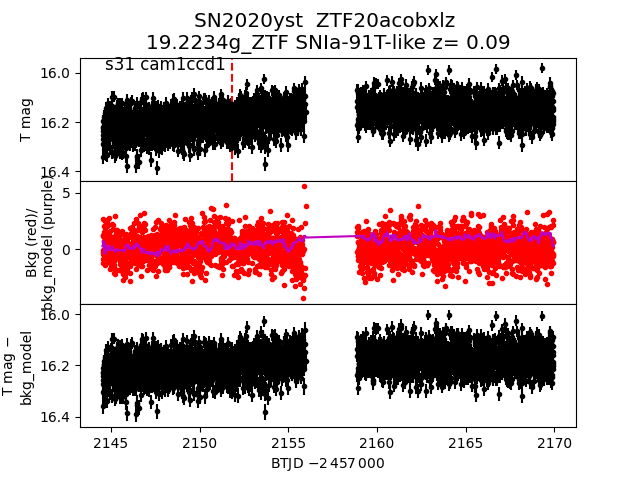
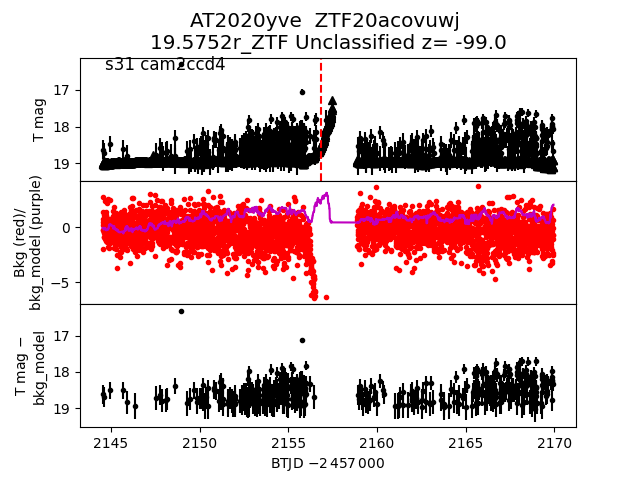
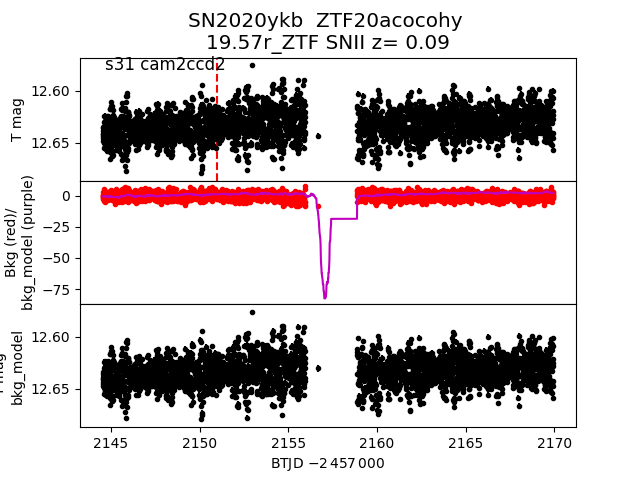
Each figure has three panels. The top panel shows the transient light curve, the middle panel shows the local background (estimated in an annulus), and the bottom panel shows a "background-model corrected" light curve. Details about the background model are in the README.
The vertical red line marks the time of discovery reported to TNS. Other useful metadata from TNS is in the figure title.
Note that the top and bottom panel are in magnitudes, while the middle panel is in differential flux units. The magnitudes are calibrated to the flux in the reference image used for image subtraction. Thus, flux from the host galaxy is included in these magnitudes.
3-sigma upper limits are plotted as triangles with no errorbars. A typical limiting magnitude is 19.6 in 30 minutes or 18.4 in 200 seconds (for low backgrounds).
The links allow you to download the light curve data as a text file.
More details in the README.
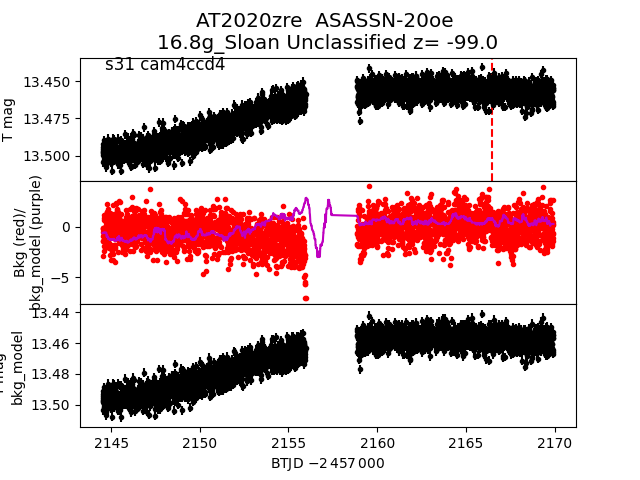
2020zre
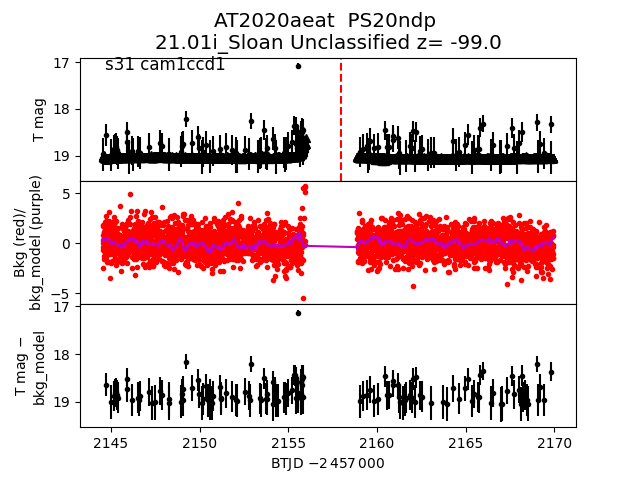
 2020aeat
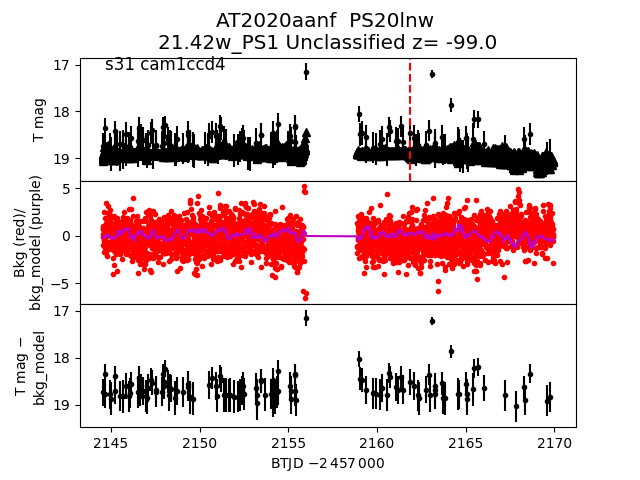
 2020aanf
 2020ycw
 2020yhg
 2020yzm
 2020ymv
 2020ywq
 2020aany
 2020zti
 2020zin
 2020zwt
 2020zsi
 2020ych
 2020zgf
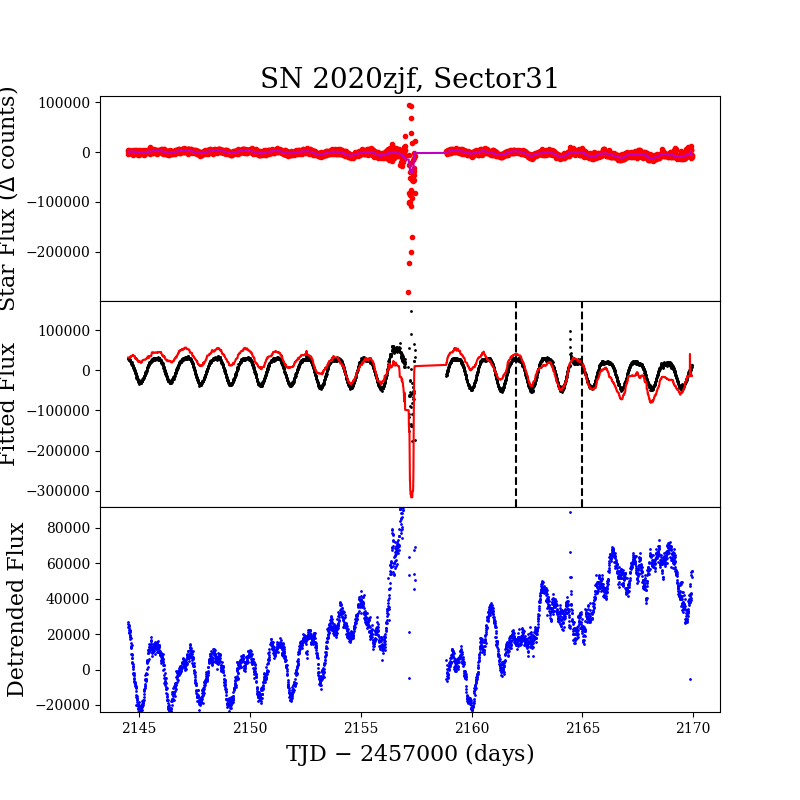
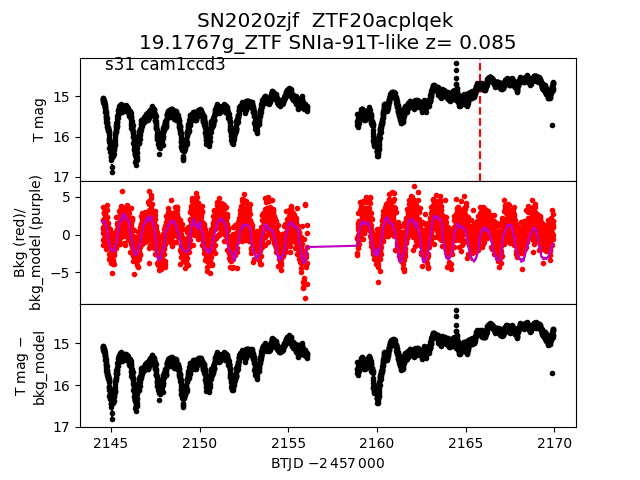
 2020zjf
 2020zza
 2020aaab
 2020ybm
 2020zje
 2020xyw
 2020zsz
 2020zri
 2020zzd
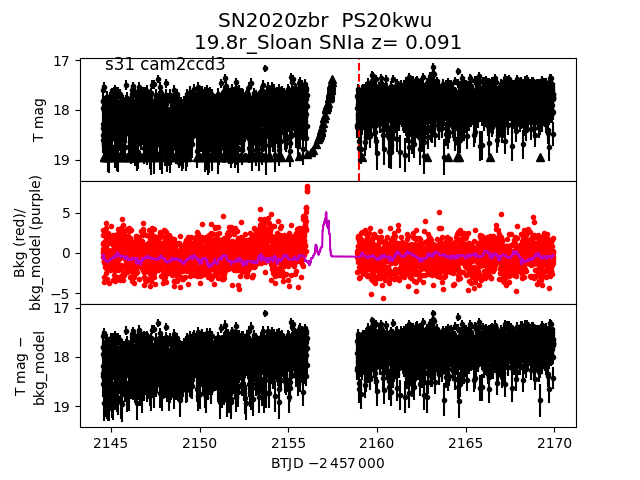
 2020zbr
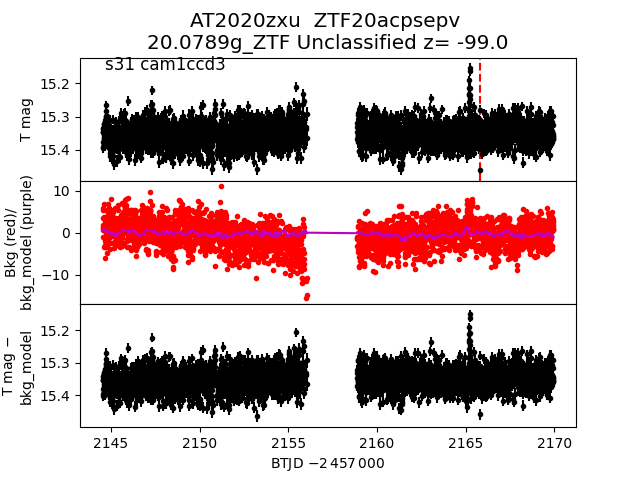
 2020zxu
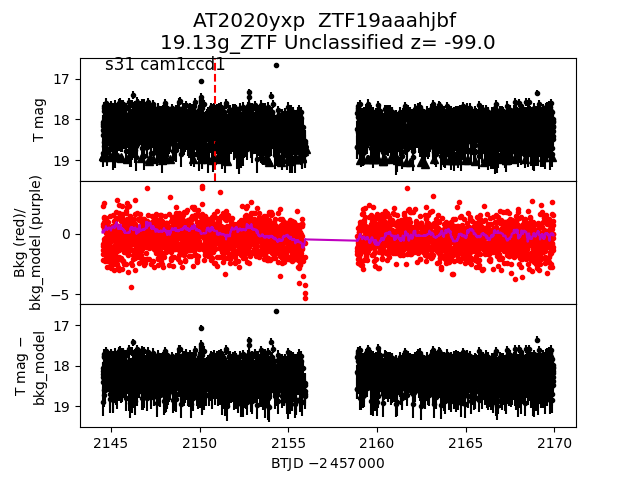
 2020yxp
 2020zji
 2020zbd
 2020zhg
 2020yzw
 2020aaqu
 2020zjf_detrended
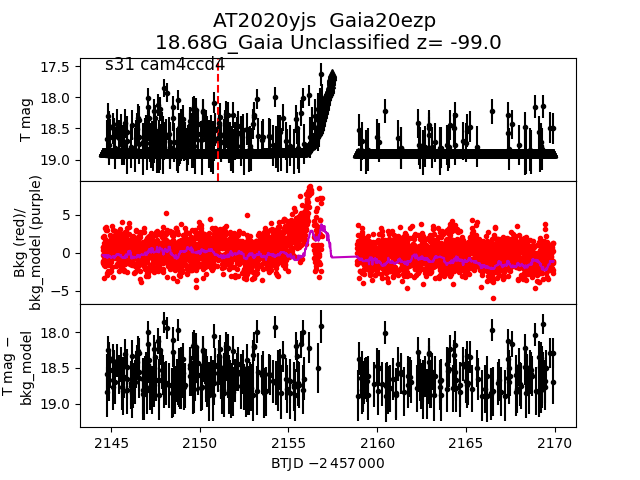
 2020yjs
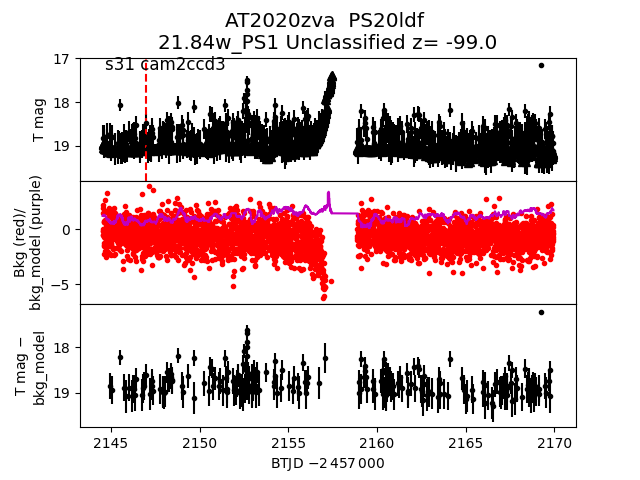
 2020zva
 2020yir
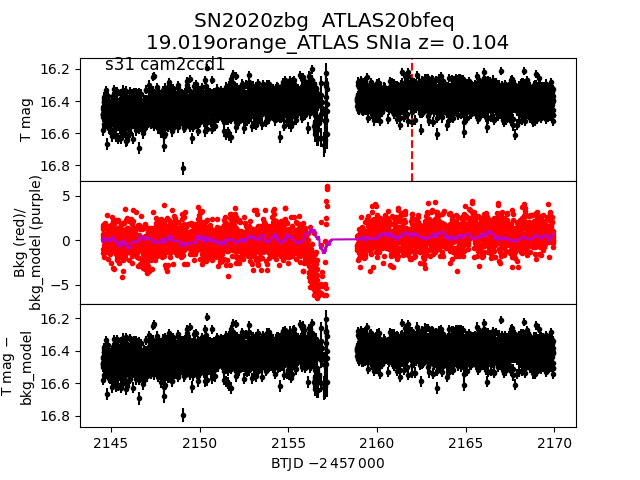
 2020zbg
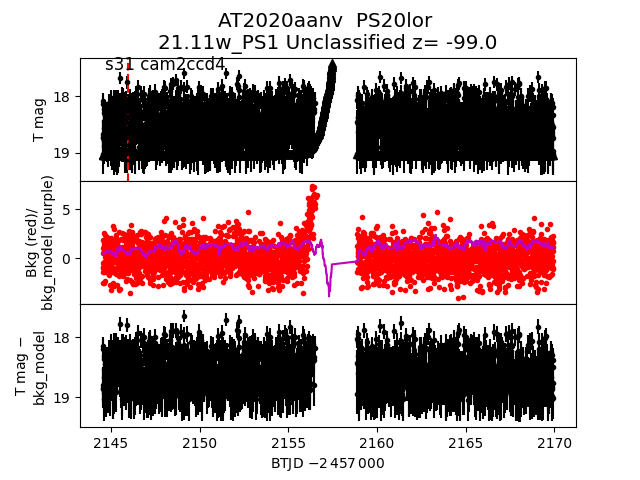
 2020aanv
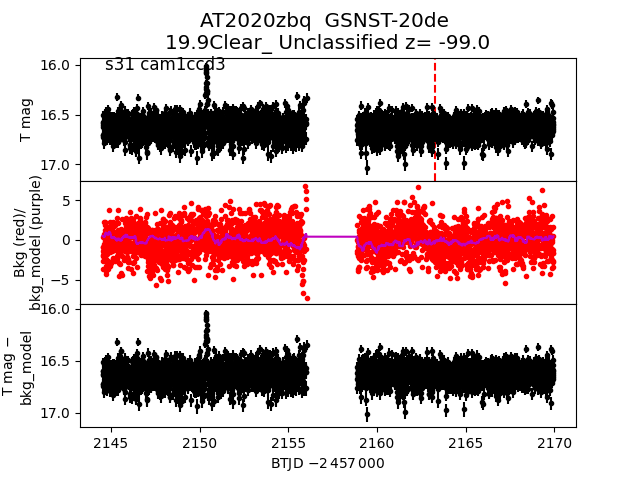
 2020zbq
 2020zna
 2020yxl
 2020yvr
 2020zxi
 2020aeux
 2020zjf
 2020ygv
 2020adch
 2020yvf
 2020yzv
 2020abxo
 2020ywu
 2020aaap
 2020yyt
 2020aahq
 2020zjh
 2020aevt
 2020zbs
 2020aaog
 2020aami
 2020yxn
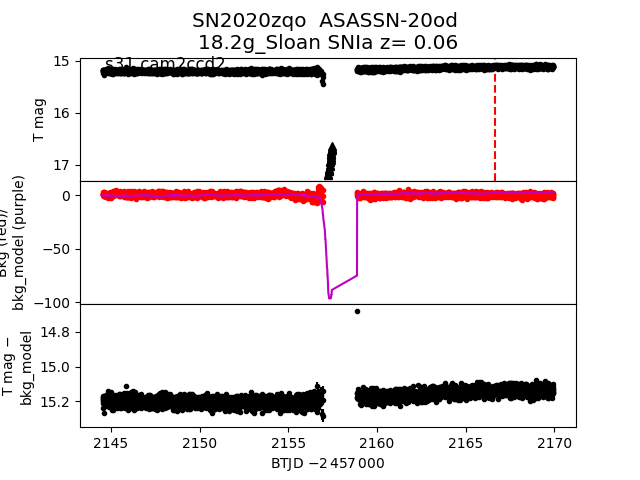
 2020zqo
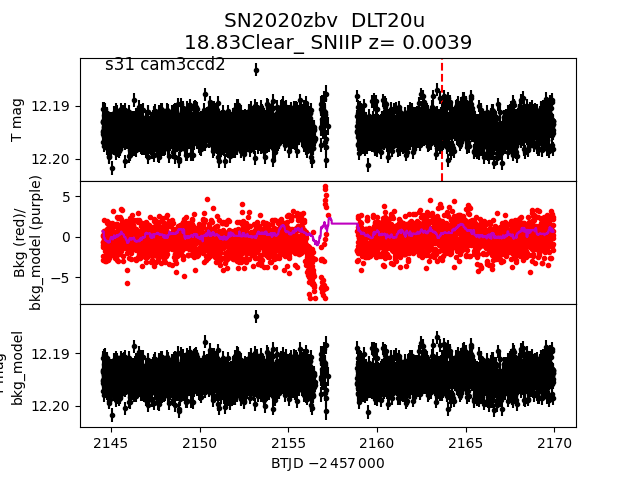
 2020zbv
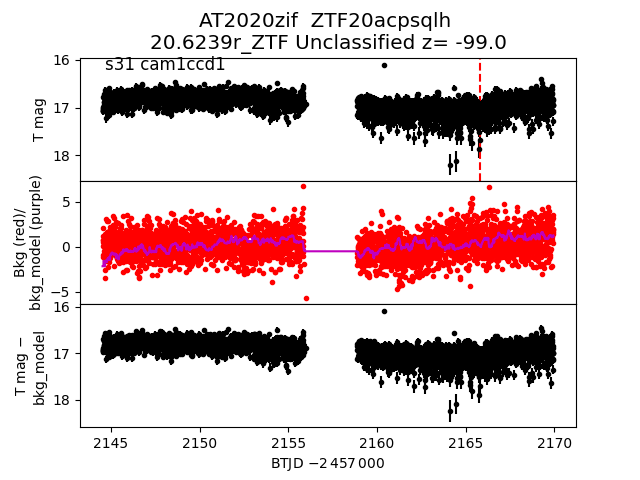
 2020zif
 2020aarz
 2020zxn
 2020ygb
 2020zvf
 2020zsh
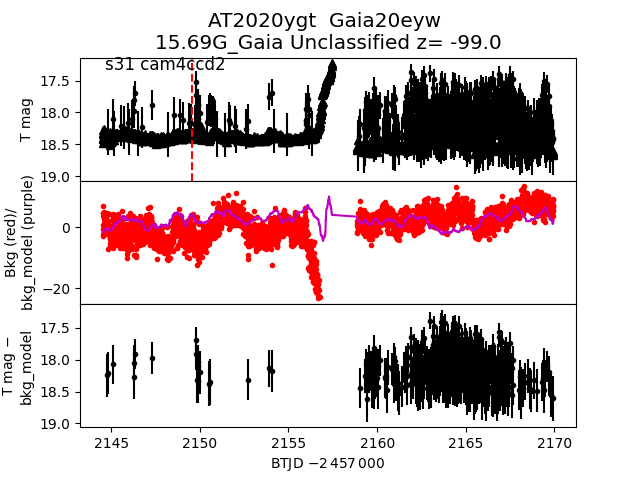
 2020ygt
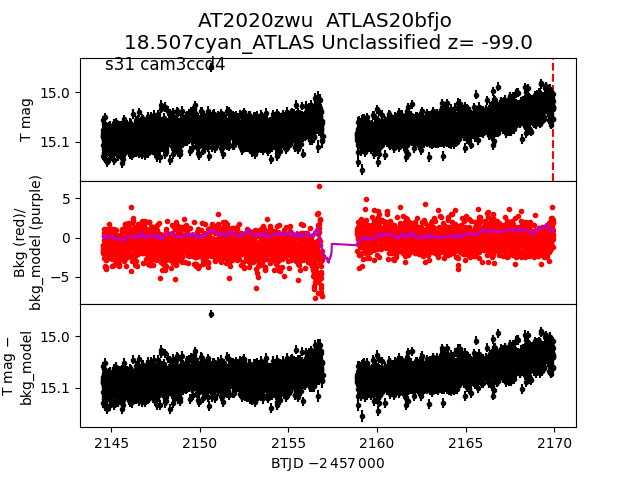
 2020zwu
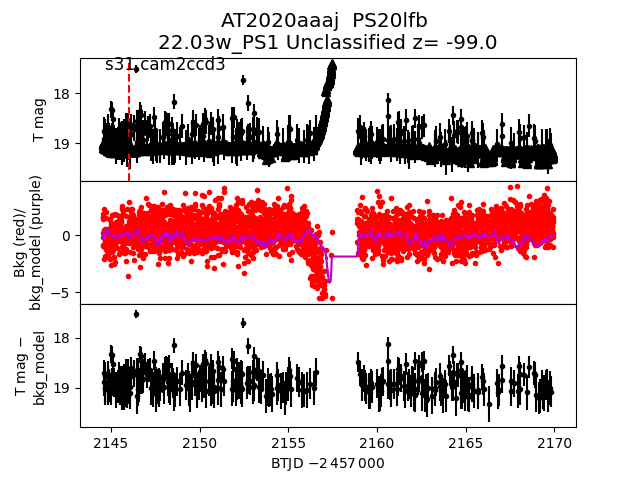
 2020aaaj
 2020zxg
 2020yzo
 2020zpi
 2020yef
 2020ygw
 2020zwv
 2020yws
 2020zgr
 2020aajf
 2020zve
 2020aavd
 2020ykq
 2020zjg
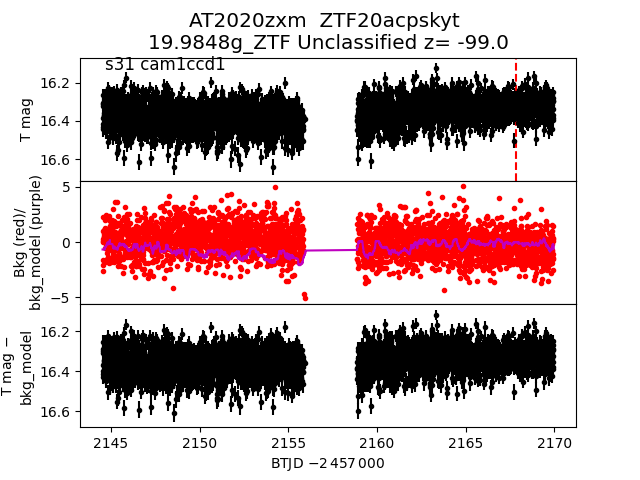
 2020zxm
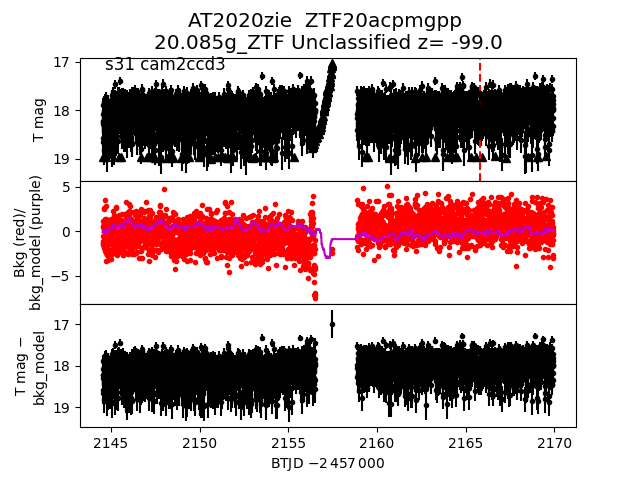
 2020zie
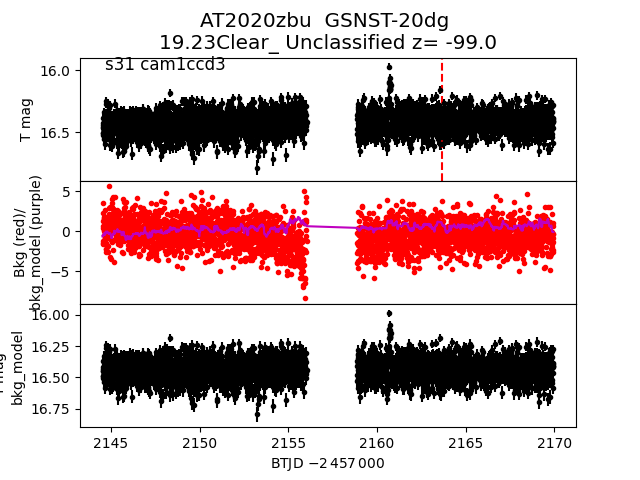
 2020zbu
 2020yzy
 2020xzh
 2020yej
 2020aamu
 2020zbo
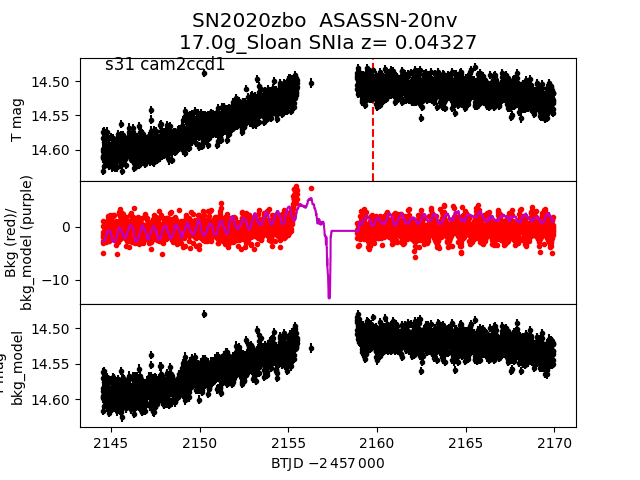 2020zbp
 2020zyr
 2020acpo
 2020yst
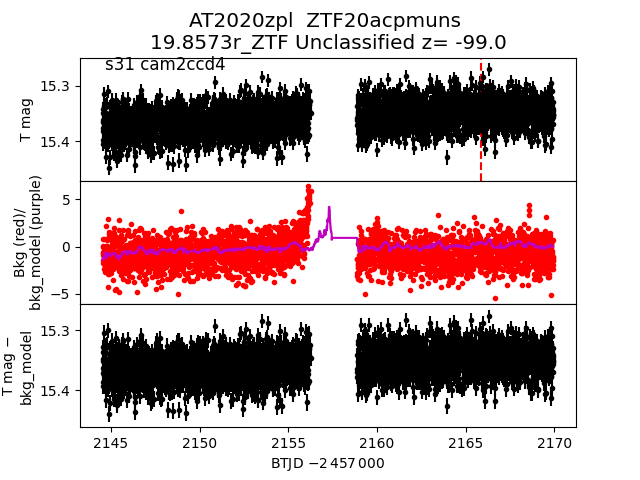
 2020zpl
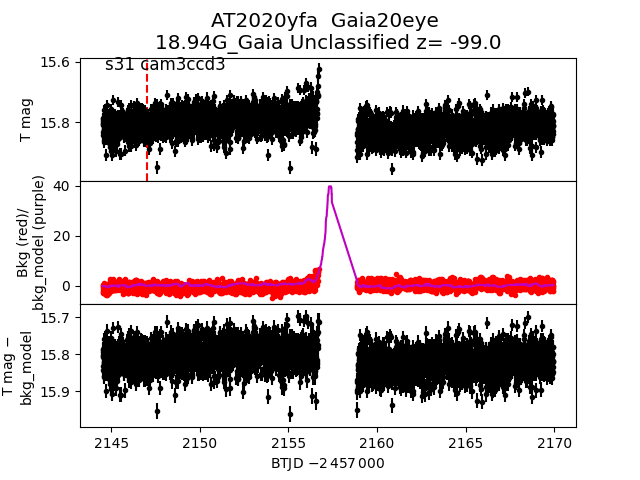
 2020yfa
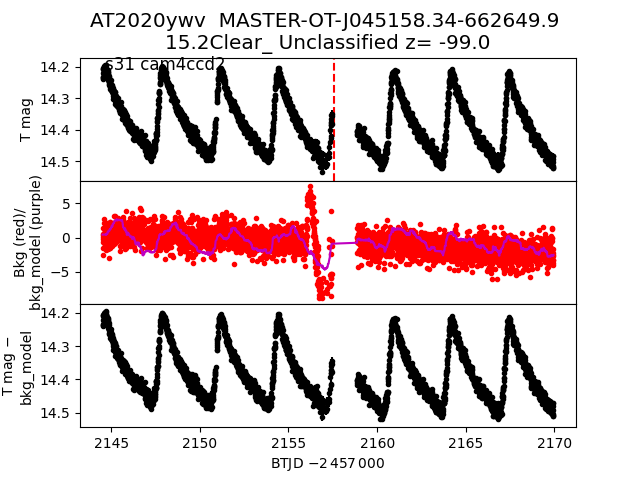
 2020ywv
 2020yve
 2020ykb
 2020yux