all transients in sector29 (87 total)
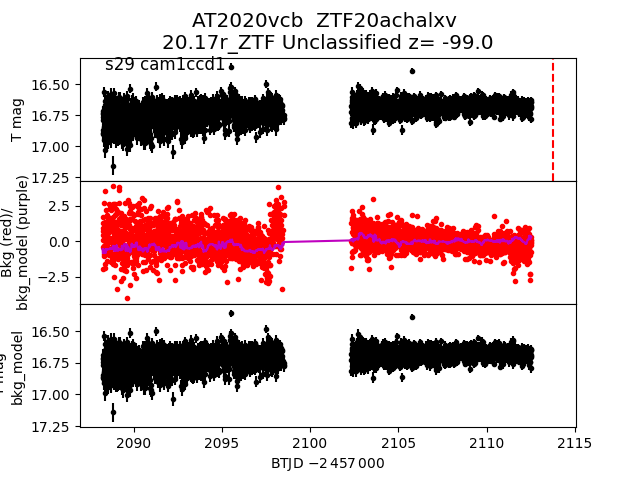
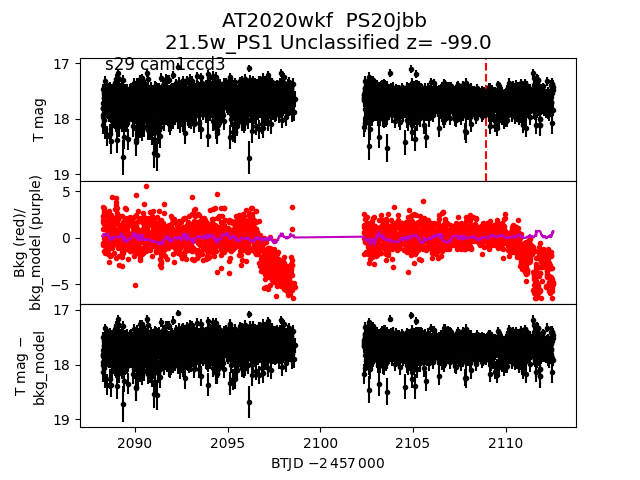
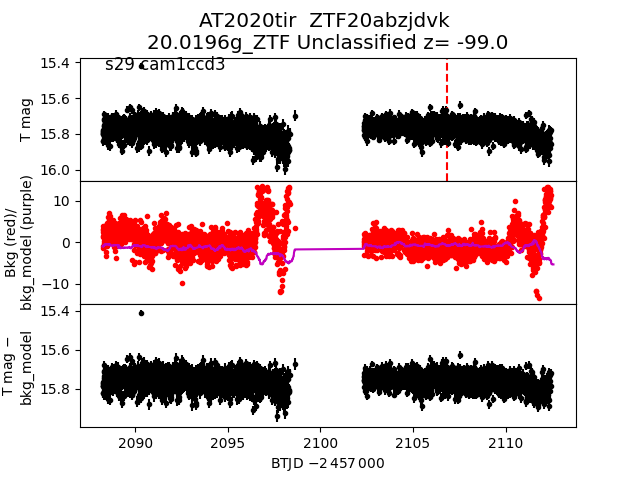
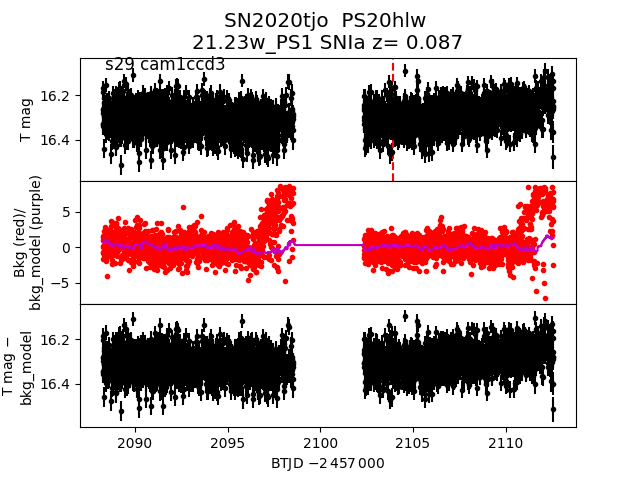
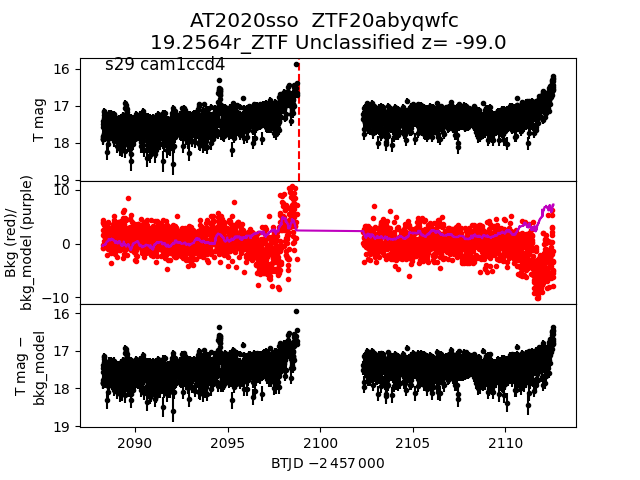
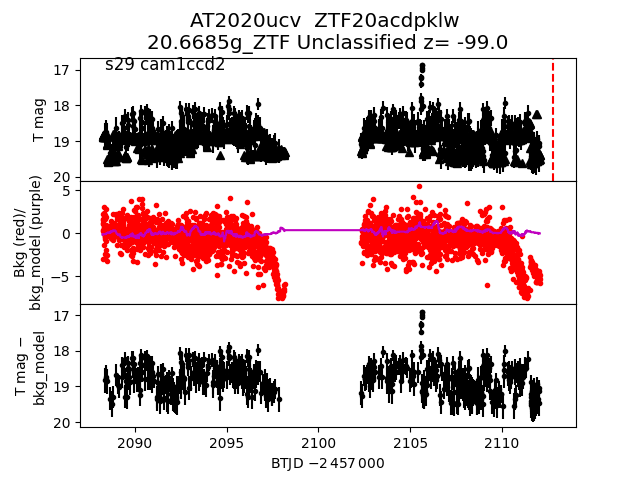
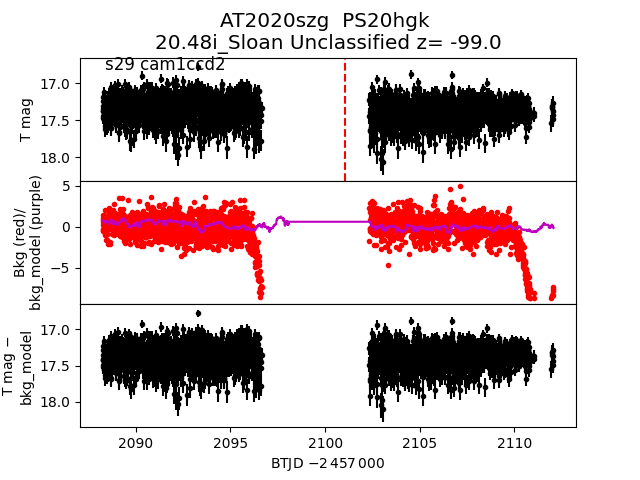
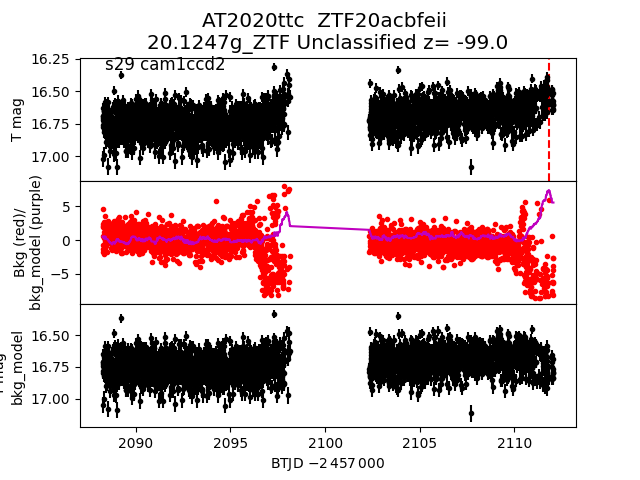
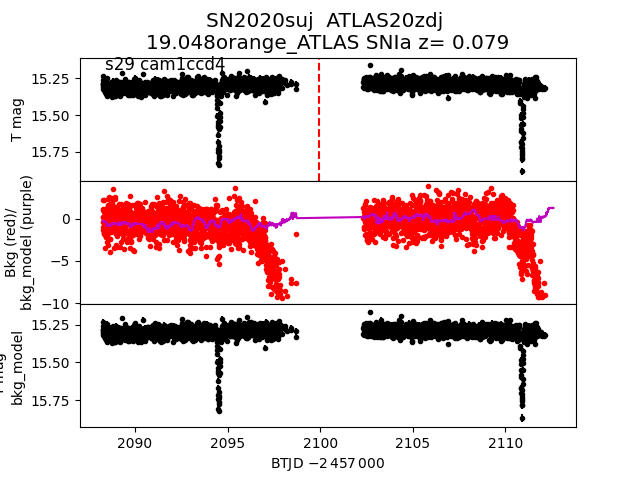
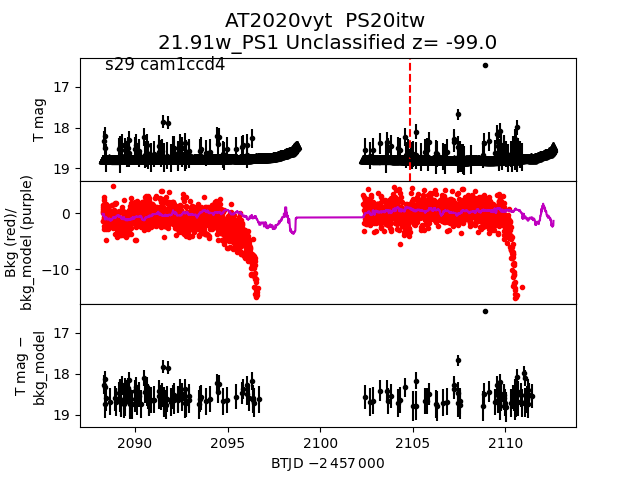
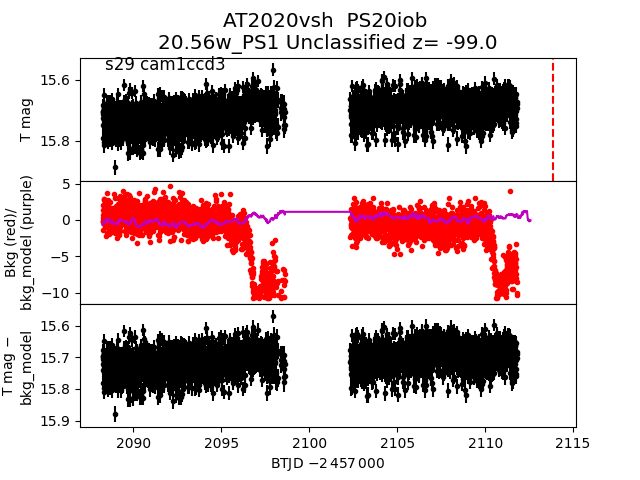
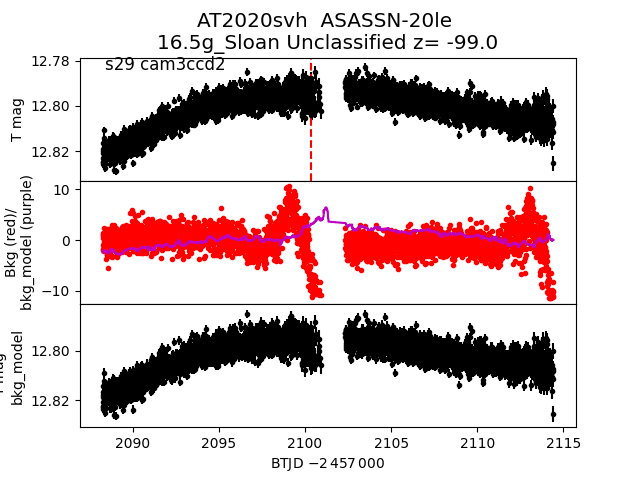
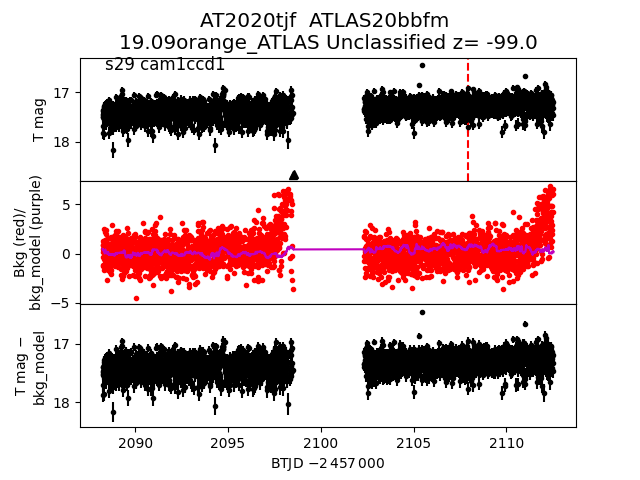
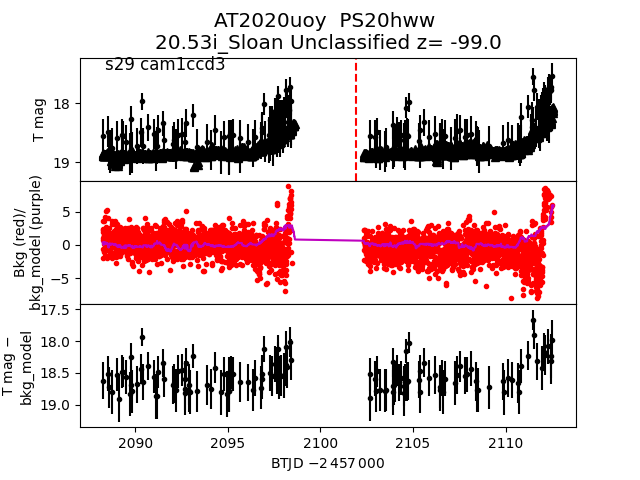
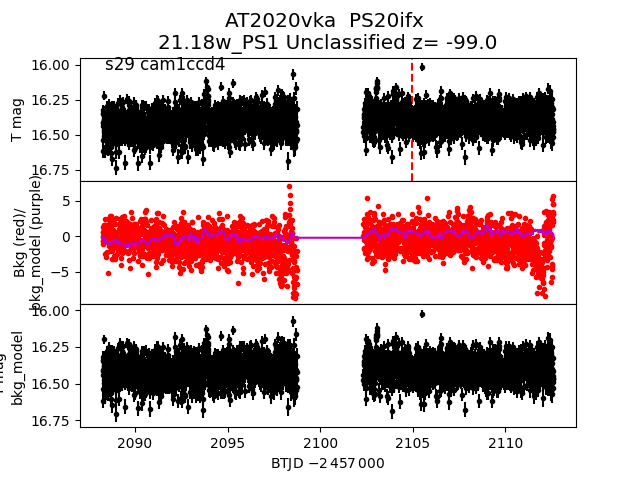
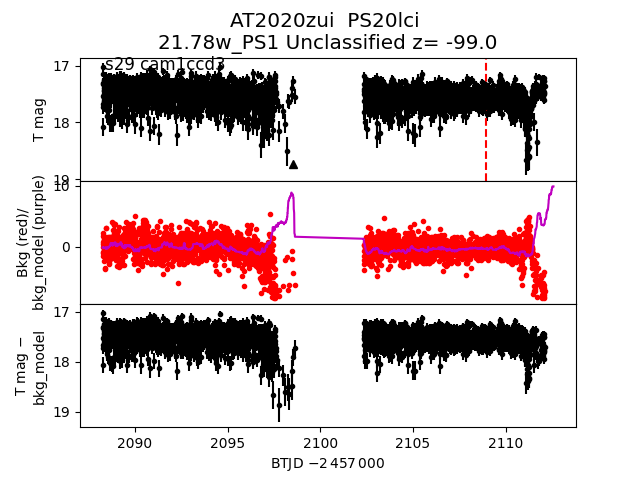
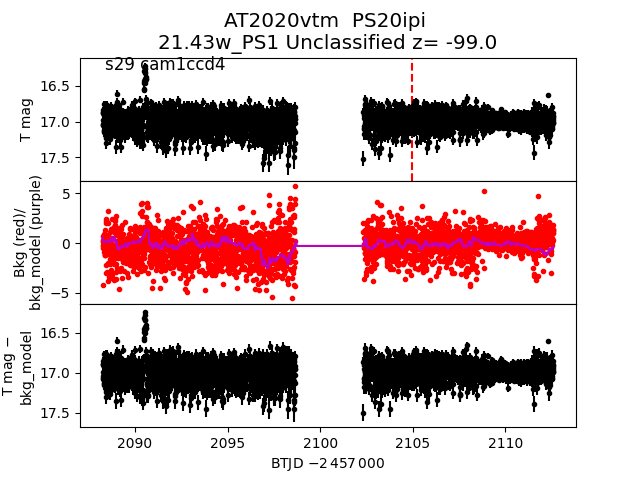
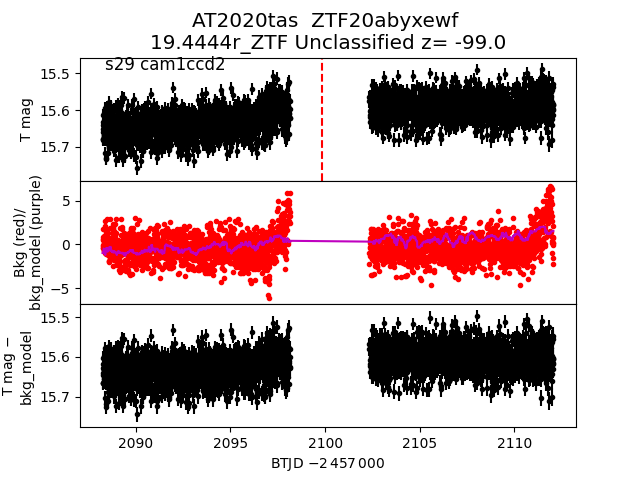
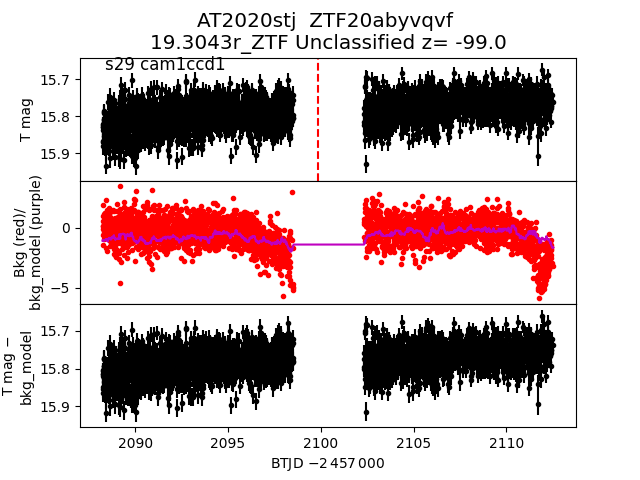
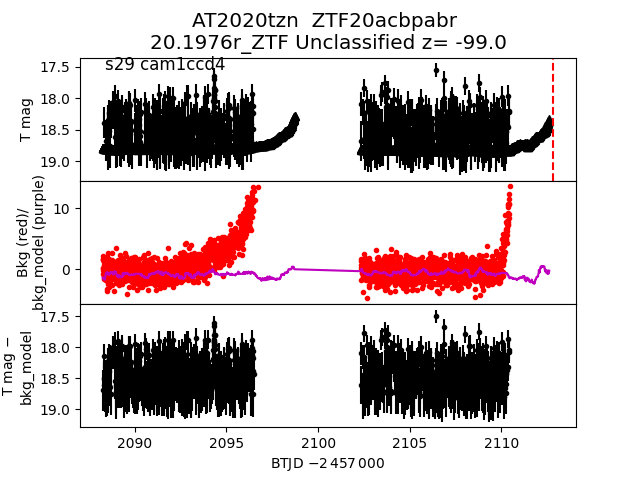
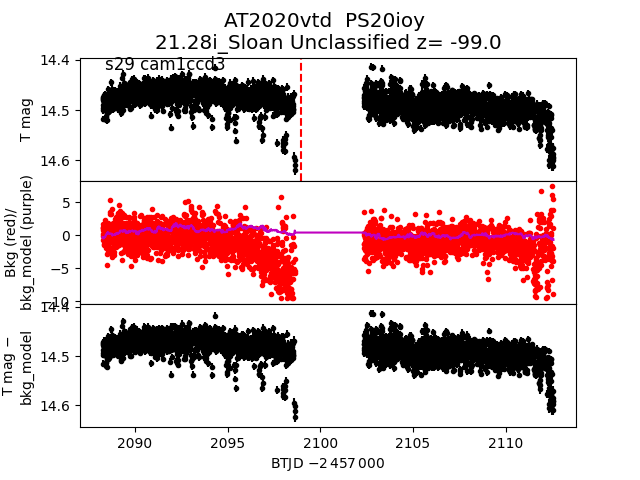
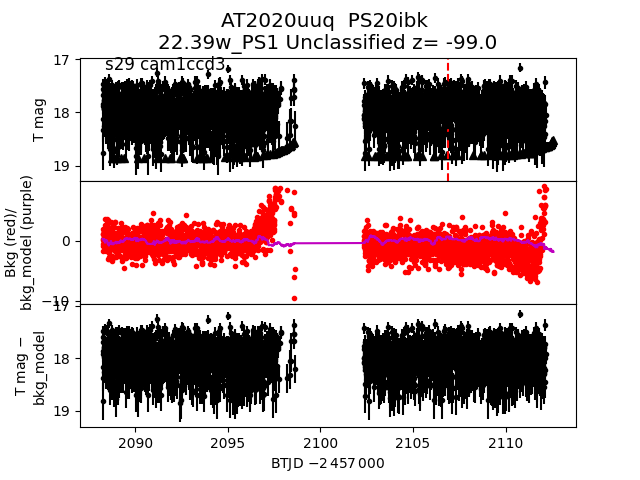
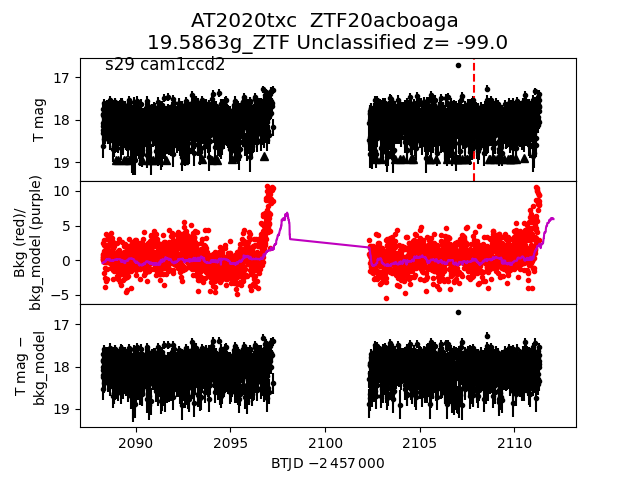
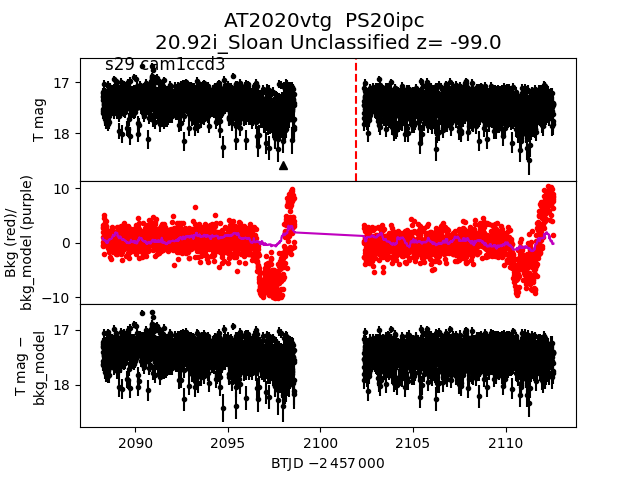
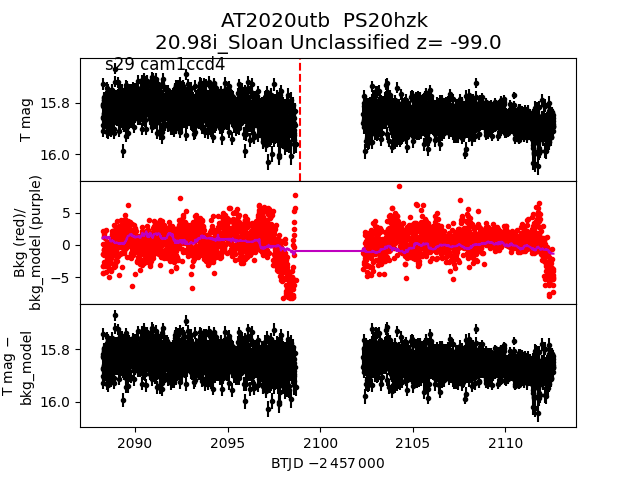
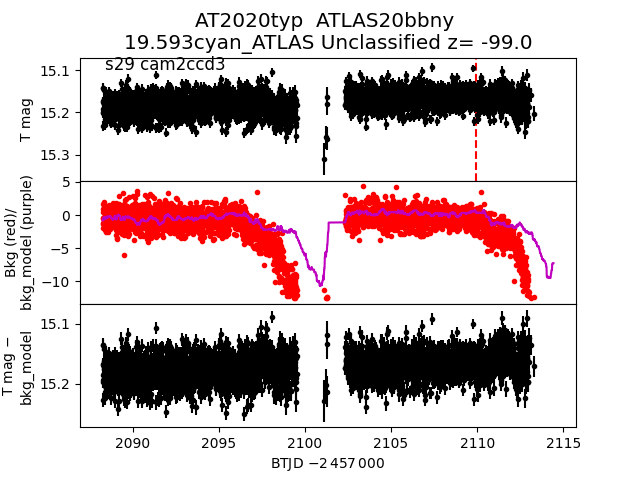
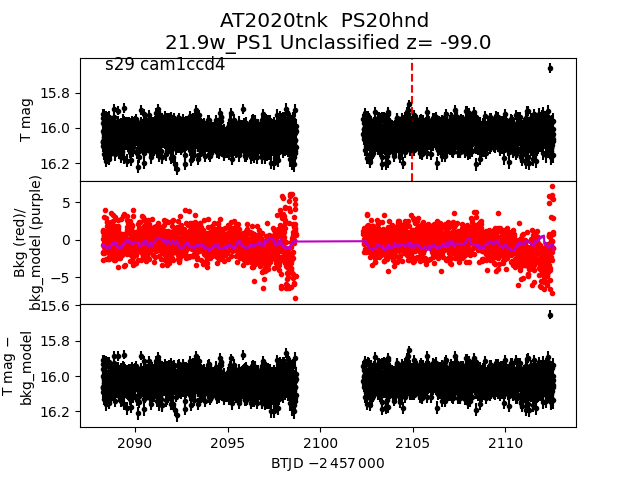
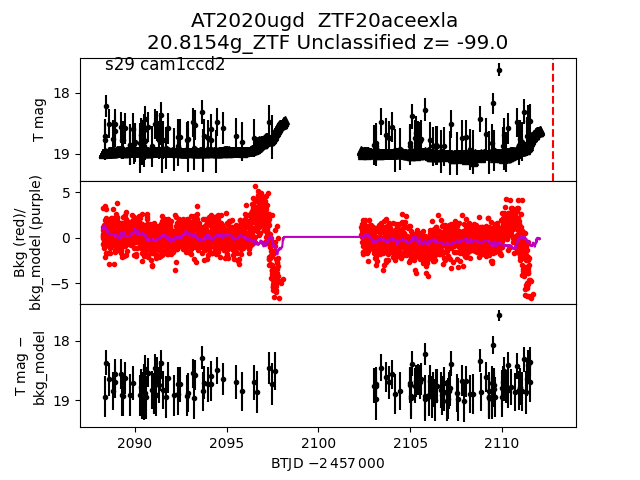
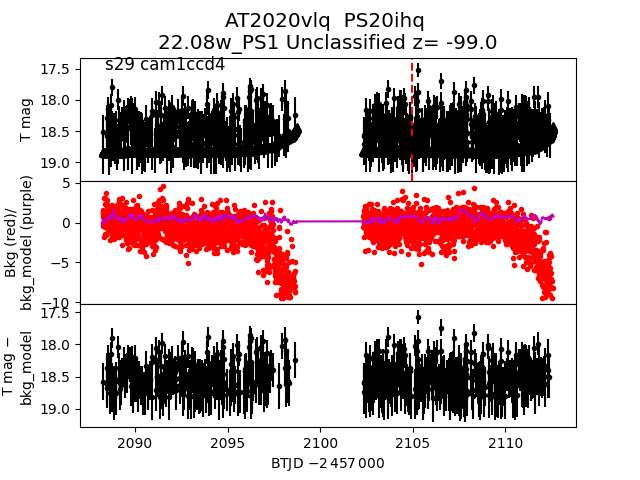
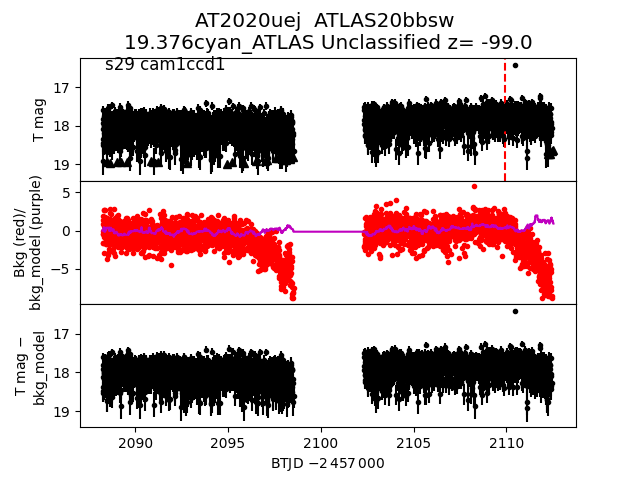
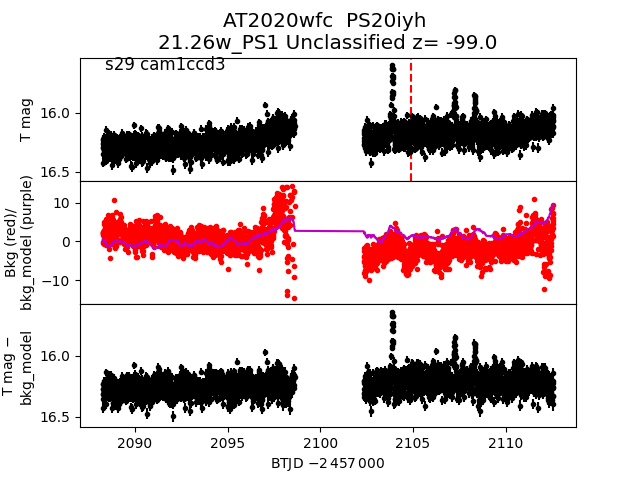
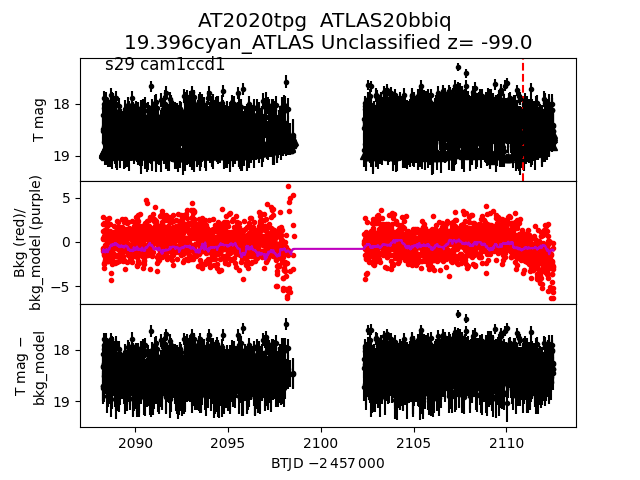
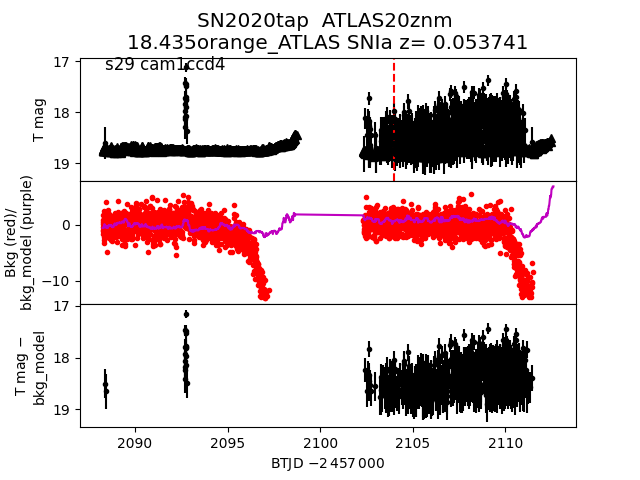
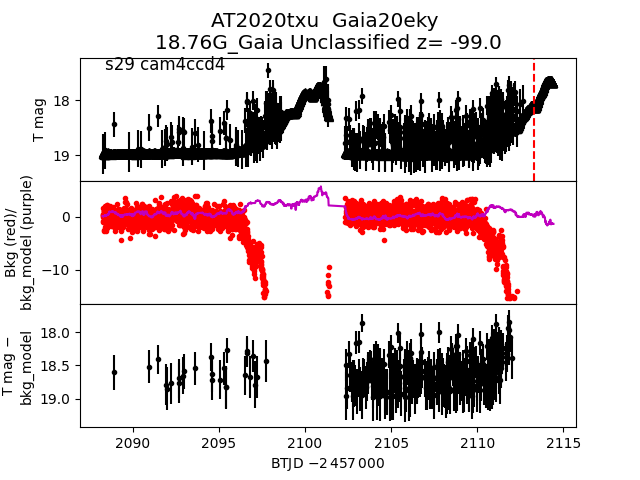
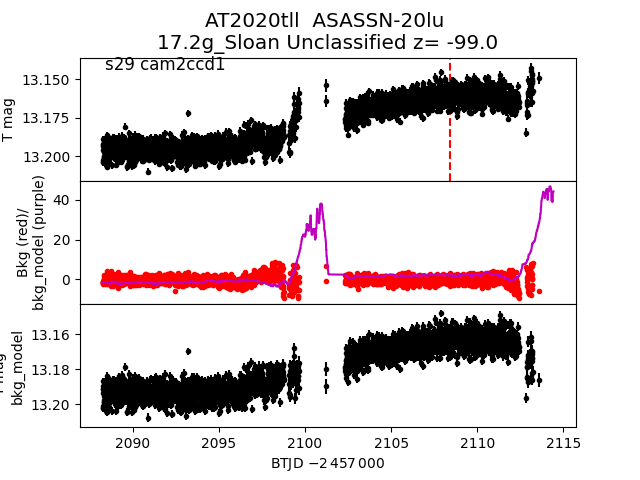
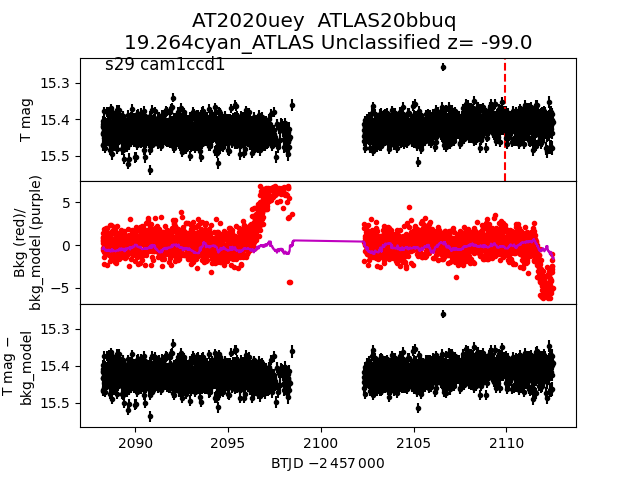
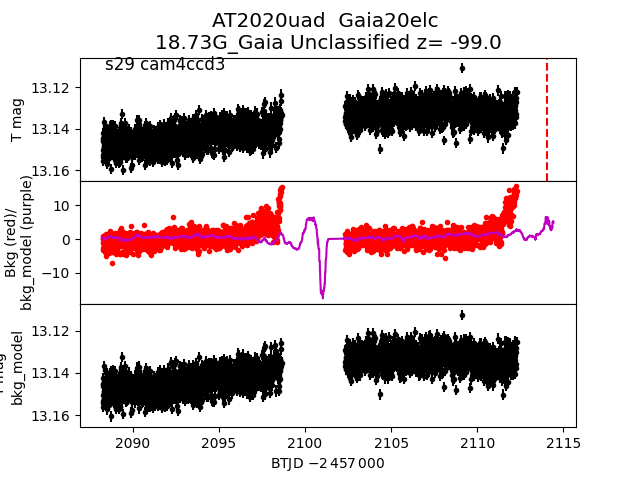
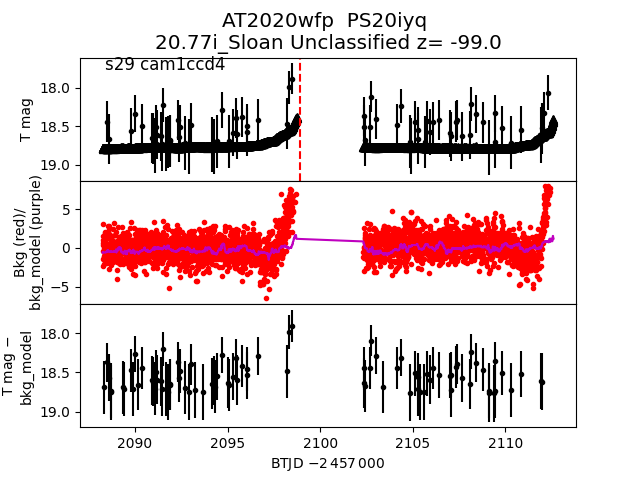
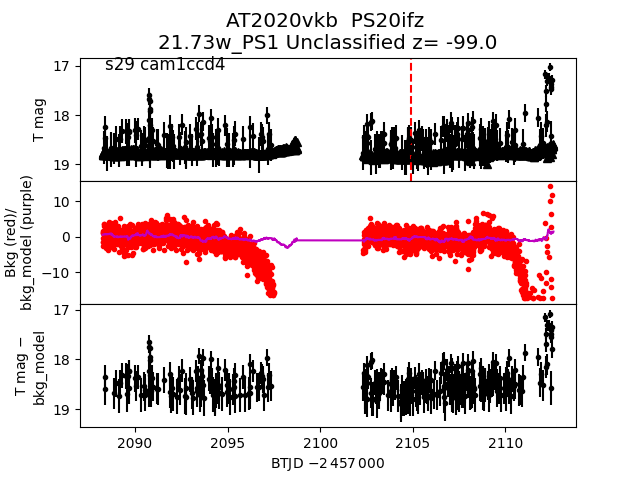
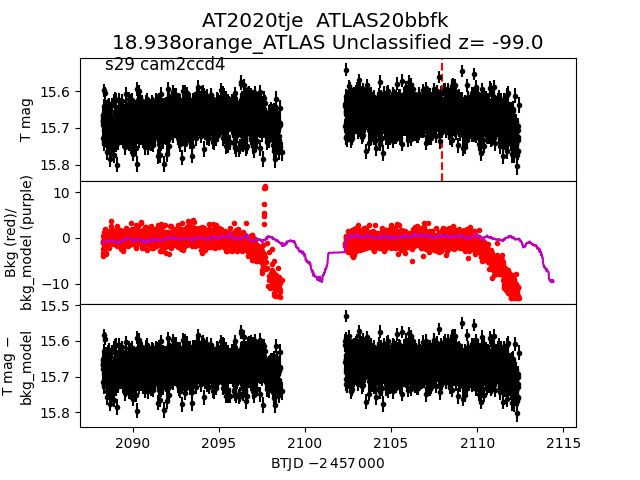
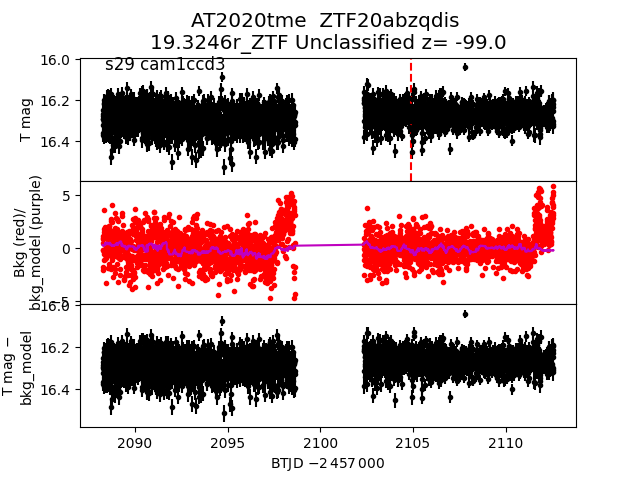
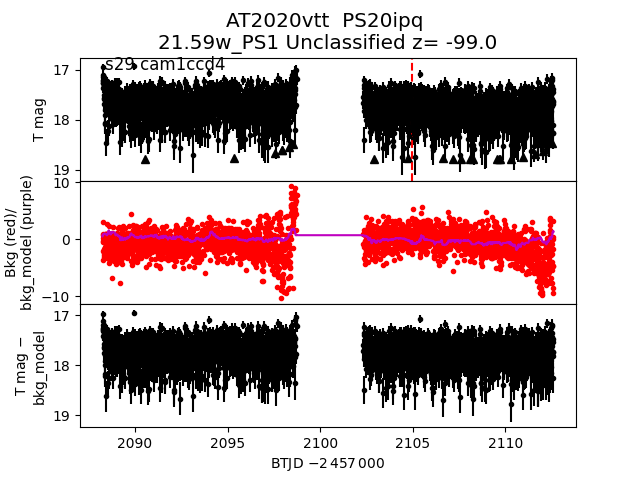
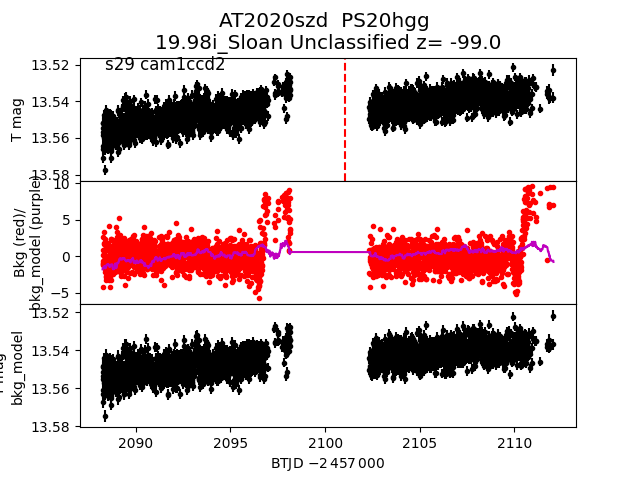
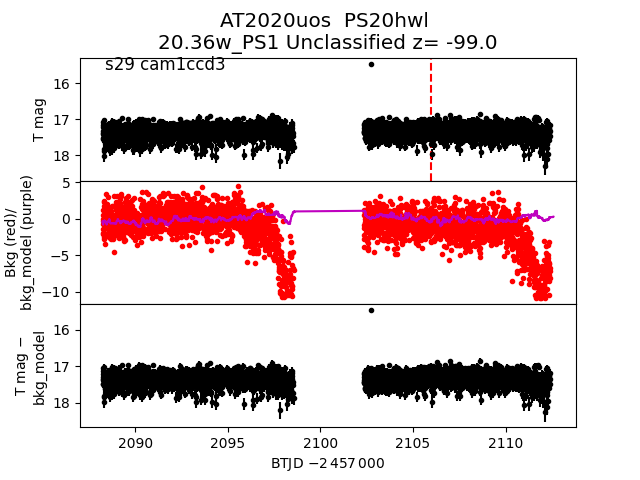
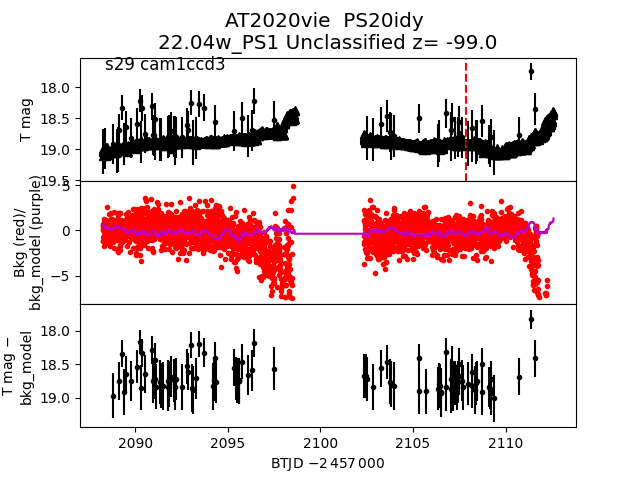
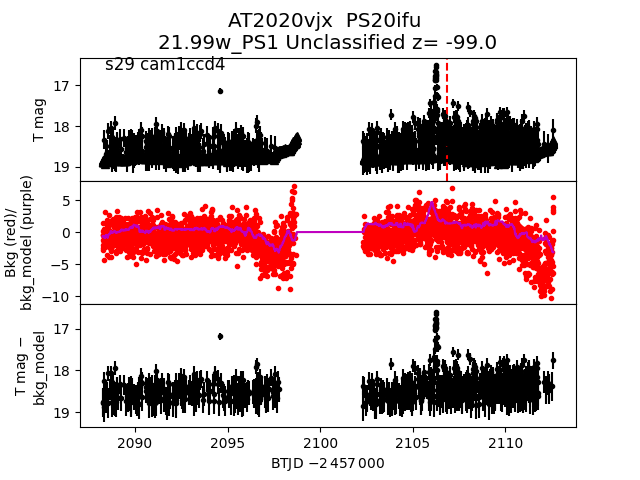
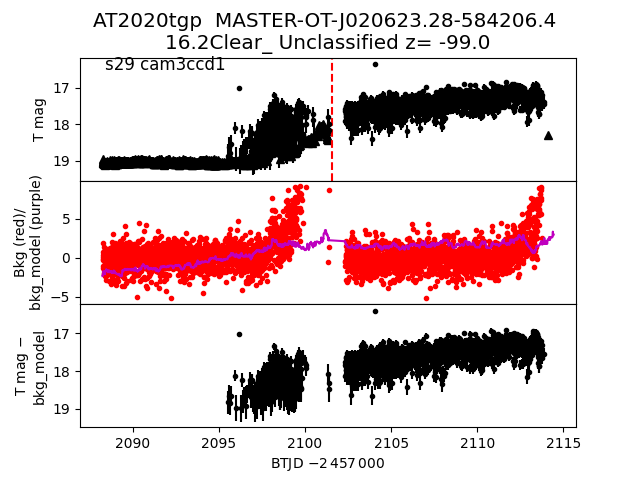
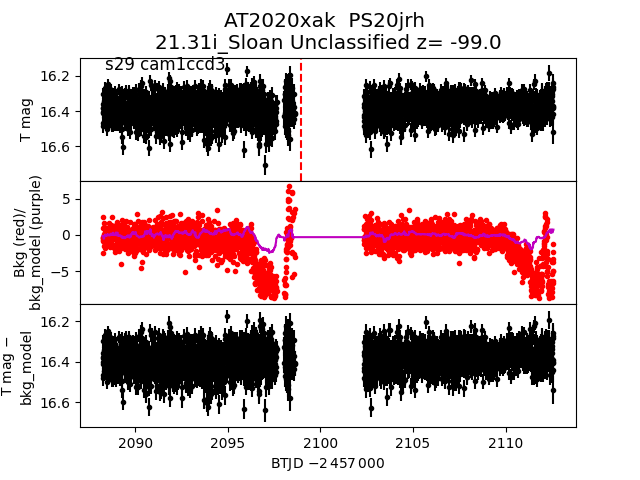
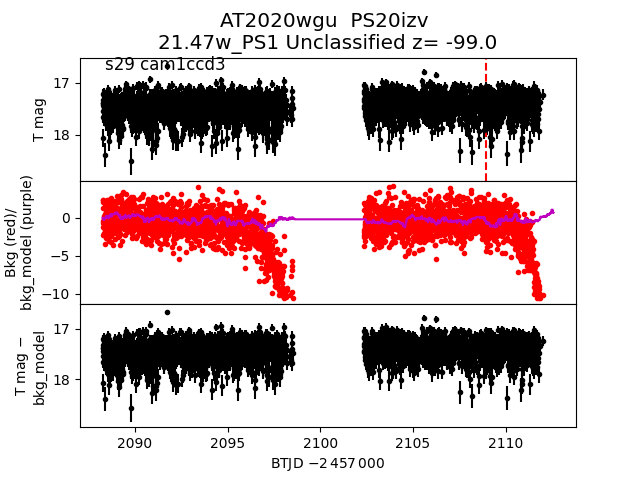
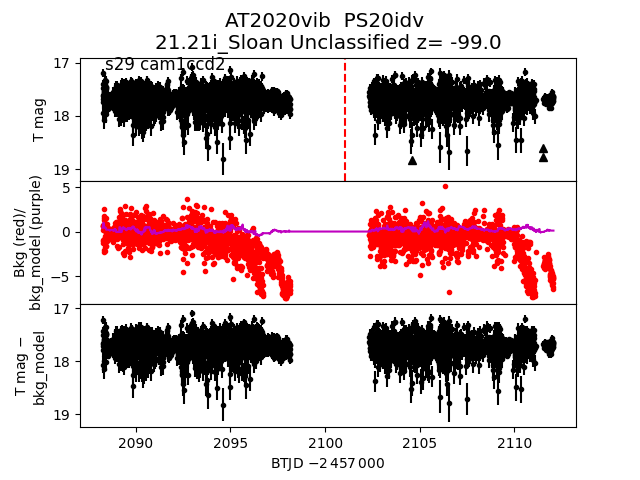
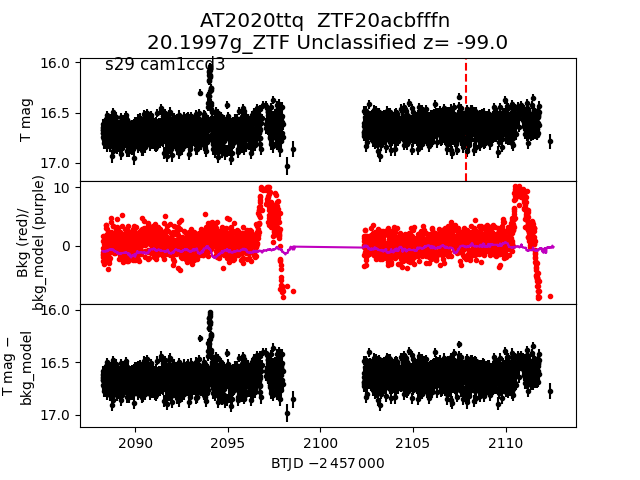
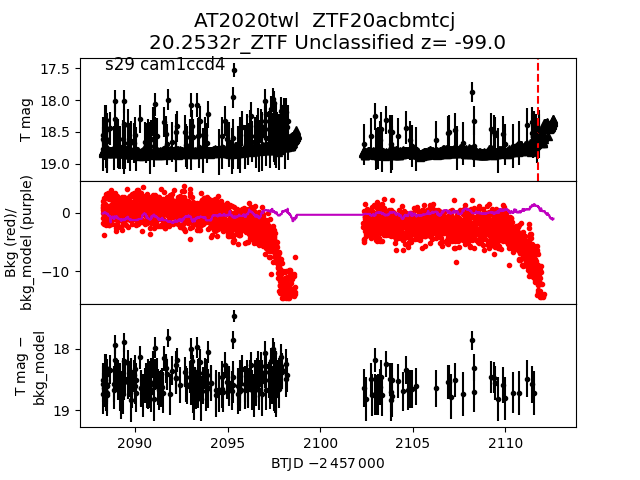
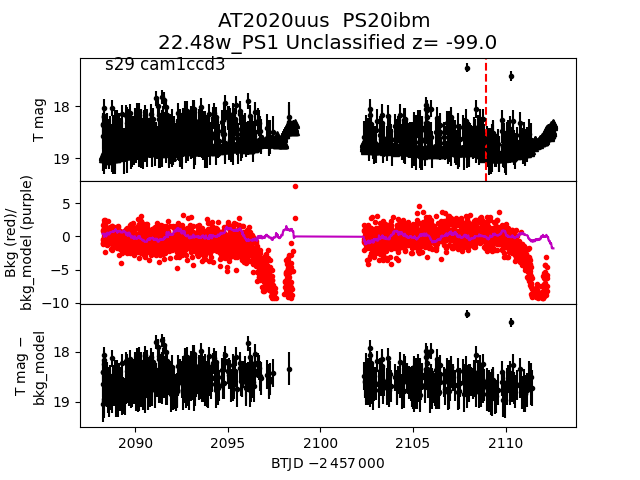
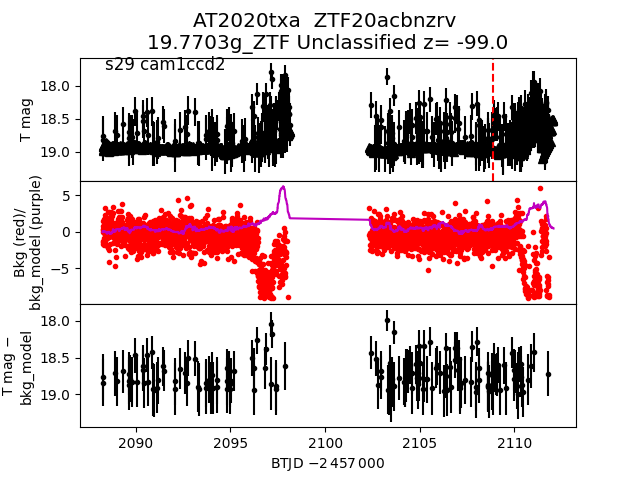
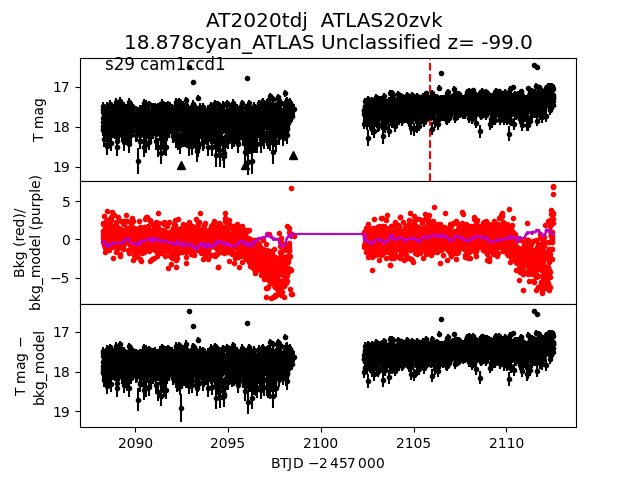
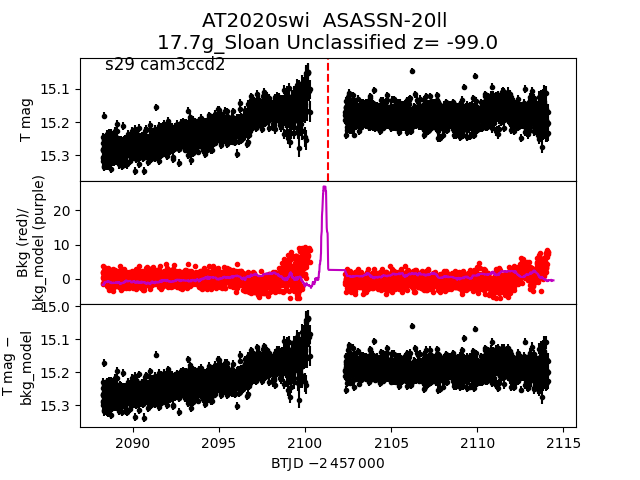
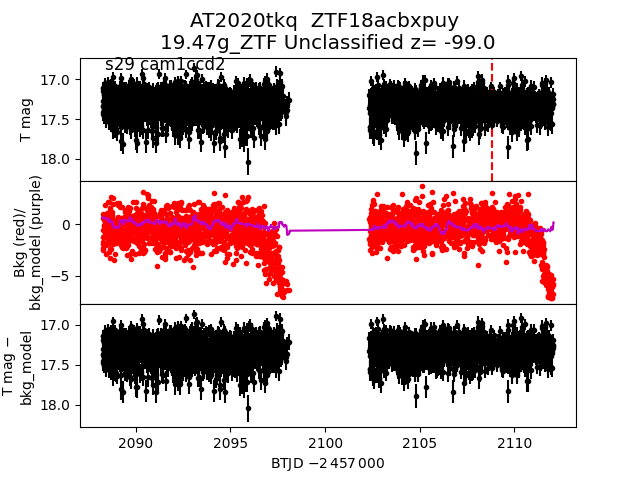
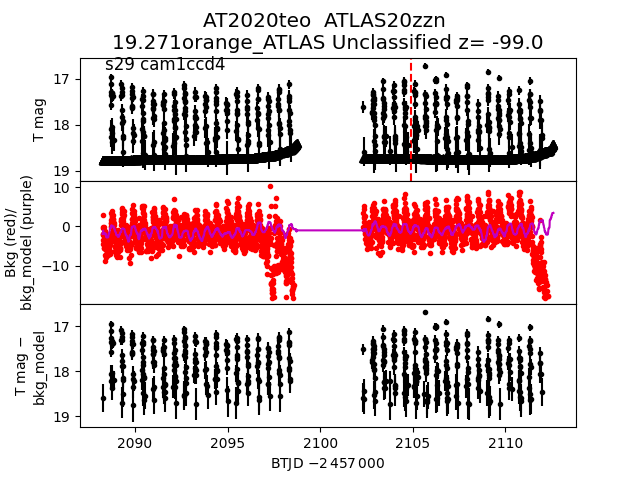
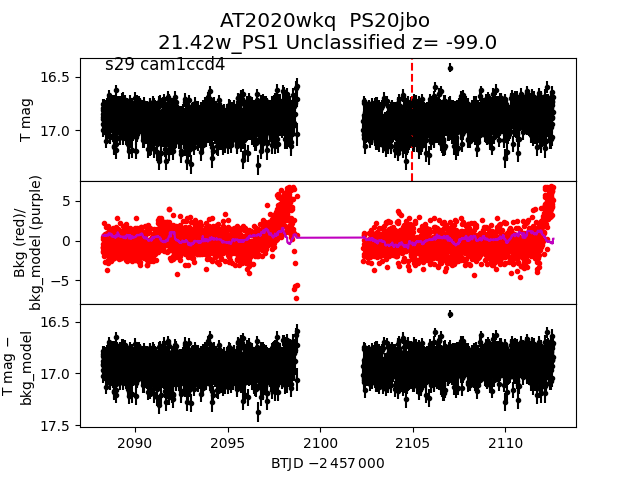
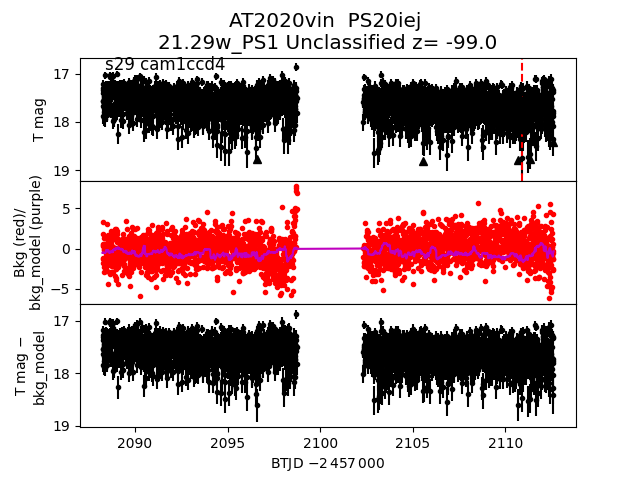
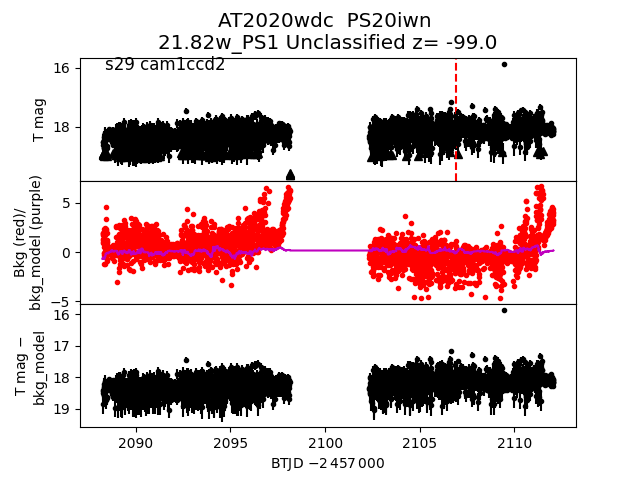
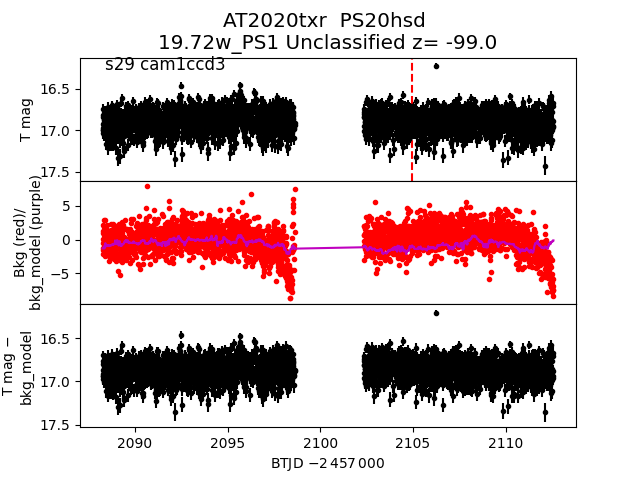
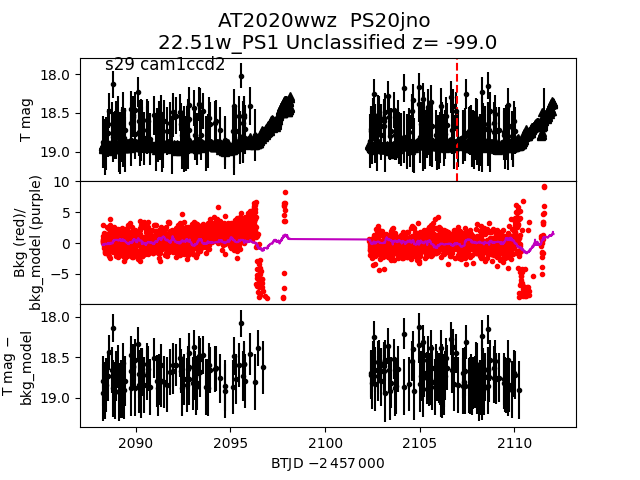
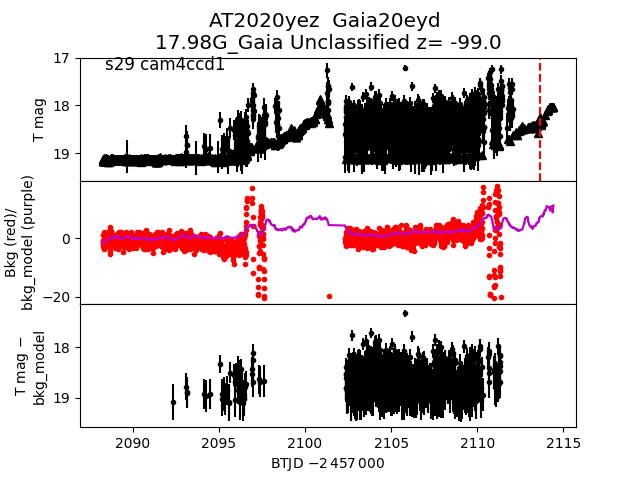
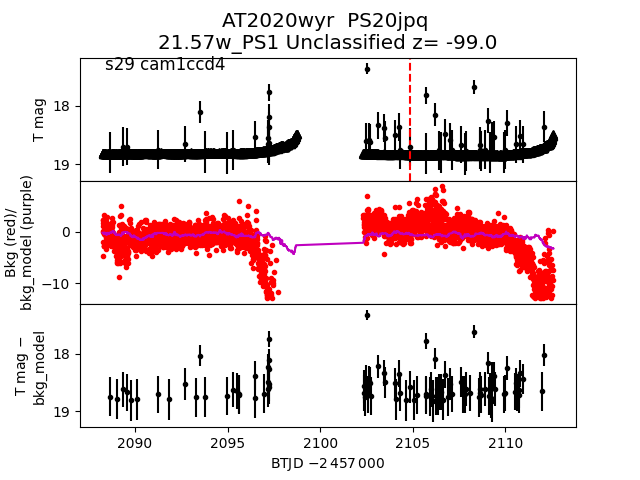
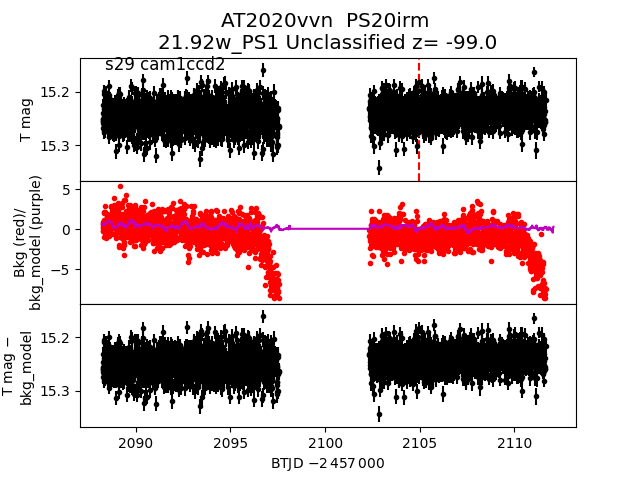
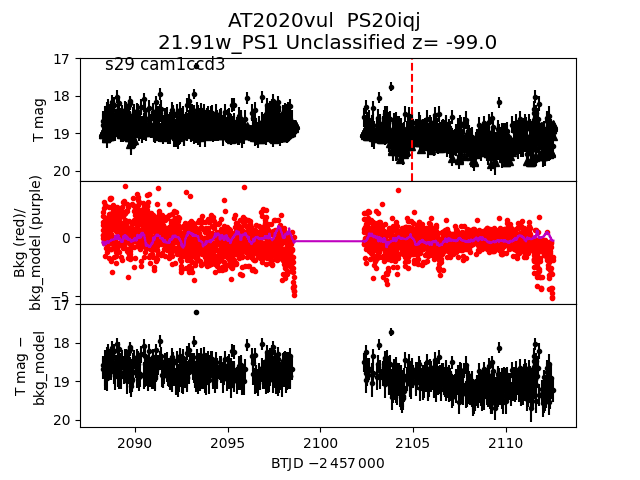
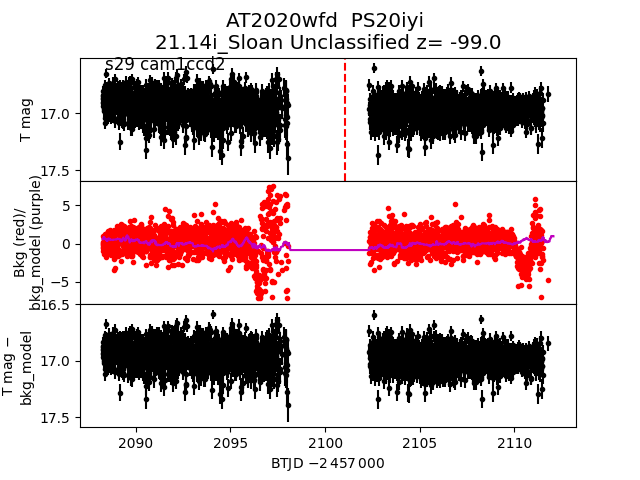
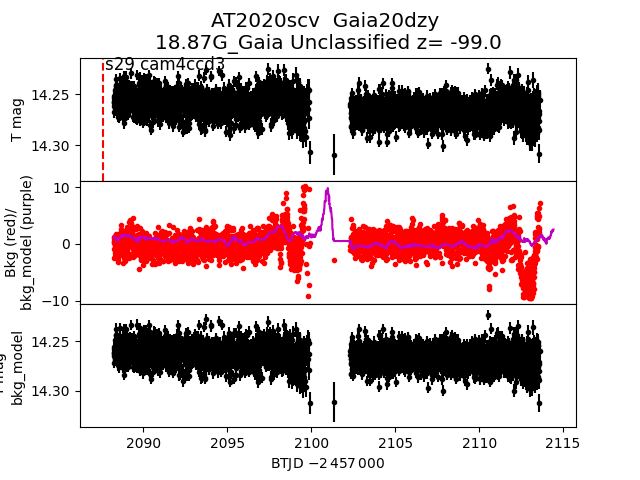
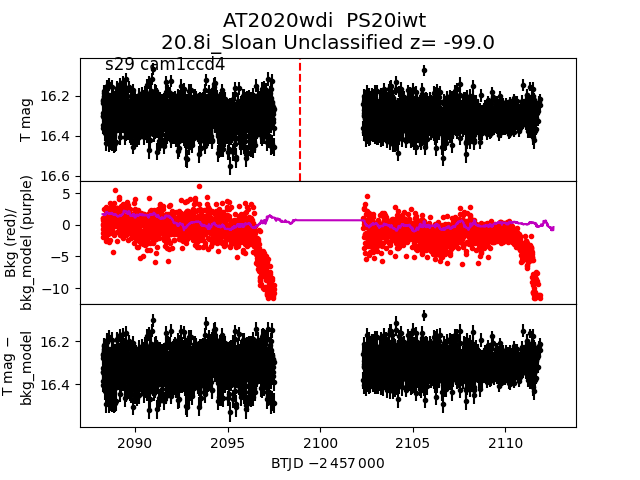
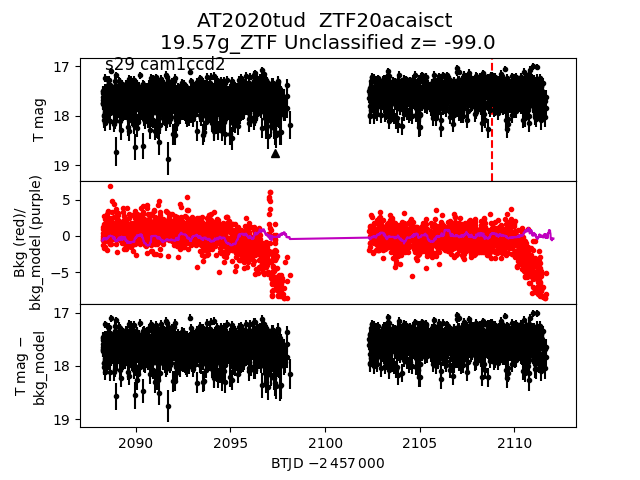
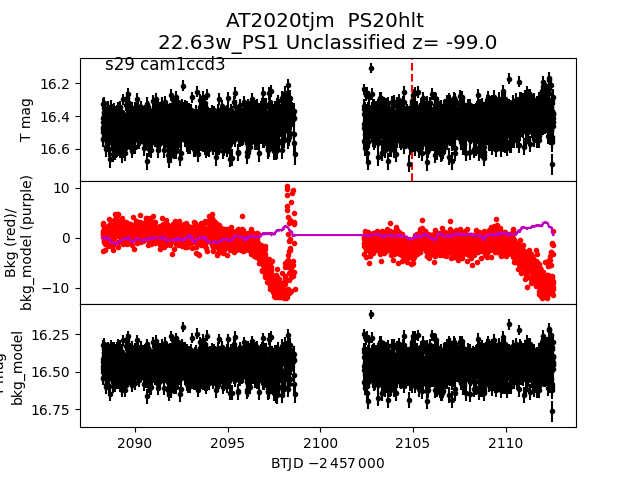
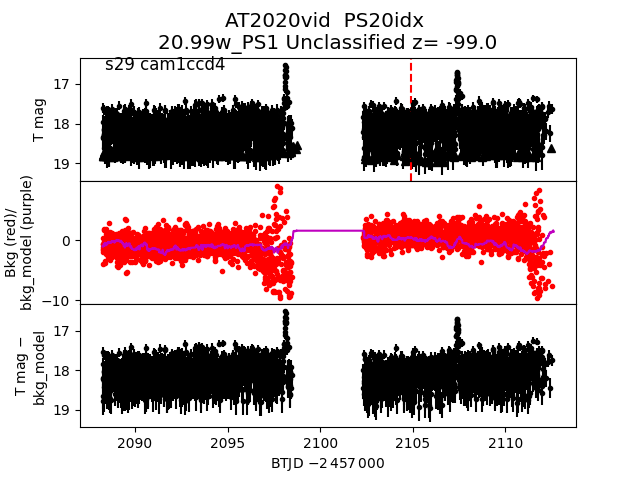
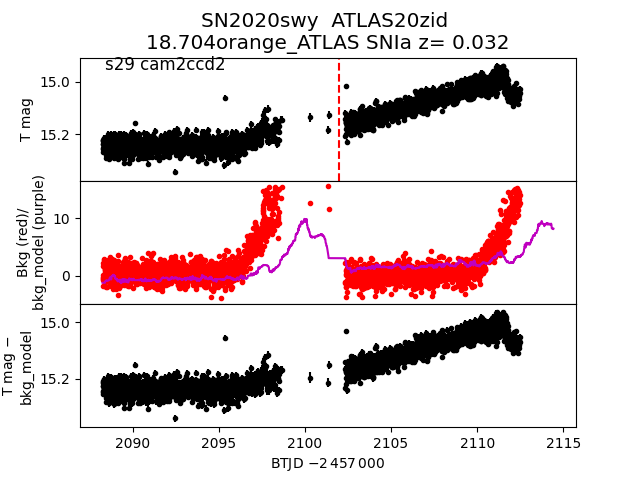
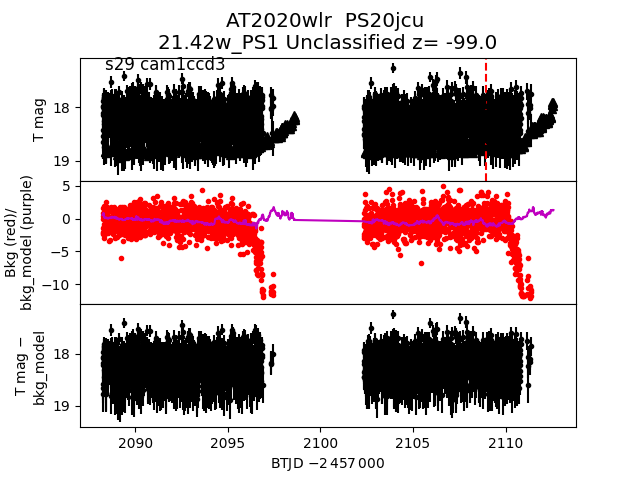
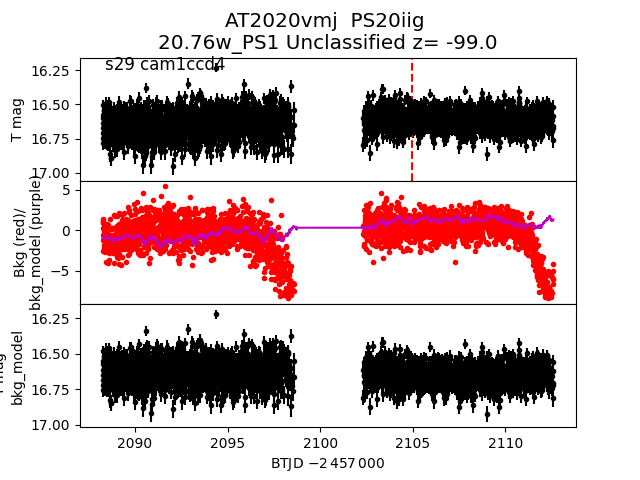
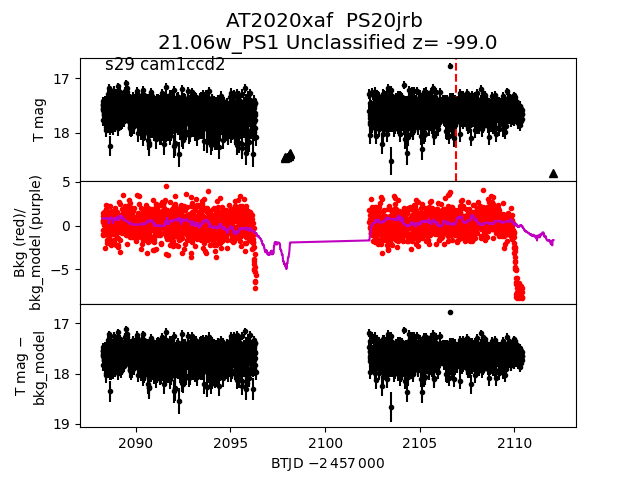
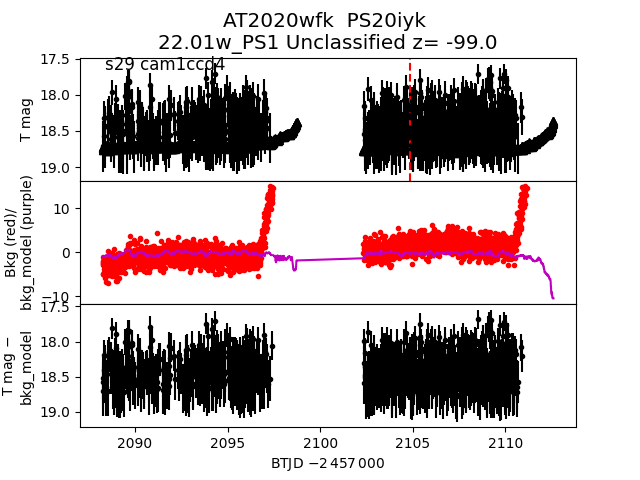
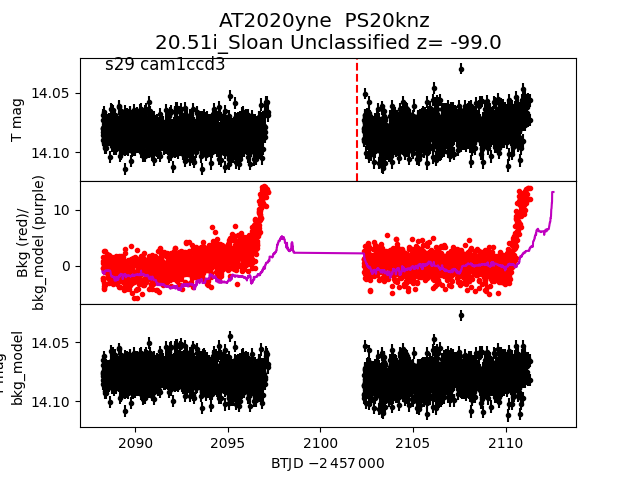
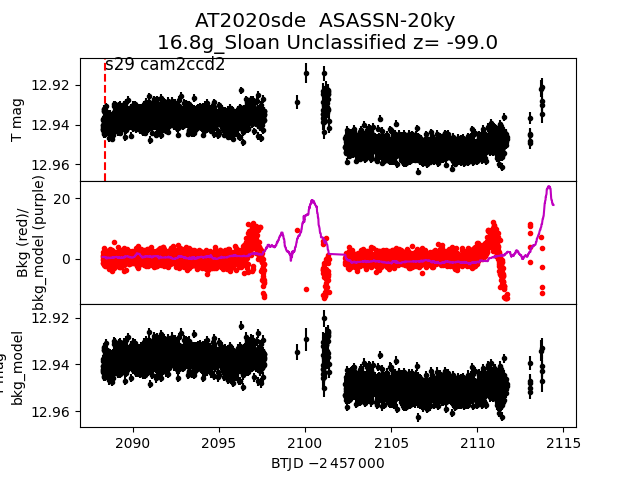
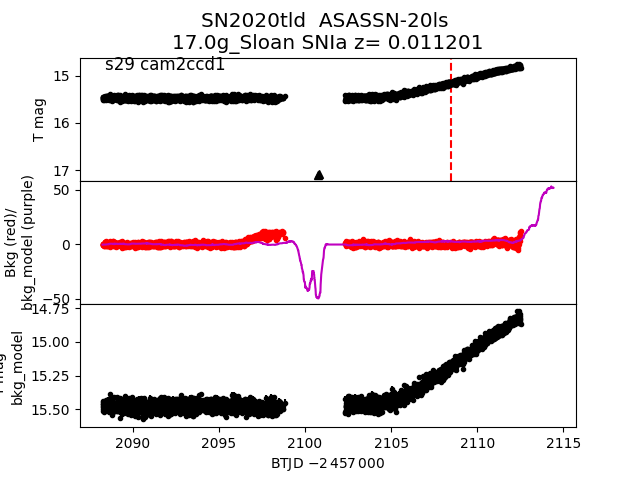
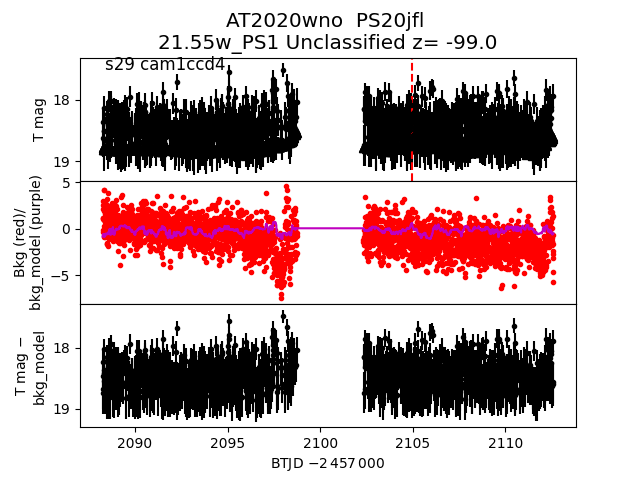
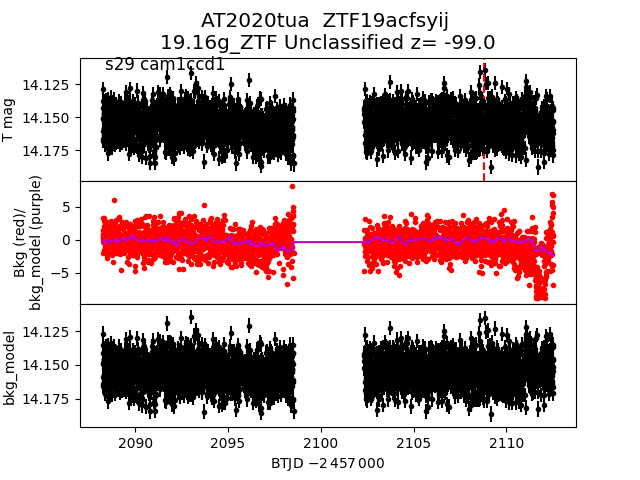
Each figure has three panels. The top panel shows the transient light curve, the middle panel shows the local background (estimated in an annulus), and the bottom panel shows a "background-model corrected" light curve. Details about the background model are in the README.
The vertical red line marks the time of discovery reported to TNS. Other useful metadata from TNS is in the figure title.
Note that the top and bottom panel are in magnitudes, while the middle panel is in differential flux units. The magnitudes are calibrated to the flux in the reference image used for image subtraction. Thus, flux from the host galaxy is included in these magnitudes.
3-sigma upper limits are plotted as triangles with no errorbars. A typical limiting magnitude is 19.6 in 30 minutes or 18.4 in 200 seconds (for low backgrounds).
The links allow you to download the light curve data as a text file.
More details in the README.
2020wkf
 2020tir
 2020tjo
 2020sso
 2020ucv
 2020szg
 2020ttc
 2020suj
 2020vyt
 2020vsh
 2020svh
 2020tjf
 2020uoy
 2020vka
 2020zui
 2020vtm
 2020tas
 2020stj
 2020tzn
 2020vtd
 2020uuq
 2020txc
 2020vtg
 2020utb
 2020typ
 2020tnk
 2020ugd
 2020vlq
 2020uej
 2020wfc
 2020tpg
 2020tap
 2020txu
 2020tll
 2020uey
 2020uad
 2020wfp
 2020vkb
 2020tje
 2020tme
 2020vtt
 2020szd
 2020uos
 2020vie
 2020vjx
 2020tgp
 2020xak
 2020wgu
 2020vib
 2020ttq
 2020twl
 2020uus
 2020txa
 2020tdj
 2020swi
 2020tkq
 2020teo
 2020wkq
 2020vin
 2020wdc
 2020txr
 2020wwz
 2020yez
 2020wyr
 2020vvn
 2020vul
 2020wfd
 2020uwd
 2020tgq
 2020xbw
 2020wmw
 2020scv
 2020wdi
 2020tud
 2020tjm
 2020vid
 2020swy
 2020wlr
 2020vmj
 2020xaf
 2020wfk
 2020yne
 2020sde
 2020tld
 2020wno
 2020tua
 2020vcb