all transients in sector28 (50 total)
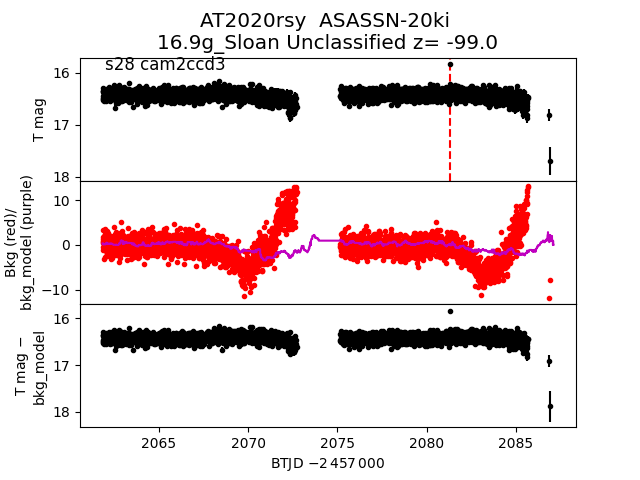
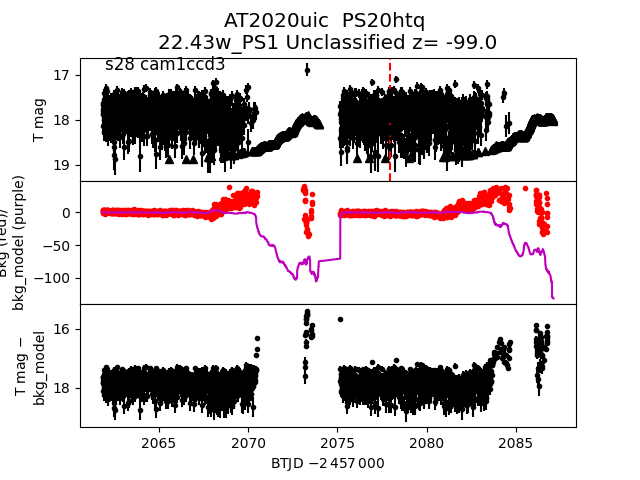
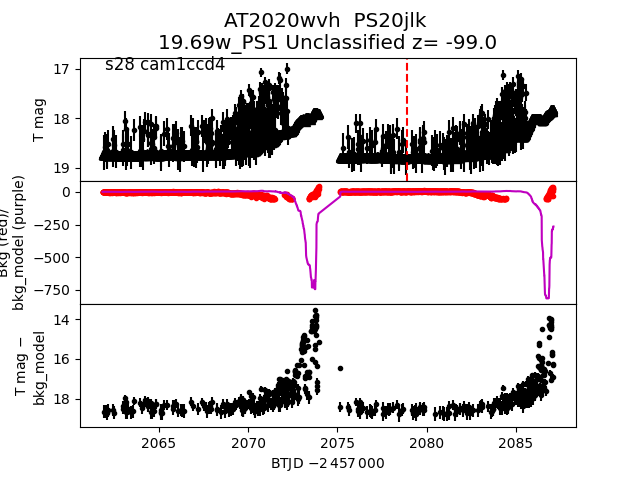
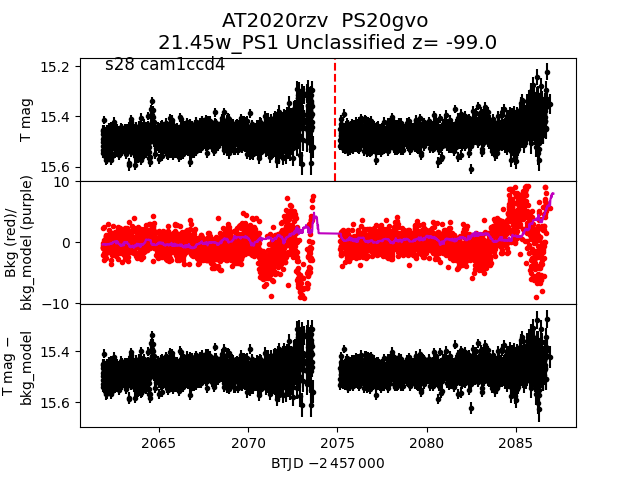
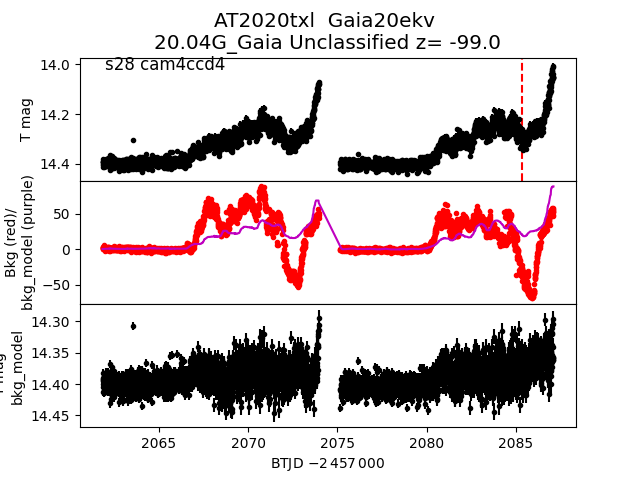
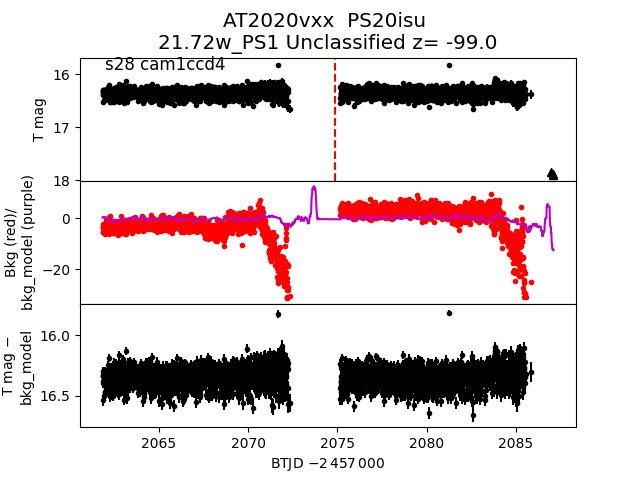
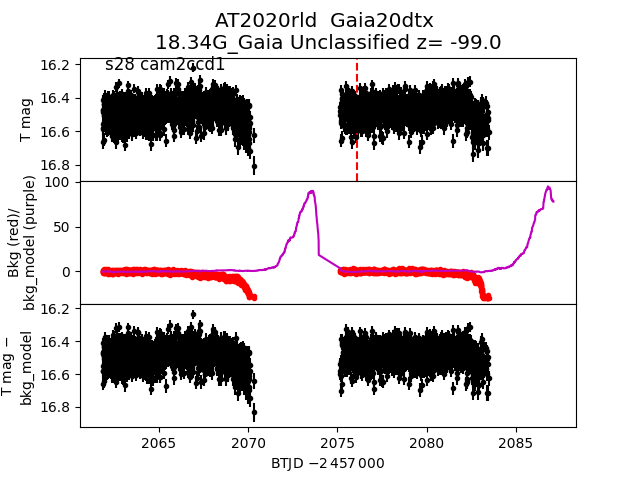
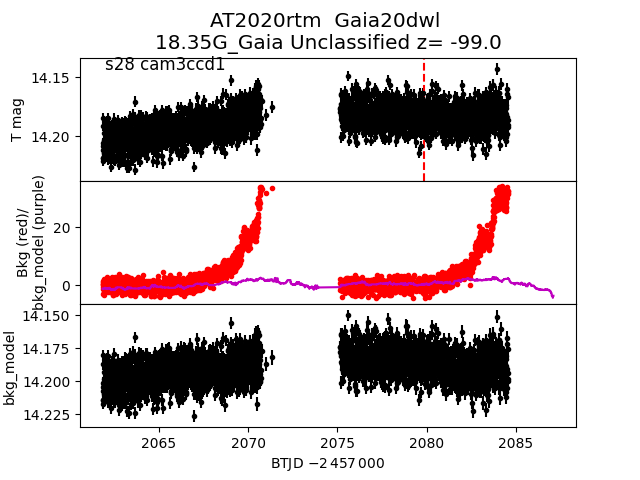
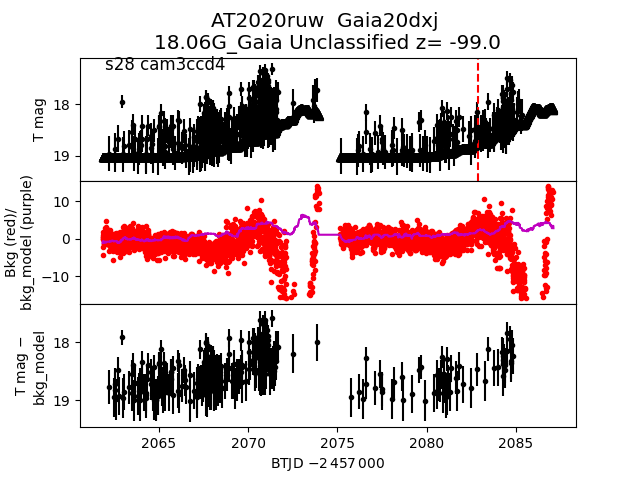
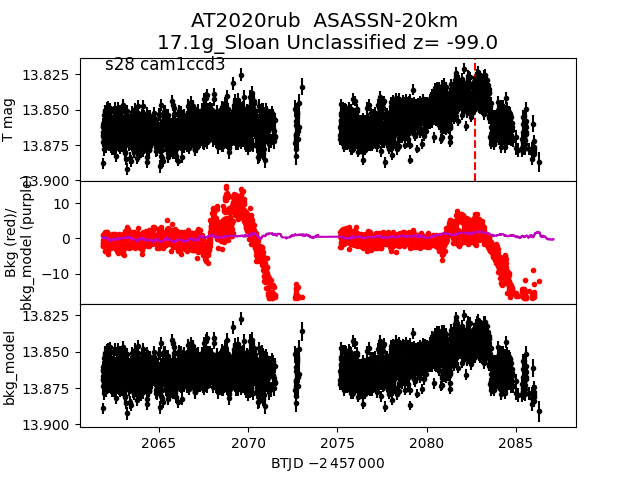
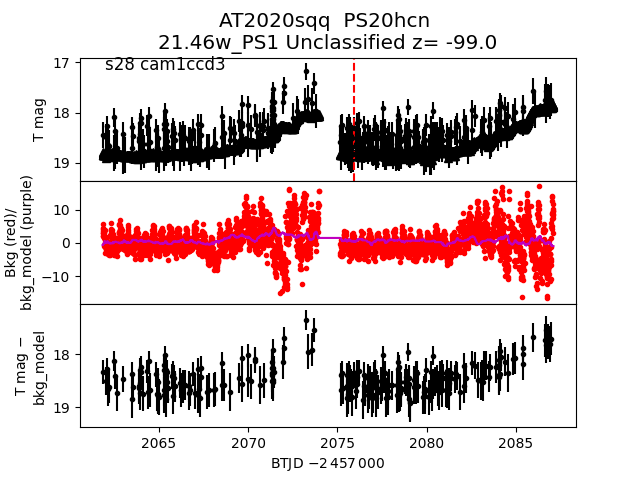
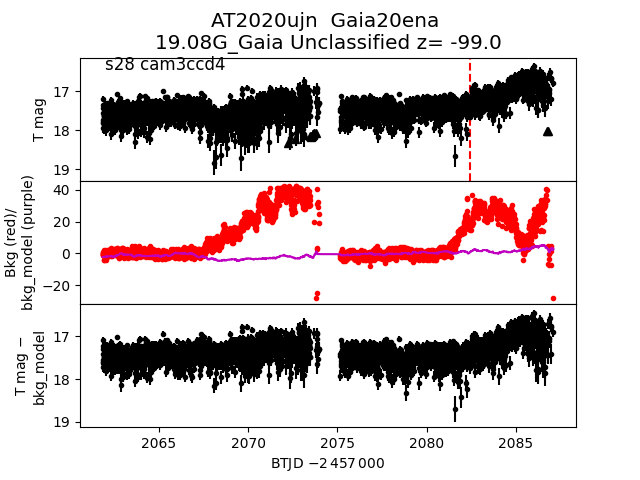
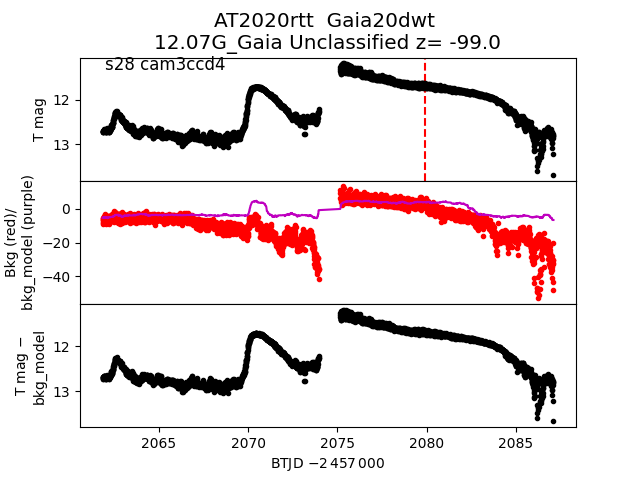
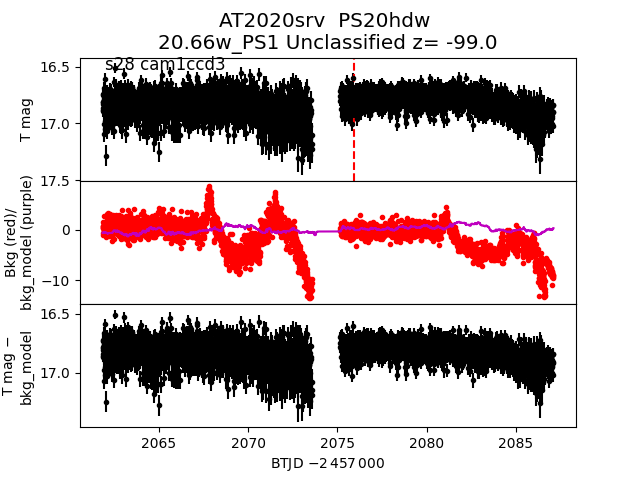
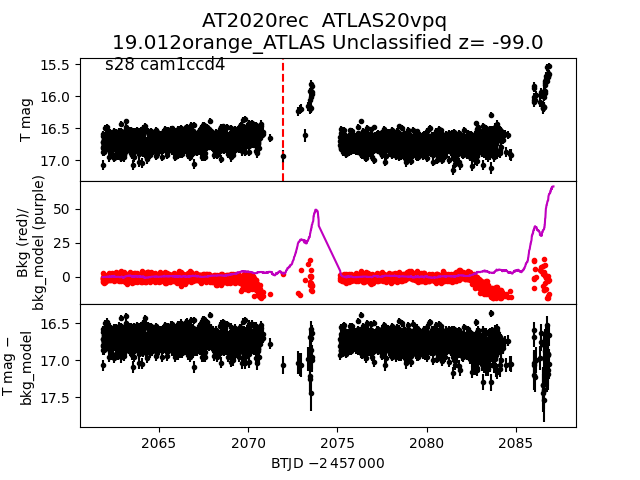
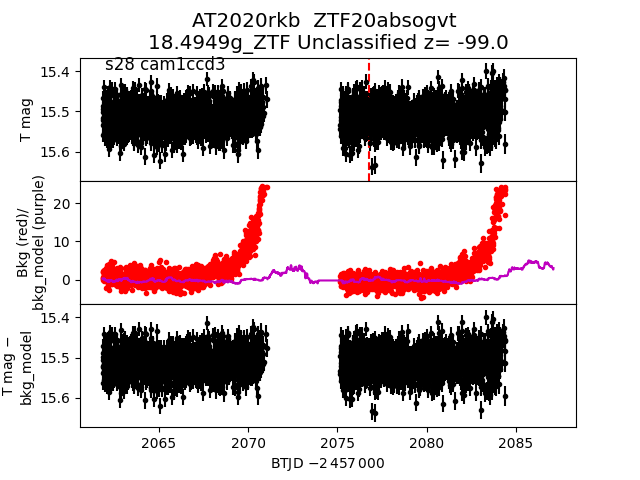
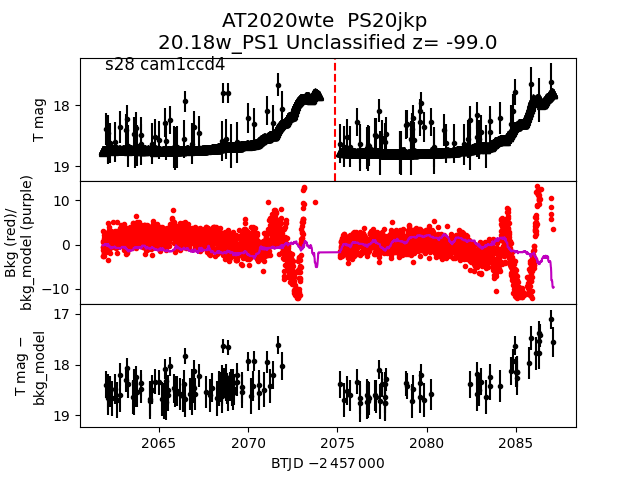
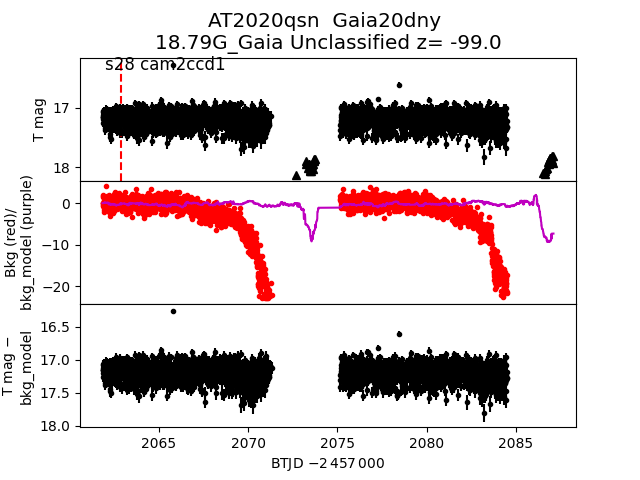
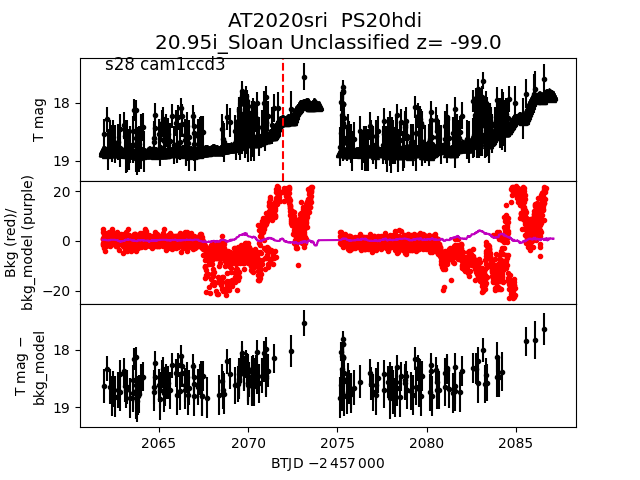
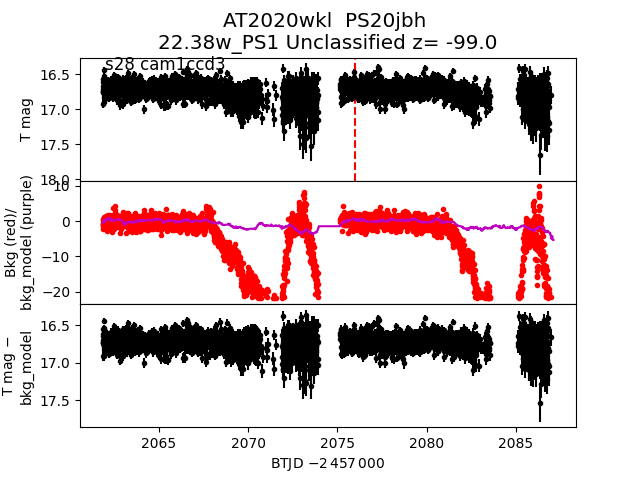
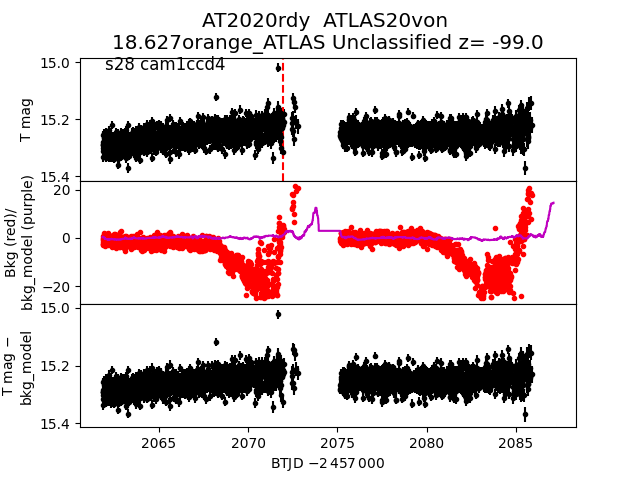
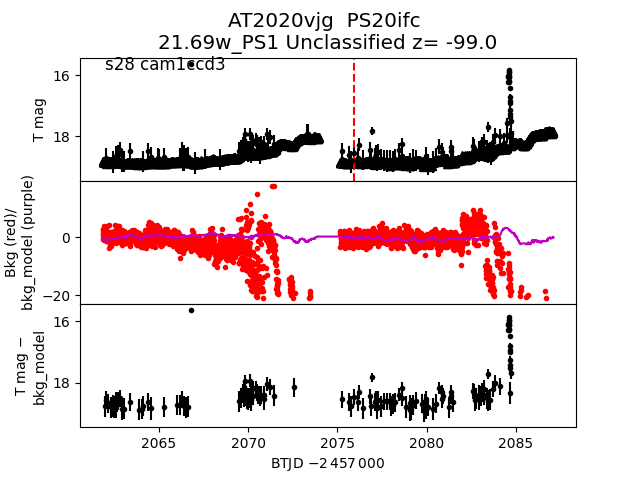
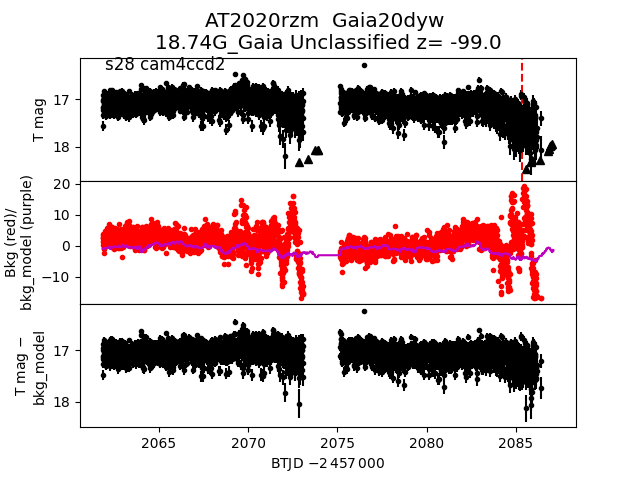
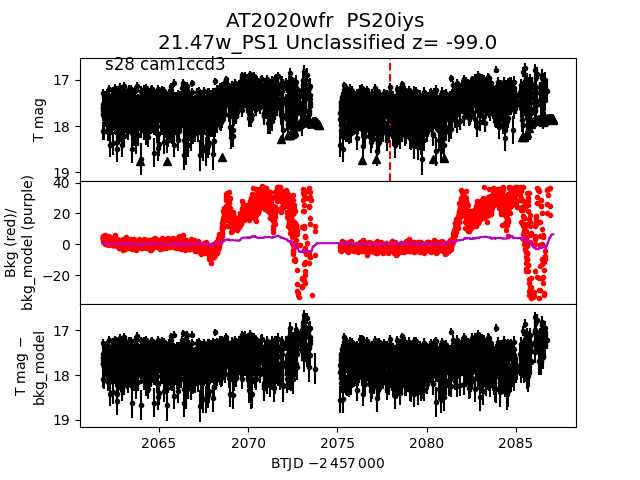
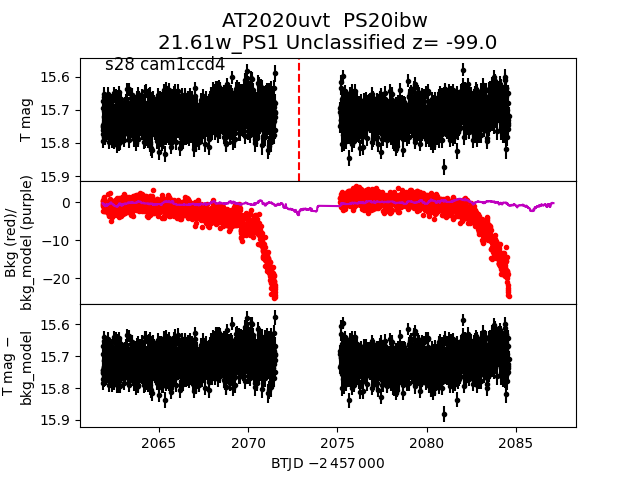
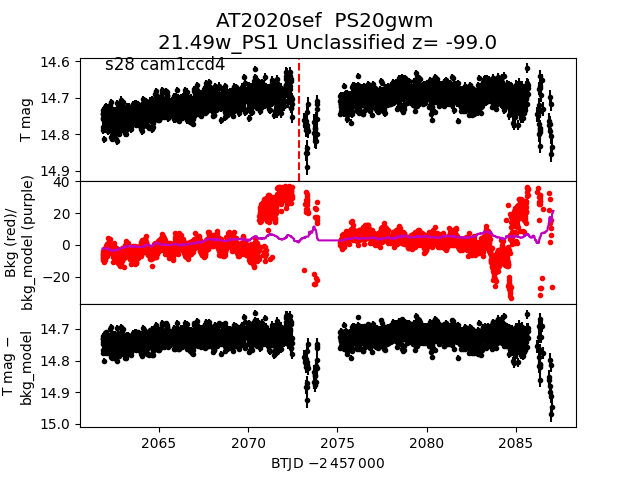
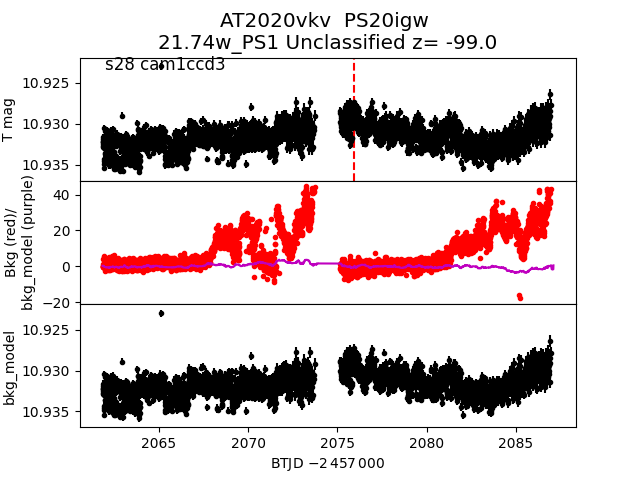
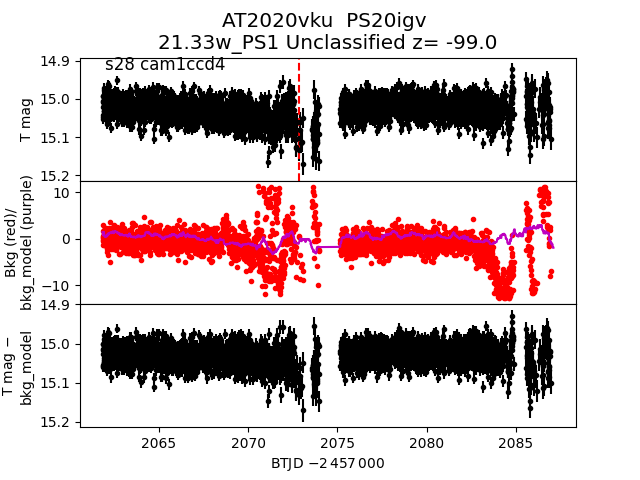
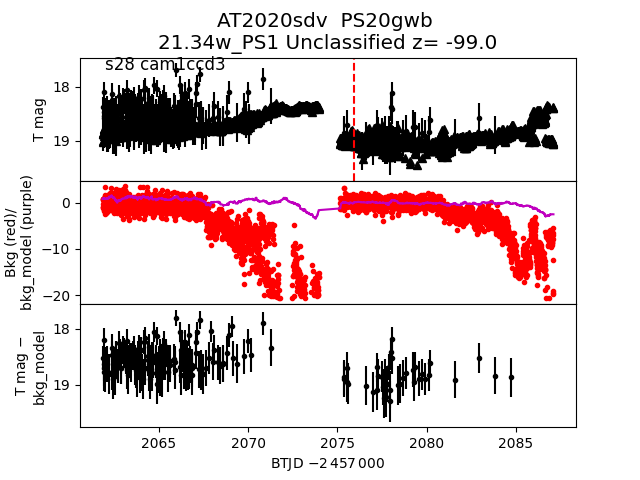
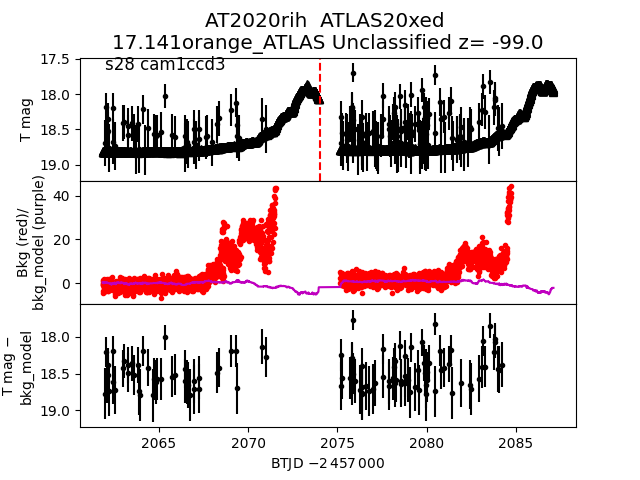
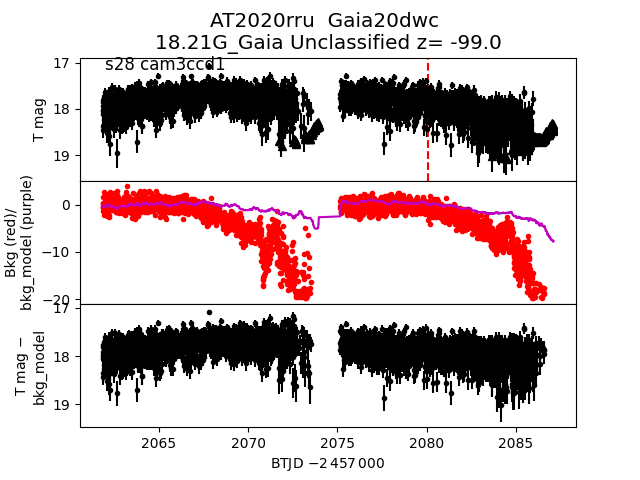
Each figure has three panels. The top panel shows the transient light curve, the middle panel shows the local background (estimated in an annulus), and the bottom panel shows a "background-model corrected" light curve. Details about the background model are in the README.
The vertical red line marks the time of discovery reported to TNS. Other useful metadata from TNS is in the figure title.
Note that the top and bottom panel are in magnitudes, while the middle panel is in differential flux units. The magnitudes are calibrated to the flux in the reference image used for image subtraction. Thus, flux from the host galaxy is included in these magnitudes.
3-sigma upper limits are plotted as triangles with no errorbars. A typical limiting magnitude is 19.6 in 30 minutes or 18.4 in 200 seconds (for low backgrounds).
The links allow you to download the light curve data as a text file.
More details in the README.
2020uic
 2020wvh
 2020rzv
 2020txl
 2020vxx
 2020rld
 2020rtm
 2020ruw
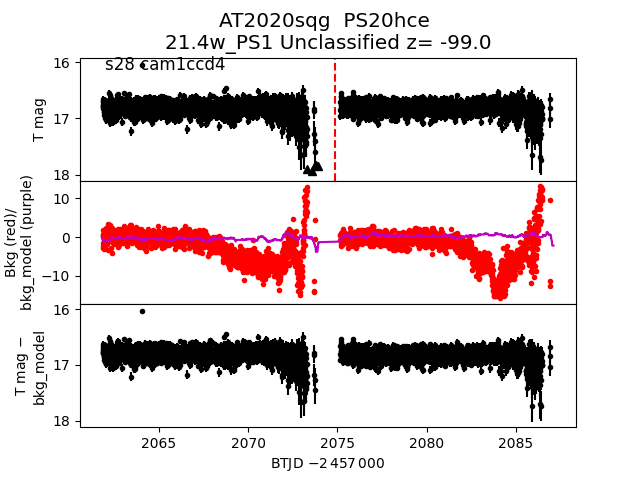
 2020sqg
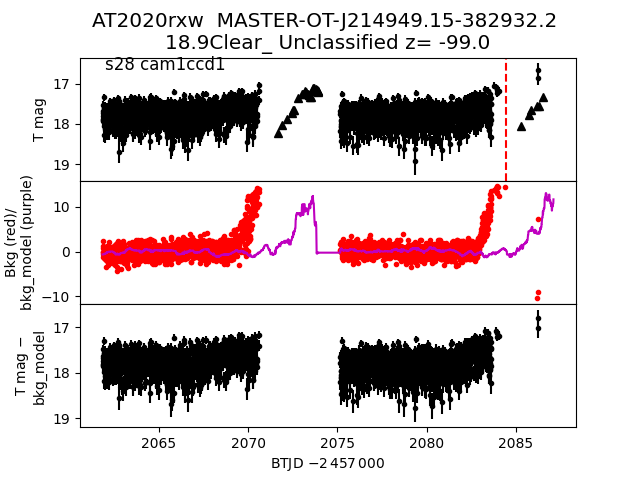
 2020rxw
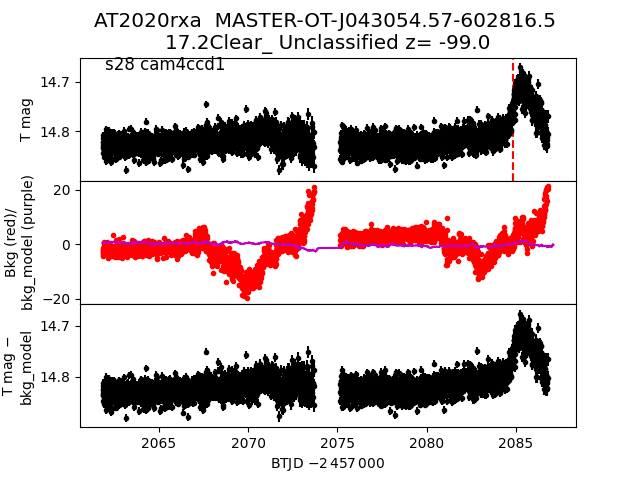
 2020rxa
 2020rub
 2020sqq
 2020ujn
 2020rtt
 2020srv
 2020rec
 2020rkb
 2020wte
 2020qsn
 2020sri
 2020wkl
 2020rdy
 2020vjg
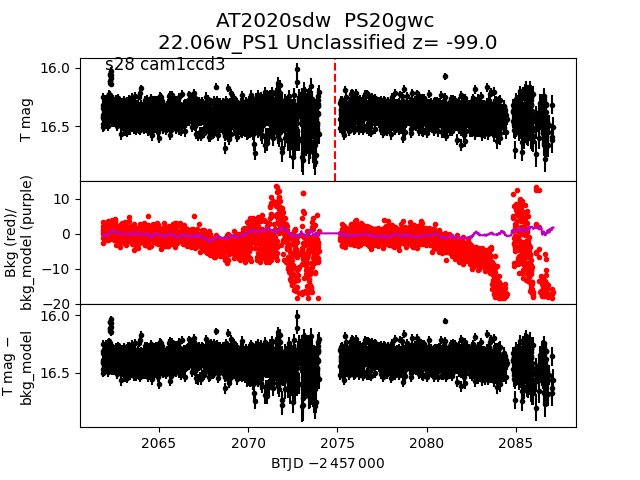
 2020sdw
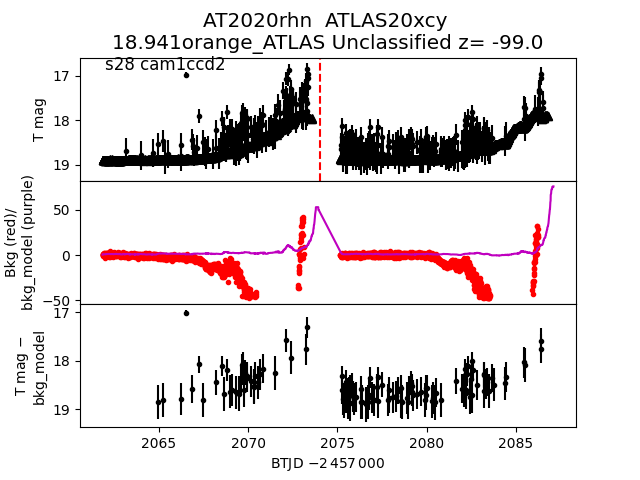
 2020rhn
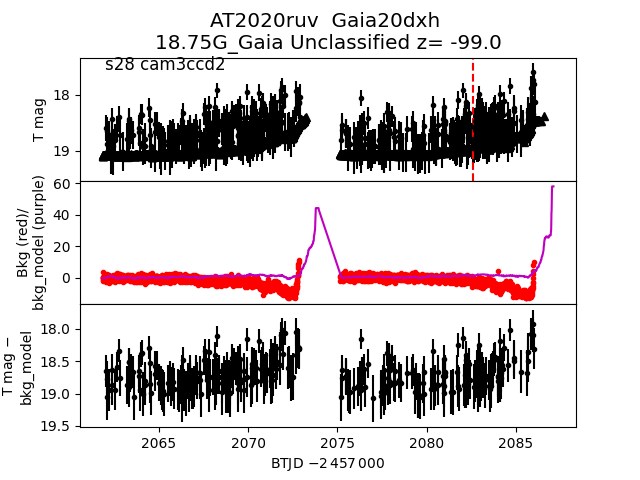
 2020ruv
 2020rzm
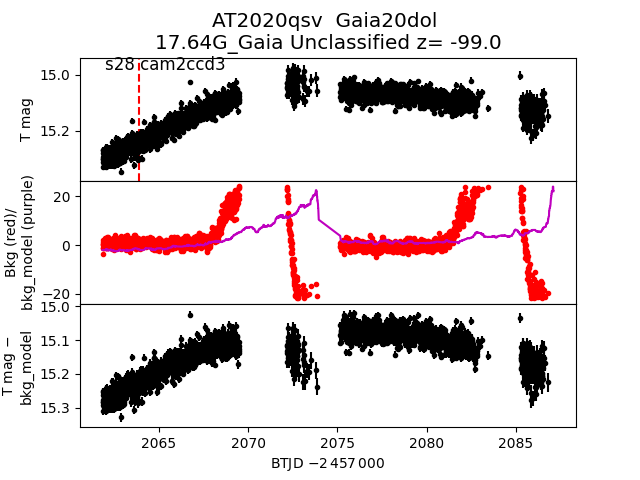
 2020qsv
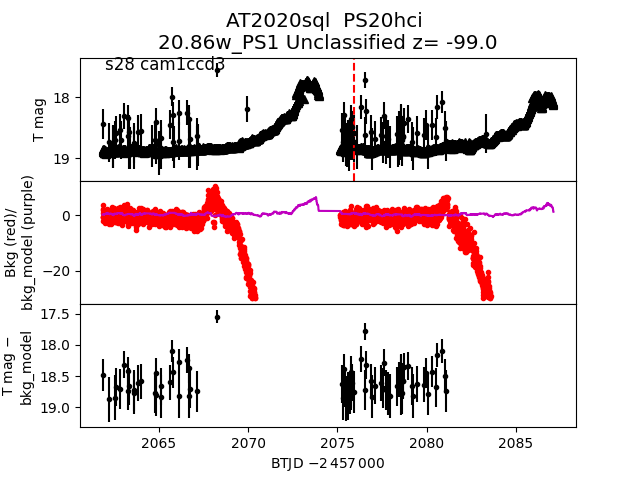
 2020sql
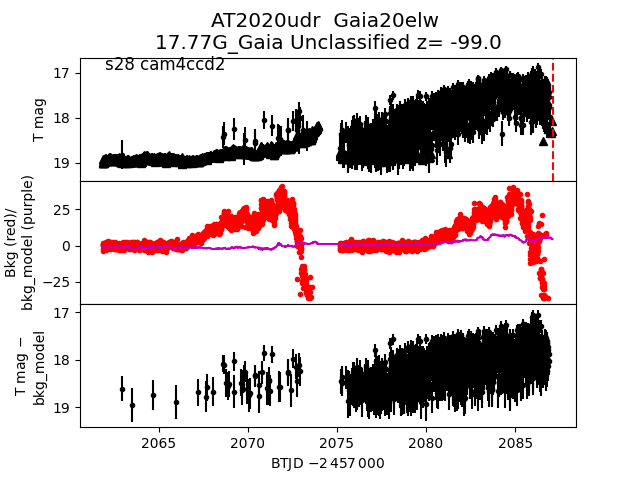
 2020udr
 2020wfr
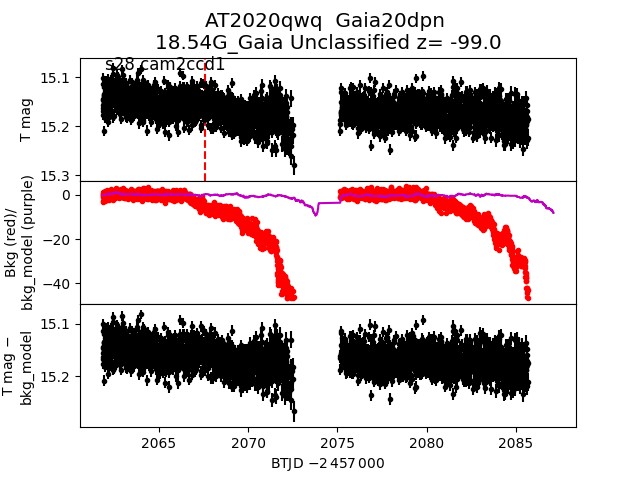
 2020qwq
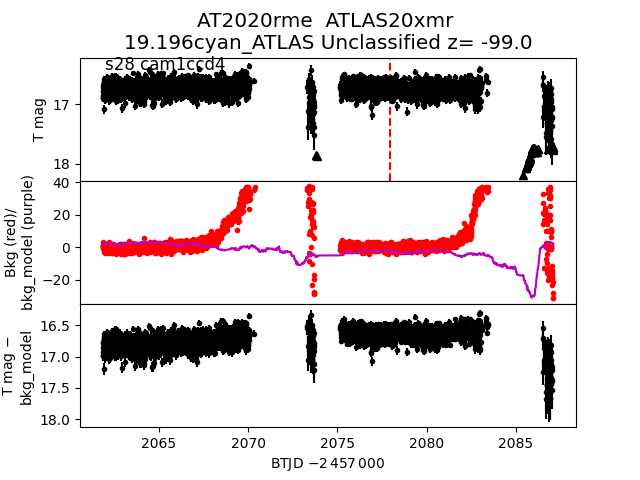
 2020rme
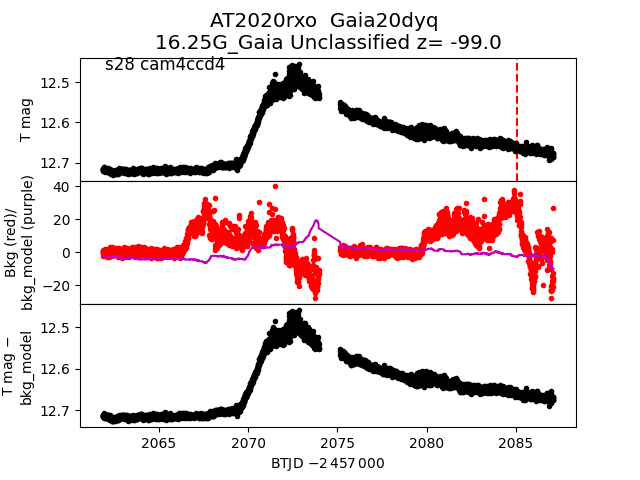
 2020rxo
 2020uvt
 2020sef
 2020vkv
 2020vku
 2020sdv
 2020wtd
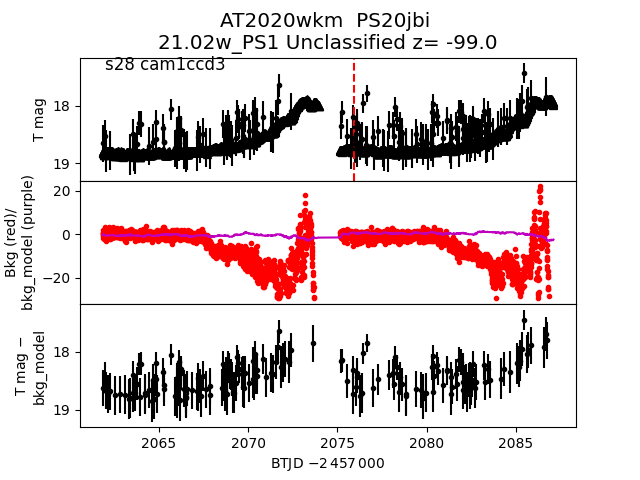
 2020wkm
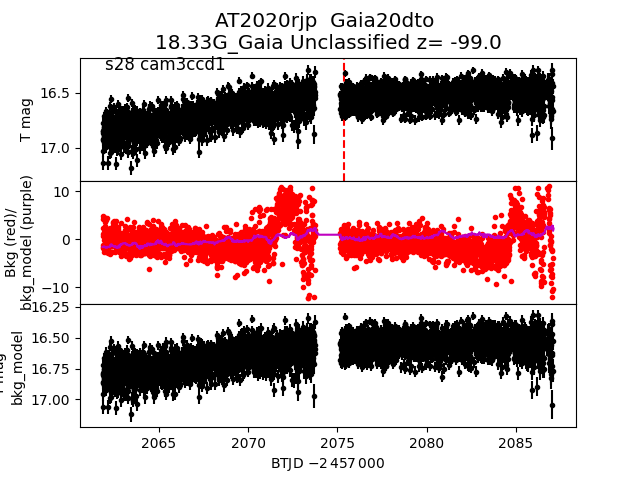
 2020rjp
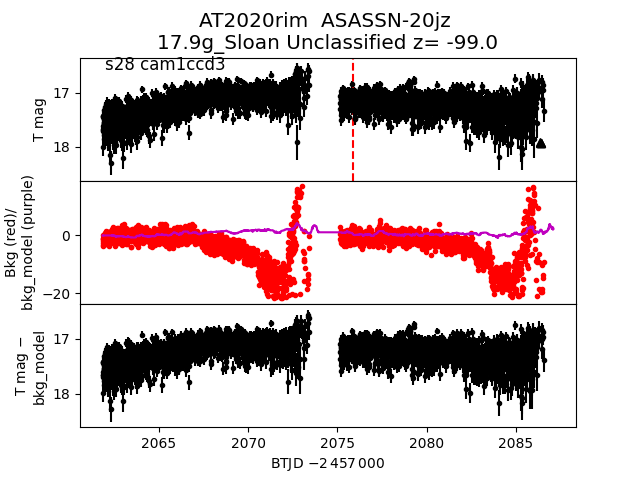
 2020rim
 2020rih
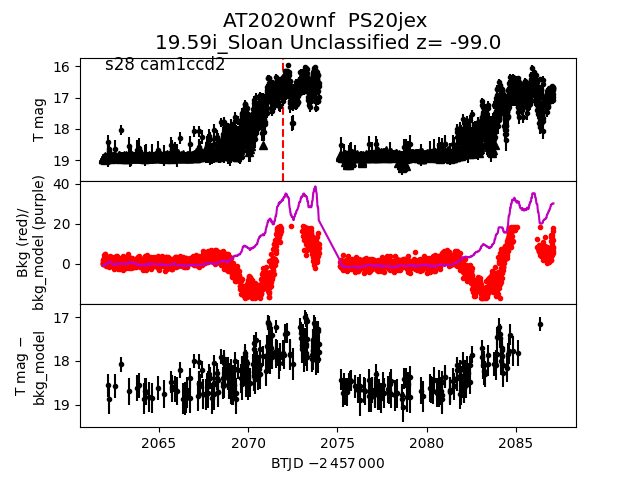
 2020wnf
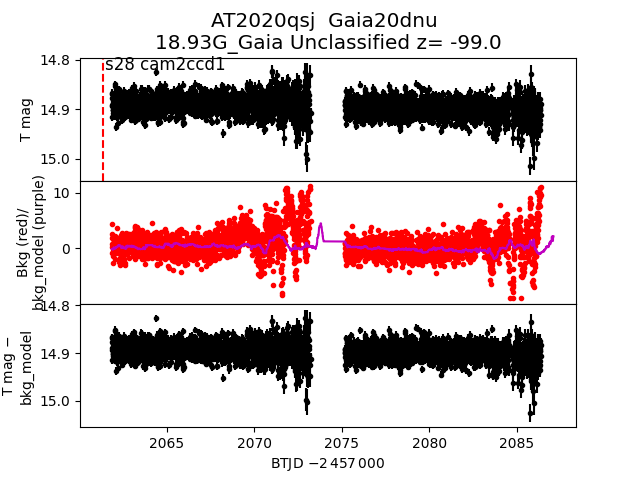
 2020qsj
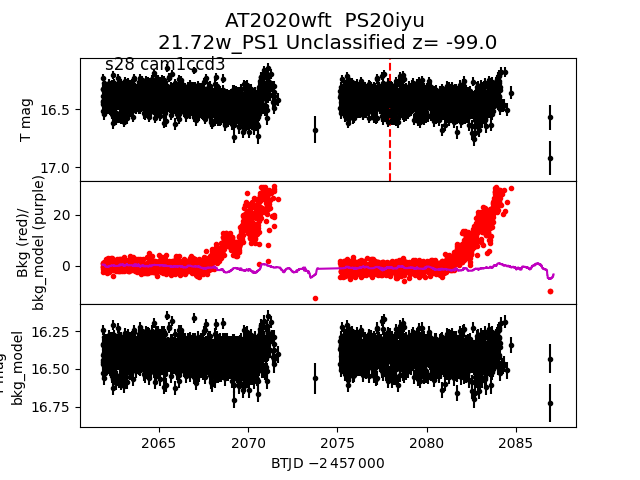
 2020wft
 2020rru
 2020rsy