all transients in sector27 (37 total)
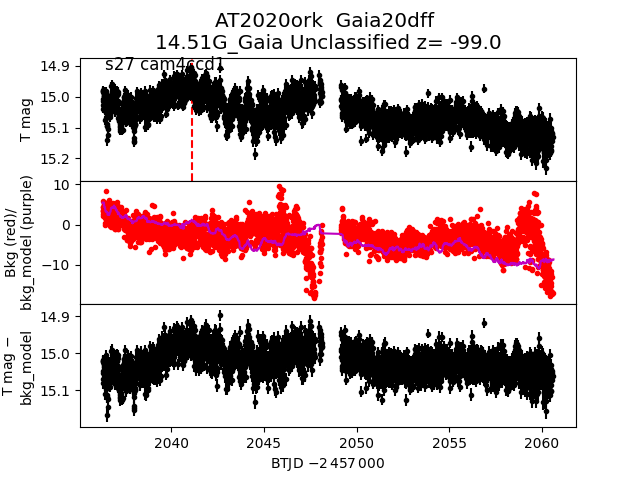
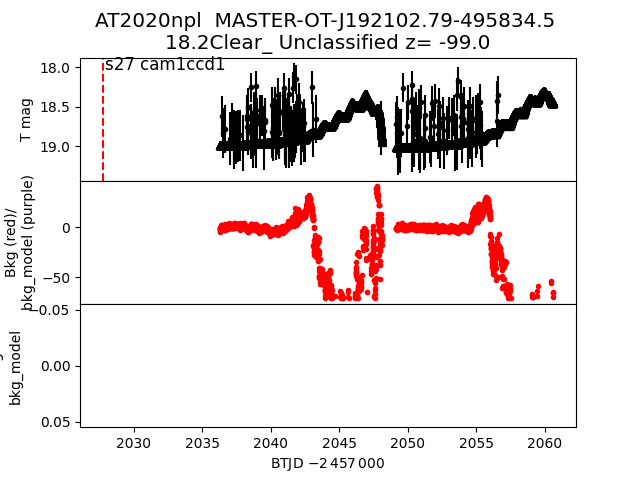
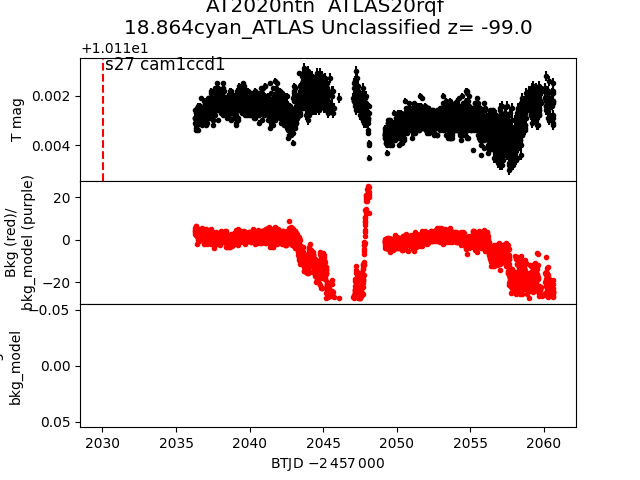
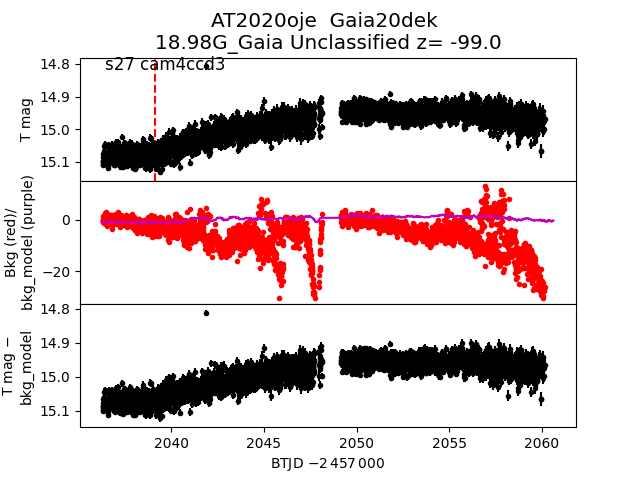
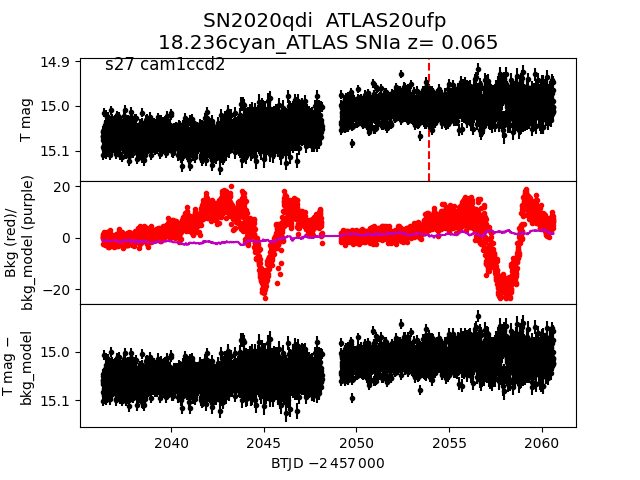
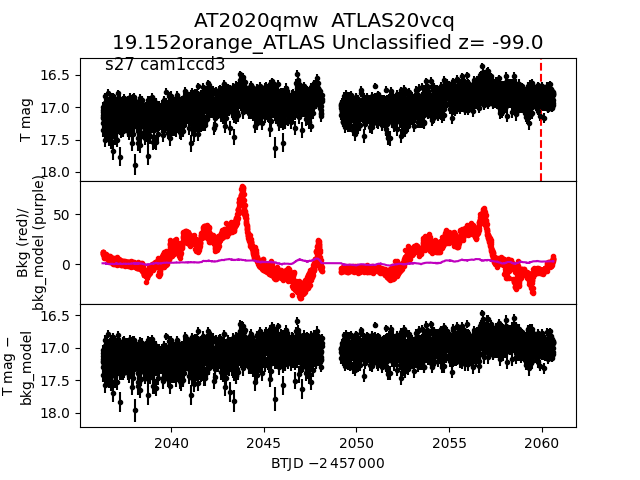
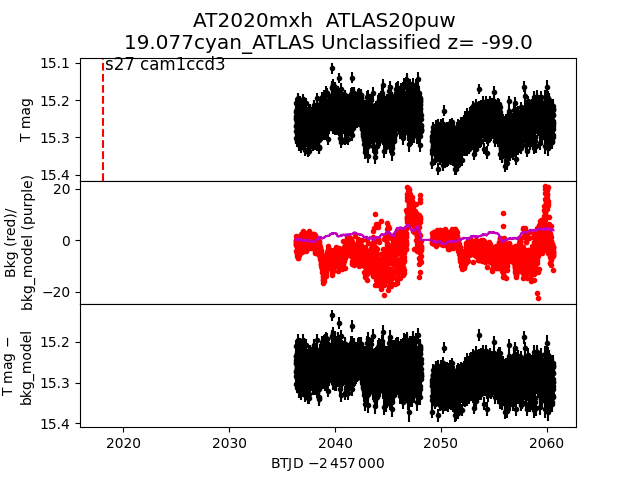
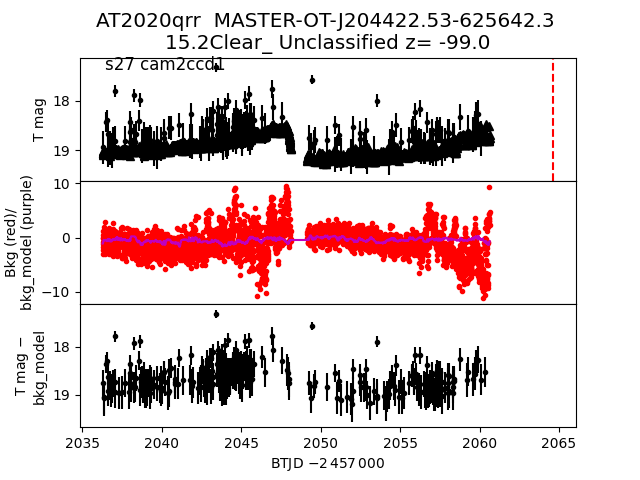
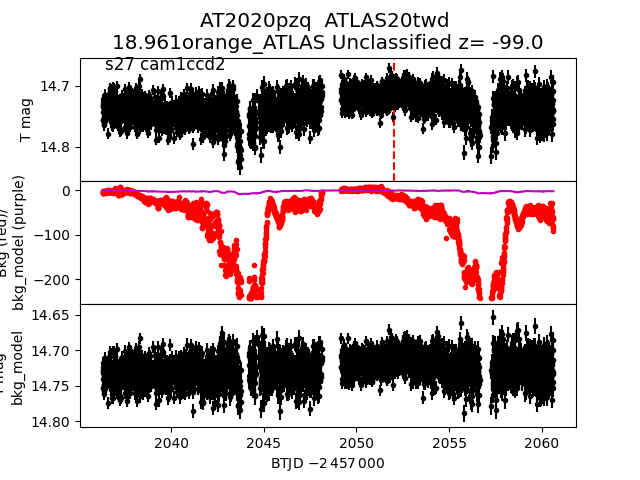
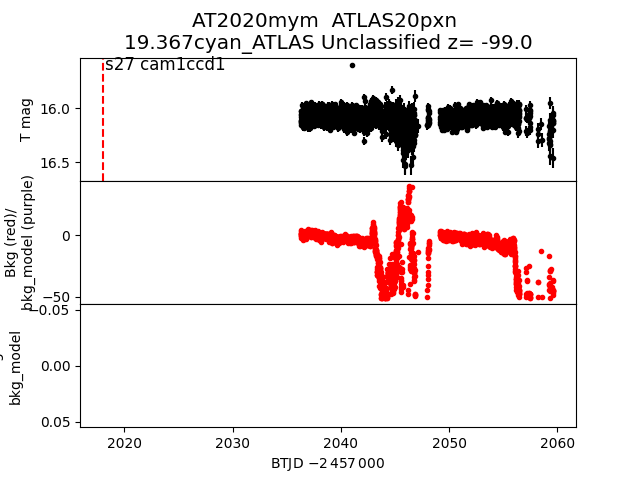
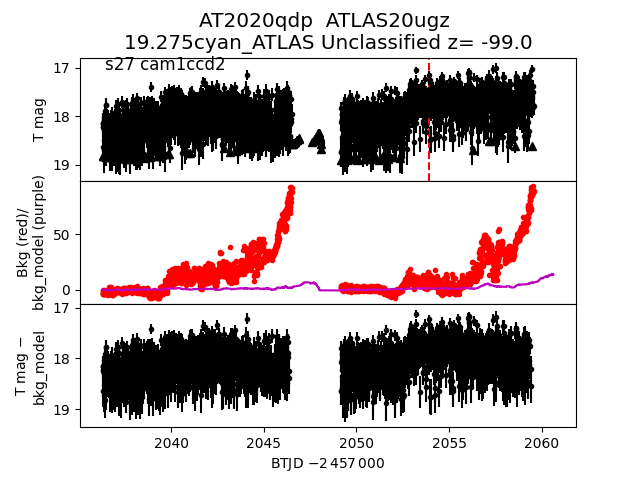
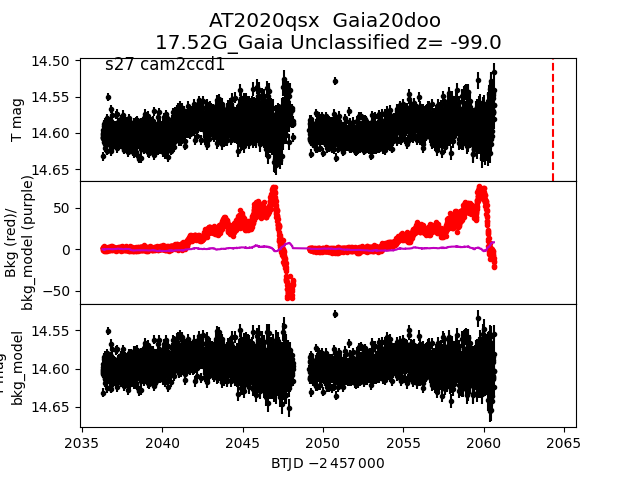
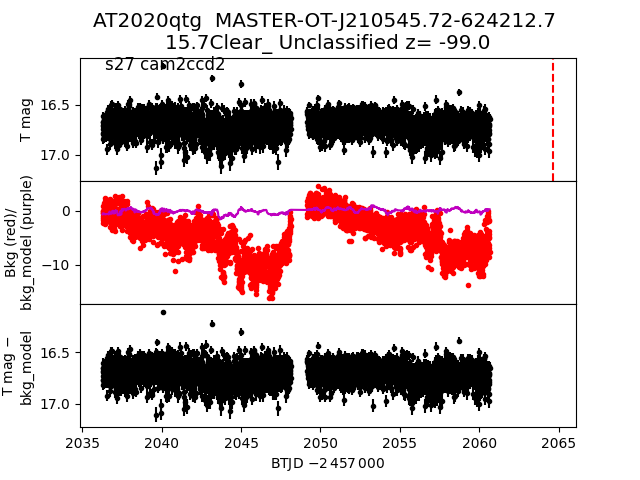
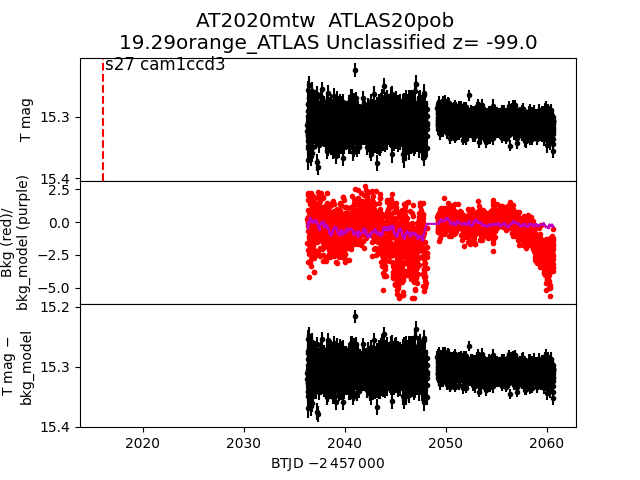
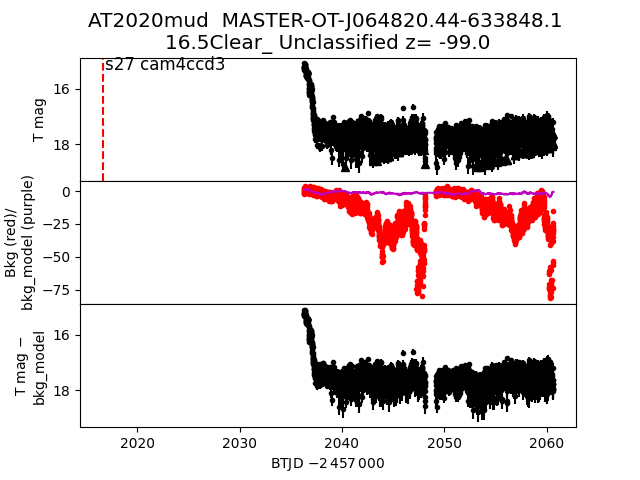
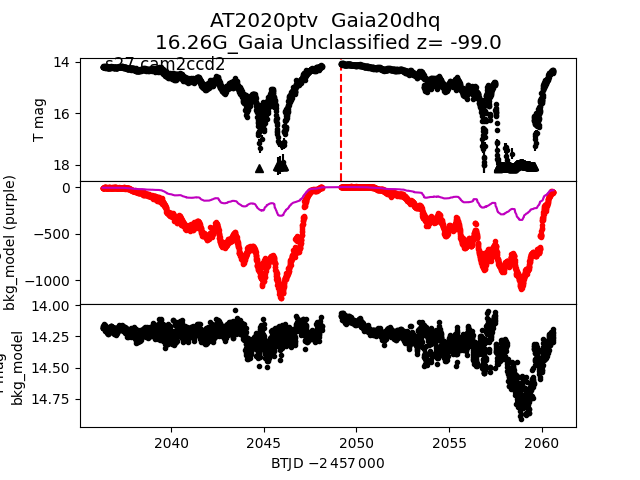
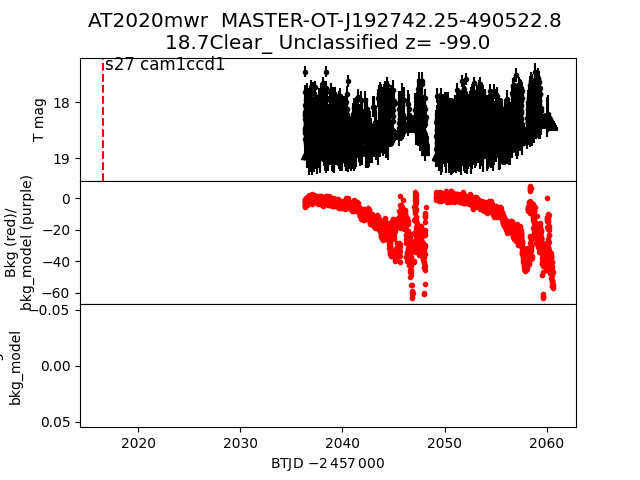
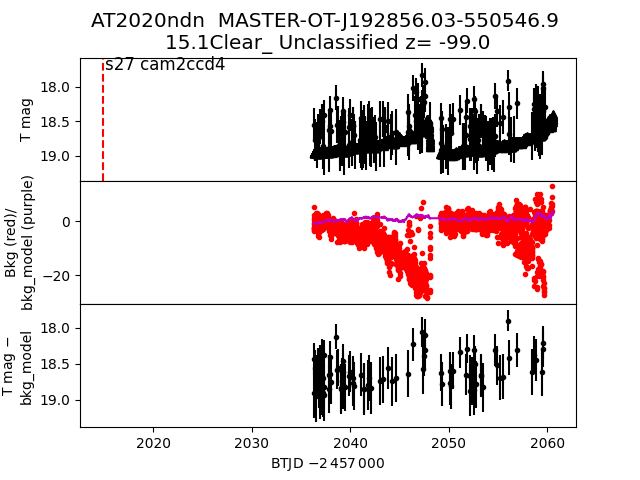
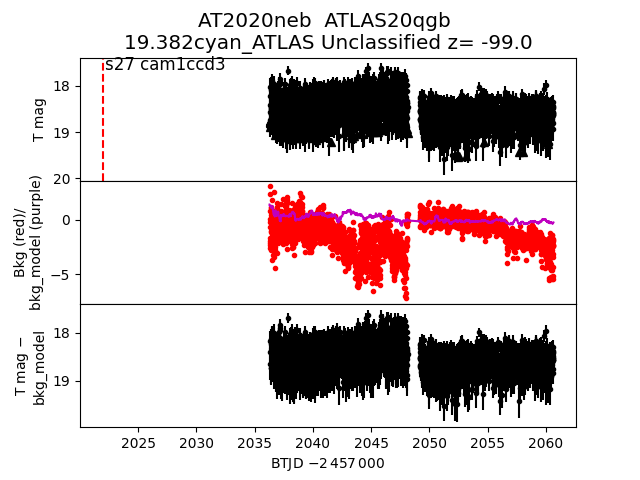
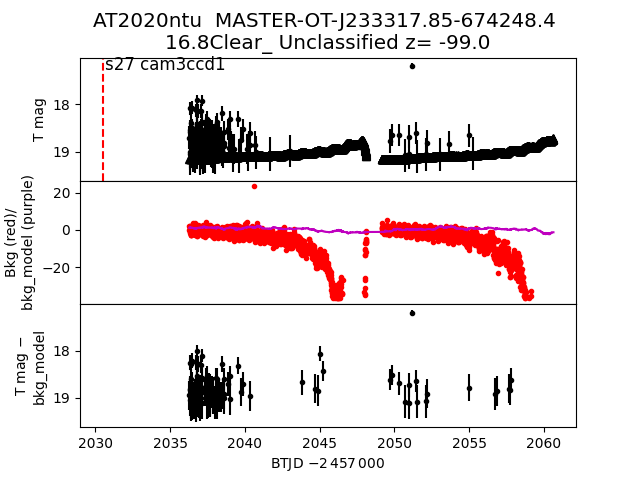
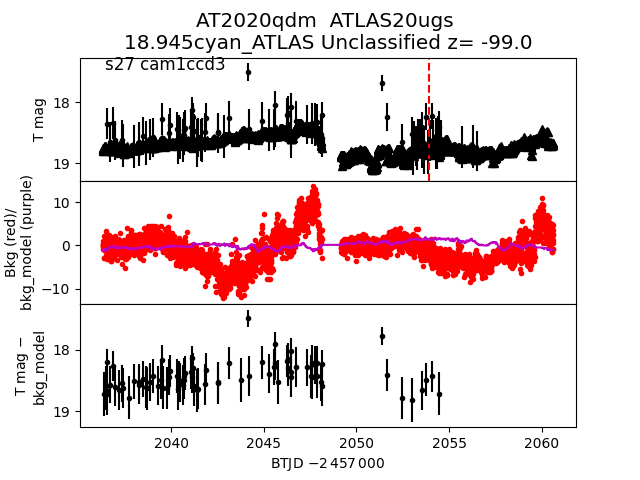
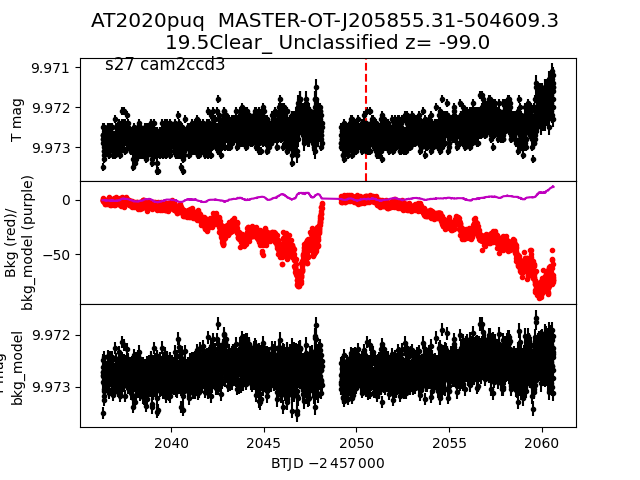
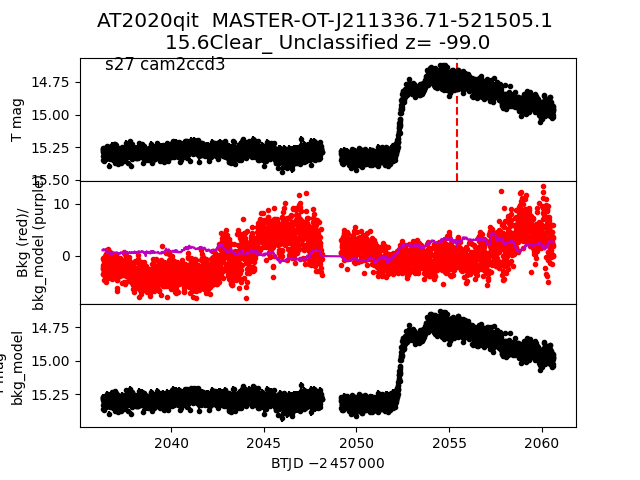
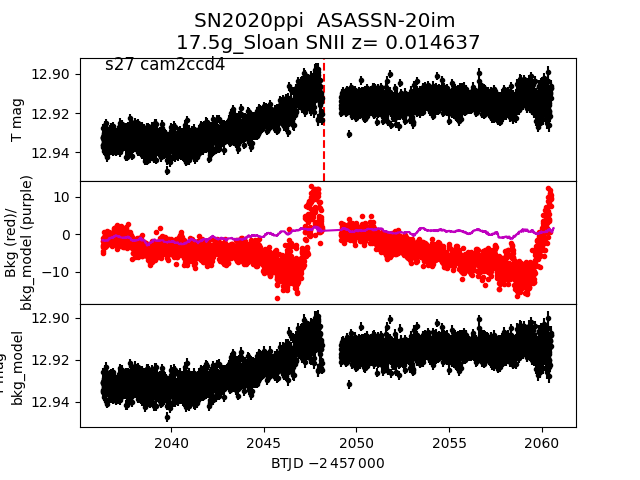
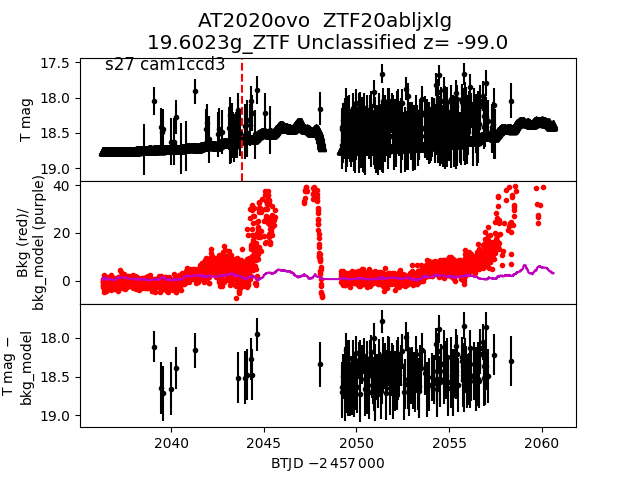
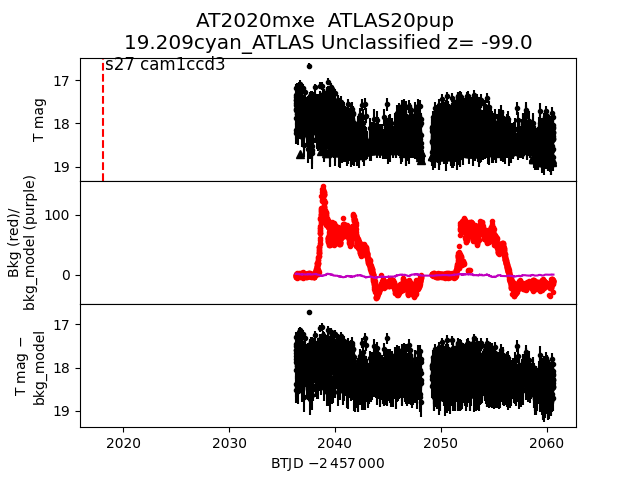
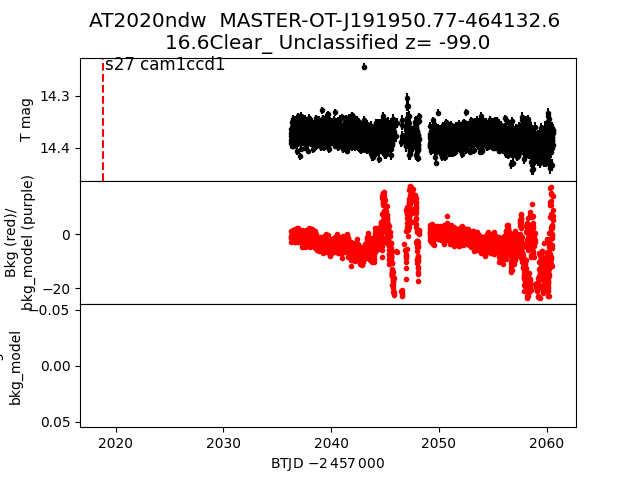
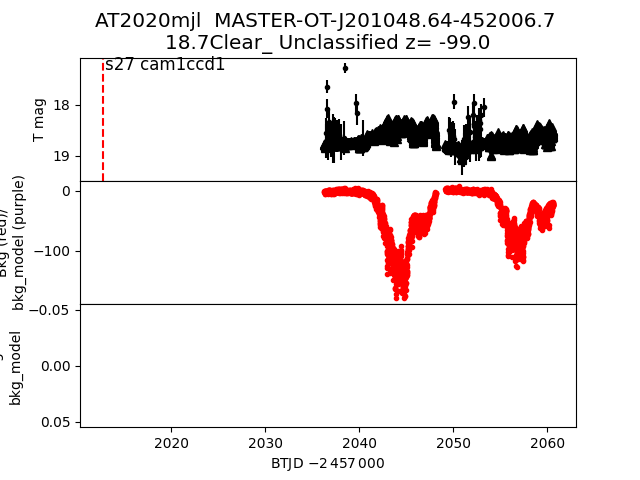
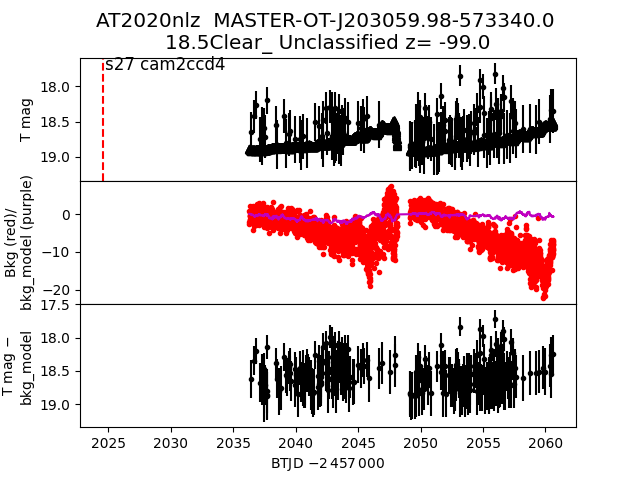
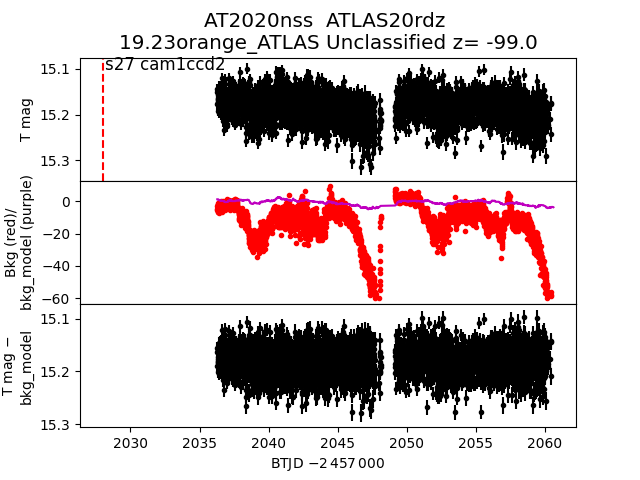
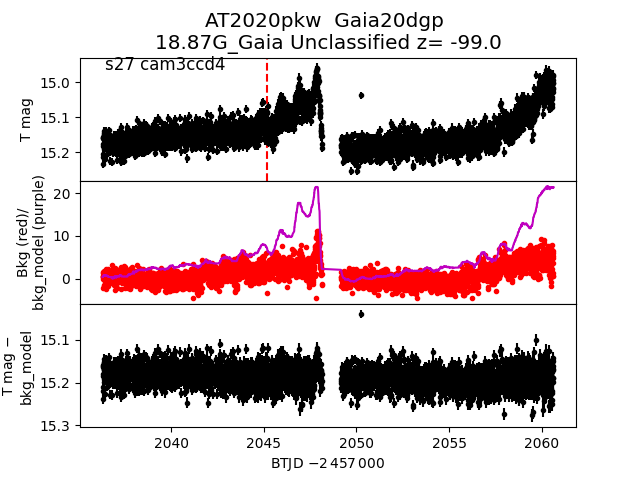
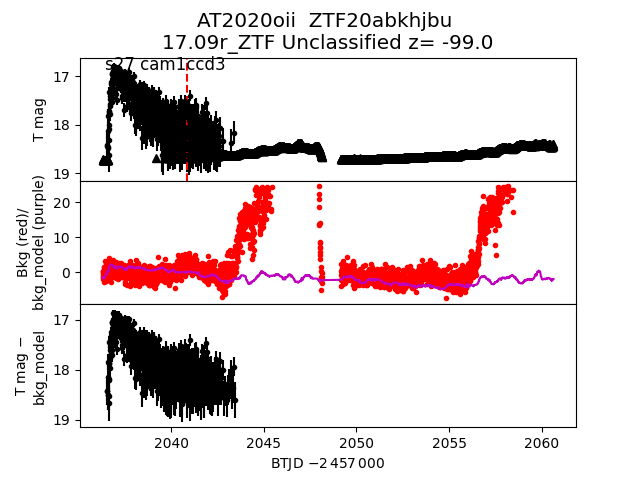
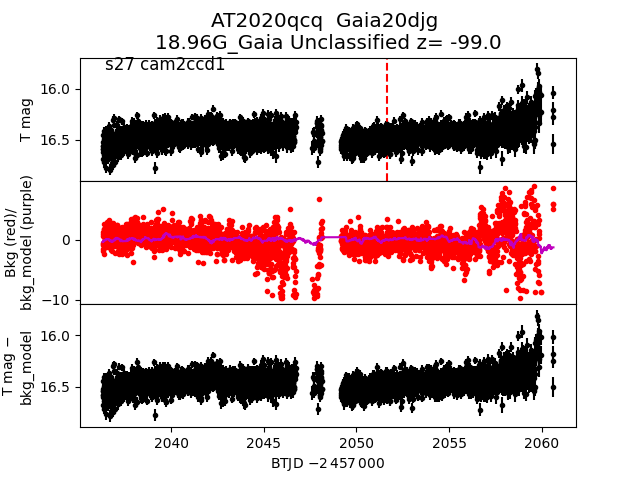
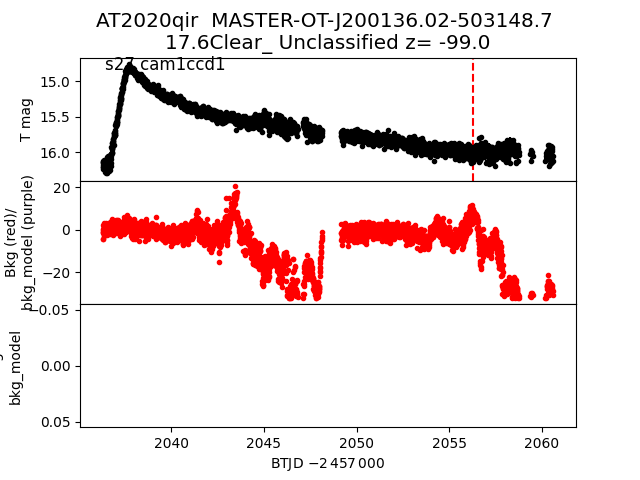
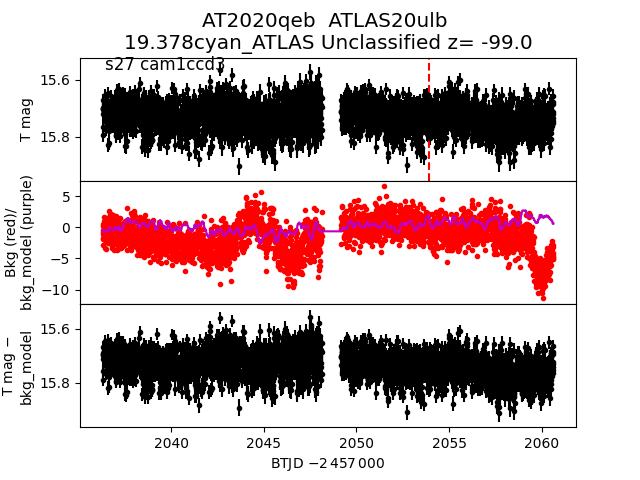
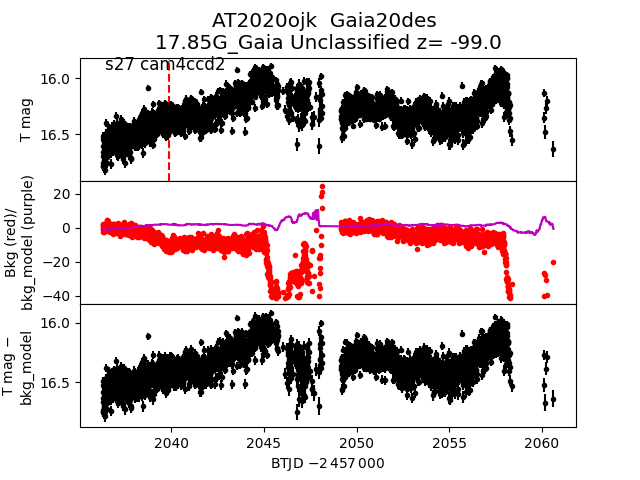
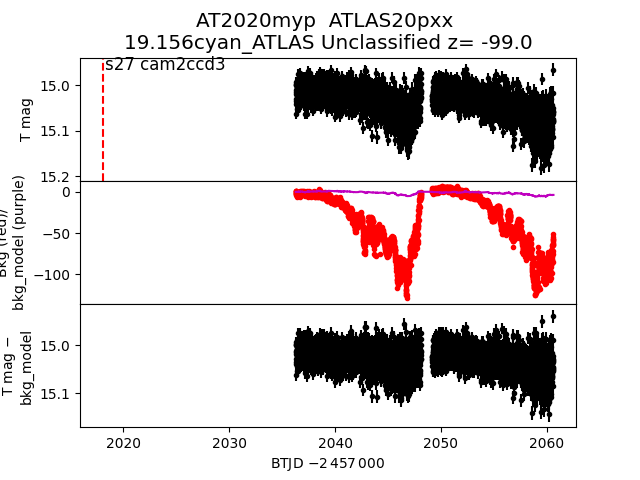
Each figure has three panels. The top panel shows the transient light curve, the middle panel shows the local background (estimated in an annulus), and the bottom panel shows a "background-model corrected" light curve. Details about the background model are in the README.
The vertical red line marks the time of discovery reported to TNS. Other useful metadata from TNS is in the figure title.
Note that the top and bottom panel are in magnitudes, while the middle panel is in differential flux units. The magnitudes are calibrated to the flux in the reference image used for image subtraction. Thus, flux from the host galaxy is included in these magnitudes.
3-sigma upper limits are plotted as triangles with no errorbars. A typical limiting magnitude is 19.6 in 30 minutes or 18.4 in 200 seconds (for low backgrounds).
The links allow you to download the light curve data as a text file.
More details in the README.
2020npl
 2020ntn
 2020oje
 2020qdi
 2020qmw
 2020mxh
 2020qrr
 2020pzq
 2020mym
 2020qdp
 2020qsx
 2020qtg
 2020mtw
 2020mud
 2020ptv
 2020mwr
 2020ndn
 2020neb
 2020ntu
 2020qdm
 2020puq
 2020qit
 2020ppi
 2020ovo
 2020mxe
 2020ndw
 2020mjl
 2020nlz
 2020nss
 2020pkw
 2020oii
 2020qcq
 2020qir
 2020qeb
 2020ojk
 2020myp
 2020ork