all transients in sector26 (75 total)
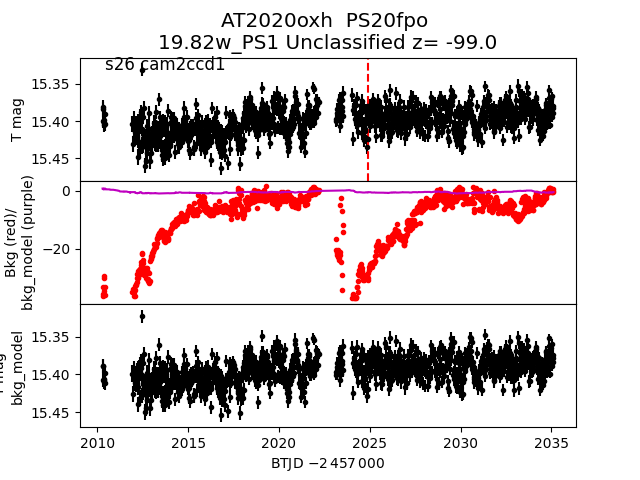
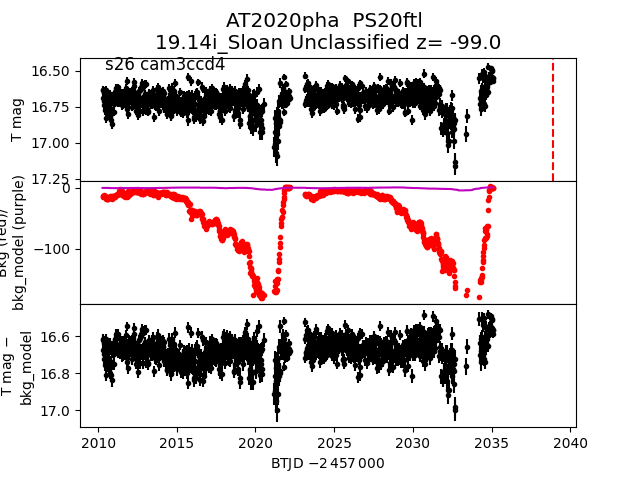
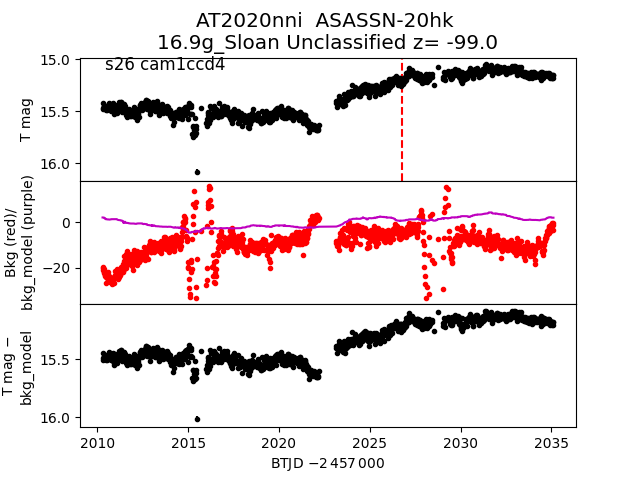
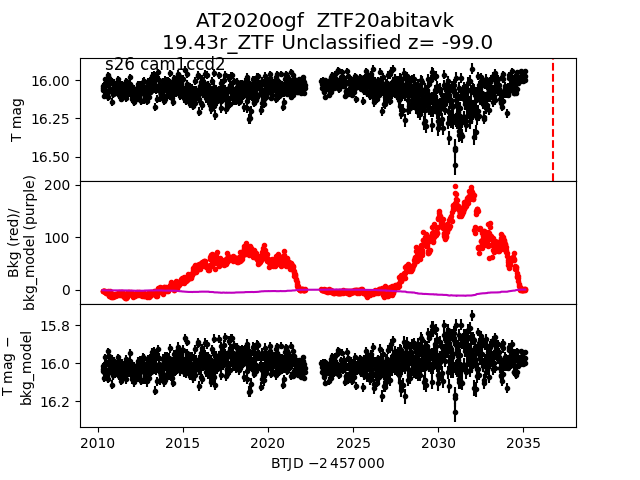
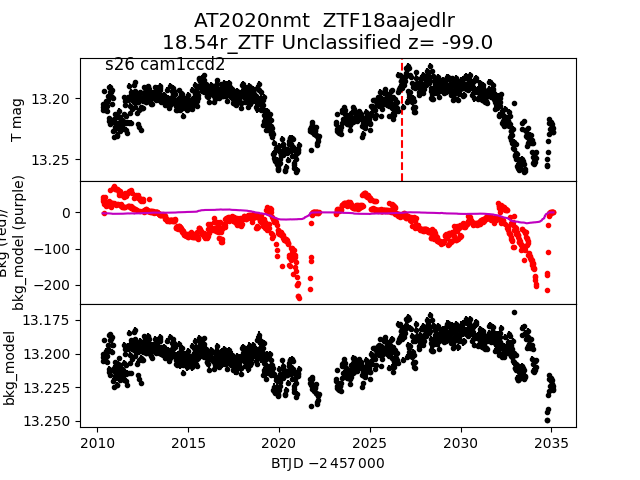
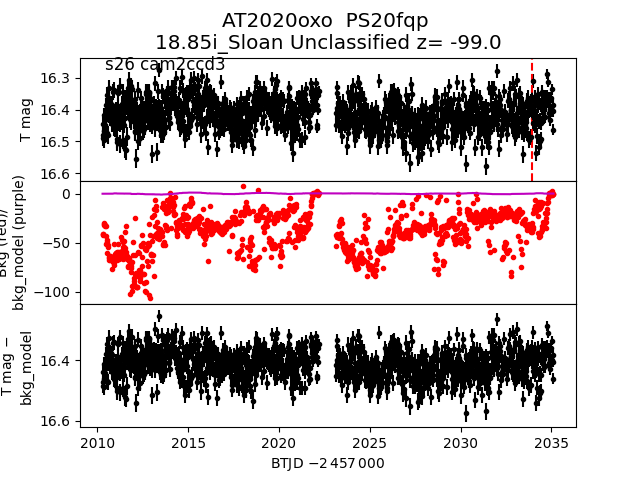
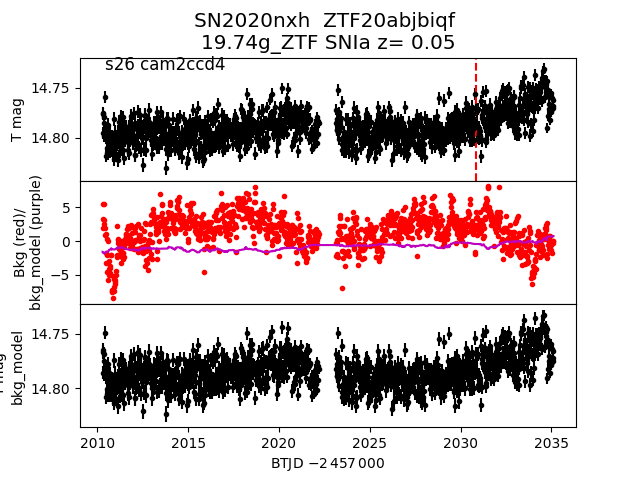
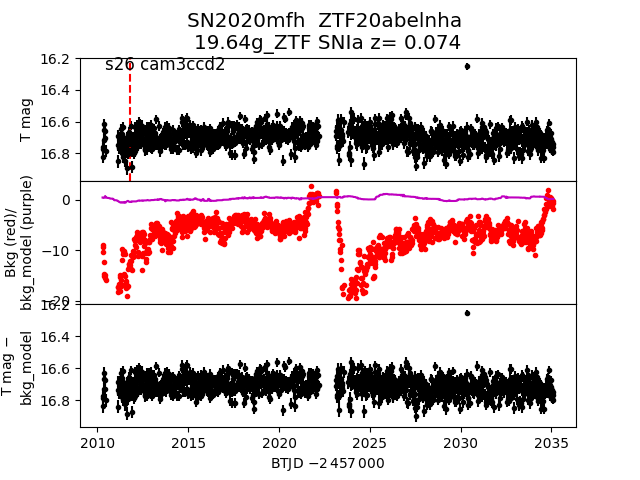
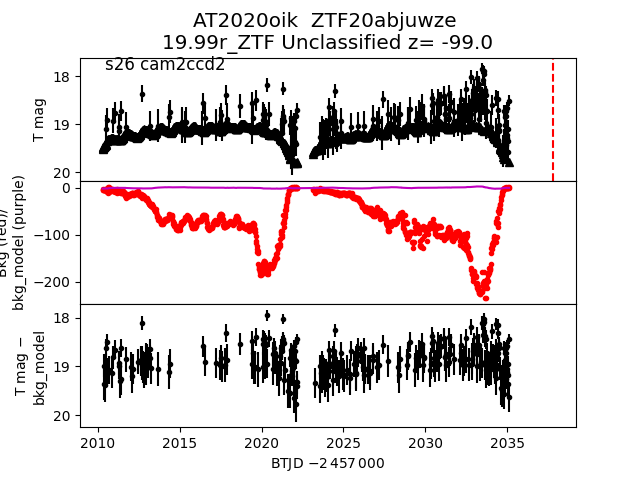
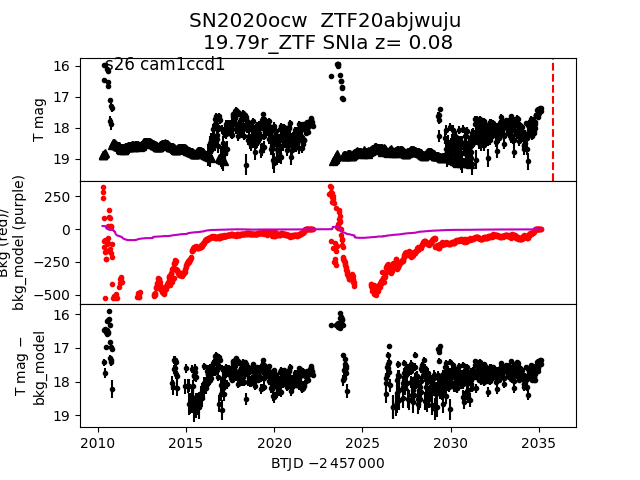
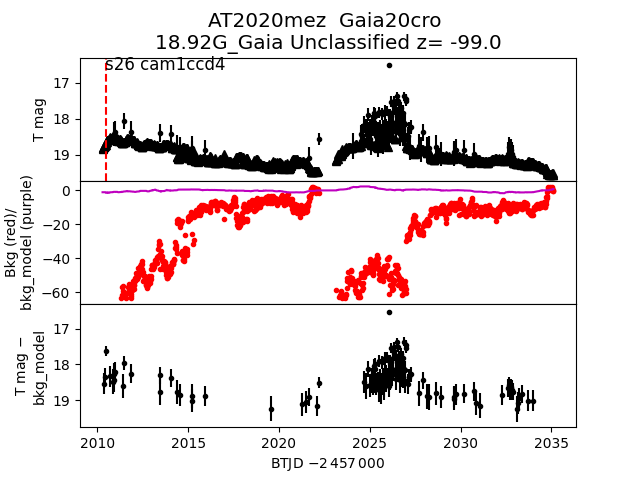
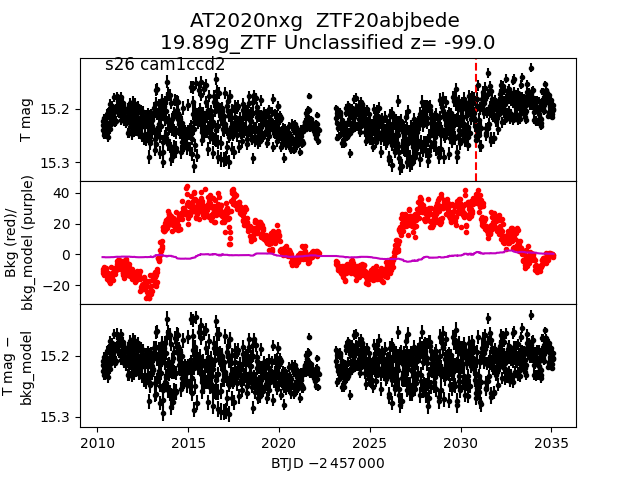
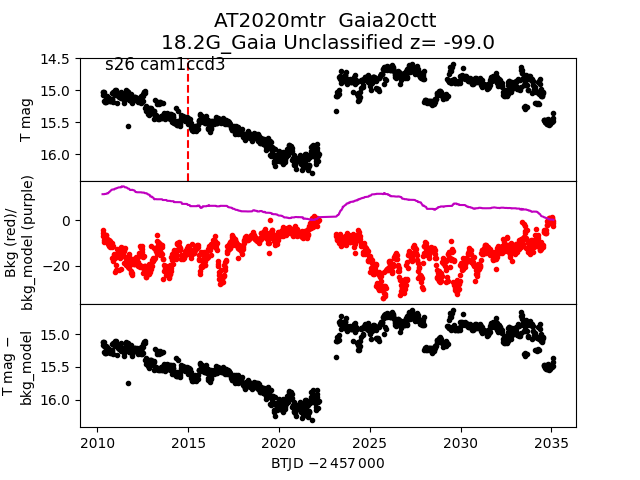
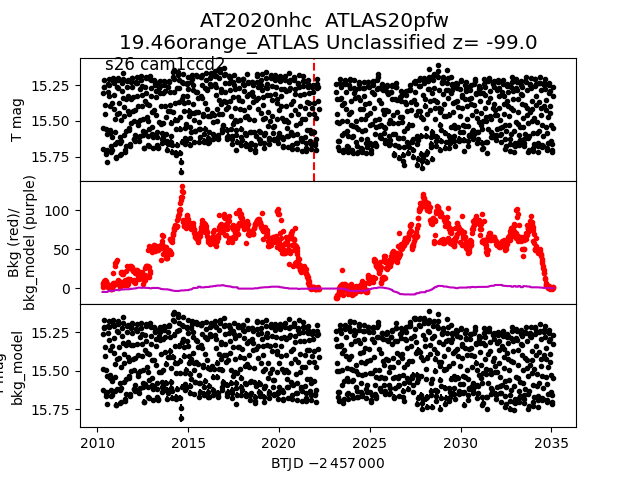
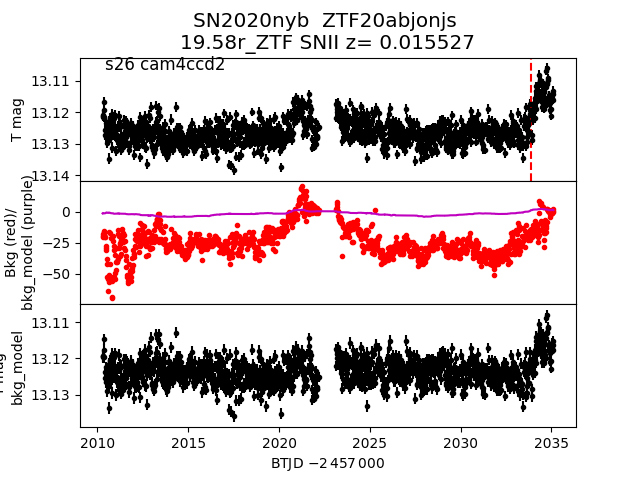
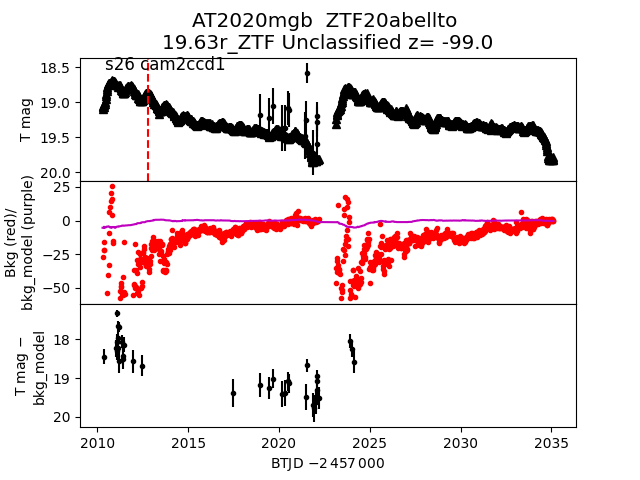
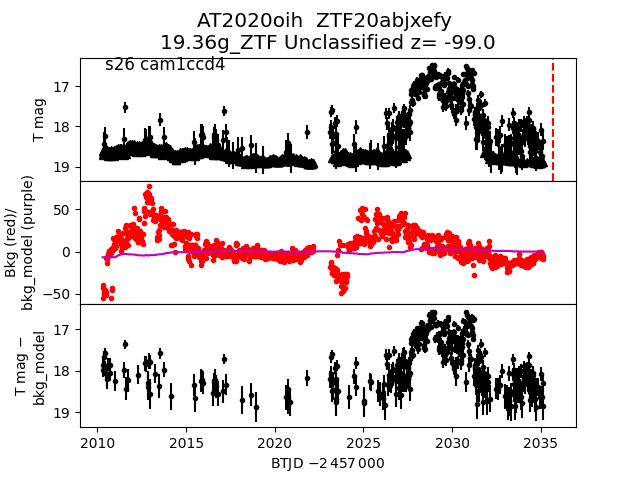
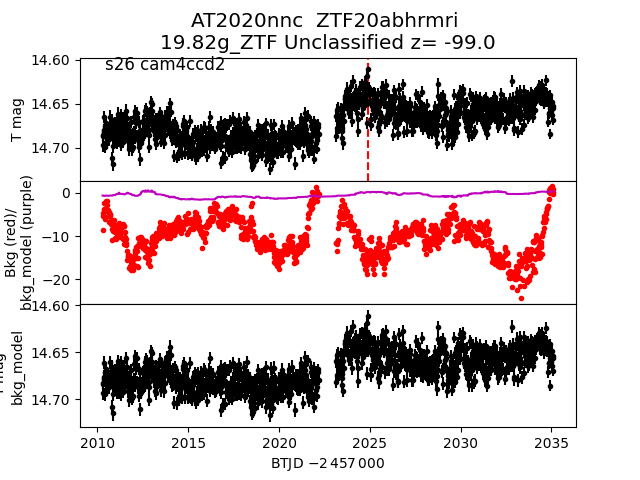
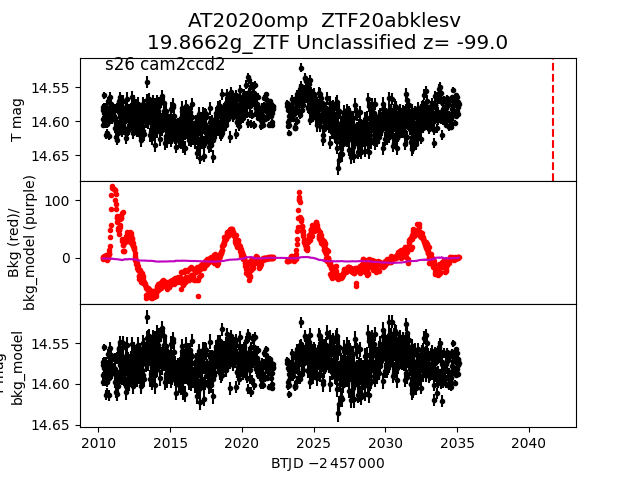
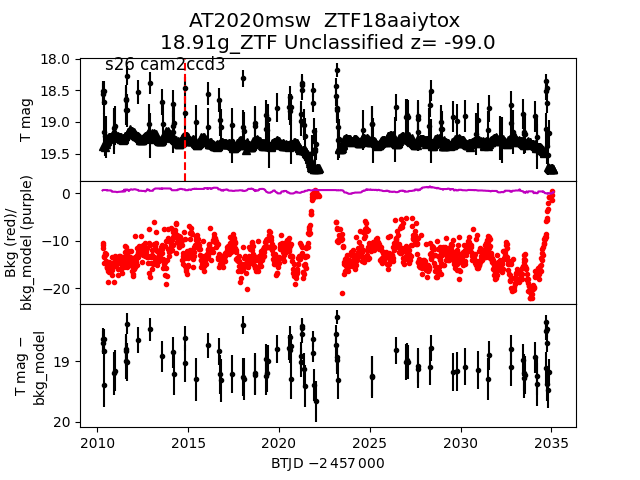
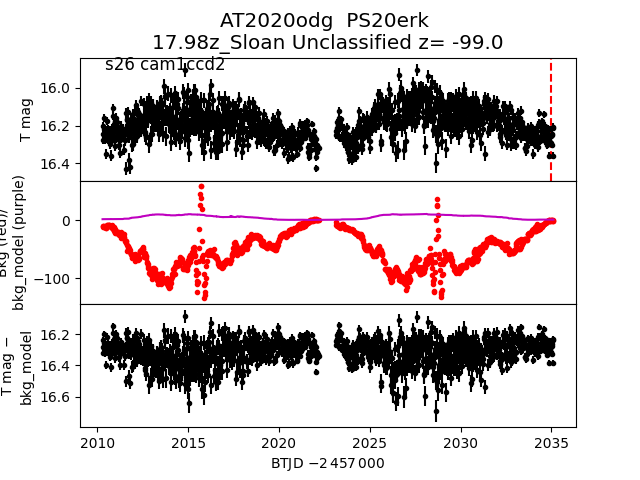
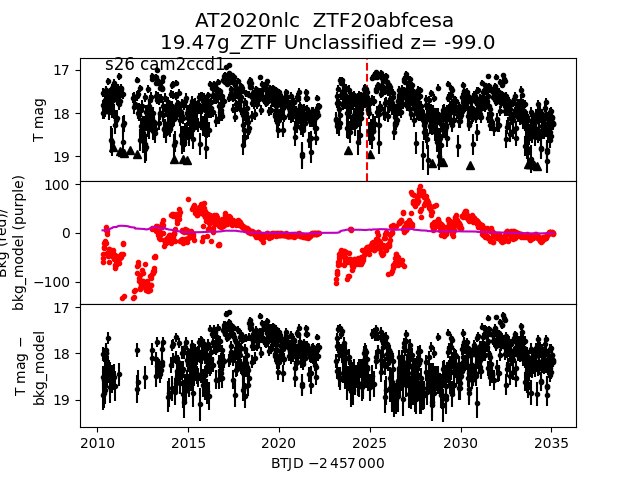
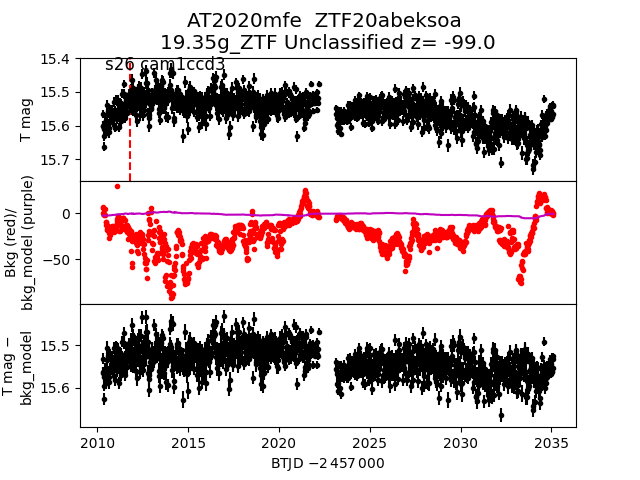
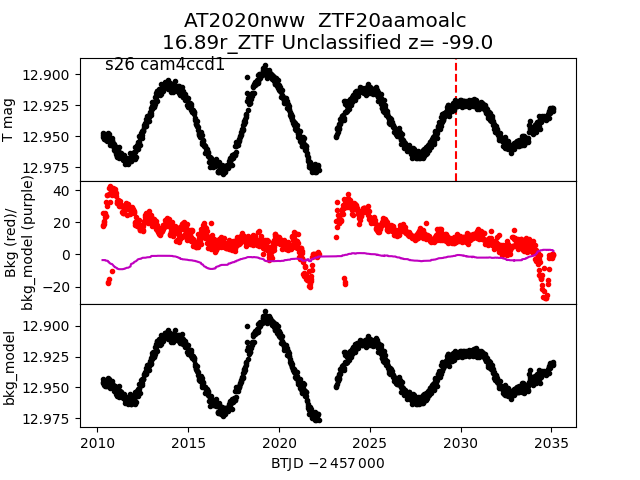
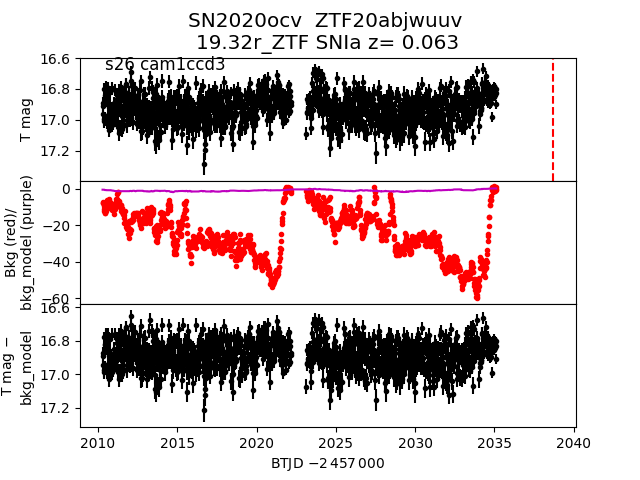
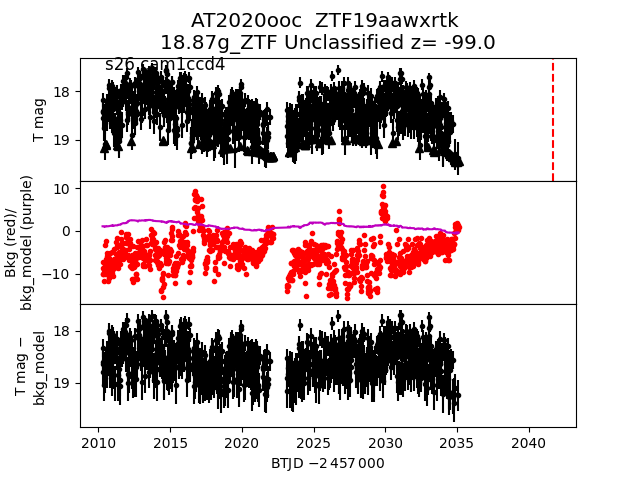
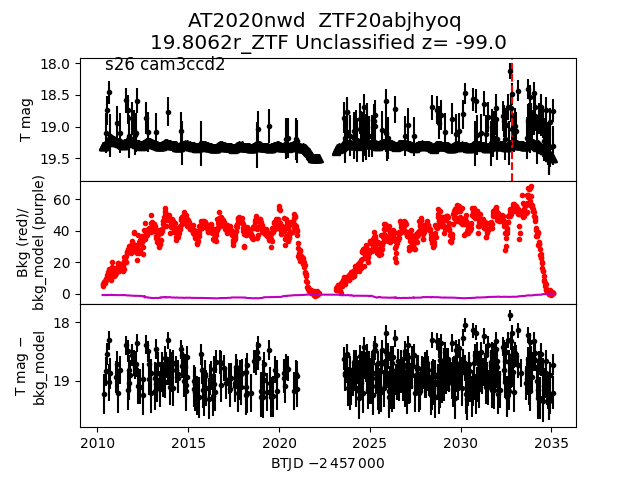
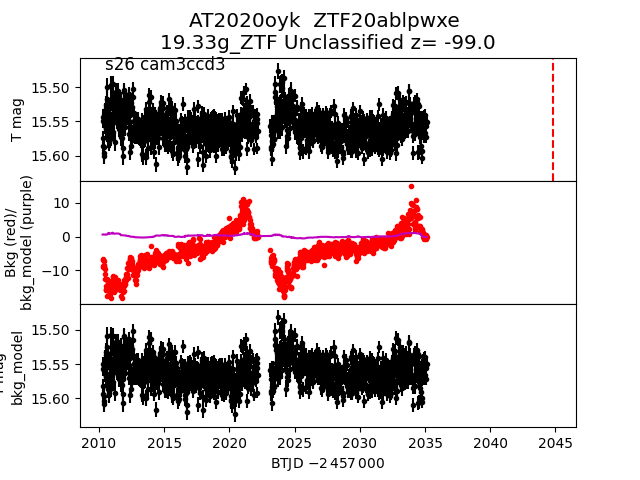
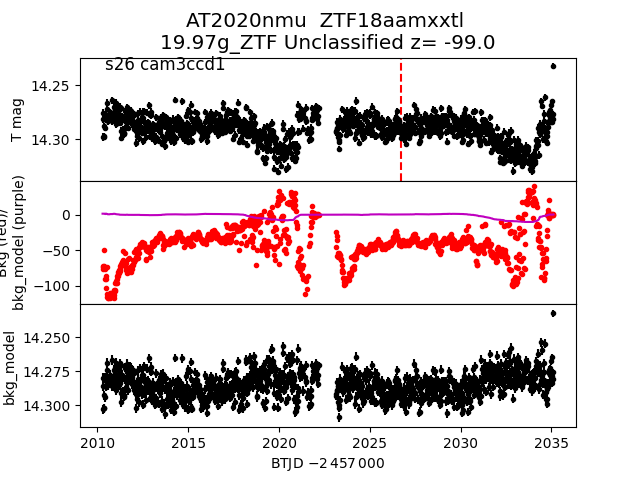
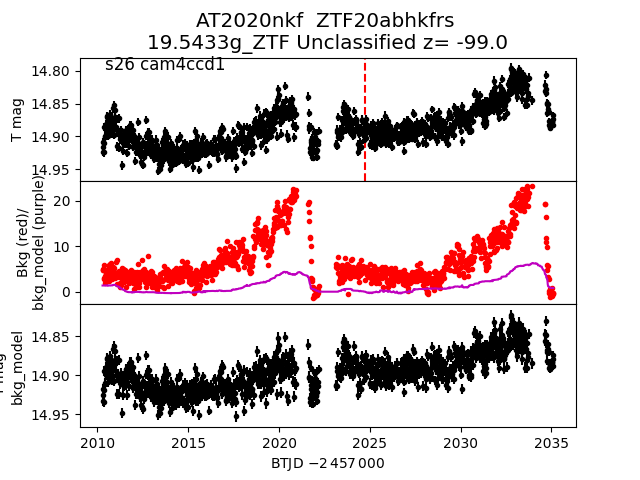
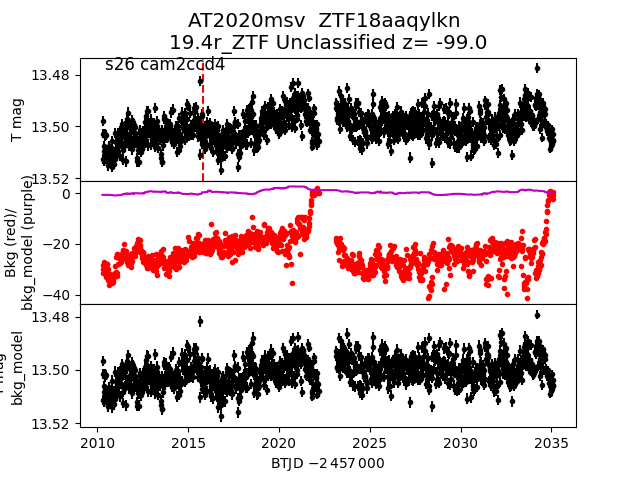
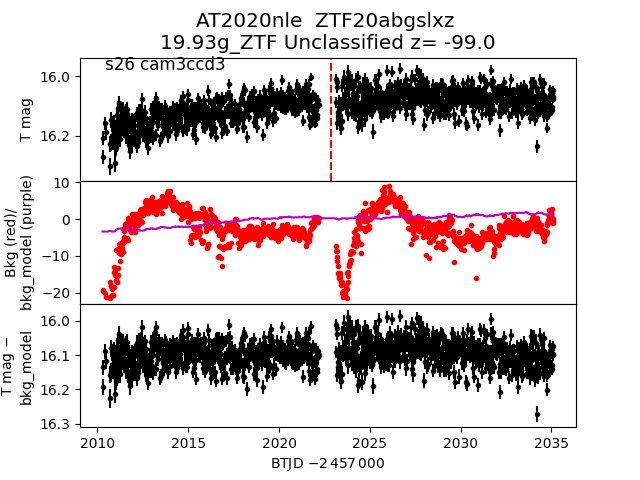
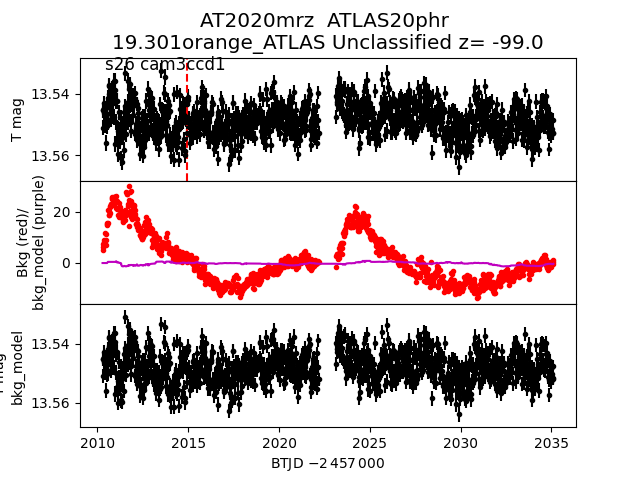
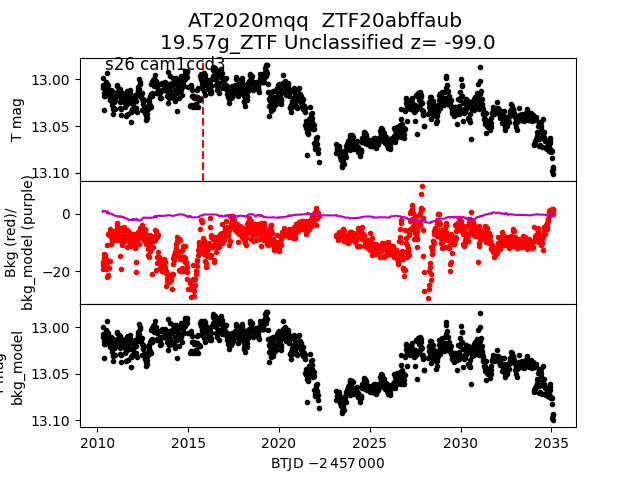
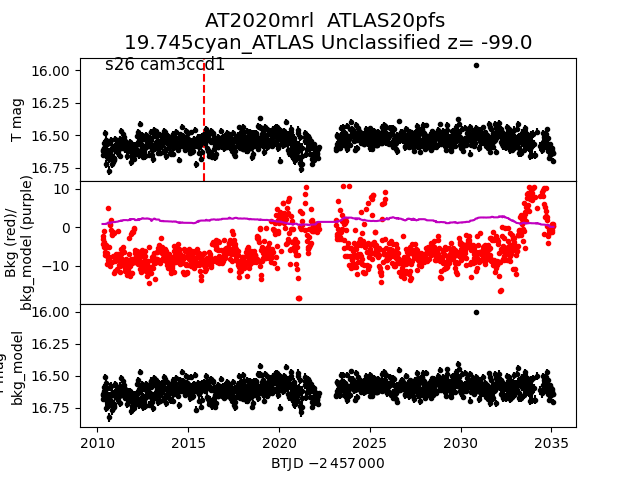
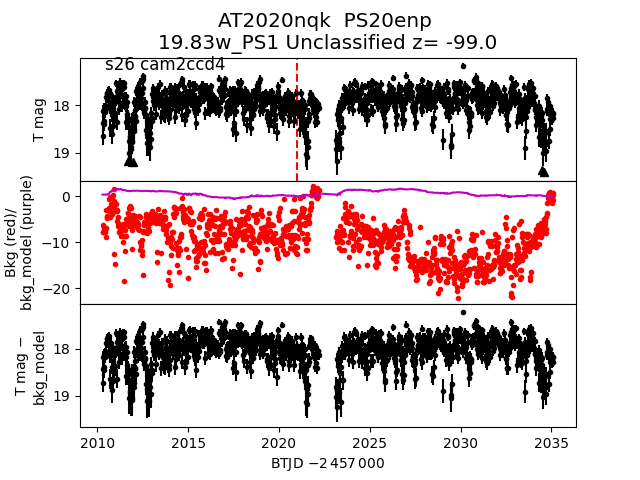
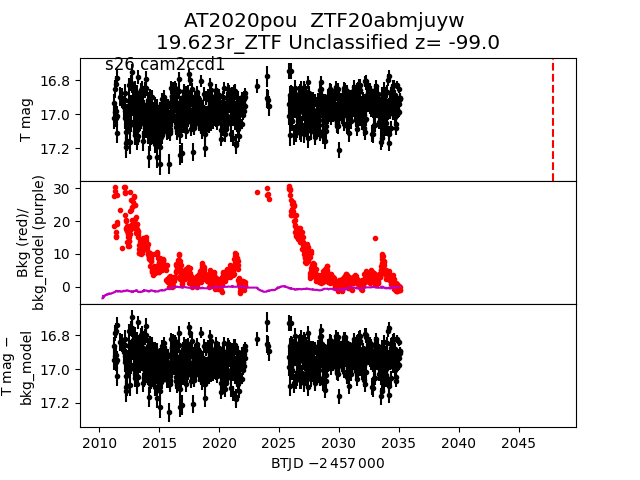
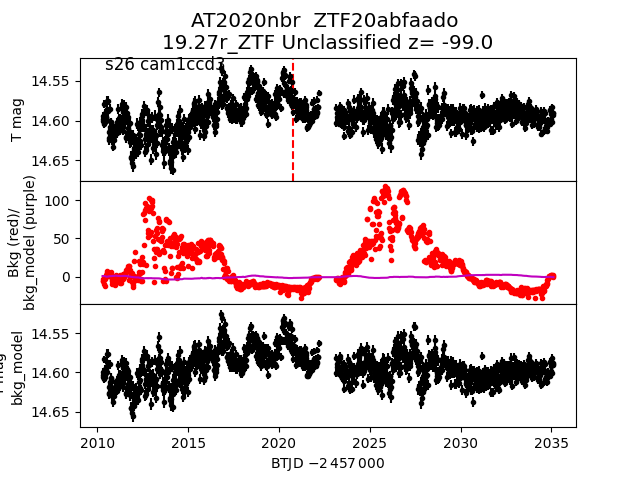
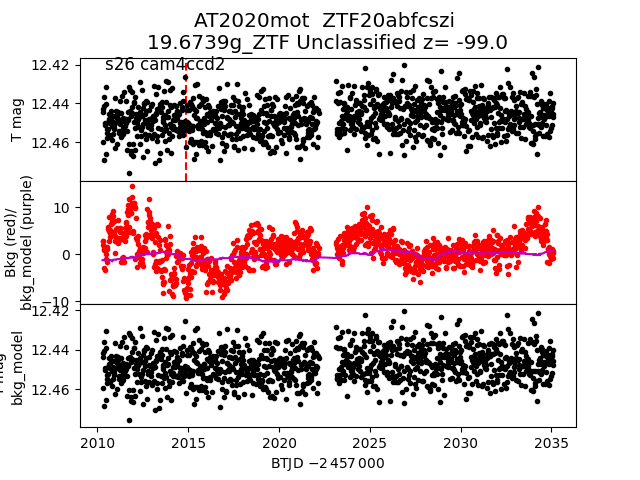
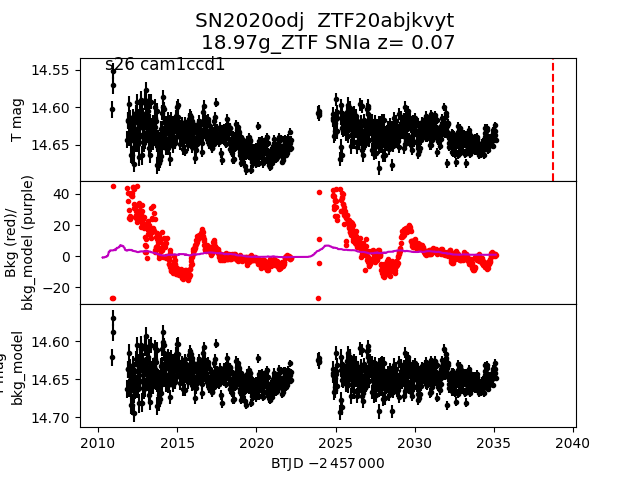
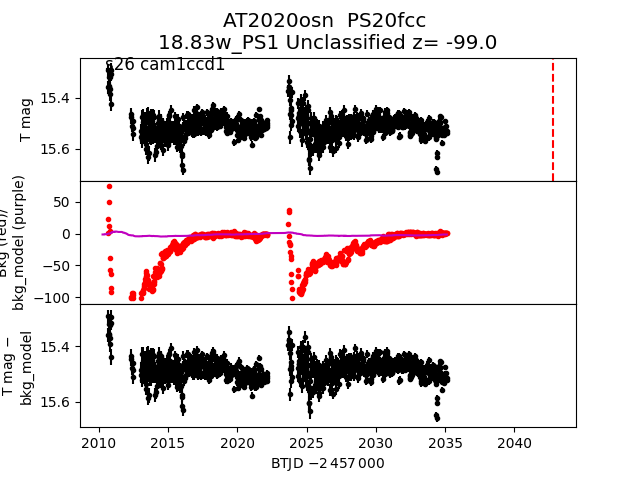
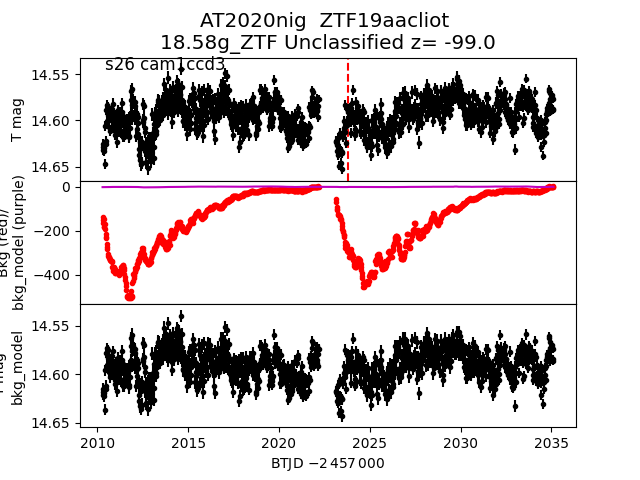
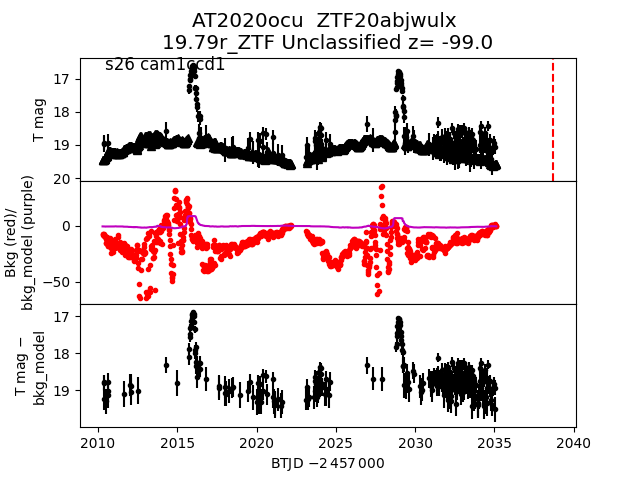
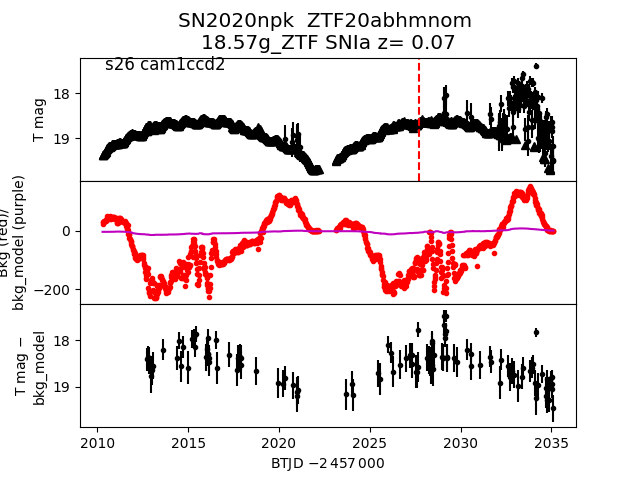
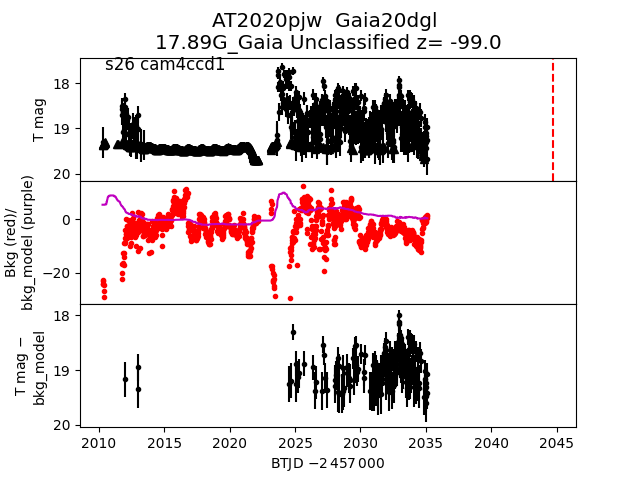
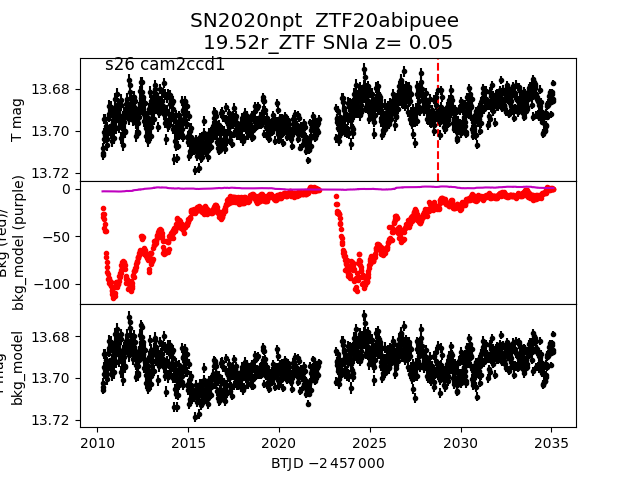
Each figure has three panels. The top panel shows the transient light curve, the middle panel shows the local background (estimated in an annulus), and the bottom panel shows a "background-model corrected" light curve. Details about the background model are in the README.
The vertical red line marks the time of discovery reported to TNS. Other useful metadata from TNS is in the figure title.
Note that the top and bottom panel are in magnitudes, while the middle panel is in differential flux units. The magnitudes are calibrated to the flux in the reference image used for image subtraction. Thus, flux from the host galaxy is included in these magnitudes.
3-sigma upper limits are plotted as triangles with no errorbars. A typical limiting magnitude is 19.6 in 30 minutes or 18.4 in 200 seconds (for low backgrounds).
The links allow you to download the light curve data as a text file.
More details in the README.
2020pha
 2020nni
 2020ogf
 2020nmt
 2020oxo
 2020nxh
 2020mfh
 2020oik
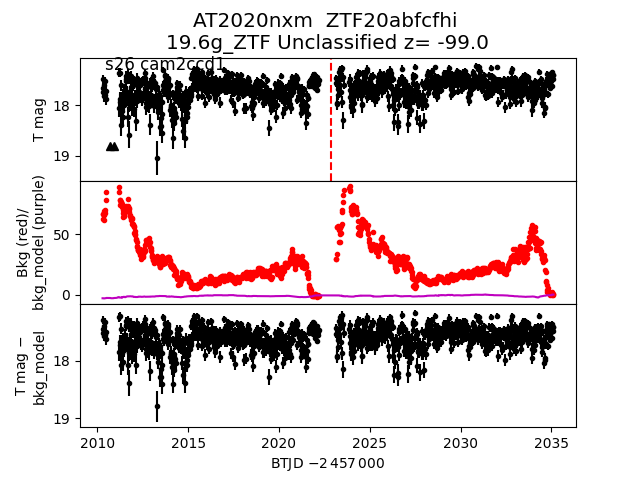
 2020nxm
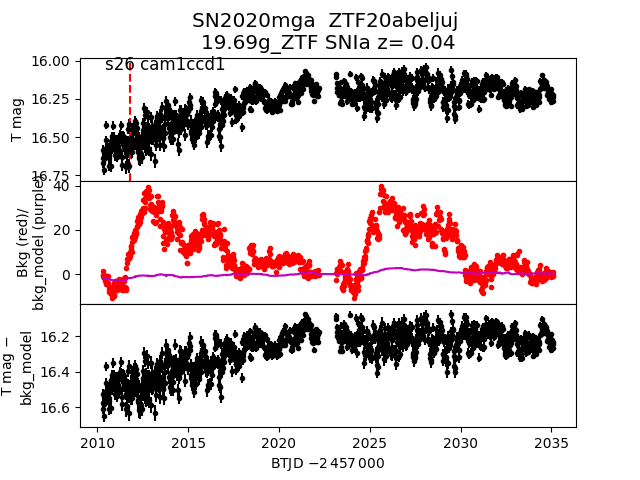
 2020mga
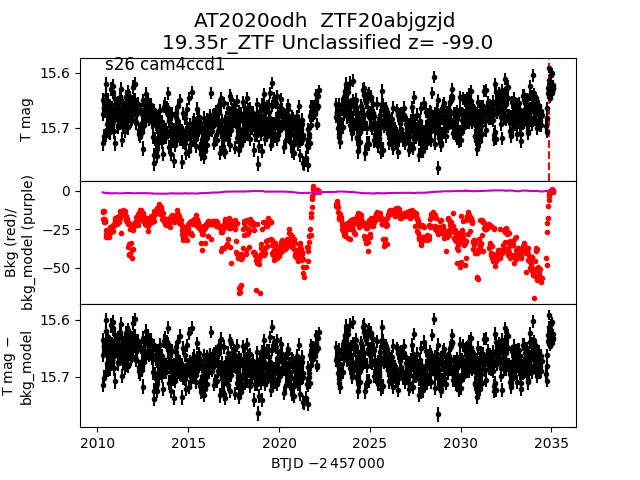
 2020odh
 2020ocw
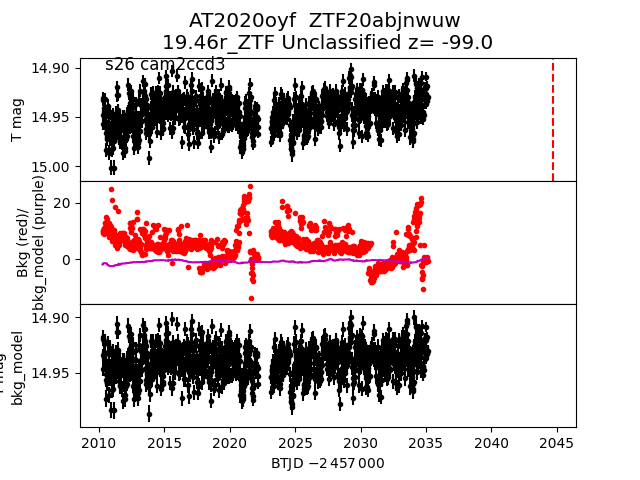
 2020oyf
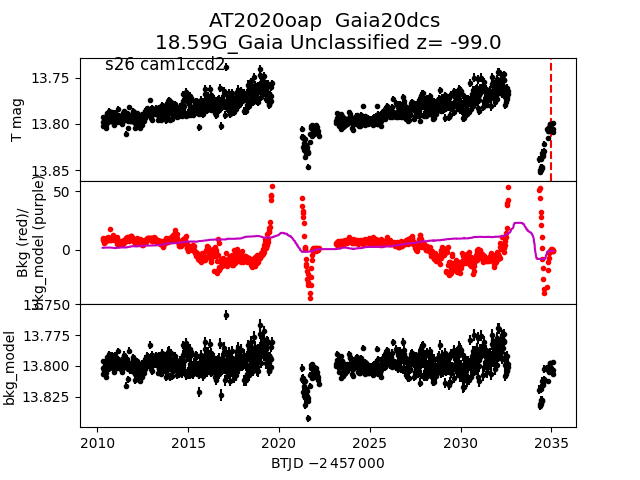
 2020oap
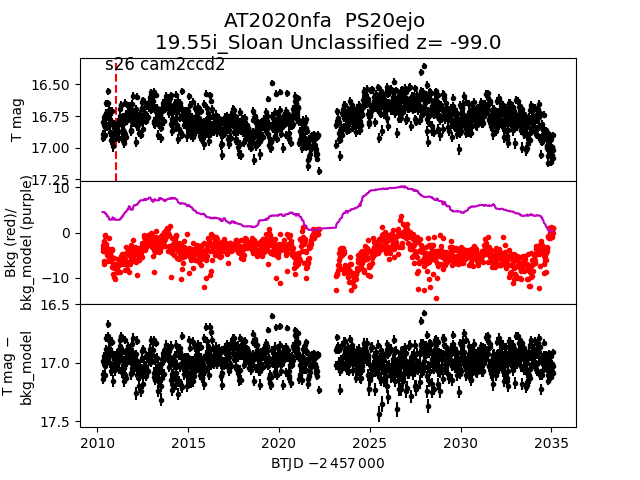
 2020nfa
 2020mez
 2020nxg
 2020mtr
 2020nhc
 2020nyb
 2020mgb
 2020oih
 2020nnc
 2020omp
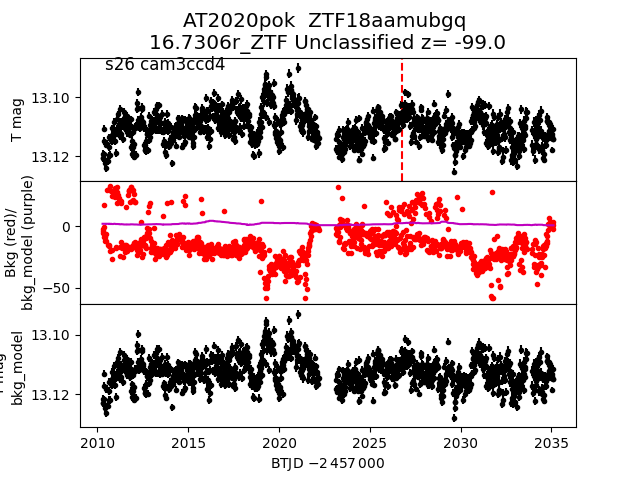
 2020pok
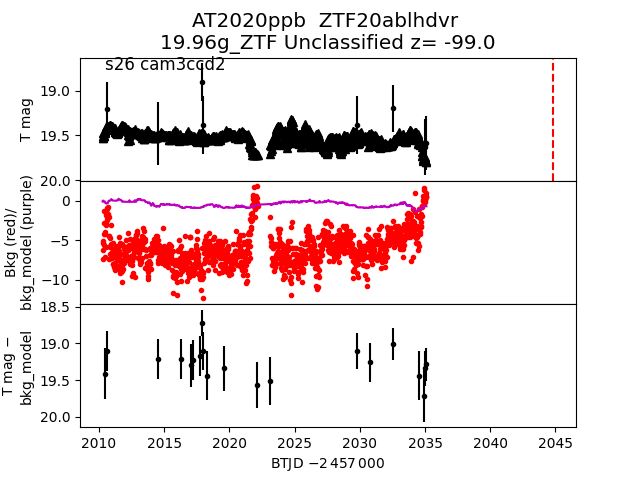
 2020ppb
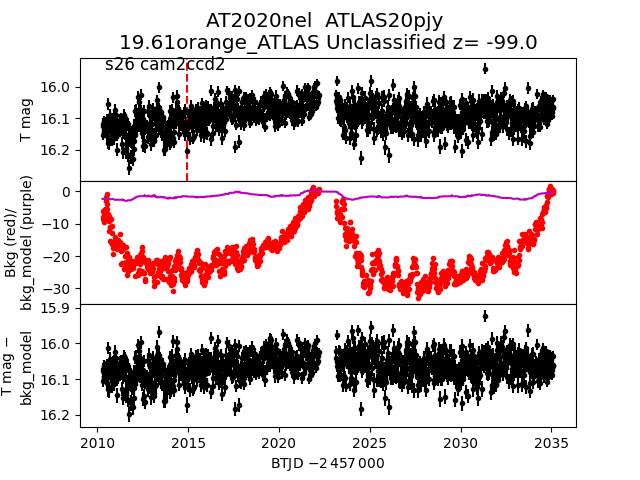
 2020nel
 2020msw
 2020odg
 2020nlc
 2020mfe
 2020nww
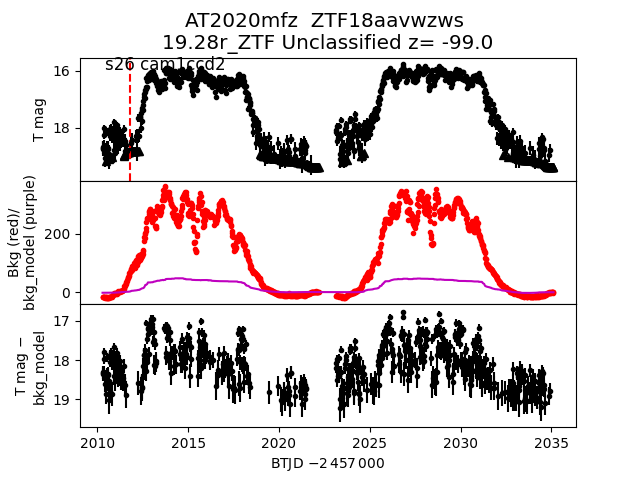
 2020mfz
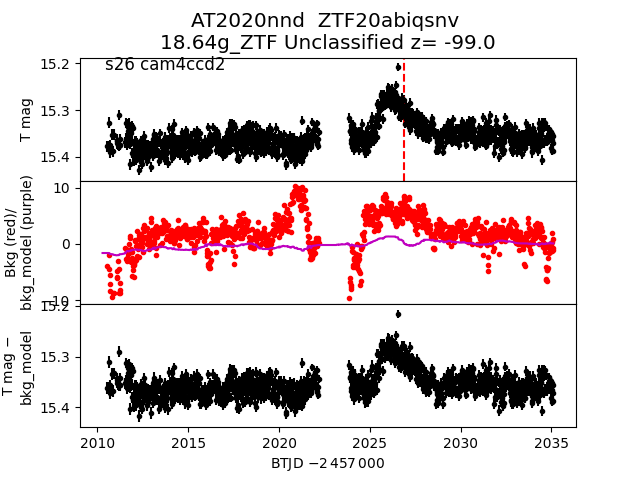
 2020nnd
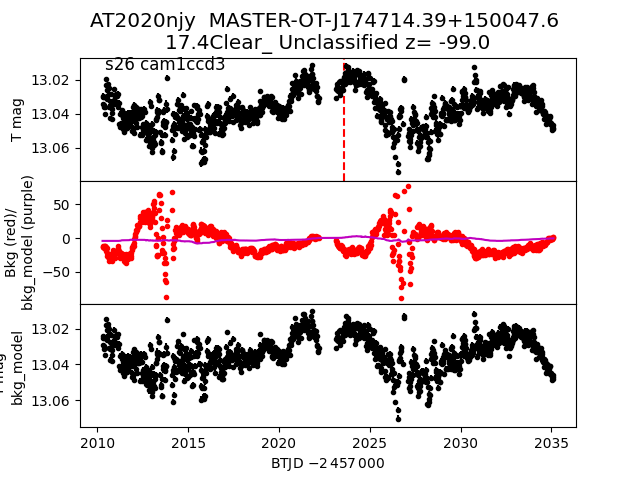
 2020njy
 2020ocv
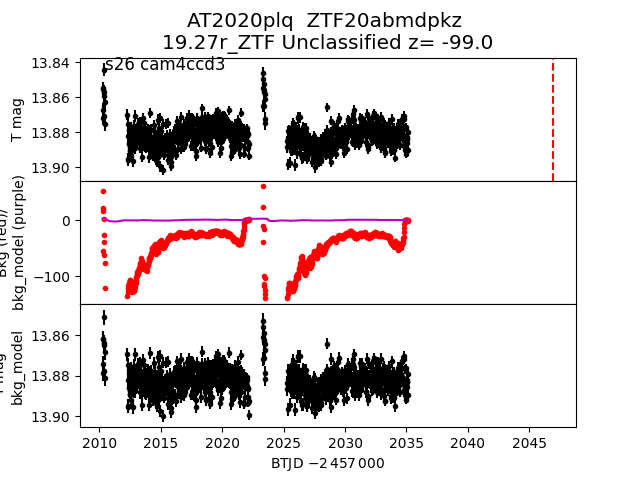
 2020plq
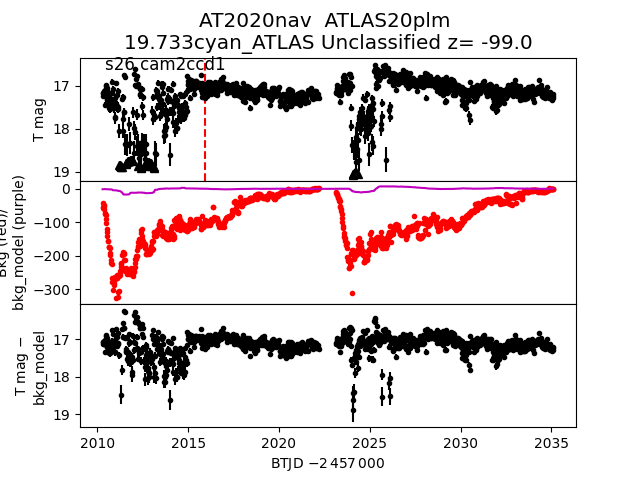
 2020nav
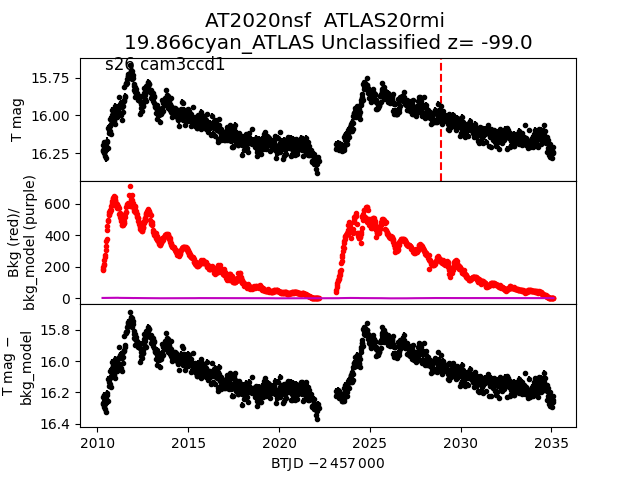
 2020nsf
 2020ooc
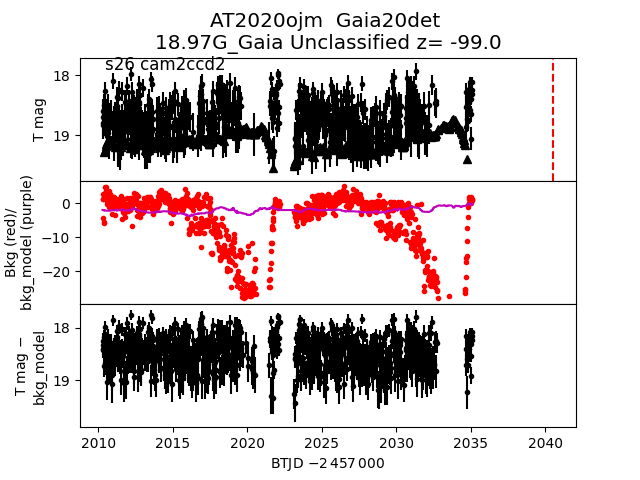
 2020ojm
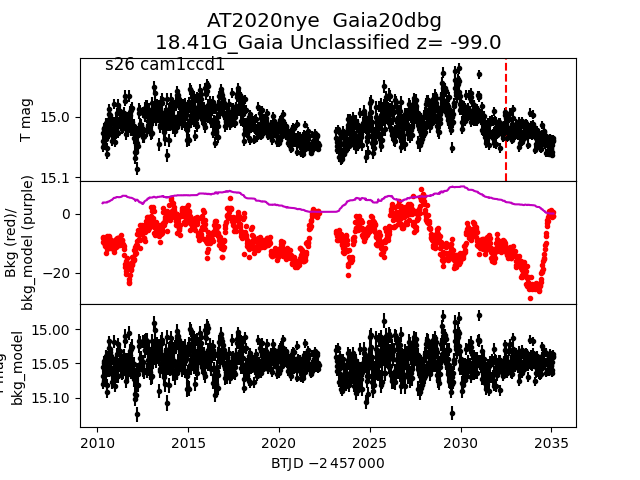
 2020nye
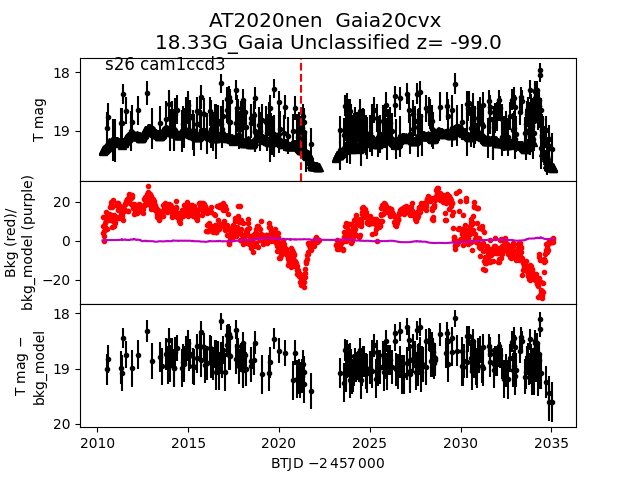
 2020nen
 2020nwd
 2020oyk
 2020nmu
 2020nkf
 2020osa
 2020msv
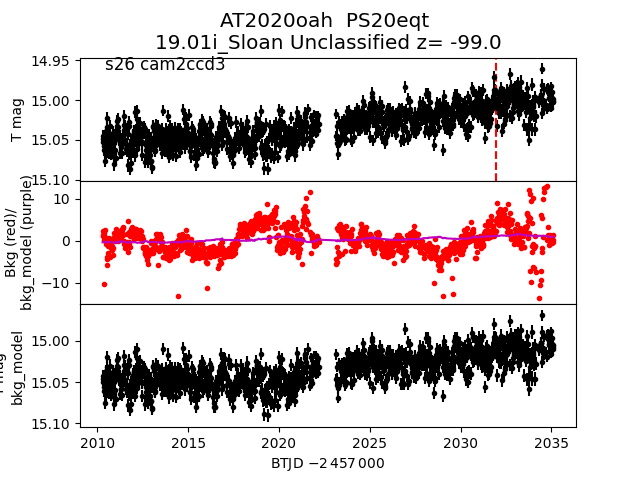
 2020oah
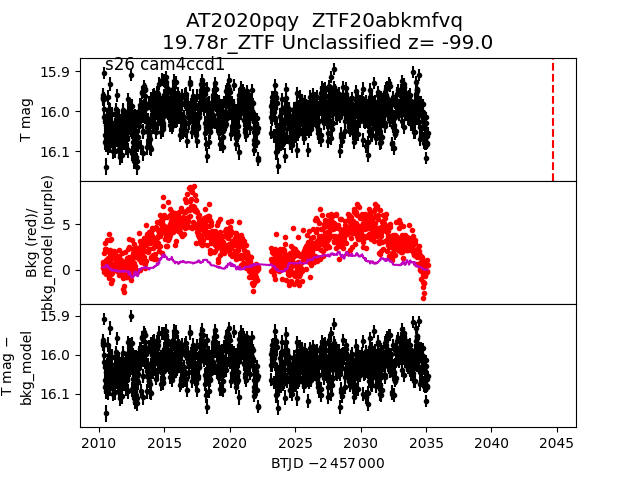
 2020pqy
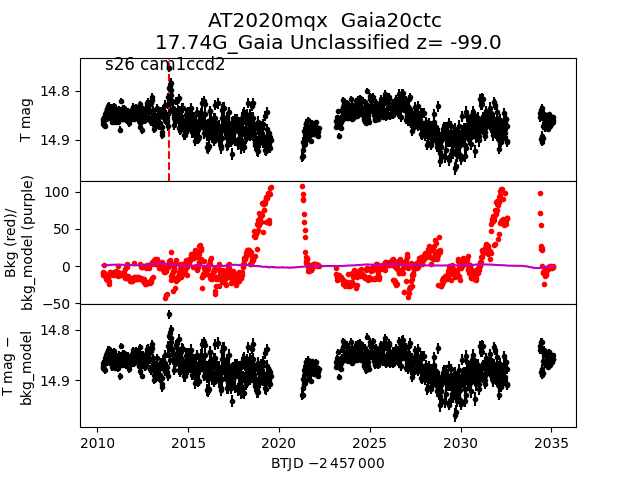
 2020mqx
 2020nle
 2020mrz
 2020mqq
 2020mrl
 2020nqk
 2020pou
 2020nbr
 2020mot
 2020odj
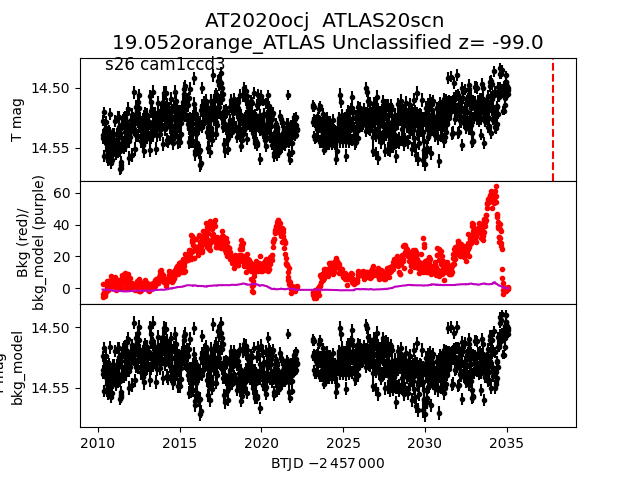
 2020ocj
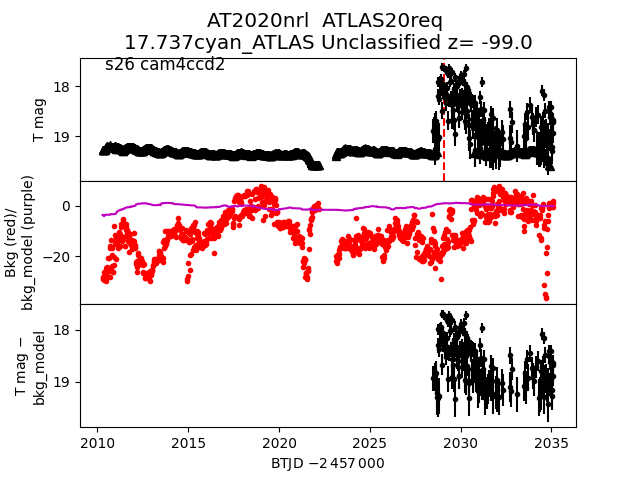
 2020nrl
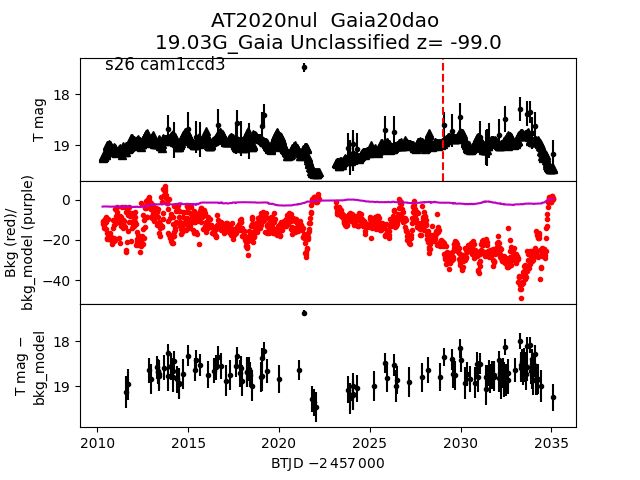
 2020nul
 2020osn
 2020nig
 2020ocu
 2020npk
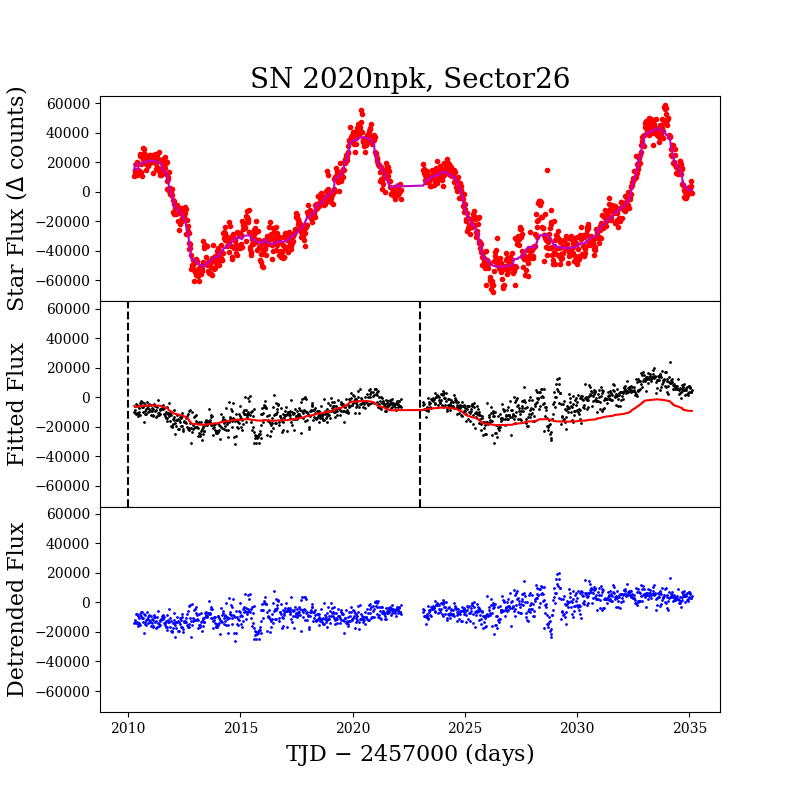 2020npk
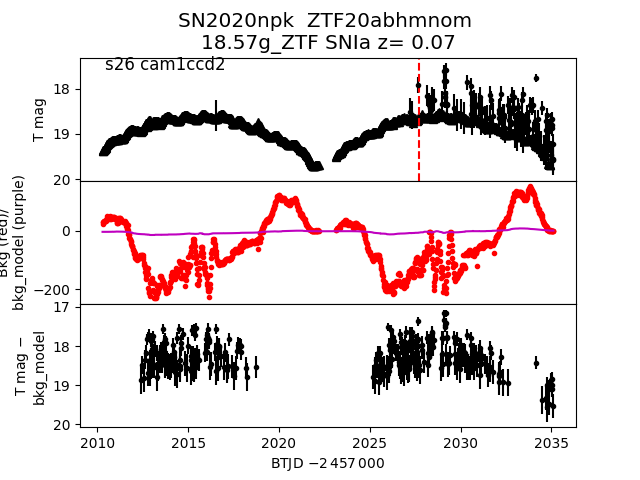
 2020npk_detrended
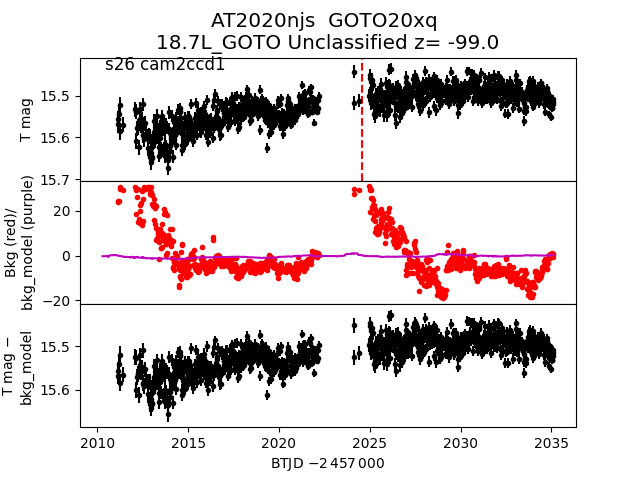
 2020njs
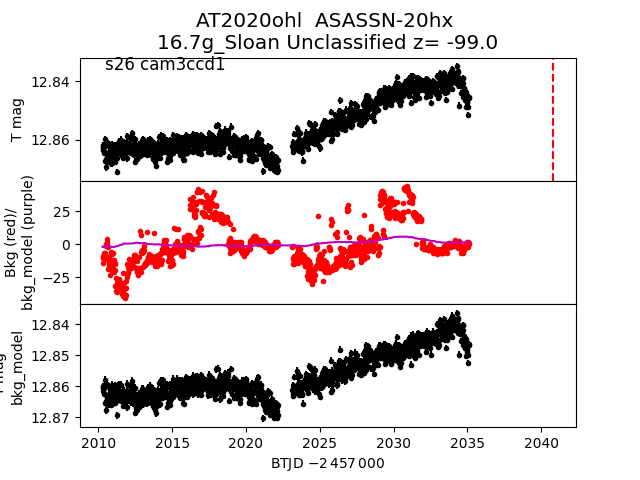
 2020ohl
 2020pjw
 2020npt
 2020oxh